5 liquid–liquid extraction applied to the processing of
TRANSCRIPT
219
5 Liquid–Liquid Extraction Applied to the Processing of Vegetable Oil
Eduardo A. C. Batista, Antonio J. A. Meirelles, Christianne E. C. Rodrigues, and Cintia B. Gonçalves
CONTENTS
5.1 Fundamentals of Liquid–Liquid Extraction................................................2205.1.1 Equipment ........................................................................................ 221
5.1.1.1 Equipment for Liquid–Liquid Extraction ........................... 2215.1.1.2 Equipment for Stagewise Contact ...................................... 2225.1.1.3 Equipment for Continuous Contact .................................... 2225.1.1.4 Centrifugal Extractors ........................................................223
5.1.2 Liquid–Liquid Equilibrium Diagram for Fatty System and Short-Chain Alcohol Systems ...................................................224
5.1.3 Mass Transfer: Mass Balance Equations .........................................2255.1.3.1 Lever-Arm Rule ..................................................................2255.1.3.2 Single-Stage Equilibrium Extraction .................................2275.1.3.3 Multistage Crosscurrent Extraction ...................................2285.1.3.4 Continuous Multistage Countercurrent Extractor .............. 232
5.1.4 Thermodynamic: Phase Equilibrium ...............................................2345.1.5 Group Contribution Models ............................................................. 236
5.1.5.1 UNIFAC Model .................................................................. 2375.1.5.2 ASOG Model ...................................................................... 2375.1.5.3 Minor Component .............................................................. 238
5.1.6 Simulation of a Liquid–Liquid Extraction Column ......................... 2395.2 State of the Art—Mini Review of Literature .............................................. 2415.3 Applications ................................................................................................ 247
5.3.1 Deacidifi cation of Vegetable Oils .................................................... 2475.3.1.1 Effect of Temperature......................................................... 2475.3.1.2 Length Chain of Alcohols .................................................. 2475.3.1.3 Addition of Water in the Solvent ........................................249
TAF-62379-08-0606-C005.indd 219TAF-62379-08-0606-C005.indd 219 8/5/08 7:57:07 PM8/5/08 7:57:07 PM
220 Extracting Bioactive Compounds for Food Products
5.3.2 Deacidifi cation of Vegetable Oils Retaining Bioactive Compounds ......................................................................................249
5.4 Nomenclature .............................................................................................. 2585.4 References ................................................................................................... 259
In this chapter, we will discuss the fundamentals of the liquid–liquid extraction process applied to deacidifi cation of vegetable oils with some special attention to the retention of bioactive compounds. Deacidifi cation is the removal of free fatty acids from vegetable oils, and it is the most diffi cult step in oil refi ning, mainly because of its impact on pro-ductivity. Deacidifi cation of oils is usually performed by chemical, physical, or miscella methods. Liquid–liquid extraction is a quite promising process for deacidifi cation of vegetable oils that minimizes the loss of neutral oil and retains bioactive compounds. In the fi rst part of this chapter, fundamentals of liquid–liquid extraction, the main con-cepts of the equipment for stagewise and continuous contact types, the liquid–liquid equilibrium diagram for fatty components and short-chain alcohol systems, distribution coeffi cients and selectivity of the solvent, mass transfer and some graphical methods for solving the equilibrium and mass balances, the most important thermodynamic models for description or prediction of liquid– liquid equilibrium, and the mathematical basis for simulating a stagewise column are presented and discussed. In the second part, a review of the literature in applying liquid–liquid extraction in the food and food-related processes are presented. In the last part of this chapter, we present our own results in the deacidifi cation of vegetable oils and the retention of bioactive compounds.
5.1 FUNDAMENTALS OF LIQUID–LIQUID EXTRACTION
Crude vegetable oils are a mixture of triacylglycerols, partial acylglycerols, free fatty acids, phosphatides, pigments, sterols, and tocopherols. Refi ning procedures have been developed over decades to make the vegetable oil suitable for edible use. Some of the minor components are valuable and should be retained in the refi ned oil or recovered from the stream generated in the refi ning processes.
Fatty acids are almost straight chain aliphatic carboxylic acids. The most natural fatty acids are C4 to C22, varying chain length and unsaturation. Systematic names for fatty acids are complicated for casual use. Two numbers separated by a colon rep-resent the number of carbons and number of double bounds. The position of double bounds could be indicated from carboxyl end of the chain, shown as ∆x, where x is the number of carbons from carboxyl end. The double-bound geometry cis and trans is represented by abbreviation c and t, respectively. Some fatty acids have common names that facilitate their identifi cation. Nomenclatures and formula for some fatty acids are presented in Table 5.1.
Triacylglycerols are triesters of glycerol (1,2,3-trihydroxypropane) with fatty acids. Most of triacylglycerols do not have a random distribution of fatty acids on the glycerol backbone. In vegetable oils, unsaturated fatty acids predominate at posi-tion 2 of the glycerol backbone. Simplifi ed structures and abbreviations are used to identify the fatty acids esterifi ed to glycerol; e.g. 1-stearoyl-2-oleoyl-3-stearoyl-sn-glycerol is abbreviated to SOS.
The removal of free fatty acids, deacidifi cation, is the most diffi cult step in oil refi ning, mainly because of its impact on the productivity. Deacidifi cation of oils is
AQ1AQ1
TAF-62379-08-0606-C005.indd 220TAF-62379-08-0606-C005.indd 220 8/5/08 7:57:08 PM8/5/08 7:57:08 PM

Liquid–Liquid Extraction Applied to the Processing of Vegetable Oil 221
performed by chemical, physical, and miscella methods. Most edible oils are pro-duced by chemical refi ning [1] because it is a highly versatile process applicable for all crude oil. However, for oils with high acidity, chemical refi ning causes high losses of neutral oil as a result of saponifi cation and emulsifi cation. For highly acidic oils, the physical method is also a feasible process for deacidifi cation that results in a lower loss of neutral oil than the chemical method, but more consumption of energy is required, and the refi ned oil is subject to undesirable alteration in color and to a reduction of stability with regard to resisting oxidation. The miscella method is the deacidifi cation of crude oil prior to solvent stripping. In this process, the neutraliza-tion reaction of free fatty acids with sodium hydroxide occurs in the miscella, which is a mixture of 40%–60% oil in hexane. Bhosle and Subramanian [2] present some new approaches that may be used as alternatives to current industrial deacidifi ca-tion, such as biological deacidifi cation, reesterifi cation, supercritical fl uid extraction, membrane technology, and liquid– liquid extraction.
Liquid–liquid extraction is an alternative processes carried out at room tem-perature and atmospheric pressure. According to Thomopoulos [3], this process is based on the difference in the solubility of free fatty acids and triacylglycerols in the solvent, as well as on the difference of boiling points of triacylglycerols, free fatty acids, and solvent during the subsequent separation.
Currently, cleaner processes have been developed because of environmental issues, and there is a demand for new products retaining minor compounds with bioactive properties. Liquid–liquid extraction is a quite promising process that mini-mizes the loss of neutral oil and retains bioactive compounds. The streams leaving the extract column, raffi nate and extract, will be separated by other unity operations and a nonpolluting stream is generated.
5.1.1 EQUIPMENT
5.1.1.1 Equipment for Liquid–Liquid Extraction
The rate of mass transfer between two liquid phases is described by N = KA∆c, where N is the mass transfer rate, K is the overall mass transfer coeffi cient, A is
AQ2AQ2
TABLE 5.1Nomenclatures and formulas for some fatty acidsFatty acid Common name Symbol Formula
8:0 Caprylic CH3(CH2)6COOH
10:0 Capric CH3(CH2)8COOH
12:0 Lauric La CH3(CH2)10COOH
14:0 Myristic M CH3(CH2)12COOH
16:0 Palmitic P CH3(CH2)14COOH
18:0 Stearic S CH3(CH2)16COOH
18:1, 9c Oleic O CH3(CH2)7CH�CH(CH2)7COOH
18:2, 9c12c Linoleic L CH3(CH2)4(CH�CHCH2)2(CH2)6COOH
18:3, 9c12c15c Linolenic Ln CH3CH2(CH�CHCH2)3(CH2)6COOH
22:1, 13c Erucic E CH3(CH2)7CH�CH(CH2)11COOH
TAF-62379-08-0606-C005.indd 221TAF-62379-08-0606-C005.indd 221 8/5/08 7:57:08 PM8/5/08 7:57:08 PM

222 Extracting Bioactive Compounds for Food Products
the interfacial area, ∆c the composition difference driving force. The rate may be increased by dispersing one of the liquids into smaller droplets, which are immersed into the other, with resulting large interfacial area. This favor eddy diffusion rather than molecular diffusion, which is slow.
Equipment for liquid–liquid extraction provides the direct contact of two immis-cible liquids that are not in equilibrium, which involves dispersing one liquid in the form of small droplets (the dispersed phase) into the other liquid (continuous phase) in attempting to bring the liquids to equilibrium and these resulting liquids are mechanically separated.
5.1.1.2 Equipment for Stagewise Contact
The typical and oldest extraction equipment is known as mixer-settler, in which each stage presents two well-defi ned and delimited regions: the fi rst, the mixer, involves dispersing one of the liquids to the other and the second, the settler, involves the mechanical separation. Such an operation may be carried out in batch or continuous fl ow. If batch, the same vessel will be used for both mixing and settling; if continu-ous, the mixer and settler usually are in different vessels. The mixing vessel uses some form of rotating impeller placed on its center, which provides an effective dispersion of phases. The simplest settler is a decanter, and a baffl e may be used to protect the vessel from the disturbance caused by the fl ow entering the dispersion. This basic unity of mixer-settler may be connected to form a cascade, for cross-fl ow or more usually countercurrent fl ow.
The perforated-plate (sieve-plate) column is similar to a tray distillation column. The plates contain downspouts in their free extremity, which allow the downward fl ow of the heavy liquid (continuous phase). Below each plate and outside the down-spout, the droplets of the light phase (dispersed one) coalesce and accumulate in a liquid layer. This layer of liquid fl ows through the holes of the plate and is dispersed in a large number of droplets within the continuous phase located above the plate.
5.1.1.3 Equipment for Continuous Contact
In this equipment, two immiscible liquids fl ow countercurrently in continuous contact as a result of the difference in density of the liquid streams without settling. The force of gravity acts to provide the fl ows, and the equipment is usually a vertical column, with the light liquid entering at the bottom and the heavy one at the top. The complete separation of phases occurs only in one extremity of the equipment, in the top, if the dispersed phase is the light liquid or in the bottom, if the heavy liquid is dispersed.
The simplest equipment for differential contact is the spray column, which consists basically of an empty shell with provision for introducing and removing the liquids.
If the light liquid is dispersed, the heavy liquid enters at the top through the distributor and fi lls the column, fl ows downward as a continuous phase, and leaves at the bottom. The light liquid enters at the bottom of the column by a distributor, which disperses it into small droplets. These droplets fl ow upward through the con-tinuous phase, coalesce, and form an interface at the top of the column, and the light liquid leaves the equipment. Although this column is easily constructed, its use is not recommended because of its low effi ciency in mass transfer as a result of absence of accessories that improve the dispersion or high axial mixture.
AQ3AQ3
TAF-62379-08-0606-C005.indd 222TAF-62379-08-0606-C005.indd 222 8/5/08 7:57:09 PM8/5/08 7:57:09 PM
Liquid–Liquid Extraction Applied to the Processing of Vegetable Oil 223
In packed columns, the shell of the column may be fi lled with a random or a structural packing arrangement. In the fi rst case, the packing is constituted of ele-ments one-eighth of the diameter of the column, which is made for a gas– liquid sys-tem such as Raschig, Lessing, and Paul rings, and Berl and Intalox saddles, disposed in random arrangement with intermediate support grids. The packing is made of ceramic, metal, or polymeric materials. Structured packing is formed from vertical corrugated thin sheets of ceramic, metal, or plastic with the angle of the corrugations reversed in adjacent sheets to form a very open honeycomb structure with inclined channels and a high surface area. To simplify installation, the packing is found in segments of diameter near to that of the diameter of the column. Liquid distribu-tion is crucial for a proper distribution of the liquids in the column. The material of packing must be chosen to ensure that the continuous phase will wet it preferentially and the droplets will not coalesce.
Extractors could also be mechanically agitated in a fashion somewhat similar to that of the mixer-settler. There is a great variety of mechanically agitated columns for continuous contact.
The fi rst example is the Rotating Disk Contactor column or simply RDC col-umn, which has a number of horizontal stator rings fi xed in the shell that divides the extractor into a number of chambers. A series of circular fl at disks is fi xed on a rotating central shaft and is centered in each chamber. In the literature, we could fi nd modifi cations of the original RDC column, such as the ones that use perforated disks (PRDC) or columns without stators.
The Khüni column has a rotating shaft with impellers that are fi xed in the center of a compartment delimited by two adjacent perforated plates. These plates help to control the volumetric fraction of the dispersed phase held inside the col-umn. In the York–Scheibel column, the agitation is similar to the Khüni column, but each compartment with impellers are separated from each other by packing sections.
Pulsed columns are a variation of agitated columns, where perforated plates move up and down or the liquids are pulsed in a stationary column by an outside mechanism. This type of agitation is compatible with other extractors, like packed or perforated-plate columns.
5.1.1.4 Centrifugal Extractors
The most important centrifugal extractor is the Podbielniak extractor, which has a horizontal shaft that rotates a cylindrical drum rapidly (30–85 rps). There are perfo-rated concentric plates inside the drum. The two liquids are fed into the equipment by the shaft, and the centrifugal force moves the light liquid to the center and the heavy to the wall of the drum countercurrently. Both phases leave the equipment through the shaft in the opposite sides of their feed. These extractors are important when short residence times are necessary and for liquids with a small density dif-ference. Continuous centrifuges can also be used connected to a settler to accelerate the separation of the phases.
More information about equipment for liquid–liquid extraction can be found in Treybal [4] and Godfrey and Slater [5].
AQ4AQ4AQ5AQ5
AQ6AQ6
TAF-62379-08-0606-C005.indd 223TAF-62379-08-0606-C005.indd 223 8/5/08 7:57:09 PM8/5/08 7:57:09 PM

224 Extracting Bioactive Compounds for Food Products
5.1.2 LIQUID–LIQUID EQUILIBRIUM DIAGRAM FOR FATTY SYSTEM AND SHORT-CHAIN ALCOHOL SYSTEMS
In the system of vegetable oil (1) + free fatty acids (2) + short-chain alcohol (3), only the pair (1) + (3) is partially soluble. The diagrams in a triangular coordinates are used at constant temperature and pressure. In a rectangular coordinate, abscissa and ordinate present the composition of the short-chain alcohol (component 3) and the free fatty acid (component 2), respectively.
Figure 5.1 presents an example of a liquid–liquid equilibrium diagram of this fatty system, of which the components 1(vegetable oil) and 3 (short-chain alcohols) are partially miscible.
The component 2, the free fatty acid, dissolves completely in vegetable oil (1) and short-chain alcohol (3), but 1 and 3 dissolve only to a limited extend, and they are represented in the diagram by the saturated liquid binary solutions at L (rich in oil, 1) and at K (rich in short-chain alcohols, 3). Any binary mixture between L and K will separate into two immiscible liquids with composition at L and K. The point L represents the solubility of the short-chain alcohol in the vegetable oil, and the point K, the solubility of the vegetable in the short-chain alcohols.
The LRPEK curve is the binodal curve and represents the change in solubility of the phase rich in the vegetable oil (oil phase) and the phase-rich short-chain alcohol (alcoholic phase). Outside this curve, any ternary mixture will be a solution of one phase. Underneath this curve, any ternary mixture, such as mixture M, will form two immiscible mixtures of equilibrium composition indicated at R (oil phase) and E (alcoholic phase). The line RE is a tie line and must pass necessarily through point M, which represents the overall composition.
0 10 20 30 40 50 60 70 80 90 1000
2
4
6
8
10
12
14
16
P
ER
M
KL
Fatty
Acid
(mas
s %)
Solvent (mass %)FIGURE 5.1 Liquid–liquid equilibrium diagram (K to L, base line; R to E, tie line; M, overall composition; P, plait point).
TAF-62379-08-0606-C005.indd 224TAF-62379-08-0606-C005.indd 224 8/5/08 7:57:09 PM8/5/08 7:57:09 PM

Liquid–Liquid Extraction Applied to the Processing of Vegetable Oil 225
The point P, known as the plait point, is the last tie line where the binodal curve converges and the composition of the oil and alcoholic phases are equal.
The distribution coeffi cient (ki) of component i is defi ned as the ratio of its com-position in phase II (alcoholic phase) to its composition in phase I (oil phase):
kww
iiII
iI= . (5.1)
In the example presented in Figure 5.1, the composition of free fatty acid (2) in phase II is larger than in phase I and hence the distribution coeffi cient will be larger than 1.
The capacity of short-chain alcohols (3) for separating the free fatty acid (2) from vegetable oil (1) is measured by the ratio of the distribution coeffi cient of the free fatty acid (2) to the distribution coeffi cient of the vegetable oil (1). This factor of separation is known as selectivity and represents the effectiveness of a short-chain alcohol in extracting the free fatty acid from the vegetable oil. Then the selectivity must exceed unity, and the greater values are the better, that is, the separation is easier:
βiji
j
kk
= . (5.2)
5.1.3 MASS TRANSFER: MASS BALANCE EQUATIONS
In this section, we present the mass balances for a extractor of the stagewise type. Each stage is a theoretical stage, such that the extract and raffi nate streams that are leaving are in equilibrium. In the next topic, we discuss the lever-arm rule for graphical addi-tion in rectangular coordinates that will be useful for understanding the solutions.
5.1.3.1 Lever-Arm Rule
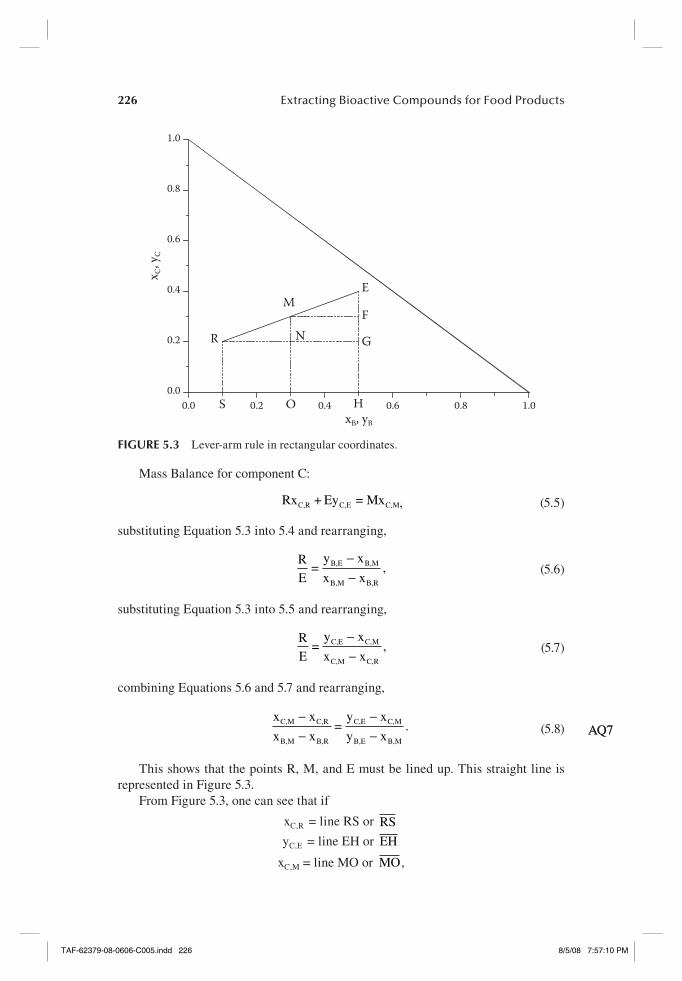
If a mixture with R kg is added to another E kg, both containing A, B, and C com-ponents, a new ternary mixture is generated with M kg. This mixing process is represented in Figure 5.2 and the lever-arm rule in Figure 5.3.
We can write the global mass and mass balance for components B and C as follows:Global mass balance:
R + E = M, (5.3)
Mass Balance for component B:
Rx + Ey = MxB,R B,E B,M, (5.4)
E
MyC,E
xC,M
R xC,R
FIGURE 5.2 Mixing process.
TAF-62379-08-0606-C005.indd 225TAF-62379-08-0606-C005.indd 225 8/5/08 7:57:10 PM8/5/08 7:57:10 PM
226 Extracting Bioactive Compounds for Food Products
Mass Balance for component C:
Rx + Ey = MxC,R C,E C,M ,, (5.5)
substituting Equation 5.3 into 5.4 and rearranging,
R
E=
y x
x xB,E B,M
B,M B,R
−−
, (5.6)
substituting Equation 5.3 into 5.5 and rearranging,
R
E=
y x
x xC,E C,M
C,M C,R
−−
, (5.7)
combining Equations 5.6 and 5.7 and rearranging,
x x
x x=
y x
y xC,M C,R
B,M B,R
C,E C,M
B,E B,M
−−
−−
. (5.8)
This shows that the points R, M, and E must be lined up. This straight line is represented in Figure 5.3.
From Figure 5.3, one can see that if
xC,R = line RS or RS
yC,E = line EH or EH
xC,M = line MO or MO,
AQ7AQ7
FIGURE 5.3 Lever-arm rule in rectangular coordinates.
0.0 0.2 0.4 0.6 0.8 1.00.0
0.2
0.4
0.6
0.8
1.0
F
H
G
E
O
N
M
S
R
x C, y
C
xB, yB
TAF-62379-08-0606-C005.indd 226TAF-62379-08-0606-C005.indd 226 8/5/08 7:57:10 PM8/5/08 7:57:10 PM

Liquid–Liquid Extraction Applied to the Processing of Vegetable Oil 227
then
R
E=
y x
x x=C,E C,M
C,M C,R
−−
EH FH
MO RS=
EF
MN,
−−
and by using a similar right angle triangles,
R
E =EF
MN=
ME
RM. (5.9)
5.1.3.2 Single-Stage Equilibrium Extraction
Consider the following example: 100 kg/h of vegetable oil with 10 % (mass) of fatty acid and 100 kg/h of pure ethanol enter in a single equilibrium stage. The process is shown in Figure 5.4. The streams are mixed, and the exit streams R1 and E1 leave in equilibrium:
Global mass balance:
F + S1 = E1 + R1 = M1 = 200 kg/h.
Apply lever-arm rule for overall composition:
FM
FS=
S
M=
100
200= 0.51
1
,
Mass balance for component C:
x =x F + y S
MC,MC,F C,S 1
11
1 ,
Mass balance for component B:
x =x F + y S
MC,MB,F B,S 1
11
1 ,
Mass fl ows of extract and raffi nate by lever-arm rule:
R M
E M=
E
R= 0.9 E = 0.9R1 1
1 1
1
11 1⇒
E = 94.74 kg / h
R = 105.26 kg / h1
1
.
F=100 kg/h
E1
R1
S1 =100 kg/h, yB=1
xCF = 0.10
FIGURE 5.4 Single-stage extraction.
TAF-62379-08-0606-C005.indd 227TAF-62379-08-0606-C005.indd 227 8/5/08 7:57:10 PM8/5/08 7:57:10 PM
228 Extracting Bioactive Compounds for Food Products
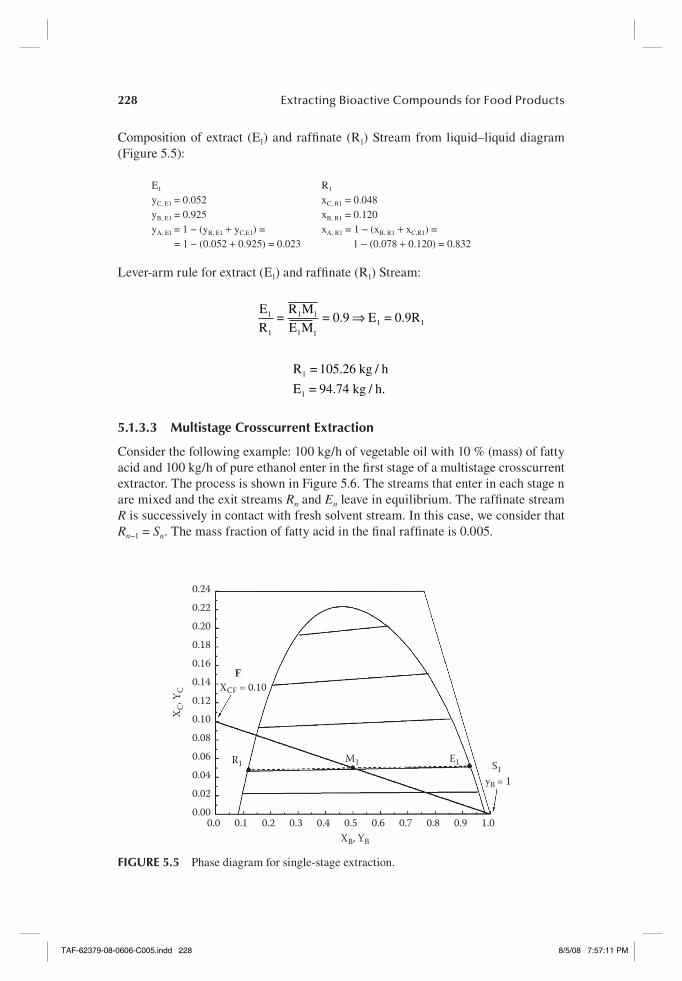
Composition of extract (E1) and raffi nate (R1) Stream from liquid–liquid diagram (Figure 5.5):
E1
yC, E1 = 0.052yB, E1 = 0.925yA, E1 = 1 − (yB, E1 + yC,E1) = = 1 − (0.052 + 0.925) = 0.023
R1
xC, R1 = 0.048xB, R1 = 0.120xA, R1 = 1 − (xB, R1 + xC,R1) = 1 − (0.078 + 0.120) = 0.832
Lever-arm rule for extract (E1) and raffi nate (R1) Stream:
E
R=
R M
E M= 0.9 E = 0.9R1
1
1 1
1 1
1 1⇒
R = 105.26 kg / h
E = 94.74 kg / h.1
1
5.1.3.3 Multistage Crosscurrent Extraction
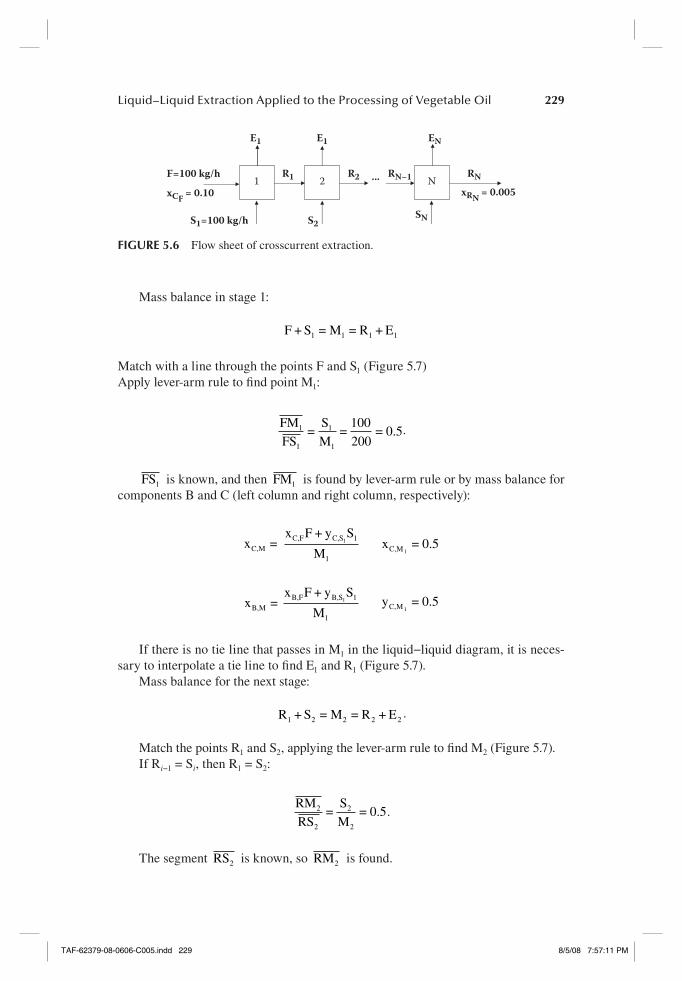
Consider the following example: 100 kg/h of vegetable oil with 10 % (mass) of fatty acid and 100 kg/h of pure ethanol enter in the fi rst stage of a multistage crosscurrent extractor. The process is shown in Figure 5.6. The streams that enter in each stage n are mixed and the exit streams Rn and En leave in equilibrium. The raffi nate stream R is successively in contact with fresh solvent stream. In this case, we consider that Rn−1 = Sn. The mass fraction of fatty acid in the fi nal raffi nate is 0.005.
0.240.220.200.180.16
XCF = 0.10
yB = 1
F0.140.120.10
R1 M1 E1 S1
X C, Y
C
0.080.060.040.020.00
0.0 0.1 0.2 0.3 0.4 0.5XB, YB
0.6 0.7 0.8 0.9 1.0
FIGURE 5.5 Phase diagram for single-stage extraction.
TAF-62379-08-0606-C005.indd 228TAF-62379-08-0606-C005.indd 228 8/5/08 7:57:11 PM8/5/08 7:57:11 PM
Liquid–Liquid Extraction Applied to the Processing of Vegetable Oil 229
Mass balance in stage 1:
F + S = M = R + E1 1 1 1
Match with a line through the points F and S1 (Figure 5.7)Apply lever-arm rule to fi nd point M1:
FM
FS=
S
M=
100
200= 0.51
1
1
1
.
FS1 is known, and then FM1 is found by lever-arm rule or by mass balance for components B and C (left column and right column, respectively):
x =x F + y S
MC,MC,F C,S 1
1
1 x = 0.5C,M1
x =x F + y S
MB,MB,F B,S 1
1
1
y = 0.5C,M1
If there is no tie line that passes in M1 in the liquid−liquid diagram, it is neces-sary to interpolate a tie line to fi nd E1 and R1 (Figure 5.7).
Mass balance for the next stage:
R + S = M = R + E1 2 2 2 2.
Match the points R1 and S2, applying the lever-arm rule to fi nd M2 (Figure 5.7).If Ri−1 = Si, then R1 = S2:
RM
RS=
S
M= 0.52
2
2
2
.
The segment RS2 is known, so RM2 is found.
F=100 kg/h R1 R2 RN–1xRN = 0.005
RN
S2SN
...1
S1=100 kg/h
N2
E1 E1 EN
xCF = 0.10
FIGURE 5.6 Flow sheet of crosscurrent extraction.
TAF-62379-08-0606-C005.indd 229TAF-62379-08-0606-C005.indd 229 8/5/08 7:57:11 PM8/5/08 7:57:11 PM

230 Extracting Bioactive Compounds for Food Products
A new tie line passing through M2 is traced, and the points E2 and R2 are found. This procedure must go on until xC,RN
≤ 0.005. In this example, the extractor has four stages (Figure 5.7).Stage 1:
S = 100 kg / h1
R + E = M = 200 kg / h1 1 1
E
R=
R M
E M= 0.9 E = 0.9R1
1
1 1
1 1
1 1⇒
R = 105.26 kg / h
E = 94.74 kg / h1
1
.
Stage 2:If Ri−1 = Si, then R1 = S2.
S = 105.26 kg / h2
R + S = M = R + E1 2 2 2 2
0.240.220.200.180.160.140.120.100.080.060.040.02
XCR 0.000.0 0.1 0.2 0.3 0.4 0.5
XB, YB 0.6 0.7 0.8 0.9 1.0
X C, Y
C
XCF = 0.10F
R1M1 E1
E2E3 E4
M2M3M4
R2R3R4 YB = 1
S
FIGURE 5.7 Phase diagram for crosscurrent extraction.
TAF-62379-08-0606-C005.indd 230TAF-62379-08-0606-C005.indd 230 8/5/08 7:57:11 PM8/5/08 7:57:11 PM
Liquid–Liquid Extraction Applied to the Processing of Vegetable Oil 231
R + E = 210.52 kg / h2 2
E
R=
R M
E M= 1.16 E = 1.16R2
2
2 2
2 2
2 2⇒
R = 97.46 kg / h
E = 113.06 kg / h2
2
.
Stage 3:If Ri−1 = Si, then R2 = S3.
S = 97.46 kg / h3
R + S = M = R + E2 3 3 3 3
R + E = 194.92 kg / h3 3
E
R=
R M
E M= 1.10 E = 1.10R3
3
3 3
3 3
3 3⇒
R = 92.82 kg / h
E = 102.10 kg / h3
3
.
Stage 4:1If Ri−1 = Si, then R3 = S4.
S = 92.82 kg / h4
R + S = M = R + E3 4 4 4 4
R + E = 185.64 kg / h4 4
E
R=
R M
E M= 1.07 E = 1.07R4
4
4 4
4 43
3 3⇒
R = 89.68 kg / h
E = 95.96 kg / h3
3.
The total mass fl ow of extract:
E = E + E + E + E = 405.86 kg / h1 2 3 4 .
TAF-62379-08-0606-C005.indd 231TAF-62379-08-0606-C005.indd 231 8/5/08 7:57:12 PM8/5/08 7:57:12 PM
232 Extracting Bioactive Compounds for Food Products
From the liquid–liquid diagram:
y = 0.052
y = 0.025
y = 0.012
y = 0.00
C,E
C,E
C,E
C,E
1
2
3
455
and
y =E y
E= 0.023C,E
i C,Ei=1
4
i∑.
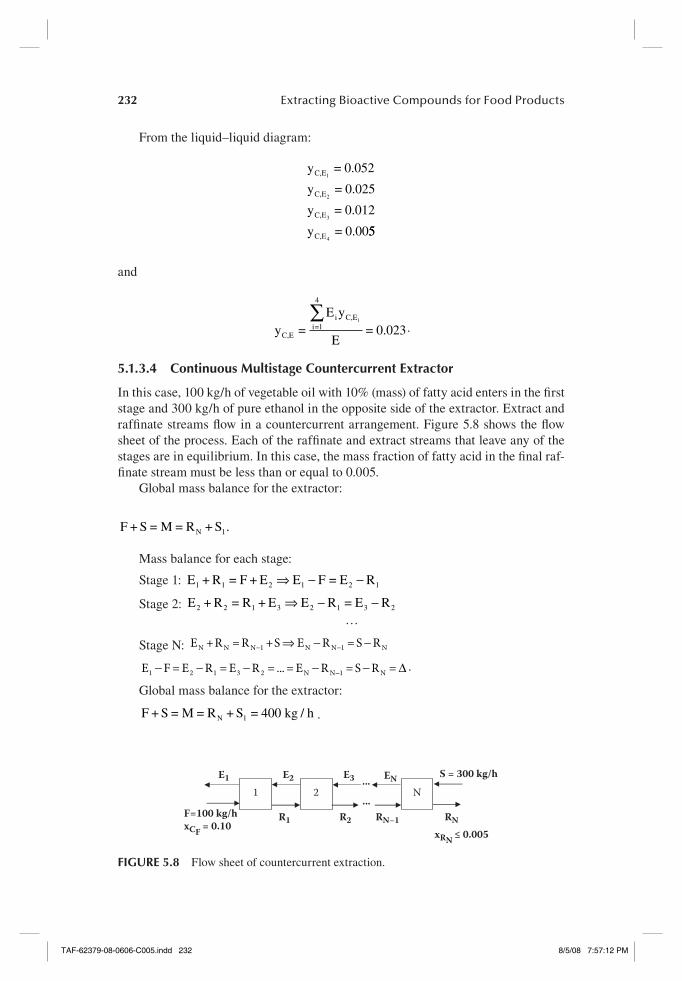
5.1.3.4 Continuous Multistage Countercurrent Extractor
In this case, 100 kg/h of vegetable oil with 10% (mass) of fatty acid enters in the fi rst stage and 300 kg/h of pure ethanol in the opposite side of the extractor. Extract and raffi nate streams fl ow in a countercurrent arrangement. Figure 5.8 shows the fl ow sheet of the process. Each of the raffi nate and extract streams that leave any of the stages are in equilibrium. In this case, the mass fraction of fatty acid in the fi nal raf-fi nate stream must be less than or equal to 0.005.
Global mass balance for the extractor:
F + S = M = R + SN 1.
Mass balance for each stage:
Stage 1: E + R = F + E E F = E R1 1 2 1 2 1⇒ − −
Stage 2: E + R = R + E E R = E R2 2 1 3 2 1 3 2⇒ − −…
Stage N: E +R = R +S E R = S RN N N 1 N N 1 N− −⇒ − −
E F = E R = E R = ... = E R = S R =1 2 1 3 2 N N 1 N− − − − − ∆− .
Global mass balance for the extractor:
F + S = M = R + S = 400 kg / hN 1 .
1
F=100 kg/hxCF = 0.10
E1 E2 E3 EN S = 300 kg/h
R1 R2 RNRN–1
2 N......
xRN ≤ 0.005
FIGURE 5.8 Flow sheet of countercurrent extraction.
TAF-62379-08-0606-C005.indd 232TAF-62379-08-0606-C005.indd 232 8/5/08 7:57:12 PM8/5/08 7:57:12 PM

Liquid–Liquid Extraction Applied to the Processing of Vegetable Oil 233
Match the points F and S and applying the lever-arm rule (Figure 5.9):
FM
FS=
S
M=
300
400=
3
4.
And from mass balance:
x =x F + y S
MC,MC,F C,S x = 0.025C,M
x =x F + y S
MB,MB,F B,S x = 0.750.B,M
Match the point RN to M and fi nd point E1 in the binodal curve. The points RN
and E1 are lined up by mass balance.To fi nd the point ∆, trace the lines FE1 and R SN
, the interception of the two lines is the point ∆.
By mass balance the points F, E1, and ∆ and the points RN, S, and ∆ are lined up:
E F = S R =1 N− − �
Match the point R1 to ∆ and fi nd the point E2 in the binodal curve:
E R =2 1− �.
0.24
0.22
0.20
0.18
0.16
0.14
0.12
XCR
0.10X C, Y
C
0.08
0.06
0.04
0.02
0.000.0 0.1 0.2 0.3 0.4 0.5
XB, YB 0.6 0.7 0.8 0.9 1.0
XCF = 0.10F
R1E1
E2 E3
S ∆
R2
R3
M
FIGURE 5.9 Phase diagram for countercurrent extraction.
TAF-62379-08-0606-C005.indd 233TAF-62379-08-0606-C005.indd 233 8/5/08 7:57:12 PM8/5/08 7:57:12 PM
234 Extracting Bioactive Compounds for Food Products
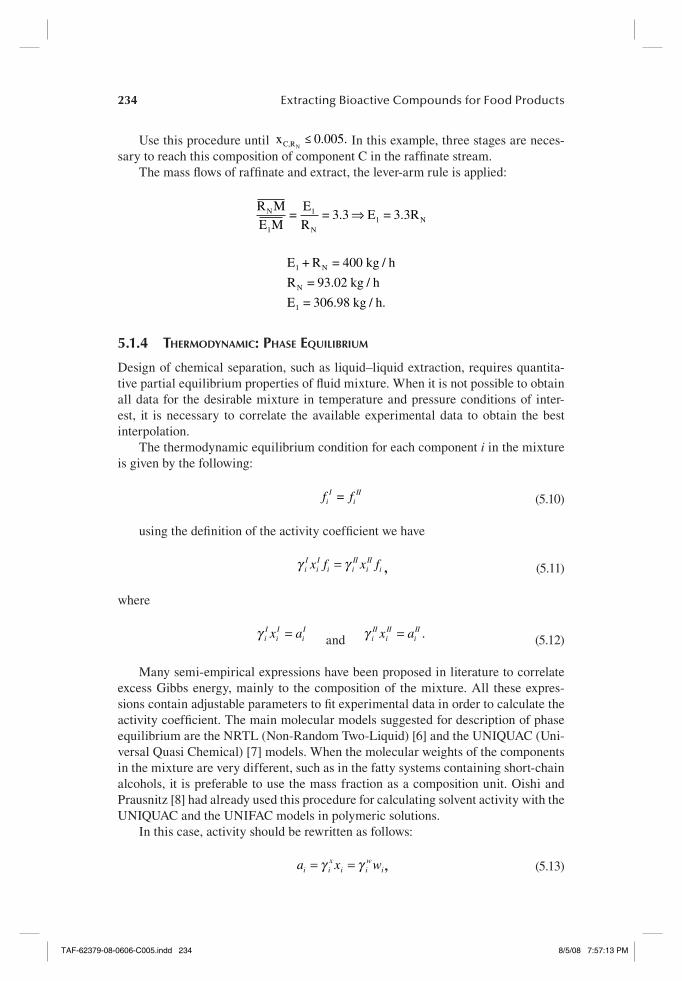
Use this procedure until x ≤ 0.005.C,RN In this example, three stages are neces-
sary to reach this composition of component C in the raffi nate stream.The mass fl ows of raffi nate and extract, the lever-arm rule is applied:
R M
E M=
E
R= 3.3 E = 3.3RN
1
1
N1 N⇒
E + R = 400 kg / h
R = 93.02 kg / h
E = 306.98 kg / h.
1 N
N
1
5.1.4 THERMODYNAMIC: PHASE EQUILIBRIUM
Design of chemical separation, such as liquid–liquid extraction, requires quantita-tive partial equilibrium properties of fl uid mixture. When it is not possible to obtain all data for the desirable mixture in temperature and pressure conditions of inter-est, it is necessary to correlate the available experimental data to obtain the best interpolation.
The thermodynamic equilibrium condition for each component i in the mixture is given by the following:
f = fiI
iII
(5.10)
using the defi nition of the activity coeffi cient we have
γ γiI
iI
i iII
iII
ix f x f= , (5.11)
where
γ iI
iI
iIx a= and γ i
IIiII
iIIx a= . (5.12)
Many semi-empirical expressions have been proposed in literature to correlate excess Gibbs energy, mainly to the composition of the mixture. All these expres-sions contain adjustable parameters to fi t experimental data in order to calculate the activity coeffi cient. The main molecular models suggested for description of phase equilibrium are the NRTL (Non-Random Two-Liquid) [6] and the UNIQUAC (Uni-versal Quasi Chemical) [7] models. When the molecular weights of the components in the mixture are very different, such as in the fatty systems containing short-chain alcohols, it is preferable to use the mass fraction as a composition unit. Oishi and Prausnitz [8] had already used this procedure for calculating solvent activity with the UNIQUAC and the UNIFAC models in polymeric solutions.
In this case, activity should be rewritten as follows:
a x wi ix
i iw
i= =γ γ , (5.13)
TAF-62379-08-0606-C005.indd 234TAF-62379-08-0606-C005.indd 234 8/5/08 7:57:13 PM8/5/08 7:57:13 PM

Liquid–Liquid Extraction Applied to the Processing of Vegetable Oil 235
where
γ γix
iw
i j jj
n
M w M= ∑ . (5.14)
In the NRTL model, the activity coeffi cient using composition expressed in mass fraction takes the following form:
lnγ
τ
i
ji ji j
jj
C
ji j
jj
Cj ij
jkj k
k
G w
MG w
M
w G
MG w
M
= +∑
∑kk
n ij
kj kj k
kk
C
kj k
kk
C
G w
MG w
M∑
∑
∑−
⎛
⎝
⎜⎜⎜⎜
⎞
⎠
⎟⎟⎟⎟
τ
τ⎡⎡
⎣
⎢⎢⎢⎢
⎤
⎦
⎥⎥⎥⎥
=∑j
C
1
, (5.15)
where
Gij ij ij= −( )exp α τ (5.16)
τ ij ijA T=
(5.17)
αij = αji. (5.18)
For the UNIQUAC model, it has the following form:
lnγ γ γi iC
iR= +ln ln (5.19)
lnγ φζ
ζ φiC i
i i
i i
ii iw M
M
w
zM q=
⎛⎝⎜
⎞⎠⎟
+ − +ln ln′ ′
′12
θθφ
φθ
i
ii i
i
i
zM q
′
′′
′
′− −⎛⎝⎜
⎞⎠⎟2
1 , (5.20)
where
ζ = ∑w
Mj
jj
C
(5.21)
θ φii i
j jj
C ii i
j jj
C
q w
q w
r w
r w
′′
′
′′
′= =
∑ ∑; (5.22)
and
rM
R qM
Qii
ki
k ii
ki
k
G
kk
G′ ′= = ∑∑1 1ν ν( ) ( ); (5.23)
TAF-62379-08-0606-C005.indd 235TAF-62379-08-0606-C005.indd 235 8/5/08 7:57:13 PM8/5/08 7:57:13 PM
236 Extracting Bioactive Compounds for Food Products
lnγ θ τ θ τ θ τiR
i i j jij
C
i ij k kjM q= −⎛⎝⎜
⎞⎠⎟
−∑′ ′ ′ ′1 lnkk
C
j∑∑⎛
⎝⎜⎞⎠⎟
⎡
⎣⎢⎢
⎤
⎦⎥⎥
. (5.24)
The adjustable parameters τ ij and τ ji are defi ned as follows:
τ ijij jj iju u
RT
A
T= −
−⎛⎝⎜
⎞⎠⎟
⎡
⎣⎢
⎤
⎦⎥ = − ⎛
⎝⎜⎞⎠
exp exp ⎟⎟⎡
⎣⎢
⎤
⎦⎥ (5.25)
τ ji
ji ii jiu u
RT
A
T= −
−⎛⎝⎜
⎞⎠⎟
⎡
⎣⎢
⎤
⎦⎥ = − ⎛
⎝⎜⎞⎠
exp exp ⎟⎟⎡
⎣⎢
⎤
⎦⎥ .
(5.26)
Due to the similarity of the triacylglycerols, the vegetable oil can be represented by a single triacylglycerol having the average molecular weight of all triacylglycerols of the oil. The same reasoning can be extended to a mixture of fatty acids. Then the values of ri′ and qi′ for the UNIQUAC model can be calculated by Equation 5.23, which considers the composition of triacylglycerols and fatty acids of any vegetable oil and any mixture of fatty acids, respectively. The parameters Rk and Qk can be taken from Magnussen et al. [9]:
rM
x R qM
x Qii
jj
C
ki
k ii
jj
C
ki
k
G
k′ ′= =∑ ∑ ∑1 1ν ν( ) ( ); ,
kk
G
∑ (5.27)
where xj is the molar fraction of the triacylglycerols of the vegetable oil or fatty acids of a mixture of fatty acids and Mi
is the average molecular weight of the vegetable oil or a mixture of fatty acids.
There are many adjusted parameters of the NRTL and the UNIQUAC models that describe the liquid–liquid equilibrium of these fatty systems in the literature [10–19].
5.1.5 GROUP CONTRIBUTION MODELS
In a group contribution method, the basic idea is that the number of functional group is much smaller than the chemical compounds of interest in chemical technology. If the physical properties can be calculated by summing group contribution, it is possi-ble to obtain a large number of these properties in terms of a much smaller number of parameters that characterize the contribution of functional groups in the mixture.
For calculating phase equilibrium in the simulation of deacidifi cation of veg-etable oils through liquid–liquid extraction, the group contribution models, the UNI-FAC [20] and the ASOG [21], are more appropriate, because they avoid to expand the pseudo-ternary systems vegetable oil + fatty acids + short-chain alcohols in a multicomponent system with a small number of structural groups, and consequently, a small number of binary interaction parameters is required.
Both the UNIFAC and the ASOG models assume the following forms when compositions are expressed in mass fractions.
TAF-62379-08-0606-C005.indd 236TAF-62379-08-0606-C005.indd 236 8/5/08 7:57:14 PM8/5/08 7:57:14 PM
Liquid–Liquid Extraction Applied to the Processing of Vegetable Oil 237
5.1.5.1 UNIFAC Model
ln ln ln .γ γ γi iC
iR= + (5.28)
In this model, the combinatorial part is taken directly from the UNIQUAC model. The residual part is as follows:
ln ln ln( ) ( )γ νiR
ki
k ki
k
C
= −⎡⎣ ⎤⎦∑ Γ Γ , (5.29)
where Γ ki( ) is the group activity coeffi cient of the group k in the reference solution
containing only molecules of the same type i:
rM
R qM
Qii
ki
k ii
ki
k
G
kk
G′ ′= = ∑∑1 1ν ν( ) ( ); (5.30)
θ φii i
j jj
C ii i
j jj
C
q w
q w
r w
r w
′′
′
′′
′= =
∑ ∑; (5.31)
ln lnΓ Θ Ψ Θ Ψ Θ Ψk k k m mkm
G
m km n nmn
M Q= − ⎛⎝⎜
⎞⎠⎟
−∑′ ′ ′ ′1GG
m
G
∑∑⎛⎝⎜
⎞⎠⎟
⎡
⎣⎢
⎤
⎦⎥ (5.32)
Θmm m
n nn
G m
mj
j
C
j
nj
jn
G
j
C
Q W
Q WW
w
w= =
∑
∑
∑∑
′
′;
( )
( )
ν
ν
(5.33)
Ψmnmn nn
mn
U U
RTa T= −
−⎛⎝
⎞⎠
⎡⎣⎢
⎤⎦⎥
= −( )⎡⎣ ⎤⎦exp exp . (5.34)
5.1.5.2 ASOG Model
ln ln lnγ γ γi iFH
iG= + (5.35)
ln lnγ ζν
ν
ζνiFH i
FH
j
jjFH
j
Ci
w
M
=
⎛
⎝
⎜⎜⎜⎜
⎞
⎠
⎟⎟⎟⎟
+ −∑
1FFH
j
jjFH
j
C w
Mν∑
, (5.36)
TAF-62379-08-0606-C005.indd 237TAF-62379-08-0606-C005.indd 237 8/5/08 7:57:14 PM8/5/08 7:57:14 PM

238 Extracting Bioactive Compounds for Food Products
where
ζ = ∑w
Mj
jj
C
(5.37)
ln ln ln ( )γ νiG
kik
G
k ki= −( )∑ Γ Γ (5.38)
ln ln , , ,Γ k ll
G
k l l l k mm
G
l ml
G
W a W a W a= − + − ⎛⎝⎜
⎞⎠⎟∑ ∑1 ∑∑ , (5.39)
where W is the mass fraction of the group, calculated from Equation 5.33:
a mn
Tk l k lk l
, ,,exp .= +⎛
⎝⎜⎞⎠⎟ (5.40)
The functional groups of fatty systems in alcoholic solutions for the UNIFAC model are as follows: CH3, CH2, CH, CH2COO, CH=CH, COOH, and OH and for the ASOG model areCH2, COO, C=C, COOH, and OH. The UNIFAC parameters for LLE were published by Magnussen et al. [9] and the ASOG parameters by Tochigi et al. [22]. Batista et al. [23] adjusted some of the UNIFAC and the ASOG param-eters for fatty systems, and the results in the prediction of the liquid–liquid equilib-rium of these systems were better than those using original parameters.
5.1.5.3 Minor Component
Binary interaction parameters of the UNIQUAC or the NRTL models between minor component and any other component in the fatty system (triacylglycerols, free fatty acids, ethanol, water) can be determined, assuming that the minor component are at infi nite (∞) dilution in the liquid–liquid equilibrium system. In this case, distribution coeffi cient, calculated according to Equation 5.41 below, can be approached by the distribution coeffi cient at infi nite dilution ki
∞. Using the isoactivity criterion this dis-tribution coeffi cient for minor component, ki
∞, can be calculated by Equation 5.42:
k = w wi i
IIiI
(5.41)
k =i∞
iw, I ∞
iw,II ∞
γ γ( ) ( ) . (5.42)
To calculate γ i∞ , the composition of both phases are required. Since the minor
component is present in a very low composition, the phase compositions can be estimated taking in account only the major components (triacylglycerols, free fatty acids, ethanol, water). The binary interaction parameters between the major compo-nents are used to perform liquid–liquid fl ash calculations for the estimation of phase compositions on the basis of the overall experimental composition of the mixtures.
TAF-62379-08-0606-C005.indd 238TAF-62379-08-0606-C005.indd 238 8/5/08 7:57:14 PM8/5/08 7:57:14 PM

Liquid–Liquid Extraction Applied to the Processing of Vegetable Oil 239
The infi nite dilution activity coeffi cient ( γ i� ) is obtained applying the limit in the
UNIQUAC or the NRTL models, keeping constant the mass fractions of the other components of the mixture and making the minor component compositions tend to zero.
For the adjustment of interaction parameters between minor components and any other components, the estimation was based on the minimization of the distri-bution coeffi cient objective function, Equation 5.43 below, following the procedure developed by Pessôa Filho and described in Rodrigues et al. [13, 16] and Gonçalves [18]. In Equation 5.43, the additional term is a penalty function suggested by Kang and Sandler [24] and used to preclude interaction parameters with too large absolute values:
OF k = k k N +Q (p ) /i iex
icalc 2
n=
N 1 2
l2( )
1
−( )⎛⎝⎜
⎞⎠⎟∑ LL
l=
L
1∑ , (5.43)
where n is the tie line index, N is the total number of tie lines, ki is the minor com-pounds’ distribution coeffi cient, ex and calc refer to experimental and calculated values, Q is a small value that does not alter signifi cantly the function residue, l is the UNIQUAC or NRTL parameter index, L is the total number of adjustable param-eters, and pl is the UNIQUAC or NRTL parameter.
5.1.6 SIMULATION OF A LIQUID–LIQUID EXTRACTION COLUMN
The schematic representation of a stagewise column is shown in Figure 5.10. The vegetable oil with free fatty acids stream (F) enters the column in stage 1 and the solvent stream (S) in the opposite side of the column. Extract and raffi nate streams fl ow from stage to stage countercurrently and provide the formation of two product streams, the fi nal extract (E1) and fi nal raffi nate (RN) streams. Extract (en) and raf-fi nate (rn) streams leave stage n in equilibrium.
In the vegetable oil deacidifi cation process, the fi nal raffi nate stream (RN) con-tains refi ned vegetable oil and a residual fraction of the solvent, and the fi nal extract stream (E1) contains the solvent with the free fatty acids extracted and a residual fraction of vegetable oil.
The algorithm, suggested by Naphtali and Sandholm [25] and developed for simulation of distillation column, is suitable to simulate the liquid–liquid extraction with the modifi cations of mass balance and equilibrium equations.
... ...e1,i e2,i en+1,i eN,i sN,i
F R1 Rn–1
en,i
En RN–1 RN… …
f1,i r1,i rn–1,i rn,i rN–1,i rN,i
Stage1
Stagen
StageN
FIGURE 5.10 Schematic representation of a liquid–liquid extraction column.
TAF-62379-08-0606-C005.indd 239TAF-62379-08-0606-C005.indd 239 8/5/08 7:57:15 PM8/5/08 7:57:15 PM
240 Extracting Bioactive Compounds for Food Products
The mass balance and liquid–liquid equilibrium equation are grouped for each component and each stage. The resultant group of equation has structure of a tridi-agonal block that permits a rapid solution with Newton–Raphson method.
For each stage n, a set of dependent relationships (test functions Fk(n,i)) must be satisfi ed:
Mass balances of component i:
F r r e y en n i n i n n i n i1 1 1 1( , ) , , , ,= − + −− + n = 2, 3, …, N − 1 (5.44)
i = 1, 2, …, C
F r f e ei i i i i1 1 1 1 1 2( , ) , , , ,= − + − i = 1, 2, …, C (5.45)
F r r e sN i N i N i N i N i1 1( , ) , , , ,= − + −− i = 1, 2, …, C. (5.46)
Equilibrium conditions:
F k E r R en i n i n n i n n i2( , ) , , ,= − n = 2, 3, …, N − 1 (5.47)
i = 1, 2, …, C,
where
k w wn i n iw I
n i
w II
n iII
n iI
, ,,
,
,
, ,= =γ γ (5.48)
F k E r R ei i i i2 1 1 1 1 1 1( , ) , , ,= − i = 1, 2, …, C (5.49)
F k E r R eN i N i N N i N N i2( , ) , , ,= − i = 1, 2, …, C. (5.50)
The above relationships comprise a vector of the test function:
F xF
F( ) =
⎧⎨⎩
⎫⎬⎭
=1
2
0 (5.51)
which contains 2NC elements and which may be solved for equally many unknowns:
xe
r=
⎧⎨⎩
⎫⎬⎭
. (5.52)
TAF-62379-08-0606-C005.indd 240TAF-62379-08-0606-C005.indd 240 8/5/08 7:57:15 PM8/5/08 7:57:15 PM

Liquid–Liquid Extraction Applied to the Processing of Vegetable Oil 241
The iterative Newton–Raphson method solves Equation 5.51 using the prior set of values of the independent variables. In Newton–Raphson’s interaction a new group of values, xr , is generated from a previous estimation, xr−1:
x x F x F xr r r r xr
= − ( ) ∂ ∂( )− − −−
1 1 11
, (5.53)
when ⏐xr − xr−1⏐ is enough small, the correct group of x was found and the iteration stops.
5.2 STATE OF THE ART—MINI REVIEW OF LITERATURE
For the success of the commercial production of enzymes and proteins, there is a need for effi cient downstream processing techniques. The downstream process for these biological materials requires purifi cation techniques that are delicate enough to preserve the biological activity [26]. The purifi cation protocols involve several steps, which increase the cost of the process and reduce the yield. The conventional procedures include ammonium sulphate precipitation, chromatography, dialysis, and fi ltration. Simpler and more effi cient purifi cation processes are needed.
Aqueous two-phase systems (ATPS) could be a good alternative to a fi rst purifi -cation step because such systems allow removal of several contaminants by a simple and economic process. ATPS are formed by adding to water, either two structurally different hydrophilic polymers, such as dextran and polyethylene glycol (PEG) [27], or maltodextrin and PEG [28, 29], or a polymer and salt, such as PEG and potassium phosphate or PEG and sodium sulphate [30–32].
PEG + salt systems have been used in large-scale protein separation because of larger droplet sizes, a higher density difference between the phases, and lower vis-cosity, leading to a much faster separation than PEG + dextran systems. Industrial applications of the PEG + salt systems could be improved by the availability of com-mercial separators, which allow faster continuous protein separations [33–35].
The most common polymer + polymer system is composed of polyethylene gly-col and dextran [36, 37]. Polypropylene glycol (PPG) is a polymer that is structurally closely related to PEG. PPGs of low molecular weight are soluble in water, whereas high molecular mass ones are only partially soluble [38]. Some recent purifi cation techniques employing ATPS suggest the use of thermo-separating polymers, such as copolymers of ethylene oxide (EO) and propylene oxide (PO) units, to reduce the cost of polymer recovery [39, 40]. Dextran is a high-cost polymer that makes dif-fi cult the use of ATPS in large-scale processes. Maltodextrin (MD) can be used as a lower cost substitute for dextran [28, 30]. MD is a commercial polymer of d-glucose units linked primarily by α(1→4) bonds. This polymer is obtained by acidic and enzymatic hydrolysis of starch. Low-molecular-mass saccharides, such as glucose, maltose, and sucrose, can also be used for dextran replacement, with the advantage that such compounds are of common occurrence in the food industry [41].
Phase equilibrium data for such systems are mainly found in the works of Albertsson [36] and Zaslavsky [37]. However, these data are not yet complete, par-ticularly regarding the behavior of such systems at different experimental conditions, for example, temperature and pH.
TAF-62379-08-0606-C005.indd 241TAF-62379-08-0606-C005.indd 241 8/5/08 7:57:16 PM8/5/08 7:57:16 PM
242 Extracting Bioactive Compounds for Food Products
Silva et al. [31] studied the effect of temperature, pH, and polymer molecular weight changes on the binodal curve and tie lines of the phase equilibrium diagrams for PEG + potassium phosphate + water systems. The equilibrium phase behavior of MD and PEG systems at 298.2 K and atmospheric pressure, under several conditions of concentrations and molecular weights of the polymers, was studied by Silva and Meirelles [28].
There are many reports in the literature concerning the partition of different enzymes and proteins in ATPS [26].
The behavior of the partition coeffi cients of bovine serum albumin (BSA), α-lac-toalbumin (α-La), and β-lactoglobulin (β-Lg) in PEG/MD systems at 298.2 K, with several PEG/MD polymer concentrations and different polymer molecular weights were published by Silva and Meirelles [29].
Alves et al. [42] performed an experimental study of the partitioning of different proteins, cheese whey α-La, β-Lg, and BSA, and porcine insulin in ATPS contain-ing PEG (1500, 600, 1450, and 3350) and salt (potassium phosphate, and sodium citrate), and PEG (1450, 8000, and 10,000) and MD (2000 and 4000). The results showed the feasibility of α-LA and β-Lg purifi cation. Partition coeffi cients of the BSA, α-LA, and β-Lg were also studied by Silva and Meirelles [30] in systems con-taining PPG 400 and MD at 25ºC. Lima et al. [26] investigated the partitioning of four pectinolytic enzymes from a commercial pectinase preparation (Pectinex-3XL) in ATPS composed of PEG and potassium phosphate.
Another important application of liquid–liquid extraction is the organic acids purifi cation such as citric, tartaric, lactic, and phosphoric acids. The recovery of carboxylic acids by liquid–liquid extraction with aliphatic tertiary amines dissolved in organic diluents has been studied by several authors [43–48].
The worldwide production of citric acid exceeds 500,000 ton/yr. In contrast with a lot of products that previously were obtained by microbiological methods and now-adays are obtained by synthetic methods, this acid continues to be manufactured, mainly by fermentation. Seventy percent of all citric acid produced is used by the food industry, and 18% is used by the pharmaceutical industry. Its use in the food industry represents 55%–65% of the total acidulants’ market, in which 20%–25% corresponds to phosphoric acid and 5% to malic acid. The fermentation process technology for the industrial production of organic acids has been known for more than a century. Citric acid is one of the macro-fermentation processes of greater suc-cess within the bioproduct industries.
The classical method for recovering citric acid is based on the precipitation of calcium salts, by addition of calcium hydroxide in the fermentation broth. The solid is fi ltrated and treated with sulfuric acid (H2SO4) for the preferential precipitation of sulfate calcium. The free organic acid in the fi ltrate is purifi ed using activated car-bon or ion exchange and is concentrated by evaporation. The acid crystallizes with great diffi culty and very low effi ciency. Compared to the usual separation processes, liquid–liquid extraction seems to be a very promising alternative [49].
In relation to phosphoric acid, several publications deal with the modeling of the extraction of phosphoric acid from water by tri-n-butyl phosphate [50, 51]. In fact, the phosphoric acid is an important raw material for fertilizer applications, as well as for products with higher purity standards [52].
TAF-62379-08-0606-C005.indd 242TAF-62379-08-0606-C005.indd 242 8/5/08 7:57:16 PM8/5/08 7:57:16 PM
Liquid–Liquid Extraction Applied to the Processing of Vegetable Oil 243
The success of a liquid–liquid extraction process relies on solvent selection. Mixed solvents composed of tertiary amines and alcohol are suggested as appropri-ated solvents [43, 53]. The disadvantage of their use is their great toxicity and, con-sequently, higher purifi cation costs. Welsh and Williams [54] studied several kinds of vegetable oils, as solvents to the recovery of organic compounds from aqueous solutions, such as corn oil, canola oil, olive oil, and others. The authors verifi ed that short-chain alcohols and organic acids presented low recovery and small distribution coeffi cients, when the vegetable oils are used as single solvents. Therefore, there is great appeal to the search for new solvents, mainly combinations of solvents. The main diffi culty is the analysis of mixed solvents because of the lack of equilibrium data.
Lintomen et al. [49] studied new solvents for the recovery of citric acid by liquid–liquid extraction using the following systems: water/citric acid/short-chain alcohol (2-butanol or 1-butanol) and water/citric acid/short-chain alcohol/tricaprylin.
Recently, Uslu [55] published a study of tartaric acid recovery from aqueous solutions using tertiary amine. Batch extraction experiments were performed with Alamine 336 dissolved in the diluents of various types—ketone (methyl isobutyl ketone), aromatic (toluene), different alkanes (hexane, cyclohexane), and alcohol (butan-1-ol).
Similar to that of citric acid, the interest toward lactic acid recovery from fer-mentation broth has been increased. This interest is caused by the increase in the demand of pure, naturally produced lactic acid, mainly for the food (as food additive and preservative) and pharmaceutical industries or for production of biodegradable polymers. Yankov et al. [56] investigated the lactic acid extraction from aqueous solutions and synthetic fermentation broth by means of a system composed of trioc-tylamine and an active (decanol) and an inactive (dodecane) diluent.
Essential volatile oils are vegetable products, which are basically a mixture of terpenic hydrocarbons and oxygenated derivatives such as aldehydes, alcohols and esters. Citrus essential oil is used as a fl avoring agent in pharmaceuticals as well as a fragrant ingredient in soaps, detergents, creams, lotions, and perfumes. From its components, oxygenated compounds are mainly responsible for the aroma and fl a-vor, and their content has become a defi nitive parameter in establishing the price of the volatile oil and representing a reference of quality [57].
Citrus oils are obtained from the small balloon-shaped glands or vesicles located in the fl avedo or colored portion of the citrus peel. The quality of these oils depends on factors such as soil, climate, extraction method of the oil, weather, maturity, and the variety of the fruit. Citrus oils are complex mixtures of over 200 chemical com-pounds, of which more than 100 have been identifi ed. These include highly volatile components such as terpenes, sesquiterpenes, and oxygenated compounds and non-volatile compounds such as pigments and waxes. The terpene fraction can constitute from 50% up to more than 95% of the oil. However, this fraction gives little contribu-tion to the fl avor and fragrance of the oil. Because terpenes are mostly unsaturated compounds, they are easily decomposed by heat, light, and oxygen to unpleasant off fl avors and aromas. Therefore, it is common industrial practice to remove some of the terpenes and, as a consequence, to concentrate the oxygenated compounds, which are mainly responsible for the characteristic citrus fl avor and fragrance. This
TAF-62379-08-0606-C005.indd 243TAF-62379-08-0606-C005.indd 243 8/5/08 7:57:16 PM8/5/08 7:57:16 PM
244 Extracting Bioactive Compounds for Food Products
procedure is known as “deterpenation” or “folding” and is carried out to improve oil stability, increase oil solubility, and reduce storage and transport costs [58–60].
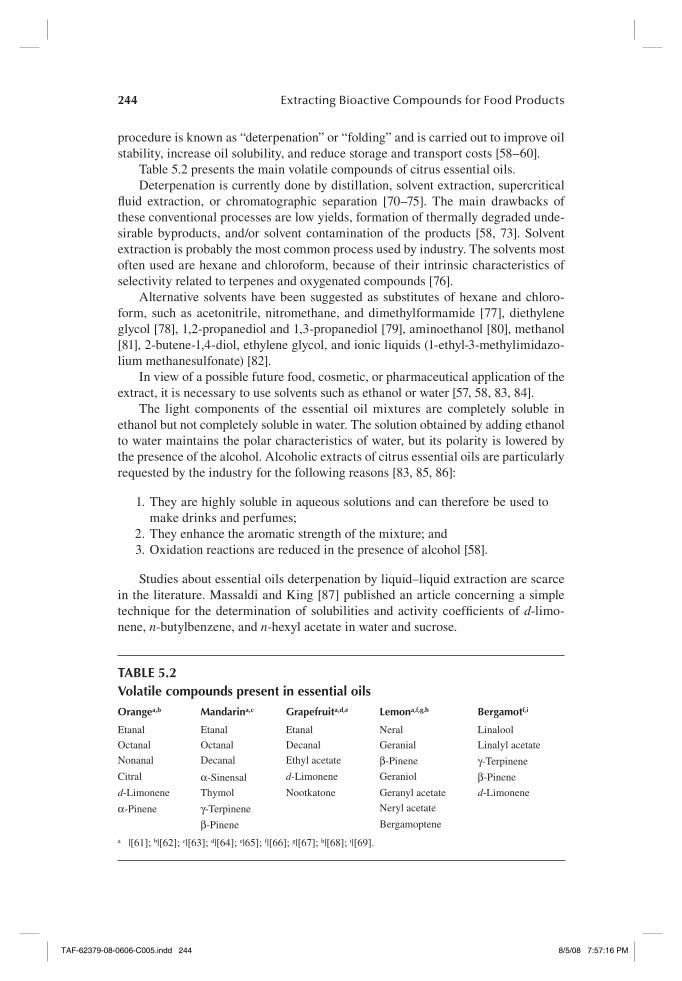
Table 5.2 presents the main volatile compounds of citrus essential oils.Deterpenation is currently done by distillation, solvent extraction, supercritical
fl uid extraction, or chromatographic separation [70–75]. The main drawbacks of these conventional processes are low yields, formation of thermally degraded unde-sirable byproducts, and/or solvent contamination of the products [58, 73]. Solvent extraction is probably the most common process used by industry. The solvents most often used are hexane and chloroform, because of their intrinsic characteristics of selectivity related to terpenes and oxygenated compounds [76].
Alternative solvents have been suggested as substitutes of hexane and chloro-form, such as acetonitrile, nitromethane, and dimethylformamide [77], diethylene glycol [78], 1,2-propanediol and 1,3-propanediol [79], aminoethanol [80], methanol [81], 2-butene-1,4-diol, ethylene glycol, and ionic liquids (1-ethyl-3-methylimidazo-lium methanesulfonate) [82].
In view of a possible future food, cosmetic, or pharmaceutical application of the extract, it is necessary to use solvents such as ethanol or water [57, 58, 83, 84].
The light components of the essential oil mixtures are completely soluble in ethanol but not completely soluble in water. The solution obtained by adding ethanol to water maintains the polar characteristics of water, but its polarity is lowered by the presence of the alcohol. Alcoholic extracts of citrus essential oils are particularly requested by the industry for the following reasons [83, 85, 86]:
1. They are highly soluble in aqueous solutions and can therefore be used to make drinks and perfumes;
2. They enhance the aromatic strength of the mixture; and 3. Oxidation reactions are reduced in the presence of alcohol [58].
Studies about essential oils deterpenation by liquid–liquid extraction are scarce in the literature. Massaldi and King [87] published an article concerning a simple technique for the determination of solubilities and activity coeffi cients of d-limo-nene, n-butylbenzene, and n-hexyl acetate in water and sucrose.
TABLE 5.2Volatile compounds present in essential oilsOrangea,b Mandarina,c Grapefruita,d,e Lemona,f,g,h Bergamotf,i
Etanal Etanal Etanal Neral Linalool
Octanal Octanal Decanal Geranial Linalyl acetate
Nonanal Decanal Ethyl acetate β-Pinene γ-Terpinene
Citral α-Sinensal d-Limonene Geraniol β-Pinene
d-Limonene Thymol Nootkatone Geranyl acetate d-Limonene
α-Pinene γ-Terpinene Neryl acetate
β-Pinene Bergamoptene
a |[61]; b|[62]; c|[63]; d|[64]; e|65]; f|[66]; g|[67]; h|[68]; i|[69].
TAF-62379-08-0606-C005.indd 244TAF-62379-08-0606-C005.indd 244 8/5/08 7:57:16 PM8/5/08 7:57:16 PM
Liquid–Liquid Extraction Applied to the Processing of Vegetable Oil 245
Ternary liquid–liquid equilibria for α-pinene + ∆3-carene + polar compound (acetonitrile, nitromethane, and dimethylformamide) systems were determined by Antosik and Stryjek [77], at the temperature 298.2 K.
Thermodynamic behavior related to systems composed of essential oil com-pounds plus ethanol and water was fi rstly published by Gironi et al. [83]. The authors reported solubilities for the binary systems of water + limonene and water + citral at atmospheric pressure and at 293 K. Equilibrium data of ternary systems of water + ethanol + limonene and water + ethanol + citral were also determined.
Tamura and Li [81] tested methanol plus water as solvent for the deterpenation process. In this chapter, the authors measured the mutual solubilities of the terpenes dissolved in water or methanol and their multicomponent liquid–liquid equilibria.
Cháfer et al. studied the infl uence of the temperature on phase equilibrium of systems composed of limonene, ethanol, and water [88], and of linalool, ethanol, and water [58], respectively.
An ample study related to solvent choice for deterpenation of essential oils has been developed by Arce et al. [57, 78–80, 82, 84]. First, the authors evaluated the performance of diethylene glycol as solvent for systems containing limonene plus linalool at three different temperatures: 298.2, 308.2, and 318.2K [78]. Subsequently, the following solvents were tested for the same oil systems: 1,2-propanediol e 1,3-propanediol [79], ethanol plus water [57, 84], 2-aminoethanol [80], 2-butene-1,4-diol, ethylene glycol, and 1-ethyl-3-methylimidazolium methanesulfonate [82].
Deacidifi cation of vegetable oils can also be performed by liquid–liquid extrac-tion. Oilseeds are the major source for the production of edible oils, which are regarded as an important component of the diet, being an important source of energy, of essential fatty acids (such as linoleic acid), and of fat-soluble vitamins (such as vitamins A and E). Crude vegetable oils are predominantly composed of triacylg-lycerols and free fatty acids, with mono- and diacylglycerols also present at lower levels. The refi ning of vegetable oils consists of several steps, including its extraction from solid matrix by pressing and/or using organic solvents [89, 90], degumming, bleaching, deacidifi cation, and deodorization [91, 92].
The removal of free fatty acids (deacidifi cation) is the most diffi cult step of the oil purifi cation process, mainly because it has the maximum economic impact on oil production. Deacidifi cation of oils is performed industrially by chemical, physical, or miscella methods. However, for oils with high acidity, chemical refi ning causes high losses of neutral oil as a result of saponifi cation and emulsifi cation. Physical refi ning is also a feasible process for deacidifi cation of highly acidic oils, because it results in lower losses of neutral oil than the traditional process, but more energy is consumed. Moreover, in some cases, the refi ned oil is subject to undesirable altera-tions in color and a reduction of stability with regard to resisting to oxidation [1].
New approaches for deacidifi cation of vegetable oils have been proposed in the literature, such as biological deacidifi cation, chemical reesterifi cation, supercritical fl uid extraction, membrane processing, and solvent (or liquid–liquid) extraction.
Liquid–liquid extraction is a separation process that takes advantage of the rela-tive solubilities of solutes in immiscible solvents. A partial separation occurs when the components of the original mixture have different relative solubilities in the selected solvent phase [3]. The deacidifi cation of oils by liquid–liquid extraction by
AQ8AQ8
TAF-62379-08-0606-C005.indd 245TAF-62379-08-0606-C005.indd 245 8/5/08 7:57:17 PM8/5/08 7:57:17 PM

246 Extracting Bioactive Compounds for Food Products
means of an appropriate solvent is receiving attention because of its advantages in comparison to physical and chemical refi ning. As this process is normally carried out at room temperature and atmospheric pressure, less energy is consumed and the oil is submitted to softer treatments. Besides, liquid–liquid extraction has the advantages of avoiding the formation of waste products, but still reduces the loss of neutral oil and may preserve the nutraceutical compounds. Furthermore, solvent stripping from refi ned oil and solvent recovery from extract stream can be easily carried out because of the great difference between the boiling points of the solvent, fatty acids, and tria-cylglycerols. In fact, these operations can be accomplished by evaporation or distilla-tion at relatively low temperatures, in most cases lower than 353 K [3, 93, 94].
The use of solvent extraction for deacidifi cation of vegetable oils was fi rst pro-posed by Bollmann [95]. In this patent the author suggests the use of methyl alcohol, ethyl alcohol, amyl alcohol, acetone or acetic ester not diluted or diluted with water. van Dijck [96] suggested a process combining liquid–liquid extraction and alkali refi ning. Free fatty acids from fats and oils were neutralized by adding a base, such as ammonia, and subsequently the soaps were removed by countercurrent extraction with a suitable solvent, such as ethanol.
Another study based on liquid–liquid extraction associated with alkali refi ning was patented by Nestlé Co. [97]. According to the inventors, free fatty acids are removed by controlled neutralization in an aqueous medium containing an alcohol or a polyol.
Swoboda [98] reports a process for refi ning palm oil and palm oil fractions, using as solvent mixtures of ethanol and water or isopropanol and water, preferably with a composition near the azeotropic one. According to the author, azeotropic mixtures are preferred because of the advantages of recycling the solvent.
Bhatacharyya et al. [99] and Shah and Venkatesan [100] studied the deacidifi ca-tion of rice bran and groundnut oils using aqueous 2-propanol as solvent. Kim et al. [101] and Kale et al. [102] tested methanol in the refi ning of RBO. All these studies showed a decrease in the oil acidic value. Turkay and Civelekoglu [103] investigated the liquid–liquid extraction of sulfur olive oil miscella in hexane with aqueous etha-nol solutions. Apelblat et al. [93] published an article that reports phase diagrams for soybean oil or jojoba oil plus oleic acid and several solvents (1,2-butanediol, dimethyl sulfoxide, cis-2-butene-1,4-diol, formamide, and n-methylformamide), at 298.2 K.
The extraction of free fatty acids from fatty materials using solvents has a long history, and several studies have already shown that this process is, in principle, feasible using short-chain alcohols, especially ethanol, as solvent [3, 93, 99, 100, 102, 104–110]. Ethanol has low toxicity, ease recovery in the process, good values of selectivity and of the distribution coeffi cient for free fatty acids [10, 11, 14, 15, 17, 106], and low losses of nutraceutical compounds [12, 13, 16, 18].
In the last years, equilibrium data for systems composed of several vegetable oils (canola, corn, palm, rice bran, Brazil nut, macadamia nut, grape seed, sesame seed, garlic, soybean, and cottonseed oils) plus saturated, monounsaturated, or diunsatu-rated free fatty acids, such as stearic, palmitic, oleic, and linoleic acids plus solvent (ethanol + water) have been published [10–19, 23, 111]. This set of works emphasizes that the mixture ethanol + water is more often recommended to be used as solvent for
AQ9AQ9
TAF-62379-08-0606-C005.indd 246TAF-62379-08-0606-C005.indd 246 8/5/08 7:57:17 PM8/5/08 7:57:17 PM
Liquid–Liquid Extraction Applied to the Processing of Vegetable Oil 247
deacidifi cation of vegetable oils. In fact, this new technique may produce vegetable oils with low acidic levels and simultaneously minimize the loss of neutral oil and nutraceutical compounds.
5.3 APPLICATIONS
5.3.1 DEACIDIFICATION OF VEGETABLE OILS
In this section we discuss some effects in the liquid–liquid equilibrium for fatty sys-tems using short-chain alcohols. This information is useful in the choice of solvent or temperature for deacidifi cation of vegetable oils by liquid–liquid extraction.
5.3.1.1 Effect of Temperature
The information about mutual solubility of the oil and solvent is contained in the base line of liquid–liquid diagram (Figure 5.1). The mutual solubility for vegetable oil and short-chain alcohols increases with an increase in temperature, and above some temperatures, this binary mixture is totally soluble. The increase in mutual solubility with increasing temperatures affects the liquid–liquid equilibrium. The area underneath binodal decreases at higher temperatures, and the slopes of the tie line or distribution coeffi cients may change.
Batista et al. [10] presented the liquid–liquid equilibrium for the system contain-ing refi ned canola oil + commercial oleic acid and short-chain alcohols at different temperatures. For systems with anhydrous methanol and anhydrous ethanol, the het-erogeneous region decreases with the increasing in temperature from 293 to 303 K, and only a slight change in the distribution coeffi cient of oleic acid is observed. The increasing of mutual solubility of canola oil and anhydrous methanol or anhydrous ethanol with almost no impact on the slope of tie lines causes a decrease in the selec-tivity of the solvents with increasing temperatures.
Figure 5.11 shows the tie lines and binodal curves for the systems of refi ned canola oil + commercial oleic acid + methanol at 293 and 303 K.
5.3.1.2 Length Chain of Alcohols
Figure 5.12 represents the binodal curves for the system of refi ned canola oil + com-mercial oleic acid + anhydrous methanol or anhydrous ethanol. It can be seen that the heterogeneous region for the system with methanol is higher than for the system with ethanol, because the mutual solubility of refi ned canola oil with methanol is lower than that with ethanol, which can be explained by the higher polarity of the methanol chain in relation to that of ethanol.
The results proved that the distribution coeffi cient of oleic acid with anhydrous ethanol is somewhat larger than 1, whereas that for anhydrous methanol is somewhat smaller, which suggests that methanol has a somewhat lower capacity for extraction of fatty acids oil, thus presenting less selectivity than methanol.
As expected, the system of canola oil + oleic acid + anhydrous isopropanol at 293 K and canola oil + oleic acid + anhydrous n-propanol at 283 K formed only a minimum heterogeneous area.
AQ10AQ10
TAF-62379-08-0606-C005.indd 247TAF-62379-08-0606-C005.indd 247 8/5/08 7:57:17 PM8/5/08 7:57:17 PM

248 Extracting Bioactive Compounds for Food Products
0 20 40 60 80 1000
5
10
15
20
25
30
35O
leic a
cid (m
ass %
)
Methanol (mass %)FIGURE 5.11 Experimental tie lines and binodal curves for the systems of refi ned canola oil + commercial oleic acid + anhydrous methanol at 293.2 K (—�—) and at 303.2 K (···●···).
0 20 40 60 80 1000
4
8
12
16
20
24
28
32
Olei
c acid
(mas
s %)
Solvent (mass %)
FIGURE 5.12 Binodal curves for the system refi ned canola oil + commercial oleic acid + solvents: anhydrous methanol (—�—) and anhydrous ethanol (···●···) at 303.2 K.
TAF-62379-08-0606-C005.indd 248TAF-62379-08-0606-C005.indd 248 8/5/08 7:57:18 PM8/5/08 7:57:18 PM
Liquid–Liquid Extraction Applied to the Processing of Vegetable Oil 249
5.3.1.3 Addition of Water in the Solvent
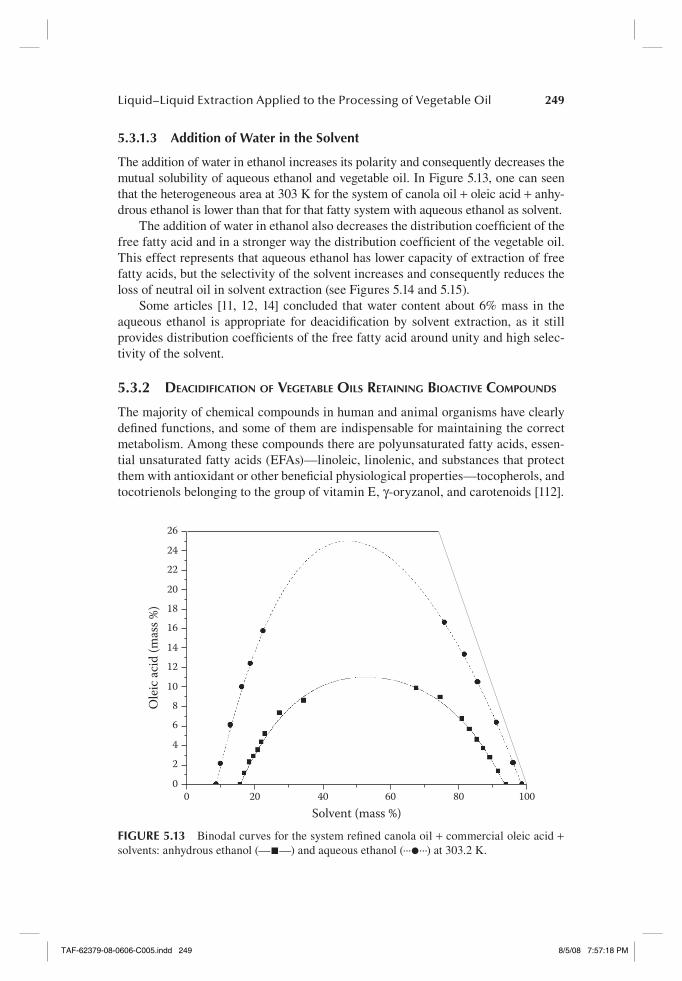
The addition of water in ethanol increases its polarity and consequently decreases the mutual solubility of aqueous ethanol and vegetable oil. In Figure 5.13, one can seen that the heterogeneous area at 303 K for the system of canola oil + oleic acid + anhy-drous ethanol is lower than that for that fatty system with aqueous ethanol as solvent.
The addition of water in ethanol also decreases the distribution coeffi cient of the free fatty acid and in a stronger way the distribution coeffi cient of the vegetable oil. This effect represents that aqueous ethanol has lower capacity of extraction of free fatty acids, but the selectivity of the solvent increases and consequently reduces the loss of neutral oil in solvent extraction (see Figures 5.14 and 5.15).
Some articles [11, 12, 14] concluded that water content about 6% mass in the aqueous ethanol is appropriate for deacidifi cation by solvent extraction, as it still provides distribution coeffi cients of the free fatty acid around unity and high selec-tivity of the solvent.
5.3.2 DEACIDIFICATION OF VEGETABLE OILS RETAINING BIOACTIVE COMPOUNDS
The majority of chemical compounds in human and animal organisms have clearly defi ned functions, and some of them are indispensable for maintaining the correct metabolism. Among these compounds there are polyunsaturated fatty acids, essen-tial unsaturated fatty acids (EFAs)—linoleic, linolenic, and substances that protect them with antioxidant or other benefi cial physiological properties—tocopherols, and tocotrienols belonging to the group of vitamin E, γ-oryzanol, and carotenoids [112].
0 20 40 60 80 1000
24
68
10
1214
161820
2224
26
Olei
c acid
(mas
s %)
Solvent (mass %)FIGURE 5.13 Binodal curves for the system refi ned canola oil + commercial oleic acid + solvents: anhydrous ethanol (—�—) and aqueous ethanol (···●···) at 303.2 K.
TAF-62379-08-0606-C005.indd 249TAF-62379-08-0606-C005.indd 249 8/5/08 7:57:18 PM8/5/08 7:57:18 PM

250 Extracting Bioactive Compounds for Food Products
0 2 4 6 8 10 12 14 160.0
0.2
0.4
0.6
0.8
1.0
1.2
1.4Di
strib
utio
n co
efficie
nt
Oleic acid (mass %)
FIGURE 5.14 Distribution coeffi cient of: oleic acid (—�—) and canola oil (—●—) at 303.2 K in anhydrous ethanol and oleic acid (···▼···) and canola oil (···▲···) at 303.2 K in aqueous ethanol.
0 2 4 6 8 10 12 14 160
5
10
15
20
25
30
35
40
45
50
55
Selec
tivity
Oleic acid (mass %)FIGURE 5.15 Selectivity of anhydrous ethanol (—�—) and aqueous ethanol (···●···) at 303.2 K.
TAF-62379-08-0606-C005.indd 250TAF-62379-08-0606-C005.indd 250 8/5/08 7:57:18 PM8/5/08 7:57:18 PM

Liquid–Liquid Extraction Applied to the Processing of Vegetable Oil 251
These singular compounds are not synthesized by human or animal organisms, and so they have to be supplied in due time and in appropriate quantities [112]. Vitamin E and EFAs are substances of particular physiologic signifi cance, and it is important to maintain their proper proportions [112–114].
Vitamin E (Figure 5.16) is a fat-soluble vitamin that comprises two major homol-ogous series of compounds (tocochromanols), known as tocopherols and tocotri-enols. The tocopherols are structurally characterized by a saturated side chain in the chroman ring, whereas the tocotrienols possess an unsaturated phytyl side chain. Four homologs of each type are known to exist in nature and have different degrees of antioxidant and vitamin E activity.
Gogolewski et al. [115] proposed a division of oils into three groups according to their nutritive value and contribution to the human organism’s daily demand for fat, tocochromanols, and EFAs. The fi rst group includes, e.g., the coconut, and olive oils; the quantity of EFAs and tocopherols in them is not suffi cient for their protection from oxidation. The second group is formed by oils of which 100 g contains 30–32 g EFAs and 30–35 mg vitamin E. The third group is constituted of oils capable of sup-plementing the diet with vitamin E and the EFAs; among other oils there are those obtained from the wheat and maize germs with the highest content of EFAs and tocopherols and/or tocotrienols, such as rice bran, cottonseed, soybean, sunfl ower seed, and corn oils. Some authors suggest the optimum quantitative ratio of 0.5 mg of vitamin E equivalent to 1 g EFAs in the human organism [116–118].
R1methylmethylhydrogenhydrogen
R2methylhydrogenmethylhydrogen
R3methylmethylmethylmethyl
OHR1
R2R3
CH3
CH3 CH3
O
CH3
CH3
A
OHR1
R2R3
CH3
CH3 CH3
O
CH3
CH3
B
αβγδ
FIGURE 5.16 Chemical structure of Vitamin E (A: tocopherols; B: tocotrienols).
TAF-62379-08-0606-C005.indd 251TAF-62379-08-0606-C005.indd 251 8/5/08 7:57:19 PM8/5/08 7:57:19 PM

252 Extracting Bioactive Compounds for Food Products
In a general way, tocopherols and tocotrienols prevent formation of free radicals. They also take over the energy of the latter, inhibiting further metabolic transfor-mations of polyunsaturated fatty acids during storage of oils, and after consump-tion, they also participate in many physiologic processes in human organisms. In relation to the tocotrienol isomers, they present antioxidant and antitumor activities [119–123].
As can be seen in Table 5.3, vegetable oils are rich sources of tocopherols. Vita-min E has traditionally been extracted from the residues of the soybean refi ning industry. Tocotrienols, on the other hand, are predominantly found in palm oil and in cereal oils such as barley and RBOs. With the emergence of palm oil as the fi rst largest edible oil in the world markets [124], technological advances have been made enabling the extraction of tocotrienols from palm oil, which is currently available commercially.
Table 5.4 shows a typical tocols composition in crude palm and RBOs. Both vegetable oils present predominantly α-tocopherol and γ-tocotrienol.
TABLE 5.3Tocopherol contents of principal edible oilsEdible oil Total tocopherols (mg/kg)
Palm oil 360–560
Rice bran oil 900
Cottonseed oil 830–900
Corn oil 870–2500
Olive oil 30–300
Soybean oil 900–1400
Peanut oil 330–480
Sunfl ower oil 630–700
Canola oil 690–695
Sesame seed oil 531–1000
TABLE 5.4Tocols composition in crude palm and rice bran oilsTocols Crude palm oil (%) Crude rice bran oil (%)
α-Tocopherols 21.5 23.2
β-Tocopherols 3.7 3.3
γ-Tocopherols 3.2 11.8
δ-Tocopherols 1.6 0.7
α-Tocotrienols 7.3 14.0
β-Tocotrienols 7.3 —
γ-Tocotrienols 43.7 44.3
δ-Tocotrienols 11.7 2.6
TAF-62379-08-0606-C005.indd 252TAF-62379-08-0606-C005.indd 252 8/5/08 7:57:19 PM8/5/08 7:57:19 PM

Liquid–Liquid Extraction Applied to the Processing of Vegetable Oil 253
Refi ning of oils comprises several physical and chemical processes that aim at eliminating the unnecessary substances. During refi ning process, substances with biological activity, such as tocopherols and tocotrienols, are also removed [125–128].
The contents of total and individual tocopherols and tocotrienols of vegetable oils at different stages of industrial chemical and physical refi ning processes gradu-ally decrease until the end of the refi ning processes. The average losses of total tocopherol content in sunfl ower seed oil during the chemical and physical refi ning processes were found to be 30.2 and 35.5%, respectively [129].
The steam distillation (stripping) stage of the physical refi ning process causes greatest overall reduction (average 24.6%) in total tocopherol content in sunfl ower seed oil. In contrast to the physical refi ning process, the degumming–neutralizing stage in the chemical refi ning process causes greatest overall reduction (average 14.7%) in total tocopherol content. An additional average loss of 11.0 % occurs during deodorizing in the chemical refi ning process. In both chemical and physical refi ning, the bleaching stage causes similar effects. The physical refi ning process promotes a greater loss in the total and individual tocopherol contents when compared with the chemical refi ning process [116, 129, 130].
It has been reported that refi ned bleached deodorized (RBD) palm oil, palm olein, and palm stearin retain approximately 69, 72, and 76% of the original level of vitamin E in the crude oils, respectively. During the deodorization step refi ning process of RBO, a signifi cant portion, about 25%, of vitamin E is stripped away with the distillate [131, 132].
Palm oil also plays an important role among the vegetable oils for being con-sidered the world’s richest source of natural plant carotenoids in term of retinal (pro-vitamin A) equivalent [133]. Figure 5.17 presents the chemical structure of the main carotenoid in palm oil (β-carotene). The typical composition of carotenoids in this oil is shown in Table 5.5.
Besides presenting vitamin A value, carotenoids reduce the risk of certain types of cancer and possess the ability of suppressing singlet oxygen [134]. Despite its nutritional value, carotenoids are removed in the physical refi ning process (generally used for oils with high acidity, such as palm oil) in order to obtain a clear color oil, which has better acceptance for industrial purposes [135]. Thus, some valuable char-acteristics of palm oil are lost during its processing, and the corresponding nutri-tional benefi ts remain available only in the crude oil [136].
In fact, the physical refi ning is responsible for great losses of nutraceutical com-pounds from palm oil. The carotenoid concentration (about 500–700 mg/kg in crude palm oil) is reduced to the half during the bleached step of the physical refi ning
FIGURE 5.17 Chemical structure of β-carotene.
TAF-62379-08-0606-C005.indd 253TAF-62379-08-0606-C005.indd 253 8/5/08 7:57:19 PM8/5/08 7:57:19 PM
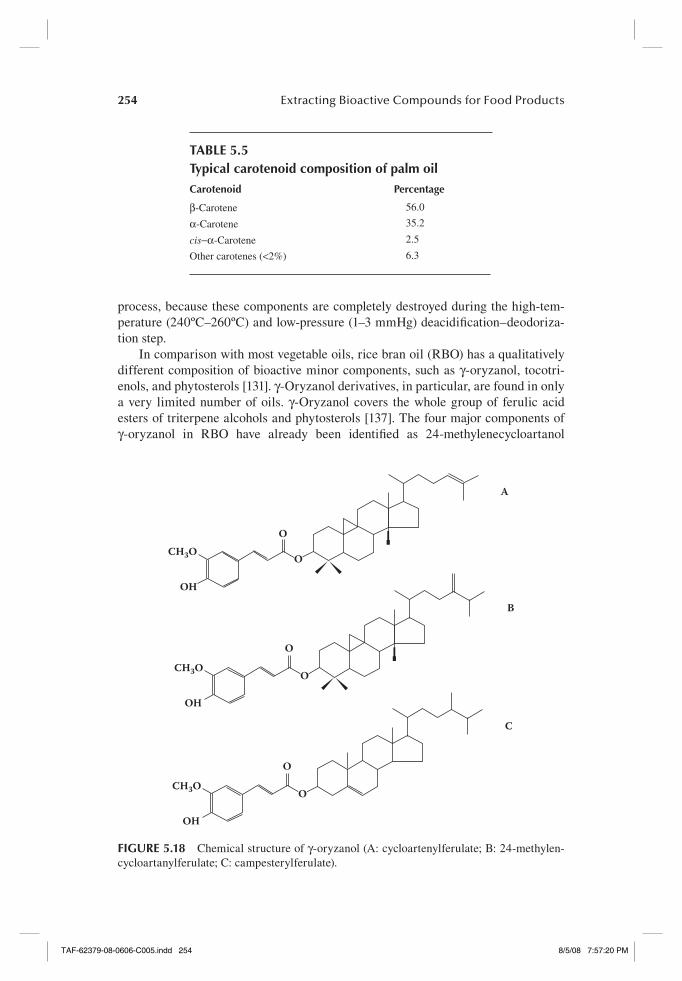
254 Extracting Bioactive Compounds for Food Products
process, because these components are completely destroyed during the high-tem-perature (240ºC–260ºC) and low-pressure (1–3 mmHg) deacidifi cation–deodoriza-tion step.
In comparison with most vegetable oils, rice bran oil (RBO) has a qualitatively different composition of bioactive minor components, such as γ-oryzanol, tocotri-enols, and phytosterols [131]. γ-Oryzanol derivatives, in particular, are found in only a very limited number of oils. γ-Oryzanol covers the whole group of ferulic acid esters of triterpene alcohols and phytosterols [137]. The four major components of γ-oryzanol in RBO have already been identifi ed as 24-methylenecycloartanol
TABLE 5.5Typical carotenoid composition of palm oilCarotenoid Percentage
β-Carotene 56.0
α-Carotene 35.2
cis−α-Carotene 2.5
Other carotenes (<2%) 6.3
OH
CH3O
OH
O
A
CH3OO
B
OH
CH3OO
C
O
O
O
FIGURE 5.18 Chemical structure of γ-oryzanol (A: cycloartenylferulate; B: 24-methylen-cycloartanylferulate; C: campesterylferulate).
TAF-62379-08-0606-C005.indd 254TAF-62379-08-0606-C005.indd 254 8/5/08 7:57:20 PM8/5/08 7:57:20 PM
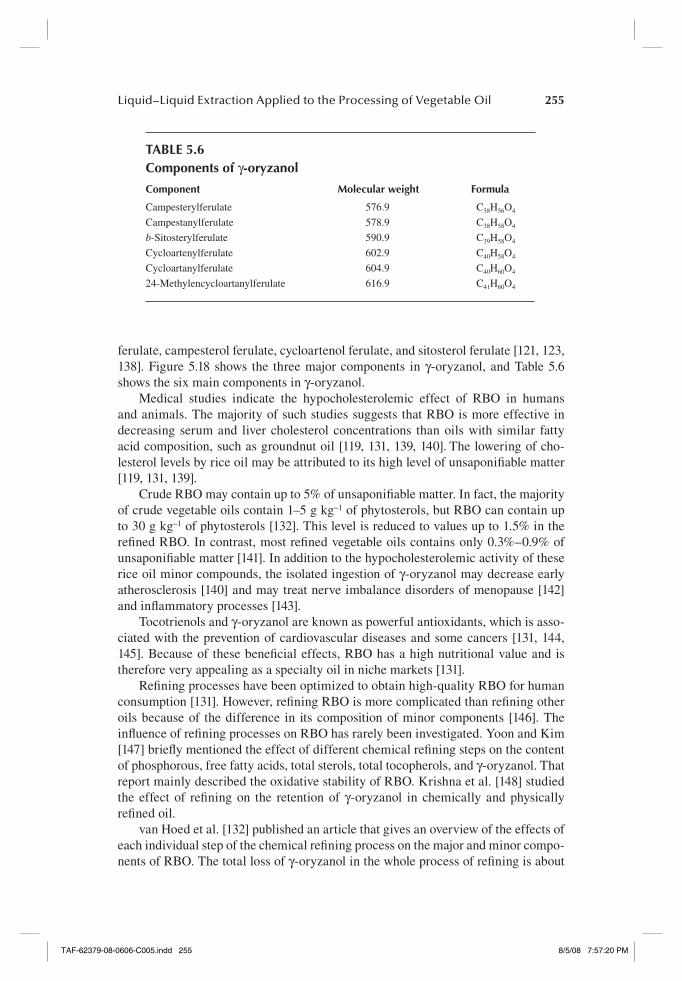
Liquid–Liquid Extraction Applied to the Processing of Vegetable Oil 255
ferulate, campesterol ferulate, cycloartenol ferulate, and sitosterol ferulate [121, 123, 138]. Figure 5.18 shows the three major components in γ-oryzanol, and Table 5.6 shows the six main components in γ-oryzanol.
Medical studies indicate the hypocholesterolemic effect of RBO in humans and animals. The majority of such studies suggests that RBO is more effective in decreasing serum and liver cholesterol concentrations than oils with similar fatty acid composition, such as groundnut oil [119, 131, 139, 140]. The lowering of cho-lesterol levels by rice oil may be attributed to its high level of unsaponifi able matter [119, 131, 139].
Crude RBO may contain up to 5% of unsaponifi able matter. In fact, the majority of crude vegetable oils contain 1–5 g kg−1 of phytosterols, but RBO can contain up to 30 g kg−1 of phytosterols [132]. This level is reduced to values up to 1.5% in the refi ned RBO. In contrast, most refi ned vegetable oils contains only 0.3%–0.9% of unsaponifi able matter [141]. In addition to the hypocholesterolemic activity of these rice oil minor compounds, the isolated ingestion of γ-oryzanol may decrease early atherosclerosis [140] and may treat nerve imbalance disorders of menopause [142] and infl ammatory processes [143].
Tocotrienols and γ-oryzanol are known as powerful antioxidants, which is asso-ciated with the prevention of cardiovascular diseases and some cancers [131, 144, 145]. Because of these benefi cial effects, RBO has a high nutritional value and is therefore very appealing as a specialty oil in niche markets [131].
Refi ning processes have been optimized to obtain high-quality RBO for human consumption [131]. However, refi ning RBO is more complicated than refi ning other oils because of the difference in its composition of minor components [146]. The infl uence of refi ning processes on RBO has rarely been investigated. Yoon and Kim [147] briefl y mentioned the effect of different chemical refi ning steps on the content of phosphorous, free fatty acids, total sterols, total tocopherols, and γ-oryzanol. That report mainly described the oxidative stability of RBO. Krishna et al. [148] studied the effect of refi ning on the retention of γ-oryzanol in chemically and physically refi ned oil.
van Hoed et al. [132] published an article that gives an overview of the effects of each individual step of the chemical refi ning process on the major and minor compo-nents of RBO. The total loss of γ-oryzanol in the whole process of refi ning is about
TABLE 5.6Components of γ-oryzanol
Component Molecular weight Formula
Campesterylferulate 576.9 C38H56O4
Campestanylferulate 578.9 C38H58O4
b-Sitosterylferulate 590.9 C39H58O4
Cycloartenylferulate 602.9 C40H58O4
Cycloartanylferulate 604.9 C40H60O4
24-Methylencycloartanylferulate 616.9 C41H60O4
TAF-62379-08-0606-C005.indd 255TAF-62379-08-0606-C005.indd 255 8/5/08 7:57:20 PM8/5/08 7:57:20 PM
256 Extracting Bioactive Compounds for Food Products
83%, being that 77% of the loss is related to the neutralization step [132, 140, 149]. In relation to physical refi ning, it is reported that most of the oryzanol (66%) can be retained in the refi ned oil [149].
As mentioned above, traditional methods of refi ning cause a signifi cant decreas-ing of nutraceutical compound levels in edible oils. In this context, liquid–liquid extraction using appropriate solvents, such as short-chain alcohols, can be an alter-native technique for refi ning nutritional oils.
Swoboda [98] reports a process for refi ning palm oil and palm oil fractions using as solvent mixtures ethanol and water or isopropanol and water, preferably with a composition near the azeotropic one. Crude palm oil subjected to solvent extraction may produce a raffi nate containing a concentration of carotenoids similar to, or even larger than, the concentration of carotenoids in original source.
With the purpose of obtaining RBO enriched with high levels of tocols—tocopherols and tocotrienols—and γ-oryzanol, Cherukuri et al. [150] suggested a liquid–liquid extraction process using lower aliphatic alcohols (C1 to C6, preferably methanol, ethanol, or isopropanol). The process involves mixing RBO and alcohol, separating the alcohol layer and subsequently distilling this layer in order to recover enriched RBO.
A study of the process variable infl uence on the losses of γ-oryzanol and tocols during the deacidifi cation process of RBO by liquid–liquid extraction was also reported by Rodrigues et al. [112]. The infl uence of process variables such as acid-ity content in the oil, water content in the ethanolic solvent, and oil–solvent ratio, were analyzed using the response surface methodology. The results indicate that the increasing of the acidity level in the oil increases the loss of γ-oryzanol. The addition of water to the solvent reduces the solvent’s capacity to extract this minor compound. In relation to tocols’ losses the effect of the oil–solvent mass ratio is larger than the effect of water content in the solvent. The tocols’ losses increase when the mass ratio oil–solvent ratio is low.
Rodrigues et al. [12, 13] studied the partition coeffi cients of γ-oryzanol and tocopherols and tocotrienols in systems containing RBO, fatty acids, and aqueous ethanol. Their results show that most of the nutraceutical compounds from RBO can be kept on the refi ned oil after solvent extraction. These data were correlated by thermodynamic models, such as NRTL and UNIQUAC [13]. These models quanti-tatively described the systems.
In Rodrigues et al. [16], the equilibrium data for the systems containing cotton-seed oil + commercial linoleic acid + ethanol +water + tocopherols were reported. The experimental data, obtained at 298.2 K, were correlated by the NRTL and UNI-QUAC equations. These models quantitatively described the systems.
Recently, Gonçalves et al. [18] reported partition coeffi cients of carotenoids and tocopherols in systems containing palm oil + fatty acids + aqueous ethanol at 318.2 K and different water contents and oil–solvent mass ratios. The UNIQUAC model was used to correlate the partition coeffi cients of carotenoids and tocopherols.
Figures 5.19 and 5.20 show experimental and calculated data of nutraceutical compound partition coeffi cients commonly found in edible oils. The distribution coeffi cients are presented as a function of the water level in the ethanolic solvent [12, 13, 16, 18].
TAF-62379-08-0606-C005.indd 256TAF-62379-08-0606-C005.indd 256 8/5/08 7:57:20 PM8/5/08 7:57:20 PM

Liquid–Liquid Extraction Applied to the Processing of Vegetable Oil 257
As can be seen in Figures 5.19 and 5.20, the addition of water in the solvent decreases nutraceutical compound distribution coeffi cients. This means that the larger the concentration of water, the smaller the solvent capacity for extracting the carotenoids, γ-oryzanol, and the tocols. It can also be observed that for all the aque-ous solvents studied, the distribution coeffi cients of minor compounds were smaller than unity, indicating their preference for the oil phase. It is important to empha-size that this effect is desirable, once it demonstrates that most of such compounds remain in the oil refi ned by liquid–liquid extraction.
0 1 2 3 4 5 6 7 8 9 10 11 12 13 14 15 16
0.0
0.1
0.2
0.3
0.4
0.5
0.6
kMin
or C
ompo
unds
Water content in the solvent (mass %)FIGURE 5.19 Minor compounds distribution coeffi cients (k) as a function of the water con-tent in the solvent: (●) carotenoids in palm oil; (�) γ-oryzanol in rice bran oil; (▲) tocols in cottonseed oil; (·····) UNIQUAC model; (–––) NRTL model.
0 2 4 6 8 10 12 14 16 18 20 220.000.050.100.150.200.250.300.350.400.450.500.550.600.650.700.750.80
kToc
ols
Water content in the solvent (mass %)FIGURE 5.20 Tocols distribution coeffi cients (k) as a function of the water content in the solvent: (●) palm oil; (�) rice bran oil; (▲) cottonseed oil; (·····) UNIQUAC model; (–––) NRTL model.
TAF-62379-08-0606-C005.indd 257TAF-62379-08-0606-C005.indd 257 8/5/08 7:57:20 PM8/5/08 7:57:20 PM

258 Extracting Bioactive Compounds for Food Products
Despite the same behavior, it can be observed that the tocols are transferred to the alcoholic phase in a major extension than γ-oryzanol. This can be attributed to structural differences between the molecules. Tocols are less hydrophobic than γ-oryzanol [151]. They are composed of smaller molecules that contain an unsaturated side chain in the tocotrienol series and a lower number of methyl substitutions than the oryzanol molecules.
It is also noticed that the tocols are extracted to the alcoholic phase in a larger quantity than the carotenoids. In fact, tocols and carotenoids are insoluble in water, because they have an apolar long chain (what makes them liposoluble). However, the OH group linked to the tocopherol aromatic ring enhances its solubility in ethanol.
In relation to the tocols’ family, it can be seen in Figure 5.15 that the values of partition coeffi cients are independent of oil’s chemical composition. It is possible to express the unsaturation level of fatty compounds by the iodine value. This can be calculated directly from fatty acid composition of oil according to method Cd 1c-85 AOCS [152]. Palm oil used by Gonçalves et al. [18] showed an iodine value of 55.0, whereas RBO and cottonseed oil studied by Rodrigues et al. [13, 16] presented val-ues that equal 102.3 and 112.9, respectively.
The results showed that deacidifi cation of vegetable oils by liquid–liquid extrac-tion, using aqueous ethanol as solvent, allowed the retention of nutraceutical com-pounds in refi ned oil. For example, traditional physical refi ning usually provides a refi ned palm oil with approximately 0.03 mass % of tocopherols and exempt of carotenoids. In contrast, the solvent extraction process performed by using solvents containing about 6 mass % of water allows the maintenance of up to 99 mass % of carotenoids and about 80 mass % of tocopherols in refi ned palm oil.
5.4 NOMENCLATURE
Symbols Description Units in SI systemDimension in M, N, L, T, and θ
a UNIFAC or ASOG parameter K θA NRTL or UNIQUAC parameter K θC Number of components — —
D Number of groups of data — —
E Total mass fl ow of extract kg·s−1 M•T−1
e Mass fl ow of a component in extract kg•s−1 M•T−1
F Total mass fl ow of feed kg•s−1 M•T−1
f Mass fl ow of a component in feed kg•s−1 M•T−1
G Number of groups — —
G NRTL parameter — —
k Distribution coeffi cient — —
m Group interaction parameter — —
M Molecular weight kg•kgmol−1 M•N−1
n Group interaction parameter — —
N Number of stage — —
Q Group area parameter — —
q� Area parameter kgmol•kg N•M−1
R Group volume parameter — —
R Total mass fl ow of raffi nate kg•s−1 M•T−1
AQ11AQ11
TAF-62379-08-0606-C005.indd 258TAF-62379-08-0606-C005.indd 258 8/5/08 7:57:20 PM8/5/08 7:57:20 PM

Liquid–Liquid Extraction Applied to the Processing of Vegetable Oil 259
Symbols Description Units in SI systemDimension in M, N, L, T, and θ
R Mass fl ow of a component in raffi nate kg•s−1 M•T−1
r� Volume parameter kgmol/kg N•M−1
S Total mass fl ow of solvent kg•s−1 M•T−1
S Mass fl ow of a component in solvent kg•s−1 M•T−1
T Temperature K θU Interaction energy kg•m2•s−2•kgmol−1 M•L2•T−2•N−1
u Potential energy kg•m2•s−2•kgmol−1 M•L2•T−2•N−1
w Mass fraction — —
W Group mass fraction — —
Superscript/SubscriptC Combinatorial part — —
calc Calculated — —
ex Experimental — —
FH Size contribution — —
G Group contribution — —
I Oil phase — —
II Alcoholic phase — —
i,j,k Component — —
m,n,k,l Group — —
R Residual — —
Greek letters
α NRTL parameter — —
β Selectivity — —
φ� Volume fraction — —
γ Activity coeffi cient — —
σ Standard deviation — —
τ NRTL or UNIQUAC parameter — —
θ� Area fraction — —
5.4 REFERENCES
1. Antoniassi, R., Esteves, W., and Meirelles A. J. A. 1998. Pretreatment of corn oil for physical refi ning. Journal of the American Oil Chemists’ Society 75:1411–1415.
2. Bhosle, B. M., and Subramanian, R. 2005. New approaches in deacidifi cation of edible oils—A review. Journal of Food Engineering 69:481–494.
3. Thomopoulos, C. 1971. Méthode de desacidifi cation des huiles par solvant sélectif. Rev. Fran. Corps Gras. 18:143–150.
4. Treybal, R. E. 1963. Liquid extraction. New York: McGraw-Hill. 5. Godfrey, J. C., and Slater, M. J. 1994. Liquid-liquid extraction equipment. Chichester:
John Wiley & Sons. 6. Renon, H., and M. Prausnitz. 1968. Local compositions in thermodynamic excess func-
tions for liquid mixtures. AIChE Journal 14:135–144. 7. Abrams, D. S., and J. M. Prausnitz. 1975. Statistical thermodynamics of liquid-mixtu-
res—New expresion for excess Gibbs energy of partly or completly miscible systems. AIChE Journal 21:116–128.
AQ12AQ12
TAF-62379-08-0606-C005.indd 259TAF-62379-08-0606-C005.indd 259 8/5/08 7:57:21 PM8/5/08 7:57:21 PM
260 Extracting Bioactive Compounds for Food Products
8. Oishi, T., and J. M. Prausnitz. 1978. Estimation of solvent activities in polymer solu-tions using a group-contribution method. Industrial and Engineering Chemistry Process Design andDevelopment 17:333–339.
9. Magnussen, T., P. Rasmussen, and A. Fredenslund. 1981. Unifac parameter table for prediction of liquid-liquid equilibria. Industrial and Engineering Chemistry Process Design and Development 20:331–339.
10. Batista, E., S. Monnerat, K. Kato, L. Stragevitch, and A. J. A. Meirelles. 1999. Liquid-liquid equilibrium for systems of canola oil, oleic acid and short-chain alcohols. Journal of Chemical Engineering Data 44:1360–1364.
11. Gonçalves, C. B., E. Batista, and A. J. A. Meirelles. 2002. Liquid-liquid equilibrium data for the system corn oil + oleic acid + ethanol + water at 298.15K. Journal of Chemical Engineering Data 47:416–420.
12. Rodrigues, C. E. C., R. Antoniassi, and A. J. A. Meirelles. 2003. Equilibrium data for the system rice bran oil + fatty acids + ethanol + water at 298.2 K. Journal of Chemical Engineering Data 48:367–373.
13. Rodrigues, C. E. C., P. A. Pessôa Filho, and A. J. A. Meirelles. 2004. Phase equilib-rium for the system rice bran oil + fatty acids + ethanol + water + γ-oryzanol + tocols. Fluid Phase Equilibria 216:271–283.
14. Gonçalves, C. B., and A. J. A. Meirelles 2004. Liquid-liquid equilibrium data for the system palm oil + fatty acids + ethanol + water at 318.2K. Fluid Phase Equilibria 221:139–150.
15. Rodrigues, C. E. C., F. A. Silva, A. Marsaioli, Jr., and A. J. A. Meirelles. 2005. deacid-ifi cation of Brazil nut and macadamia nut oils by solvent extraction—Liquid-liquid equilibrium data at 298.2 K. Journal of Chemical Engineering Data 50:517–523.
16. Rodrigues, C. E. C., E. C. C. D. Reipert, A. F. Souza, P. A. Pessôa Filho, and A. J. A. Meirelles. 2005. Equilibrium data for systems composed by cottonseed oil + commer-cial linoleic acid + ethanol + water + tocopherols at 298.2 K. Fluid Phase Equilibria 238:193–203.
17. Rodrigues, C. E. C., A. Filipini, and A. J. A. Meirelles. 2006. Phase equilibrium for systems composed by high unsaturated vegetable oils + linoleic acid + ethanol + water at 298.2 K. Journal of Chemical Engineering Data 51:15–21.
18. Gonçalves, C. B., P. A. Pessôa Filho, and A. J. A. Meirelles. 2007. Partition of nutraceu-tical compounds in deacidifi cation of palm oil by solvent extraction. Journal of Food Engineering 81:21–26.
19. Rodrigues, C. E. C., E. C. D. Peixoto, and A. J. A. Meirelles. 2007. Phase equilibrium for systems composed by refi ned soybean oil + commercial linoleic acid + ethanol + water, at 323.2 K. Fluid Phase Equilibria 238:193–203.
20. Fredenslund, A., J. Gmehling, and P. Rasmussen. 1977. Vapor-liquid equilibrium using UNIFAC. Amsterdam: Elsevier.
21. Kojima, K., and T. Tochigi. 1979. Prediction of vapor-liquid equilibrium by the ASOG method. Elsevier: Amsterdam.
22. Tochigi, K., D. Tiegs, J. Gmehling, and K. Kojima. 1990. Determination of new ASOG parameters. Journal of Chemical Engineering of Japan 23:453–463.
23. Batista, E., S. Monnerat, L. Stragevitch, C. G. Pina, C. B. Gonçalves, and A. J. A. Mei-relles. 1999. Prediction of liquid-liquid equilibrium for systems of vegetable oils, fatty acids, and ethanol. Journal of Chemical Engineering Data 44:1365–1369.
24. Kang, C. H., and S. I. Sandler. 1987. Fluid Phase Equilibria 38:245–272. 25. Naphtali, L. M., and D. P. Sandholm. 1971. Multicomponent separation calculations by
linearization. AIChE Journal 17:148–153. 26. Lima, A. S., R. M. Alegre, and A. J. A. Meirelles. 2002. Partitioning of pectinolytic
enzymes in polyethylene glycol/potassium phosphate aqueous two-phase systems. Carbohydrate Polymers 50:63–68.
AQ13AQ13
TAF-62379-08-0606-C005.indd 260TAF-62379-08-0606-C005.indd 260 8/5/08 7:57:21 PM8/5/08 7:57:21 PM
Liquid–Liquid Extraction Applied to the Processing of Vegetable Oil 261
27. Marcos, J. C., L. P. Fonseca, M. T. Ramalho, and J. M. S. Cabral. 1999. Partial purifi cation of penicillin acylase from Escherichia coli in poly(-ethylene glycol)-sodium citrate aqueous two-phase systems. Journal of Chromatography B 734: 15–22.
28. Silva, L. H. M., and A. J. A. Meirelles. 2000. Phase equilibrium in polyethylene glycol/maltodextrin aqueous two-phase systems. Carbohydrate Polymers 42:273–278.
29. Silva, L. H. M., and A. J. A. Meirelles. 2000. Bovine Serum Albumin, α-lactoalbumin and β-lactoglobulin Partitioning in Polyethylene Glycol/Maltodextrin Aqueous Two-Phase Systems. Carbohydrate Polymers 42:279–282.
30. Silva, L. H. M., and A. J. A. Meirelles. 2001. Phase Equilibrium in Aqueous Mixtures of Maltodextrin with Polypropylene Glycol. Carbohydrate Polymers 46:267–274.
31. Silva, L. H. M., J. R. Coimbra, and A. J. A. Meirelles. 1997. Equilibrium behavior of poly(ethylene glycol) + potassium phosphate + water two-phase systems at various pH and temperatures. Journal of Chemical Engineering Data. 42:398–401.
32. Snyder, S. M., K. D. Cole, and D. C. Szlag. 1992. Phase compositions viscosities and densities for aqueous two-phase systems composed of polyethylene glycol and various salts at 25 °C. Journal of Chemical Engineering Data 37:268–274.
33. Coimbra, J. R., J. Thömes, and M.-R. Kula. 1994. Continuous separation of whey proteins with aqueous two-phase systems in a Graesser contactor. Journal of Chroma-tography A 668:85–94.
34. Coimbra, J. R., J. Thömes, A. J. A. Meirelles, and M.-R. Kula. 1995. Performance of a Graesser contactor in the continuous extraction of whey proteins: Mixing, mass trans-fer and effi ciency. Bioseparation 5:259–268.
35. Hustedt, H., K. H. Kroner, W. Stach, and M.-R. Kula. 1978. Procedure for Simulta-neous Large-Scale Isolation of Pullulanase and 1,4-alpha-glucan Phosphorylase from Klebsiella-Pneumoniae Involving liquid-liquid separations. Biotechnology & Bioengi-neering 20:1989–2005.
36. Albertsson, P. A. 1971. Partition of cell particles and macromolecules. New York: John Wiley.
37. Zaslavsky, B. Y. 1995. Aqueous two-phase partitioning. New York: Marcel Dekker. 38. Molyneaux, P. 1983. Water soluble synthetic polymers: Properties and behavior. Boca
Raton: CRC. 39. Persson, J., A. Kaul, and F. Tjerneld. 2000. Polymer recycling in aqueous two-phase
extractions using thermoseparating ethylene oxide-propylene oxide copolymers. Journal of Chromatography B 743:115–126.
40. Johansson, H.-O., Karlström, G., and F. Tjerneld. 1997. Temperature induced phase par-titioning of peptides in water solutions of ethylene oxide and propylene oxide random copolymers. Biochimica et Biophysica Acta 1335:315–325.
41. Monteiro Filho, E. S., J. S. R. Coimbra, L. A. Minim, L. H. M. Silva, and A. J. A. Meirelles. 2002. liquid-liquid equilibrium for ternary systems containing a sugar + a synthetic polymer + water. Journal of Chemical Engineering Data 47: 1346–1350.
42. Alves, J. G. L. F., L. D. A. Chumpitaz, L. H. M. Silva, T. T. Franco, and A. J. A. Meire-lles. 2000. Partitioning of whey proteins, bovine serum albumin and porcine insulin in aqueous two-phase systems. Journal of Chromatography B 743:235–239.
43. Kertes, A. S., and C. J. King. 1986. Extraction chemistry of fermentation product car-boxylic acids. Biotechnology & Bioengineering 28:269–82.
44. Tamada, J. A., A. S. Kertes, and King, C. J. 1990. extraction of carboxylic acids with amine extractants. 1. Equilibria and law of mass action modeling. Industrial & Engineering Chemistry Research 29:1319–1326.
45. Bizek, V., J. Horacek, R. Rericha, and M. Kousova. 1992. Amine extraction of hydro-carboxylic acids. Industrial & Engineering Chemistry Research 31:1554–1562.
TAF-62379-08-0606-C005.indd 261TAF-62379-08-0606-C005.indd 261 8/5/08 7:57:21 PM8/5/08 7:57:21 PM
262 Extracting Bioactive Compounds for Food Products
46. Prochazka, J., A. Heyberger, V. Bizek, M. Kousova, and E. Volaufova. 1994. Amine extraction of hydroxycarboxylic acids. 2. Comparison of equilibria for lactic, malic and citric acids. Industrial & Engineering Chemistry Research 33:1565–1573.
47. Juang, R. S., and R. H. Huang. 1997. Equilibrium studies on reactive extraction of lactic acid with an amine extractant. Chemical Engineering Journal 65:47–53.
48. Kirsch, T., and G. Maurer. 1997. Distribution of binary mixtures of citric, acetic and oxalic acids between water and organic solutions of tri-n-octylamine. Fluid Phase Equilibria 131:213–231.
49. Lintomen, L., R. T. P. Pinto, E. Batista, A. J. A. Meirelles., and M. R. W. Maciel. 2001. Liquid-liquid equilibrium of the water plus citric acid plus short chain alcohol plus tricaprylin system at 298.15 K. Journal of Chemical Engineering Data 46:546–550.
50. Zhang, Y., M. Valiente, and M. Muhammed. 1989. Extraction of nitric and phosphoric-acids with tributyl-phosphate. Solvent Extraction and Ion Exchange 7:173–200.
51. Ziat, K., B. Mesnaoui, T. Bounahmidi, R. Boussen, M. De la Guardia, and S. Garri-gues. 2002. Modelling of the ternary system H3PO4/H2O/TBP. Fluid Phase Equilibria 201:259–267.
52. Ziat, K., B. Mesnaoui, T. Bounahmidi, M. De la Guardia, and S. Garrigues. 2004. Liquid–liquid equilibria in the system H3PO4–KCl–H2O–tri-n-butyl phosphate: expe-riments and modeling. Fluid Phase Equilibria 224:39–46.
53. Mitchell, R. J., A. Arrowsmith, and N. Ashton. 1987. Mixed solvent systems for recov-ery of ethanol from dilute aqueous solution by liquid-liquid extraction. Biotechnology & Bioengineering 30:348–351.
54. Welsh, F. W., and R. E. Willians. 1989. The use of vegetable oils to recover com-pounds from aqueous solutions. Journal of Chemical Technology & Biotechnology 46:169–178.
55. Uslu, H. 2007. Liquid + liquid equilibria of the (water + tartaric acid + alamine 336 + organic solvents) at 298.15K. Fluid Phase Equilibria 253:12–8.
56. Yankov, D., J. Molinier, J. Albet, G. Malmaryb, and G. Kyuchoukov. 2004. Lactic acid extraction from aqueous solutions with tri-n-octylamine dissolved in decanol and dodecane. Biochemical Engineering Journal 21:63–71.
57. Arce, A., A. Marchiaro, J. M. Martínez-Ageitos, and A. Soto. 2005. Citrus essential oil deterpenation by liquid-liquid extraction. Canadian Journal of Chemical Engineering 83:366–370.
58. Cháfer, A., J. de la Torre, R. Muñoz, and M. C. Burguet, 2005. Liquid-liquid equilibria of the mixture linalool + ethanol + water at different temperatures. Fluid Phase Equi-libria 238:72–76.
59. Wolford, R. W., J. W. Kesterson, and J. A. Attaway. 1971. Physicochemical properties of citrus essential oils from Florida. Journal of Agricultural and Food Chemistry 19: 1097–1105.
60. Barth, D., G. Couchi, E. Della Porta, M. Reverchon, and M. Perrut. 1994. Desorption of lemon peel oil by supercritical carbon dioxide: Deterpenation and psoralens elimina-tion. Journal of Supercritical Fluids 7:177–183.
61. Fennema, Owen R. 1996. Food chemistry. New York: Marcel Dekker. 62. Haypek, E., L. H. M. Silva, E. Batista, D. S. Marques, M. A. A. Meireles, and A. J. A.
Meirelles. 2000. Recovery of aroma compounds from orange essential oil, Brazilian Journal of Chemical Engineering 17:705–712.
63. Frizzo, C. D., D. Lorenzo, and E. Dellacassa. 2004. Composition and seasonal varia-tion of the essential oils from two Mandarin cultivars of Southern Brazil. Journal of Agricultural and Food Chemistry 52:3036–3041.
64. Sun, D., and P. D. Petracek. 1999. Grapefruit gland oil Composition is affected by wax Application, storage temperature, and storage time. Journal of Agricultural and Food Chemistry 47:2067–2069.
TAF-62379-08-0606-C005.indd 262TAF-62379-08-0606-C005.indd 262 8/5/08 7:57:21 PM8/5/08 7:57:21 PM

Liquid–Liquid Extraction Applied to the Processing of Vegetable Oil 263
65. Wilson, C. W., III, and P. E. Shaw. 1978. Quantitative composition of cold-pressed grapefruit oil. Journal of Agricultural and Food Chemistry 26:1432–1434.
66. Francheschi, E., M. B. Grings, C. D. Frizzo, J. V. Oliveira, and C. Dariva. 2004. Phase behavior of lemon and bergamot peel oils in supercritical CO2. Fluid Phase Equilibria 226:1–8.
67. Benvenuti, F., F. Gironi, and L. Lamberti. 2001. Supercritical deterpenation of lemon essential oil, experimental data and simulation of the semicontinuous extraction pro-cess. Journal of Supercritical Fluids 20:29–44.
68. Verzera, A., A. Trozzi, M. Zappalaä, C. Condurso, and A. Cotroneo. 2005. Essential oil composition of Citrus meyerii Y. Tan. and Citrus medica L. cv. Diamante and their lemon hybrids. Journal of Agricultural and Food Chemistry 53:4890–4894.
69. Araújo, J. M. A., and A. P. F. S. Farias. 2003. Redução do Teor de Limoneno e Bergap-teno do Óleo Essencial de Bergamota Adsorvido em Sílica Gel pelo CO2–Supercrítico. Ciência e Tecnologia de Alimentos 23:112–15 (Portuguese).
70. Owusu-Yam, J., R. F. Mathews, and P. F. West. 1986. Alcohol deterpenation of orange oil. Journal of Food Science 51:1180–1182.
71. Moyler, D. A., M. A. and Stephens. 1992. Counter Current Deterpenation of Cold pressed Weet orange peel oil. Perfumer & Flavorist 17:37–38.
72. Meireles, M. A. A., and Z. L. Nikolov. 1994. Extraction and fractionation of essential oils with liquid carbon dioxide. In Spices, herbs, and edible fungi, ed. G. Charalam-bous, 171–199. Amsterdan: Elsevier Science.
73. Dugo, P., L. Mondello, K. D. Bartle, A. A. Clifford, D. G. P. A. Breen, and G. Dugo. 1995. Deterpenation of sweet orange and lemon essential oils with supercritical carbon dioxide using silica gel as an adsorbent. Flavour and Fragrance Journal 10:51–58.
74. Simões, P. C., H. A. Matos, P. J. Carmelo, E. Gomes de Azevedo, and M. Nunes da Ponte. 1995. Mass transfer in countercurrent packed columns: application to super-critical CO2 extraction of terpenes. Industrial & Engineering Chemistry Research 34:613–618.
75. Charara, Z. N., J. W. Williams, R. H. Schmidt, and M. R. Marshall. 1992. Orange fl avor absorption into various polymeric packaging materials. Journal of Food Science 57:963–972.
76. Pangborn, R. M., and G. F. Russel. 1976. Part I. Food chemistry. In Principles of food science, ed. O. R. Fennema, 427–464. New York: Marcel Dekker.
77. Antosik, M., and Stryjek, R. 1992. Liquid-liquid equilibria in ternary α-pinene + ∆3-carene + polar compound systems. Fluid Phase Equilibria 71:321–331.
78. Arce, A., A. Marchiaro, O. Rodríguez, and A. Soto. 2002. Liquid-liquid equilibria of limonene + linalool + diethylene glycol system at different temperatures. Chemical Engineering Journal 89:223–227.
79. Arce, A., A. Marchiaro, and A. Soto. 2003. Propanediols for separation of citrus oil: liquid-liquid equilibria of limonene + linalool + (1,2-propanediol or 1,3-propanediol). Fluid Phase Equilibria 211:129–140.
80. Arce, A., A. Marchiaro, and A. Soto. 2004b. Phase stability of the system limonene + linalool + 2-aminoethanol. Fluid Phase Equilibria 226:121–127.
81. Tamura, K., and H. Li. 2005. Mutual solubilities of terpene in methanol and water and their multicomponent liquid-liquid equilibria. Journal of Chemical Engineering Data 50:2013–2018.
82. Arce, A., A. Marchiaro, O. Rodríguez, and A. Soto. 2006. Essential oil terpenless by extraction using organic solvents or ionic liquids. AlChE Journal 52:2089–2097.
83. Gironi, F., I. G. Farias, and L. Lamberti. 1995. Liquid-liquid equilibria for the water + ethanol + citral and water + ethanol + limonene systems at 293 K. Journal of Chemical Engineering Data 40:578–581.
TAF-62379-08-0606-C005.indd 263TAF-62379-08-0606-C005.indd 263 8/5/08 7:57:21 PM8/5/08 7:57:21 PM
264 Extracting Bioactive Compounds for Food Products
84. Arce, A., A. Marchiaro, and A. Soto. 2004a. Liquid-liquid equilibria of linalool + etha-nol + water, water + ethanol + limonene, and limonene + linalool + water systems. Journal of Solution Chemistry 33:561–569.
85. Babdyopadhyay, C. 1989. In Frontiers of applied chemistry, ed. A. Biswas, 206–221. New York: Springer-Verlag.
86. Broderick, J. 1995. Manufacturing chemistry 25:112–114. 87. Massaldi, H. A., and C. J. King. 1973. Simple technique to determine solubilities of
sparingly soluble organics; solubility and activity coeffi cients of d-limonene, n-butyl-benzene, and n-hexyl acetate in water and sucrose solutions. Journal of Chemical Engi-neering Data 18:393–397.
88. Cháfer, A., R. Muñoz, M. C. Burguet, and A. Berna. 2004. The infl uence of the tem-perature on the liquid-liquid Equilibria of the mixture linalool + ethanol + H2O. Fluid Phase Equilibria 224:251–256.
89. Baryeh, E. A. 2000. Effects of palm oil processing parameters on yield. Journal of Food Engineering 48:1–6.
90. Resa, J. M., C. González, M. A. Fanega, S. Ortiz de Landaluce, and J. Lanz. 2002. Enthalpies of mixing, heat capacities, and viscosities of alcohol (C1–C4) + olive oil mixtures at 298.15 K. Journal of Food Engineering 51:113–118.
91. Leibovitz, Z., and C. Ruckenstein. 1983. Our experiences in processing maize (corn) germ oil. Journal of the American Oil Chemists’ Society 60:347A–351A.
92. Cvengros, J. 1995. Physical refi ning of edible oils. Journal of the American Oil Chem-ists’ Society 72:1193–1196.
93. Apelblat, A., T. Zaharoskin, J. Wisniak, and E. Korngold. 1996. Extraction of oleic acid from soybean oil and jojoba oil—Phase diagrams. Journal of the American Oil Chem-ists’ Society 73:239–244.
94. Pina, C. G., and A. J. A. Meirelles. 2000. Deacidifi cation of corn oil by solvent extrac-tion in a perforated rotating disc column. Journal of the American Oil Chemists’ Soci-ety 77:553–559.
95. Bollmann, H. 1921. Process for the removal of fatty acids, resins, bitter and mucilagi-nous substances from fats and oils. US patent, US19211371342.
96. van Dijck, W. J. G. 1942. US patent, US19422268786. 97. Bertholet, R. 2000. Process for refi ning fatty substances. WO20009637. 98. Swoboda, P. A. T. 1985. Refi ning of palm oils. GB19852144143. 99. Bhattacharyya, A. C., S. Majumdar, and D. K. Bhattacharyya. 1987. Refi ning of
FFA rice bran oil by isopropanol extraction and alkali neutralization. Oléagineaux 42:431–433.
100. Shah, K. J., and T. K. Venkatesan. 1989. Aqueous isopropyl alcohol for extraction of free fatty acids from oils. Journal of the American Oil Chemists’ Society 66:783–787.
101. Kim, S., C. Kim, H. Cheigh, and S. Yoon. 1985. Effect of caustic refi ning, solvent refi n-ing and steam refi ning on the deacidifi cation and color of rice bran oil. Journal of the American Oil Chemists’ Society 62:1492–1495.
102. Kale, V., S. P. R. Katikaneni, and M. Cheryan. 1999. Deacidifying rice brain oil by solvent extraction and membrane technology. Journal of the American Oil Chemists’ Society 76:723–727.
103. Turkay, S., and H. Civelekoglu. 1991. Deacidifi cation of sulfur olive oil. l. Single stage liquid-liquid extraction of miscella with ethyl alcohol. Journal of the American Oil Chemists’ Society 68:83–86.
104. Fachini, S., and S. Samazzi. 1925. Behavior of alcohol in presence of olive oil which is acid. Industria Olii e dei Grassi 4:31–33.
105. Schlenker, E. 1931. Removal of fatty acids by means of alcohol. Chemische Umschau—Fette, Oele, Wachse, und Harse 38:108–110.
106. Sreenivasan, K., and D. S. Viswanath. 1973. Refi ning of cottonseed oil using solvents. Indian Journal of Technology 11:83–90.
TAF-62379-08-0606-C005.indd 264TAF-62379-08-0606-C005.indd 264 8/5/08 7:57:22 PM8/5/08 7:57:22 PM

Liquid–Liquid Extraction Applied to the Processing of Vegetable Oil 265
107. Rius, A., and J. M. Martínez-Moreno. 1947. Diagramas de Solubilidad para la Desaci-difi cacion con Disolventes del Aceite de Oliva. Anales Fisica y Quimica 123–148.
108. Rius, A., and M. A. Crespi. 1951. Desacidifi cacion de Aceites Vegetales por Extraccion com Disolventes. Anales de la Real Socidad Espinolade Fisica y Quimica 4:243–256.
109. Rigamonti R., C. Vaccarino, and A. Duzzi 1951. Sistemi Ternari tra Acido Oleico, Tri-oleina ed Alcoli. Applicazione alla Disacidazione degli Oli Vegetali. Chimica e Indu-stria 10:619–623.
110. Rigamonti, R., and G. Botto. 1958. Équilibres de Solubilité entre Huile de Coton, Acé-tone et Eau. Oléagineux 1:199–202.
111. Rodrigues, C. E. C., Onoyama, M. M., and A. J. A. Meirelles. 2006. Optimization of the rice bran oil deacidifi cation process by liquid-liquid extraction. Journal of Food Engineering 73:370–378.
112. Elmadfa, I., and W. Bosse. 1985. Vitamin E–Eigenschaften, Wirkungsweise und ther-apeutische Bedeutung. Stuttgart, Germany: Wissenschaftliche Verlagsgesellschaft mbH.
113. Nogala-Kalucka, M., M. Gogolewski, and E. Swiatkiewicz. 1993. Changes in the com-position of tocopherols and fatty acids in post deodorisation condensates during refi n-ing various oils. Fat Science Technology 95:144–147.
114. Terao, J., and S. Matsushita. 1989. Fatty acid oxidation by singlet oxygen. Journal of Food Processing and Preservation 13:329–337.
115. Gogolewski, M., M. Nogala-Kałucka, and M. Szeliga. 2000. Changes of the tocopherol and fatty acid contents in rapeseed oil during refi ning. European Journal of Lipid Sci-ence and Technology 102:618–623.
116. Sawicki, J., and H. Niewiadomski. 1970. Study of the composition of the rapeseed oil deodorizer. scum. Zesz. Probl. Post. Nauk. Roln. 91:237–277.
117. Harris, L. P., and N. D. Embree. 1963. Qualitative consideration of the effect of PUFA content in the diet upon requirement for vitamin E. American Journal of Clinical Nutrition 13:385–387.
118. Horwitt, M. K. 1962. Interaction between vitamin E and polyunsaturated fatty acids in adult men. Vitamins and Hormones 20:541–546.
119. Deckere, E. A. M., and O. Korver. 1996. Minor constituents of rice bran oil as func-tional foods. Nutrition Review 54:120S–126S.
120. Eitenmiller, R. R. 1997. Vitamin E content of fats and oils: Nutritional implications. Food Technology 51:78–81.
121. Kim, J., J. Godber, J. King, and W. Prinyawiwatkul. 2001. Inhibition of cholesterol autoxidation by the nonsaponifi able fraction in rice bran in an aqueous model system. Journal of the American Oil Chemists’ Society 78:685–689.
122. Qureshi, A. A., B. A. Bradlow, W. A. Salser, and L. D. Brace. 1997. Novel tocotrienols of rice bran modulate cardiovascular disease risk parameters of hypercholesterolemic humans. Journal of Nutritional Biochemistry 8:290–298.
123. Xu, Z., and J. S. Godber. 1999. Purifi cation and identifi cation of components of γ-ory-zanol in rice bran oil. Journal of Agricultural and Food Chemistry 47:2724–2728.
124. Soystats. 2007. http://www.soystats.com/2007/Default-frames.htm (accessed July 14. 2008).
125. Nogala-Kalucka, M., and M. Gogolewski. 1995. Qualitative und quantitative Änder-ungen von Tocopherolen und von Raps- und Sojaölen—roh und raffi niert. Ernährung 19:537–538.
126. Schuler, P. 1990. Natural antioxidants exploited commercially. In Food antioxidants, ed. B. F. J. Hudson. London: Elsevier.
127. Davidek, J., J. Valisek, and J. Pokorny. 1990. Chemical changes during food process-ing. Oxford: Elsevier.
128. Bermond, P. 1990. Biological effects of food antioxidants. In Food antioxidants, ed. B. F. J. Hudson. London: Elsevier.
AQ14AQ14
AQ15AQ15
TAF-62379-08-0606-C005.indd 265TAF-62379-08-0606-C005.indd 265 8/5/08 7:57:22 PM8/5/08 7:57:22 PM

266 Extracting Bioactive Compounds for Food Products
129. Tasan, M., and M. Demirci. 2005. Total and individual tocopherol contents of sun-fl ower oil at different steps of refi ning. European Food Research and Technology 220:251–254.
130. Karabulut, I., A. Topcu, A. Yorulmaz, A. Tekin, and D. S. Ozay. 2005. Effects of the industrial refi ning process on some properties of hazelnut oil. European Journal of Lipid Science and Technology 107:476–480.
131. MacCaskill, D. R., and F. Zhang,1999. Use of rice bran oil in foods. Food Technology 53:50–52.
132. van Hoed, V., G. Depaemelaere, J. Vila Ayala, P. Santiwattana, R. Verhé, and W. De Greyt. 2006. Infl uence of chemical refi ning on the major and minor components of rice bran oil. Journal of the American Oil Chemists’ Society 83:315–321.
133. Baharin, B. S., Y. B. Man, and R. A. Rahman. 2001. The effect of carotene extraction system on crude palm oil quality, carotene composition, and carotene stability during storage. Journal of the American Oil Chemists’ Society 78:851–855.
134. Wrona, M., W. Korytowski, M. Roznowska, T. Sarna, and T. G. Truscott. 2003. Coop-eration of antioxidants in protection against photosensitized oxidation. Free Radical Biology & Medicine 35:1319–1329.
135. Rossi, M., M. Gianazza, C. Alamprese, and F. Stanga. 2001. The effect of bleaching and physical refi ning on color and minor components of palm oil. Journal of the Ameri-can Oil Chemists’ Society 78:1051–1055.
136. Basiron, Y. 2005. Edible oils and fat products: Edible oils. Palm oil. In Bailey’s indus-trial oil and fat products, ed. F. Shahidi, 333–429. Hoboken, NJ: John Wiley and Sons.
137. Piironen, V., D. G. Lindsay, T. A. Miettinen, J. Toivo, and A. Lampi. 2000. Review: Plant sterols: Biosynthesis, biological function and their importance to human nutri-tion. Journal of the Science of Food and Agriculture 80:939–966.
138. Shin, T. S., J. S. Godber, D. E. Martin, and J. H. Wells. 1997. Hydrolytic stability and change in E vitamers and oryzanol of extruded rice bran during storage. Journal of Food Science 62:704–708.
139. Rukmini, C. 1988. Chemical, nutricional and toxicological studies of rice bran oil. Food Chemistry 30:257–268.
140. Orthoefer, F. T. 1996. Rice bran oil: Healthy lipid source. Food Technology 50:62–64. 141. Rong, N., L. M. Ausman, and R. J. Nicolosi. 1997. Oryzanol decreases cholesterol
absorption and aortic fatty streaks in hamsters. Lipids 32:303–309. 142. Nakayama, S., A. Manabe, J. Suzuki, K. Sakamoto, and T. Inagake. 1987. Comparative
effects of two forms of ç-oryzanol in different sterol compositions on hyperlipidemia induced by cholesterol. Japanese Journal of Pharmacology 44:135–143.
143. Akihisa, T., K. Yasukawa, M. Yamaura, et al. 2000. Triterpene alcohol and sterol feru-lates from rice bran and their antiinfl ammatory effects. Journal of Agricultural and Food Chemistry 48:2313–2319.
144. Xu, Z. M., N. Hua, and J. S. Godber. 2001. Antioxidant activity of tocopherols, toco-trienols, and g-oryzanol COmponents from rice bran against cholesterol oxidation accelerated by 2,2¢-azobis( 2-methylpropionamidine) dihydrochloride. Journal of Agricultural and Food Chemistry 49:2077–2081.
145. Igbal, J., M.Minhajuddin, and Z. H. Beg. 2003. Suppression of 7,12-dimethylbenz[a]anthracene-induced carcinogenesis and hypercholesterolaemia in rats by tocotri-enol-rich fraction isolated from rice bran oil. European Journal of Cancer Prevention 12:447–53.
146. Narayana, T., B. Kaimal, S. R. Vali, et al. 2002. Origin of problems encountered in rice bran oil Processing. European Journal of Lipid Science and Technology 104:203–211.
147. Yoon, S H., and S. K. Kim. 1994. Oxidative stability of high-fatty acid rice bran oil at dif-ferent stages of refi ning. Journal of the American Oil Chemists’ Society 71:227–229.
TAF-62379-08-0606-C005.indd 266TAF-62379-08-0606-C005.indd 266 8/5/08 7:57:22 PM8/5/08 7:57:22 PM

Liquid–Liquid Extraction Applied to the Processing of Vegetable Oil 267
148. Krishna, A. G. G., S. Khatoon, P. M. Sheila, C. V. Sarmandal, T. N. Indira, and A. Mishra. 2001. Effect of refi ning of crude rice bran oil on the retention of oryzanol in the refi ned oil. Journal of the American Oil Chemists’ Society 78:127–131.
149. Orthoefer, F. T. 2005. Edible oils and fat products: Edible oils. Rice bran oil. In Bailey’s industrial oil and fat products, ed. F. Shahidi, 465–489. Hoboken, NJ: John Wiley and Sons.
150. Cherukuri, R. S. V., R. Cheruvanky, I. Lynch, and D. L. McPeak. 1999. Process for obtaining micronutrient enriched rice bran oil. US19995985344.
151. Abidi, S. L., S. Thiam, and I. M. Warner. 2002. Elution behavior of unsaponifi able lip-ids with various capillary electrochromatographic stationary phases. Journal of Chro-matography A 949:195–207.
152. American Oil Chemists’ Society. 1988. Offi cial Methods and Recommended Practices of the American Oil Chemists’ Society, vols. 1–2, 3rd ed., Champaign: AOCS.
TAF-62379-08-0606-C005.indd 267TAF-62379-08-0606-C005.indd 267 8/5/08 7:57:22 PM8/5/08 7:57:22 PM

AUTHOR QUERIES
AQ1: Is “position 2” correct here?AQ2: Please confi rm sentence change.AQ3: Variables have been made italic throughout.AQ4: Is “system” correct here? If not, please change to another noun.AQ5: Do you mean “composed”?AQ6: Please confi rm change to adjective.AQ7: Please confi rm Equation 5.8 meant here.AQ8: Please confi rm sentence change.AQ9: References 107 through 153 were renumbered in text and in the list because
refs 107 and 108 were duplicated. Ref 108 was deleted. Is it OK to include the (new) Reference 110 here (your Ref 111); citation could not be located in text.
AQ10: Is Figure 5.1 cite here correct?AQ11: Do you mean “extracted from the alcoholic phase”?AQ12: Please spell out journal name.AQ13: Please provide article title.AQ14: Volume number?AQ15: Please spell out journal name.
TAF-62379-08-0606-C005.indd 268TAF-62379-08-0606-C005.indd 268 8/5/08 7:57:22 PM8/5/08 7:57:22 PM