5. oak ridge national laboratory - energy.gov 2017 aser_ch 5 … · figure 5.2. production of...
TRANSCRIPT

Oak Ridge National Laboratory 5-1
5. Oak Ridge National Laboratory
Oak Ridge National Laboratory (ORNL) is the largest US Department of Energy (DOE) science and energy laboratory. Basic and applied research at ORNL delivers transformative solutions to compelling problems in energy and security.
Diverse capabilities at ORNL span a broad range of scientific and engineering disciplines, enabling the exploration of fundamental science challenges and the research needed to accelerate the delivery of solutions to the marketplace. ORNL supports DOE’s national missions of scientific discovery, clean energy, and security through four major areas:
• Neutrons—The Spallation Neutron Source and the High Flux Isotope Reactor, two of the world’s leading neutron sources, are operated at ORNL, enabling scientists and engineers to gain new insights into materials and biological systems.
• Computing—ORNL programs accelerate scientific discovery through modeling and simulation on powerful supercomputers and advance data-intensive science and US leadership in high-performance computing.
• Materials—Basic research and applied research are integrated at ORNL to develop advanced materials for energy applications.
• Nuclear—ORNL programs advance the scientific basis for 21st century nuclear fission and fusion technologies and systems and produce isotopes for research, industry, and medicine.
In addition, nine world-class facilities that support ORNL’s research and development activities are also available to users from universities, industry, and other institutions:
• Building Technologies Research and Integration Center • Carbon Fiber Technology Facility • Center for Nanophase Materials Sciences • Center for Structural Molecular Biology • High Flux Isotope Reactor • Manufacturing Demonstration Facility • National Transportation Research Center • Oak Ridge Leadership Computing Facility • Spallation Neutron Source
ORNL is managed by UT-Battelle, LLC, a partnership between the University of Tennessee and Battelle Memorial Institute. Other DOE contractors conducting activities at ORNL in 2017 included North Wind Solutions, LLC; URS | CH2M Oak Ridge LLC; and Isotek Systems LLC. During 2017 activities of these contractors were conducted to comply with contractual and regulatory environmental requirements.
Because of differing permit-reporting requirements and instrument capabilities, various units of measurement are used in this report. The information found in “Units of Measure and Conversion Factors” is intended to help readers convert numeric values presented here as needed for specific calculations and comparisons.
Oak Ridge Reservation Annual Site Environmental Report—2017
Oak Ridge National Laboratory 5-2
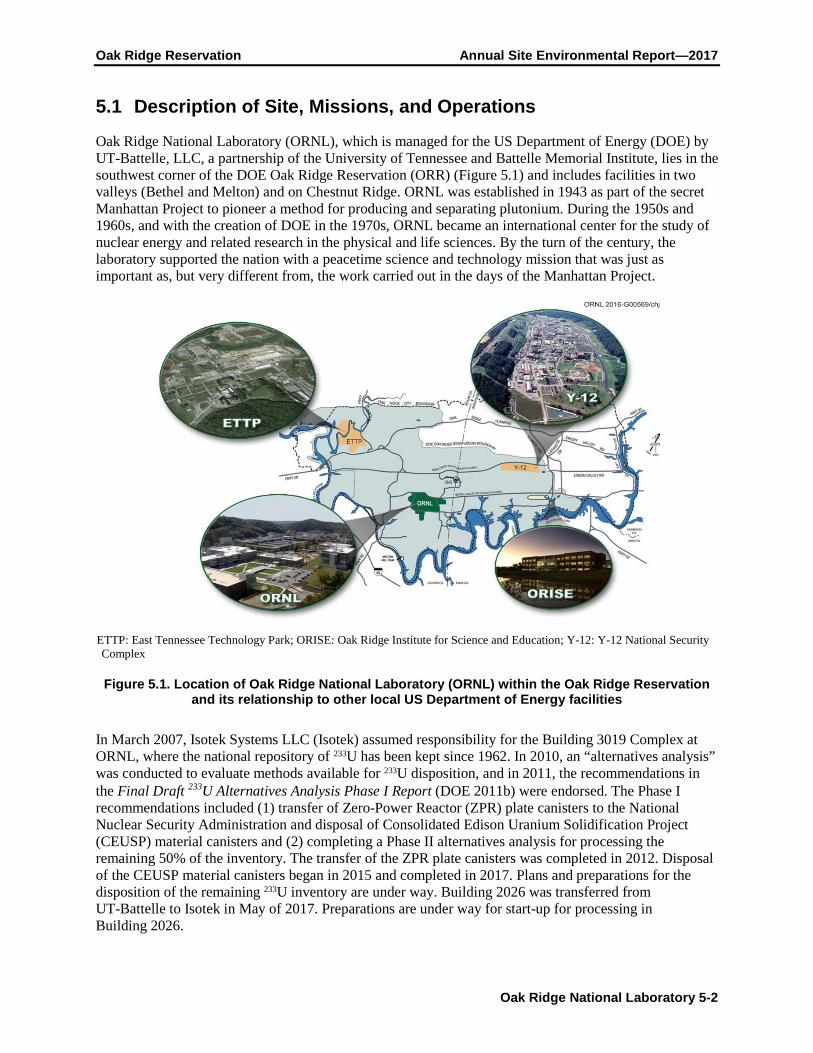
5.1 Description of Site, Missions, and Operations Oak Ridge National Laboratory (ORNL), which is managed for the US Department of Energy (DOE) by UT-Battelle, LLC, a partnership of the University of Tennessee and Battelle Memorial Institute, lies in the southwest corner of the DOE Oak Ridge Reservation (ORR) (Figure 5.1) and includes facilities in two valleys (Bethel and Melton) and on Chestnut Ridge. ORNL was established in 1943 as part of the secret Manhattan Project to pioneer a method for producing and separating plutonium. During the 1950s and 1960s, and with the creation of DOE in the 1970s, ORNL became an international center for the study of nuclear energy and related research in the physical and life sciences. By the turn of the century, the laboratory supported the nation with a peacetime science and technology mission that was just as important as, but very different from, the work carried out in the days of the Manhattan Project.
ETTP: East Tennessee Technology Park; ORISE: Oak Ridge Institute for Science and Education; Y-12: Y-12 National Security Complex
Figure 5.1. Location of Oak Ridge National Laboratory (ORNL) within the Oak Ridge Reservation and its relationship to other local US Department of Energy facilities
In March 2007, Isotek Systems LLC (Isotek) assumed responsibility for the Building 3019 Complex at ORNL, where the national repository of 233U has been kept since 1962. In 2010, an “alternatives analysis” was conducted to evaluate methods available for 233U disposition, and in 2011, the recommendations in the Final Draft 233U Alternatives Analysis Phase I Report (DOE 2011b) were endorsed. The Phase I recommendations included (1) transfer of Zero-Power Reactor (ZPR) plate canisters to the National Nuclear Security Administration and disposal of Consolidated Edison Uranium Solidification Project (CEUSP) material canisters and (2) completing a Phase II alternatives analysis for processing the remaining 50% of the inventory. The transfer of the ZPR plate canisters was completed in 2012. Disposal of the CEUSP material canisters began in 2015 and completed in 2017. Plans and preparations for the disposition of the remaining 233U inventory are under way. Building 2026 was transferred from UT-Battelle to Isotek in May of 2017. Preparations are under way for start-up for processing in Building 2026.

Oak Ridge Reservation Annual Site Environmental Report—2017
Oak Ridge National Laboratory 5-3
UT-Battelle provides air and water quality monitoring support for the Building 3019 complex; results are included in the UT-Battelle air and water monitoring discussions in this chapter.
URS | CH2M Oak Ridge LLC (UCOR) is the DOE ORR cleanup contractor. The scope of UCOR activities at ORNL includes long-term surveillance, maintenance, and management of inactive waste disposal sites, structures, and buildings such as former reactors and isotope production facilities. Other activities include groundwater monitoring, transuranic (TRU) waste storage, and operation of the wastewater treatment facility and the waste-processing facility for liquid low-level radioactive waste (LLW).
As of December 11, 2015, North Wind Solutions, LLC, (NWSol) has been the prime contractor for the Transuranic Waste Processing Center (TWPC), which is located on the western boundary of ORNL on about 26 acres of land adjacent to the Melton Valley Storage Tanks along State Route 95. TWPC’s mission is to receive TRU wastes for processing, treatment, repackaging, and shipment to designated facilities for final disposal. TWPC consists of the waste-processing facility, the personnel building, and numerous support buildings and storage areas. TWPC began processing supernatant liquid from the Melton Valley Storage Tanks in 2002, contact-handled (CH) debris waste in December 2005, and remotely handled (RH) debris waste in May 2008. Based on the definition of TRU waste, some waste being managed as TRU is later determined to be LLW or mixed LLW. UT-Battelle provides water quality monitoring for operations at the TWPC, and results are included in water-monitoring discussions in this chapter. Air-monitoring data from TWPC are provided to UT-Battelle for inclusion in the ORR National Emission Standards for Hazardous Air Pollutants for Radionuclides (Rad-NESHAPs) annual report and is incorporated into air-monitoring discussions in this chapter.
UT-Battelle manages several facilities located off the main ORNL campus for DOE. The Hardin Valley Campus (HVC) is home to the National Transportation Research Center (NTRC) and the Manufacturing Demonstration Facility (MDF). HVC is located on a 6 acre site owned by Pellissippi Investors, LLC, and is leased to UT-Battelle and the University of Tennessee. Approximately 152 industry partners work at the HVC to shape America’s mobility future. NTRC is DOE’s only user facility dedicated to transportation and serves as the gateway to UT-Battelle’s comprehensive capabilities for transportation research and development (R&D). Research focuses on fuels and lubricants, engines, emissions, electric drive technologies, lightweight and power-train materials, vehicle systems integration, energy storage and fuel cell technologies, vehicle cyber security, and intelligent transportation systems.
MDF focuses on advanced manufacturing research, including the development of carbon fiber composites and additive manufacturing involving polymers, metal wires, and metal powders. The facility hosts the Institute for Advanced Composites Manufacturing Innovation lab space and an outreach program for local high school students.
The Carbon Fiber Technology Facility (CFTF), a leased 42,000 ft2 innovative technology facility located in the Horizon Center Business Park, offers a flexible, highly instrumented carbon fiber line for demonstrating the scalability of advanced carbon fiber technology and for producing market-development volumes of prototypical carbon fibers (Figure 5.2). CFTF is the world’s most capable open-access facility for the scale-up of emerging carbon fiber technology. The cost of carbon fiber material remains relatively high, prohibiting widespread adoption of carbon fiber–containing composite materials in the automotive manufacturing industry, which requires lower commodity pricing. The lower-cost carbon fiber produced at ORNL meets the performance criteria prescribed by some automotive manufacturers for carbon fiber materials for use in high-volume vehicle applications.
UT-Battelle also manages several buildings and trailers located at the Y-12 National Security Complex (Y-12) and in the city of Oak Ridge.

Oak Ridge Reservation Annual Site Environmental Report—2017
Oak Ridge National Laboratory 5-4
Photo by Jason Richards.
Figure 5.2. Production of lower-cost carbon fiber at the Carbon Fiber Technology Facility
5.2 Environmental Management Systems Demonstration of environmental excellence through high-level policies that clearly state expectations for continual improvement, pollution prevention, and compliance with regulations and other requirements is a priority at ORNL. In accordance with DOE Order 436.1, Departmental Sustainability (DOE 2011), UT-Battelle, NWSol, UCOR, and Isotek have implemented environmental management systems (EMSs), modeled after International Organization for Standardization (ISO) 14001 (ISO 2015), to measure, manage, and control environmental impacts. An EMS is a continuing cycle of planning, implementing, evaluating, and improving processes and actions undertaken to achieve environmental goals.
5.2.1 UT-Battelle Environmental Management System
UT-Battelle’s EMS is designed to fully comply with all applicable requirements and to continually improve ORNL’s environmental performance. Throughout 2017, UT-Battelle was registered to the ISO 14001:2015 standard and had maintained ISO 14001 registration since 2004.
UT-Battelle’s EMS is a fully integrated set of environmental management services for UT-Battelle activities and facilities. Services include pollution prevention, waste management, effluent management, regulatory review, reporting, permitting, and other environmental management programs. Through the UT-Battelle Standards-Based Management System (SBMS), the EMS establishes environmental policy and translates environmental laws, applicable DOE orders, and other requirements into laboratory-wide subject area documents (procedures and guidelines). Through environmental protection officers, environmental compliance representatives, and waste services representatives (WSRs), the UT-Battelle EMS assists the line organizations in identifying and addressing environmental issues in accordance with SBMS requirements.
5.2.1.1 Integration with the Integrated Safety Management System The objective of the UT-Battelle Integrated Safety Management System (ISMS) is to systematically integrate environment, safety, and health (ES&H) requirements and controls into all work activities and to ensure protection of the workers, the environment, and the public. The UT-Battelle EMS and the ISMS are integrated to provide a unified strategy for the management of resources, the control and attenuation of risks, and the establishment and achievement of the organization’s ES&H goals. Guided by the ISMS and EMS, UT-Battelle strives for continual improvement through “plan-do-check-act” cycles. Under the

Oak Ridge Reservation Annual Site Environmental Report—2017
Oak Ridge National Laboratory 5-5
ISMS, the term “safety” also encompasses ES&H, including pollution prevention, waste minimization, and resource conservation. Therefore, the guiding principles and core functions in the ISMS apply both to the protection of the environment and to safety. Figure 5.3 depicts the relationship between the EMS and the ISMS. The UT-Battelle EMS is consistent with the ISMS and includes all the elements in the ISO 14001:2015 standard.
Figure 5.3. The relationship between the UT-Battelle Environmental Management System and the
Integrated Safety Management System
5.2.1.2 UT-Battelle Environmental Policy for Oak Ridge National Laboratory UT-Battelle’s Environmental Policy for ORNL clearly states expectations and provides the framework for setting and reviewing environmental objectives.
5.2.1.3 Planning UT-Battelle Environmental Aspects Environmental aspects are elements of an organization’s activities, products, or services that can interact with the environment. Environmental aspects associated with UT-Battelle activities, products, and services have been identified at both the project and activity level. Activities that are relative to any of the aspects are carefully controlled to minimize or eliminate impacts to the environment. Nine environmental aspects have been identified as potentially having significant environmental impacts.
UT-Battelle Legal and Other Requirements Legal and other requirements that apply to the environmental aspects identified by UT-Battelle include federal, state, and local laws and regulations; environmental permits; applicable DOE orders; UT-Battelle contract clauses; waste acceptance criteria; and voluntary requirements such as ISO 14001:2015. UT-Battelle has established procedures to ensure that all applicable requirements are reviewed and that changes and updates are communicated to staff and are incorporated into work-planning activities. UT-Battelle’s environmental compliance status is discussed in Section 5.3.

Oak Ridge Reservation Annual Site Environmental Report—2017
Oak Ridge National Laboratory 5-6
UT-Battelle Objectives To improve environmental performance, UT-Battelle establishes objectives and performance indicators for appropriate functions and activities. Laboratory-level environmental objectives are documented in the annual Site Sustainability Plan. Line organization objectives are developed annually, entered into a commitment tracking system, and tracked to completion. In all cases, the objectives and performance indicators are consistent with the UT-Battelle Policy for ORNL, are supportive of the laboratory mission, and where practical, they are measurable.
UT-Battelle Programs UT-Battelle has established an organizational structure to ensure that environmental stewardship practices are integrated into all facets of UT-Battelle’s missions at ORNL. Programs led by experts in environmental protection and compliance, energy and resource conservation, pollution prevention, and waste management ensure that laboratory activities are conducted in accordance with the environmental policy (see Section 5.2.1.2). Information on UT-Battelle’s 2017 compliance status, activities, and accomplishments is presented in Section 5.3.
The environmental protection staff provide critical support services in the following areas:
• waste management; • National Environmental Policy Act (NEPA) compliance; • air quality compliance; • water quality compliance; • US Department of Agriculture (USDA) compliance; • transportation safety; • environmental sampling and data evaluation; and • Comprehensive Environmental Response, Compensation, and Liability Act (CERCLA) interface.
UT-Battelle’s staff also include subject matter experts who provide critical waste management, transportation, and disposition support services to research, operations, and support divisions:
• pollution prevention staff, who manage recycling programs, work with staff to reduce waste generation and to promote sustainable acquisition;
• radiological engineering staff, who provide radiological characterization support to generators and WSRs, develop tools to help ensure compliance with facility safety and transportation, and provide packaging support;
• waste acceptance and disposition staff, who review and approve waste characterization methods, accept waste from generator areas into Transportation and Waste Management Division storage areas, review waste disposal paperwork to ensure compliance with the disposal facility’s waste acceptance criteria, certify waste packages, and coordinate off-site disposition of UT-Battelle’s newly generated waste;
• WSRs, who provide technical support to waste generators to properly manage waste by assisting in identifying, characterizing, packaging, and certifying wastes for disposal;
• the waste-handling team, which performs waste-packing operations and conducts inspections of waste items, areas, and containers;
• the transportation management team, which ensures that both the on-site and off-site packaging and transportation activities are performed in an efficient and compliant manner; and

Oak Ridge Reservation Annual Site Environmental Report—2017
Oak Ridge National Laboratory 5-7
• the hazardous material spill response team, which is the first line of response to hazardous materials spills at ORNL and controls and contains spills until the situation is stabilized.
5.2.1.4 UT-Battelle Sustainable Campus Initiative The UT-Battelle Sustainable Campus Initiative (SCI) for ORNL was launched in 2008 and has a 10 year history of promoting a proven holistic approach to the support of sustainable operations and employee engagement. Many of the SCI Roadmaps were revised in fiscal year (FY) 2015 to address Executive Order (EO) 13693 (EO 2015). The DOE annual Site Sustainability Plan (SSP) guidance reevaluated target dates and reduction goals to align with current federal and agency directives, including EO 13693. The DOE Headquarters Sustainability Performance Office (SPO) and the Office of Science (SC) work together to update SSP goals and to provide guidance to ensure that each DOE location reports annual performance data in a consistent manner through the web-based SPO Dashboard Reporting System. ORNL maintains a website where current and past SSPs can be found. Most SSP goals are now oriented toward a 2025 target date. In 2017 the SCI (through the SPO Dashboard and other reporting mechanisms) provided performance updates on a broad range of sustainability topics at ORNL, such as water and energy use, waste management, and the reduction of greenhouse gas (GHG) emissions.
FY 2017 SSP Performance Summary Data for Energy, Water, and Waste In FY 2017 ORNL was again resolute in its commitment to sustainable operations and the reduction of GHG emissions wherever possible while remaining diligent in pursuing its mission to provide valuable solutions to the nation’s energy and security challenges. ORNL efforts to reduce energy use intensity (EUI) and water use intensity (WUI) and to divert municipal solid waste and construction and demolition (C&D) debris have remained on track with SSP target dates and reduction percentage goals.
In FY 2017 ORNL installed 18 new advanced utility meters across all utilities, including electrical, steam, chilled water, natural gas, and potable water. The meters were connected to a central energy data system that enables meter data trend analysis, report generation, data export for other analyses, and data archival. Better energy and water data will develop as more ORNL buildings deploy advanced meter technologies.
Energy Use Intensity Based on FY 2017 performance data, ORNL achieved an EUI reduction of 7.4% from the FY 2015 baseline and is on target to meet the DOE/SSP reduction goal of 25% by FY 2025 (Figure 5.4). To maintain steady progress toward this goal, ORNL focuses on energy-efficient and sustainable design in new construction projects as well as smart repurposing of existing facilities and a drive for continuous improvement in facility and utility operations. Initiatives in FY 2017 included new approaches to energy consumption awareness using data visualization and reporting. Building data analytics, including fault detection and diagnostics, are also being added to ORNL’s energy conservation tools.
Water Use Intensity EO 13693 established a potable water consumption reduction goal of 36% by 2025 through reductions of 2% annually relative to baseline consumption in 2007. A cumulative reduction in WUI of 24% was realized at ORNL between 2007 and 2017 by means of an aggressive approach that includes repairing leaks and replacing old lines in the site water distribution system and eliminating once-through cooling where possible. Water reduction at ORNL is on target to meet or exceed the 2025 goal (Figure 5.5).

Oak Ridge Reservation Annual Site Environmental Report—2017
Oak Ridge National Laboratory 5-8
Image adapted from DOE 2017a. Oak Ridge National Laboratory FY 2018 Site Sustainability Plan with FY 2017 Performance Data. US Department of Energy Sustainability Performance Office, Washington, DC.
Figure 5.4. ORNL energy use intensity reduction compared with the target goal per Executive Order 13693, “Planning for Federal Sustainability in the Next Decade,” March 25, 2015
Image adapted from DOE 2017a. Oak Ridge National Laboratory FY 2018 Site Sustainability Plan with FY 2017 Performance Data. US Department of Energy Sustainability Performance Office, Washington, DC.
Figure 5.5. ORNL water use intensity reduction compared with the target goal per Executive Order 13693, “Planning for Federal Sustainability in the Next Decade,” and DOE Order 430.2B,
Departmental Energy, Renewable Energy, and Transportation Management
Waste Diversion. The diversion rate for municipal solid waste at ORNL was 44% in FY 2017, slightly less than the DOE goal of 50%. The diversion rate for C&D materials and debris (76%) exceeded the DOE goal of 50%.

Oak Ridge Reservation Annual Site Environmental Report—2017
Oak Ridge National Laboratory 5-9
Pollution Prevention. UT-Battelle implemented 24 new pollution prevention projects and ongoing reuse/recycle projects at ORNL during 2017, eliminating more than 6.5 million kg of waste. Source reduction actions pursued in 2017 included continued deployment of paperless work processes and resource-efficient computing. Recycling efforts included paper, scrap metal, wood pallets, carpet, drums, electronics, and C&D debris.
Sustainable Vehicle Fleet The vehicle fleet at ORNL includes 63 flexible fuel vehicles and 5 plug-in hybrid sedans, which also use alternative fuels.
Fleet Fuel Savings. Fuel data for FY 2017 show a 32% decrease in petroleum consumption at ORNL since 2005, the baseline year established by DOE. This decrease exceeds the DOE cumulative target of a 20% reduction. In addition, ORNL alternative fuel use has increased from the 2005 baseline by 70%, exceeding the target. Overall, 72% of the fleet can use alternative fuel.
Electric Vehicles. Over the past 5 years, 47 electric vehicle (EV) charging stations have been installed on the ORNL campus. The stations are available for charging of both personal and government fleet vehicles. ORNL began purchasing plug-in hybrid electric vehicles (PHEVs) in FY 2013 and now has a total of five PHEVs in the fleet. Due to lack of funding, no PHEVs were purchased in FY 2017.
Sustainable Buildings In FY 2017, ORNL’s high-performance sustainable building (HPSB) inventory included a total of 20 buildings, or 15% (which meets the 2017 interim target) of the total applicable site buildings according to the Guiding Principles for Sustainable Federal Buildings and Associated Instructions (CEQ 2016).
Employing a systematic approach to identifying HPSB candidates and applying the guiding principles has been an effective way to ensure continued progress. HPSB candidates have been identified based on building space use, existing metering infrastructure, and known energy-conservation opportunities. Action plans for achieving building-specific guiding principles are developed and executed while laboratory-wide standards are used to fulfill HPSB applicable policies and procedures. Engagement of facility managers, facility engineers, and other technical personnel has been essential to acquiring quality benchmarking data, performing commissioning activities, and implementing energy conservation measures.
Regional and Local Planning: Commuting Options A bus route between ORNL, the University of Tennessee, and Pellissippi State Community College continued operations for a second year in 2017. The average daily ridership during the academic year was 30 people. The average daily ridership during the summer months (May–August) was 48. One hundred seventy employees participated in carpools and vanpools, 140 employees completed a formal telework agreement (an increase of more than 300% from the prior year), and 114 employees participated in alternative work schedules via 9/80 and 4/10 shift designs. A commuter survey was distributed to all staff in June 2017 and received a 33% response rate. Analysis and further focus on some key areas are scheduled for FY 2018.
Employee and Community Engagement: Earth Day 2017 ORNL’s Earth Day, “Seeds of Progress,” celebration was held in April 2017. Activities included the featured presentation, “The Gatlinburg Firestorm—Can It Happen Here?” Employees and guests had the opportunity to participate in Earth Day events such seed planting and recycling relays. “Ask the Experts”

Oak Ridge Reservation Annual Site Environmental Report—2017
Oak Ridge National Laboratory 5-10
activities included presentations and displays promoting energy efficiency and sustainable practices at home and at work.
SCI Achievements The following achievements were highlighted in the ORNL SSP report submitted to the DOE SPO in December 2017:
• Teresa Nichols, co-lead of the ORNL SCI, led a DOE SPO project to create a telework guide for distribution to DOE facilities. The project involved working with five partner SC labs, with ORNL as project lead. The guide was completed in May 2017, and the final report (ORNL 2017) was distributed by the SPO through its June SPOtlight newsletter and was posted on the SPO homepage.
• ORNL SCI compiled the Oak Ridge National Laboratory Annual Sustainability Report for FY 2017 (ORNL 2017a), which was electronically distributed to all ORNL staff and guests. The report was also distributed to 104 recipients in cities, counties, municipalities, chambers, colleges, and high schools in the counties neighboring ORNL. By distributing the report, ORNL informed its neighbors of its sustainable best practices.
• ORNL distributed a commuter survey in June 2017 to all ORNL staff and received a 33% response rate. Analysis and further focus on some key areas are scheduled for FY 2018.
• ORNL applied new approaches to energy consumption awareness using data visualization and reporting during FY 2017. One such approach was the development of utility consumption dashboards and reports populated with interval data, which helped to identify energy conservation opportunities in FY 2017. Building data analytics, including fault detection and diagnostics, are also being added to ORNL’s energy conservation tools. To bolster this effort, ORNL has elected to participate in the Better Buildings Smart Energy Analytics Campaign. Going forward, ORNL will implement a new energy data analytics module for more robust dashboard development and sharing. Implementation of fault detection and diagnostics will also be scaled up to include additional buildings, and a work flow will be established to successfully address faults and to achieve energy and operational improvements.
• The 2017 Government Green Fleet awards were presented at the Sustainable Fleet Technology Conference, held in Raleigh, North Carolina. ORNL’s fleet received a 2017 Government Green Fleet Award. There are 38,000 government fleets in North America. The annual award honors the top 50 federal, state and local government fleets in North America that have achieved success in “greening” their fleets by using alternative fuel and hybrid vehicles, emissions reduction, long-range planning, and staff education and involvement. This year, ORNL was ranked 29th on the list. It was the only DOE facility to be recognized, and its fleet was the only one from the State of Tennessee to win the award.
5.2.1.5 Storm Water Management and the Energy Independence and Security Act of 2007
Section 438 of the Energy Independence and Security Act of 2007 (EISA 2007) stipulates the following:
The sponsor of any development or redevelopment project involving a Federal facility with a footprint that exceeds 5,000 square feet shall use site planning, design, construction, and maintenance strategies for the property to maintain or restore, to the maximum extent technically feasible, the predevelopment hydrology of the property with regard to the temperature, rate, volume, and duration of flow.

Oak Ridge Reservation Annual Site Environmental Report—2017
Oak Ridge National Laboratory 5-11
For the purposes of this provision, “development or redevelopment” is defined as
any action that results in the alteration of the landscape during construction of buildings or other infrastructure such as parking lots, roads, etc. (e.g., grading, removal of vegetation, soil compaction) such that the changes affect runoff volumes, rates, temperature, and duration of flow. Examples of projects that would fall under ‘redevelopment’ include structures or other infrastructure that are being reconstructed or replaced and the landscape is altered. Typical patching or resurfacing of parking lots or other travel areas would not fall under this requirement (EISA 2007).
Strategic plans for demolition and renovation of old facilities and construction of new facilities at ORNL incorporate green infrastructure and low-impact development (GI/LID) practices to infiltrate, evapotranspire, and/or harvest and use storm water on site to the maximum extent feasible. GI/LID approaches and technologies have been used to mimic the natural processes of the hydrologic cycle (infiltration, evapotranspiration, and use). GI/LID practices that have been incorporated at ORNL include
• trees and tree boxes, • rain gardens, • vegetated swales, • pocket wetlands, • infiltration planters, • porous and permeable pavements, • vegetated median strips, • reforestation and revegetation, • protection of riparian buffers and floodplains, • retention ponds, and • water reuse (e.g., tanks in restrooms to collect water for reuse in irrigation).
At ORNL, evaluation occurs to meet the requirements of EISA Section 438. A three-step approach is applied as needed:
• Within the project boundaries if the necessary volume of runoff can be infiltrated or retained on site.
• On land immediately adjacent to the project boundaries if the necessary volume of runoff cannot be infiltrated or retained on site.
• Within the same valley or ridge area (e.g., within Bethel Valley if the project is within Bethel Valley; within Melton Valley if the project is within Melton Valley) if the necessary volume of runoff cannot be infiltrated or retained on land immediately adjacent to the project boundaries.
In addition to GI/LID practices, the projects may remove impervious areas and reestablish pervious areas to allow infiltration or evapotranspiration to occur.
5.2.1.6 Emergency Preparedness and Response The UT-Battelle Emergency Management Program supplies the resources and capabilities to provide emergency preparedness services and, in the event of an accident, emergency response services. Emergency preparedness personnel perform hazard surveys and hazard assessments to identify potential emergency situations. Procedures and plans have been developed to prepare for and respond to a wide

Oak Ridge Reservation Annual Site Environmental Report—2017
Oak Ridge National Laboratory 5-12
variety of potential emergency situations. Training is provided to ensure appropriate response and performance during emergency events. Frequent exercises and drills are scheduled to ensure the effective performance of the procedures and plans. An environmental subject matter expert is a member of the emergency response team and participates in drills and exercises to ensure that environmental requirements are met and that environmental impacts from an event and the response are mitigated.
5.2.1.7 Checking Monitoring and Measurement UT-Battelle has developed monitoring and measurement processes for each operation or activity that can have a significant adverse effect on the environment. Several SBMS subject areas include requirements for managers to establish performance objectives and indicators, conduct performance assessments to collect data and monitor progress, and evaluate the data to identify strengths and weaknesses in performance and areas for improvement.
UT-Battelle Environmental Management System Assessments UT-Battelle uses several methods to evaluate compliance with legal and other environmental requirements. Most of the compliance evaluation activities are implemented through the EMS or are a part of line-organization assessment activities. If a nonconformance were identified, the ORNL issues-management process requires that any regulatory or management system nonconformance be reviewed for cause and that corrective and/or preventive actions be developed. These actions would then be implemented and tracked to completion.
Environmental assessments that cover legal and other requirements are performed periodically. Additionally, management system owners are required to assess management system performance and to address issues identified from customer feedback, staff suggestions, and other assessment activities.
UT-Battelle also uses the results from numerous external compliance inspections conducted by regulators to verify compliance with requirements. In addition to regulatory compliance assessments, internal and external EMS assessments are performed annually to ensure that the UT-Battelle EMS continues to conform to ISO requirements. An internal audit and an external surveillance audit conducted in 2017 verified that the EMS conforms to ISO 14001:2015. In addition to verifying conformance, these management system assessments also identify continual improvement opportunities.
5.2.2 Other Environmental Management System Assessments
5.2.2.1 Environmental Management System for the Transuranic Waste Processing Center
The National Sanitation Foundation, International Strategic Registrations, Ltd. (NSF-ISR) registered the TWPC EMS for activities to the ISO 14001:2015 standard (ISO 2015) in May 2017. The EMS is integrated with ISMS to provide a unified strategy for the management of resources, the control and reduction of risks, and the establishment and achievement of the organization’s ES&H goals. The EMS and ISMS are incorporated into the Integrated Safety Management System Description (BJC 2009), and a “plan-do-check-act” cycle is used for continual improvement in both. NSF-ISR conducted a recertification audit in April. No nonconformances or issues were identified, and several significant practices were noted.
The TWPC EMS incorporates applicable environmental laws, DOE orders, and other requirements (i.e., DOE directives and federal, state, and local laws) through NWSol’s Regulatory Management Plan (NWSol 2015), which dictates how the various requirements are incorporated into subject area documents

Oak Ridge Reservation Annual Site Environmental Report—2017
Oak Ridge National Laboratory 5-13
(procedures and guidelines). The EMS assists NWSol line organizations in identifying and addressing environmental issues.
Environmental aspects are elements of an organization’s activities, products, or services that can interact with the environment. NWSol has identified environmental aspects associated with TWPC activities, products, and services at both the project and activity level and has identified waste management activities, air emissions, storm water contamination, pollution prevention, habitat alteration, and energy consumption as potentially having significant environmental impacts. Activities that are relative to any of those environmental aspects are carefully controlled to minimize or eliminate impacts to the environment. NWSol has established and implemented objectives and measurable performance indicators for the targets associated with the identified significant impacts.
The pollution prevention programs at TWPC involve waste reduction efforts and implementation of sustainable practices that reduce the environmental impacts of the activities conducted at TWPC. The NWSol EMS establishes annual goals and targets to reduce the impact of TWPC’s environmental aspects.
NWSol has a well-established recycling program at TWPC and continues to identify new material-recycling streams and to expand the types of materials included in the program. Currently, recycle streams at TWPC range from office materials such as paper, aluminum cans, plastic drinking bottles, foam beverage cups, alkaline batteries, and toner cartridges to operations-oriented materials such as cardboard, construction debris, and batteries. The “single stream” recycling program established by NWSol allows the mixing of multiple types of recyclables and thus increases the amount of recyclable items and improves compliance.
“Environmentally preferable purchasing” is a term used to describe an organization’s policy to reduce packaging and to purchase products made with recycled material or biobased materials and other environmentally friendly products. NWSol ensures that environmentally preferable products are purchased by incorporating the “green” procurement requirements in NWSol procurement procedures.
NWSol uses several methods to evaluate compliance with legal and other requirements. Most of these compliance evaluation activities are implemented by internal and external environmental and management assessment activities and by routine reporting and reviews. NWSol also uses the results from numerous external compliance inspections conducted by regulators and contractors to verify compliance with requirements.
5.2.2.2 Environmental Management System for Isotek Isotek has developed and implemented an EMS for the U-233 Disposition Project that reflects the elements and framework found in the ISO14001:2004 standard (ISO 2004) and that satisfies the applicable requirements of DOE O 450.1A, Environmental Protection Program (DOE 2008a). The scope of the Isotek EMS is to achieve and demonstrate environmental excellence by identifying, assessing, and controlling the impact of Isotek activities and facilities on the environment. The EMS is designed to ensure compliance with environmental laws, regulations, and other applicable requirements and to improve effectiveness and efficiency, reduce costs, and earn and retain regulator and community trust. The Isotek EMS and ISMS are fully integrated.
Project procedures provide a systematic approach to integrating environmental considerations into all aspects of Isotek’s activities at ORNL. The Isotek EMS includes a procedure for identifying environmental aspects associated with the U-233 Disposition Project and for determining whether those aspects can have significant environmental impacts. Isotek has identified radiological air emissions as the only environmental aspect of its operations that has potentially significant environmental impacts and has developed an environmental management plan with measurable objectives and targets to address that

Oak Ridge Reservation Annual Site Environmental Report—2017
Oak Ridge National Laboratory 5-14
aspect. Isotek reviews environmental aspects, potential impacts, objectives, targets, and its environmental management plan at least annually and updates them as necessary.
The U-233 Disposition Project has a well-established recycling program that is implemented at all Isotek managed facilities and includes Buildings 3017, 3019 Complex, 2026, and 3137 at ORNL and an off-site administrative office in Oak Ridge. The materials currently recycled by Isotek include paper, cardboard, aluminum cans, plastic bottles, inkjet and toner cartridges, lamps, batteries, scrap metal, circuit boards, aerosol cans, and used oil.
To evaluate compliance with legal and other requirements, Isotek conducts an EMS audit every 3 years, annual management assessments, and periodic surveillances. Compliance with requirements is also evaluated through inspections performed by regulatory agencies. The results of the compliance evaluations are used for continual improvement of the EMS.
5.3 Compliance Programs and Status
During 2017 UT-Battelle, UCOR, NWSol, and Isotek operations were conducted to comply with contractual and regulatory environmental requirements. Table 5.1 presents a summary of environmental audits conducted at ORNL in 2017. The following discussions summarize the major environmental programs and activities carried out at ORNL during 2017 and provide an overview of the compliance status for the year.
Table 5.1. Summary of regulatory environmental audits, evaluations, inspections, and assessments conducted at Oak Ridge National Laboratory, 2017
Date Reviewer Subject Issues
January 9 City of Oak Ridge CFTF Wastewater Inspection 0 March TDEC Inspection of Underground Injection Control Program 0 April 11–12 TDEC Annual RCRA Inspection for ORNL (including TWPC) 0 May 25–26 TDEC NPDES Permit Inspection 0 July 27 TDEC NTRC RCRA Inspection 0 September 28 City of Oak Ridge CFTF Wastewater Inspection 0 October 17 City of Oak Ridge CFTF Waste Water Inspection 0 October 26–27 TDEC Annual CAA Inspection for ORNL and CFTF
Acronyms CAA = Clean Air Act RCRA = Resource Conservation and Recovery Act CFTF = Carbon Fiber Technology Facility TDEC = Tennessee Department of Environment and NPDES = National Pollutant Discharge Elimination System Conservation NTRC = National Transportation Research Center TWPC = Transuranic Waste Processing Center ORNL = Oak Ridge National Laboratory
5.3.1 Environmental Permits
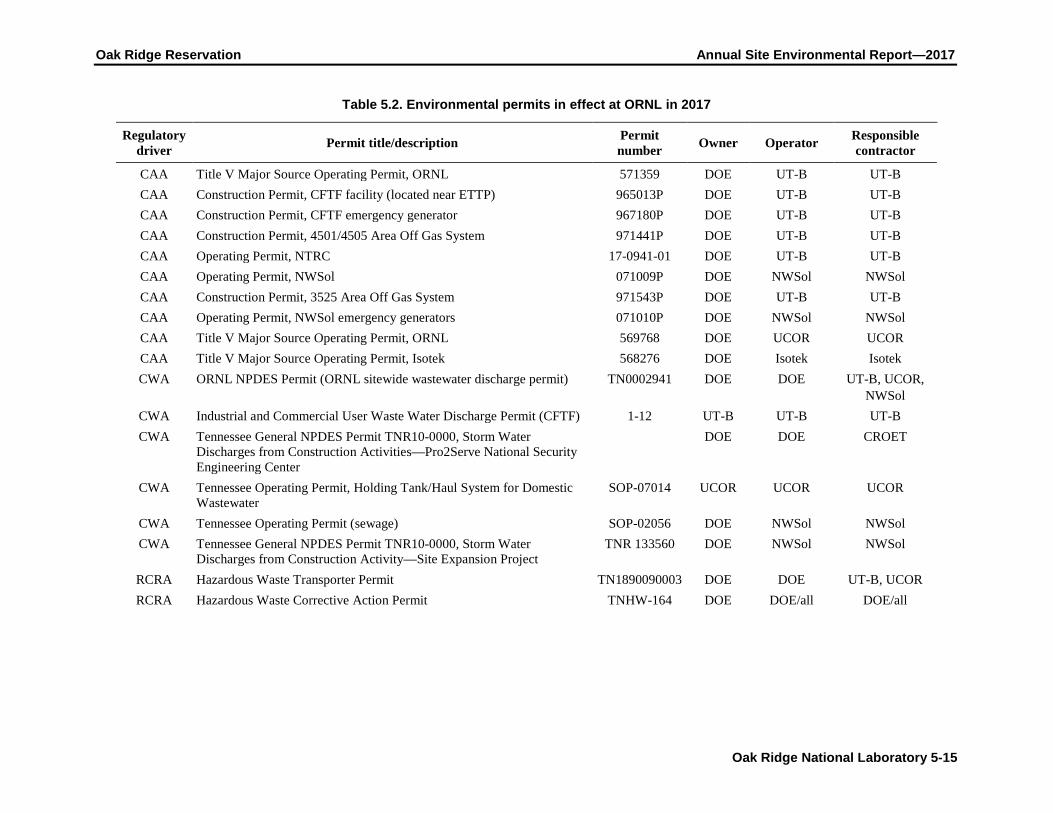
Table 5.2 contains a list of environmental permits that were in effect in 2017 at ORNL.
Oak Ridge Reservation Annual Site Environmental Report—2017
Oak Ridge National Laboratory 5-15
Table 5.2. Environmental permits in effect at ORNL in 2017
Regulatory driver Permit title/description Permit
number Owner Operator Responsible contractor
CAA Title V Major Source Operating Permit, ORNL 571359 DOE UT-B UT-B CAA Construction Permit, CFTF facility (located near ETTP) 965013P DOE UT-B UT-B CAA Construction Permit, CFTF emergency generator 967180P DOE UT-B UT-B CAA Construction Permit, 4501/4505 Area Off Gas System 971441P DOE UT-B UT-B CAA Operating Permit, NTRC 17-0941-01 DOE UT-B UT-B CAA Operating Permit, NWSol 071009P DOE NWSol NWSol CAA Construction Permit, 3525 Area Off Gas System 971543P DOE UT-B UT-B CAA Operating Permit, NWSol emergency generators 071010P DOE NWSol NWSol CAA Title V Major Source Operating Permit, ORNL 569768 DOE UCOR UCOR CAA Title V Major Source Operating Permit, Isotek 568276 DOE Isotek Isotek CWA ORNL NPDES Permit (ORNL sitewide wastewater discharge permit) TN0002941 DOE DOE UT-B, UCOR,
NWSol CWA Industrial and Commercial User Waste Water Discharge Permit (CFTF) 1-12 UT-B UT-B UT-B CWA Tennessee General NPDES Permit TNR10-0000, Storm Water
Discharges from Construction Activities—Pro2Serve National Security Engineering Center
DOE DOE CROET
CWA Tennessee Operating Permit, Holding Tank/Haul System for Domestic Wastewater
SOP-07014 UCOR UCOR UCOR
CWA Tennessee Operating Permit (sewage) SOP-02056 DOE NWSol NWSol CWA Tennessee General NPDES Permit TNR10-0000, Storm Water
Discharges from Construction Activity—Site Expansion Project TNR 133560 DOE NWSol NWSol
RCRA Hazardous Waste Transporter Permit TN1890090003 DOE DOE UT-B, UCOR RCRA Hazardous Waste Corrective Action Permit TNHW-164 DOE DOE/all DOE/all
Oak Ridge Reservation Annual Site Environmental Report—2017
Oak Ridge National Laboratory 5-16
Table 5.2 Environmental permits in effect at ORNL in 2017 (continued)
Regulatory driver Permit title/description Permit number Owner Operator Responsible
contractor
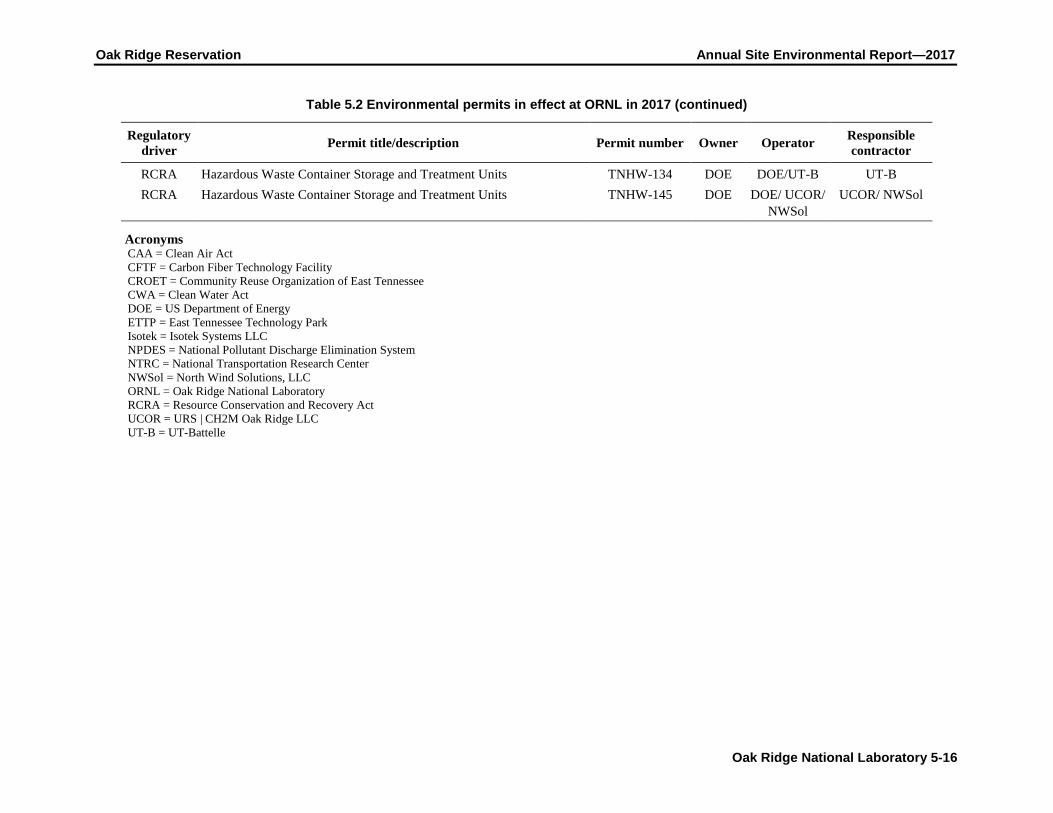
RCRA Hazardous Waste Container Storage and Treatment Units TNHW-134 DOE DOE/UT-B UT-B RCRA Hazardous Waste Container Storage and Treatment Units TNHW-145 DOE DOE/ UCOR/
NWSol UCOR/ NWSol
Acronyms CAA = Clean Air Act CFTF = Carbon Fiber Technology Facility CROET = Community Reuse Organization of East Tennessee CWA = Clean Water Act DOE = US Department of Energy ETTP = East Tennessee Technology Park Isotek = Isotek Systems LLC NPDES = National Pollutant Discharge Elimination System NTRC = National Transportation Research Center NWSol = North Wind Solutions, LLC ORNL = Oak Ridge National Laboratory RCRA = Resource Conservation and Recovery Act UCOR = URS | CH2M Oak Ridge LLC UT-B = UT-Battelle

Oak Ridge Reservation Annual Site Environmental Report—2017
Oak Ridge National Laboratory 5-17
5.3.2 National Environmental Policy Act/National Historic Preservation Act
NEPA provides a means to evaluate the potential environmental impact of proposed federal activities and to examine alternatives to those actions. UT-Battelle, NWSol, and Isotek maintain compliance with NEPA using site-level procedures and program descriptions that establish effective and responsive communications with program managers and project engineers to establish NEPA as a key consideration in the formative stages of project planning. Table 5.3 summarizes NEPA activities conducted at ORNL during 2017.
Table 5.3. National Environmental Policy Act activities, 2017
Types of NEPA documentation Number of instances
Oak Ridge National Laboratory
Approved under general actions or generic CX determinationsa 75 Project-specific CX determinationsb 0
North Wind Solutions, LLC
Approved under general actionsa or generic CX determinations 1 aProjects that were reviewed and documented through the site NEPA compliance coordinator.
bProjects that were reviewed and approved through the DOE Site Office and the NEPA compliance officer.
Acronyms CX = categorical exclusion DOE = US Department of Energy NEPA = National Environmental Policy Act
During 2017, UT-Battelle and NWSol continued to operate under site-level procedures that provide requirements for project reviews and NEPA compliance. The procedures call for a review of each proposed project, activity, or facility to determine the potential for impacts to the environment. To streamline the NEPA review and documentation process, the DOE Oak Ridge Office has approved generic categorical exclusion (CX) determinations that cover proposed bench- and pilot-scale research activities and generic CXs that cover proposed nonresearch activities (e.g., maintenance activities, facilities upgrades, personnel safety enhancements). A CX is one of a category of actions defined in 40 CFR 1508.4 that does not individually or cumulatively have a significant effect on the human environment and for which neither an environmental assessment nor an environmental impact statement is normally required.
UT-Battelle uses SBMS as the delivery system for guidance and requirements to manage and control work at ORNL. NEPA is an integral part of SBMS, and a UT-Battelle NEPA coordinator works with principal investigators, environmental compliance representatives, and environmental protection officers within each UT-Battelle division to determine appropriate NEPA decisions.
Compliance with the National Historic Protection Act at ORNL is achieved and maintained in conjunction with NEPA compliance. The scope of proposed actions is reviewed in accordance with the ORR cultural resource management plan (Souza et al. 2001).

Oak Ridge Reservation Annual Site Environmental Report—2017
Oak Ridge National Laboratory 5-18
5.3.3 Clean Air Act Compliance Status
The Clean Air Act (CAA), passed in 1970 and amended in 1977 and 1990, forms the basis for the national air pollution control effort. This legislation established comprehensive federal and state regulations to limit air emissions. It includes four major regulatory programs: the national ambient air quality standards, state implementation plans, new source performance standards, and NESHAPs. Airborne discharges from DOE Oak Ridge facilities, both radioactive and nonradioactive, are subject to regulation by the US Environmental Protection Agency (EPA) and the Tennessee Department of Environment and Conservation (TDEC) Division of Air Pollution Control. The most recent sitewide UT-Battelle Title V Major Source Operating Permit was issued in August 2017. One administrative amendment request was submitted to TDEC in October 2017. The Title V Major Source Operating Permit for the 3039 stack, operated by UCOR, was renewed in 2015. To demonstrate compliance with the Title V Major Source Operating Permits, more than 1,500 data points are collected and reported every year. In addition, nitrogen oxides (NOx), a family of poisonous, highly reactive gases and defined collectively as a criteria pollutant by the EPA (EPA 2016), are monitored continuously at one location. Samples are collected continuously from 9 major radionuclide sources and periodically from 15 minor radionuclide sources. There are numerous other demonstrations of compliance with generally applicable air quality protection requirements (e.g., asbestos, stratospheric ozone).
NTRC and CFTF are two off-site CAA-regulated facilities maintained and operated by UT-Battelle. A permit was issued by Knox County for an emergency generator located at NTRC in June 2017. The CFTF operates under two construction permits issued by TDEC. A permit application to convert them to a true minor operating air permit was submitted in 2015 and was still pending issuance at the end of 2017.
In summary, there were no UT-Battelle CAA violations and no Isotek, UCOR, or NWSol CAA violations or exceedances in 2017. Section 5.4 provides detailed information on 2017 activities conducted by UT-Battelle in support of the CAA.
5.3.4 Clean Water Act Compliance Status
The objective of the Clean Water Act (CWA) is to restore, maintain, and protect the integrity of the nation’s waters. The CWA serves as the basis for comprehensive federal and state programs to protect the nation’s waters from pollutants. (See Appendix C for water quality reference standards.) One of the strategies developed to achieve the goals of CWA was the EPA’s establishment of limits on specific pollutants allowed to be discharged to US waters by municipal sewage treatment plants (STPs) and industrial facilities. EPA established the National Pollutant Discharge Elimination System (NPDES) permitting program to regulate compliance with pollutant limitations. The program was designed to protect surface waters by limiting effluent discharges into streams, reservoirs, wetlands, and other surface waters. EPA has delegated authority for implementation and enforcement of the NPDES program to the State of Tennessee.
In 2017, compliance with the ORNL NPDES permit was determined by about 2,300 laboratory analyses and field measurements. The NPDES permit limit compliance rate for all discharge points for 2017 was greater than 99%. Heavy rains in April 2017 caused heavy influent flows to the STP. Operations were adjusted to prevent washout of the treatment plant. These operational disruptions caused a carbonaceous biological oxygen demand and five ammonia noncompliances during the next several months that it took to investigate, adjust, and fully restore equalized STP operations. In addition, malfunctioning equipment in the STP ozone disinfection system caused three E. coli noncompliances during May–July 2017. No adverse impacts to the creek aquatic life or environs were identified in the aftermath of these noncompliances. Operational response resulted in timely restoration of normal functional STP status following these irregularities.

Oak Ridge Reservation Annual Site Environmental Report—2017
Oak Ridge National Laboratory 5-19
5.3.5 Safe Drinking Water Act Compliance Status
ORNL’s water distribution system is designated as a “nontransient, noncommunity” water system by the TDEC Division of Water Supply. TDEC’s Water Supply rules, Chapter 0400-45-01, “Public Water Systems” (TDEC 2012), set limits for biological contaminants and for chemical activities and chemical contaminants. TDEC requires sampling for the following constituents for compliance with state and federal regulations:
• residual chlorine, • bacteria (total coliform), • disinfectant by-product (trihalomethanes and haloacetic acids), and • lead and copper (required once every 3 years).
The City of Oak Ridge supplies potable water to the ORNL water distribution system and meets all regulatory requirements for drinking water. The water treatment plant, located on ORR, north of the Y-12 Complex, is owned and operated by the City of Oak Ridge.
In 2017, sampling results for ORNL’s water system residual chlorine levels, bacterial constituents, and disinfectant by-products were all within acceptable limits. Sampling for lead and copper will not be required again until 2018.
5.3.6 Resource Conservation and Recovery Act Compliance Status
The Hazardous Waste Program under the Resource Conservation and Recovery Act (RCRA) establishes a system for regulating hazardous wastes from the initial point of generation through final disposal. In Tennessee, TDEC has been delegated authority by EPA to implement the Hazardous Waste Program; EPA retains an oversight role. In 2017, DOE and its contractors at ORNL were jointly regulated as a “large-quantity generator of hazardous waste” under EPA ID TN1890090003 because, collectively, they generated more than 1,000 kg of hazardous/mixed wastes in at least one calendar month during 2017.
Mixed wastes are both hazardous (under RCRA regulations) and radioactive. Hazardous/mixed wastes are accumulated in satellite accumulation areas or in less-than-90-day accumulation areas and are stored and/or treated in RCRA-permitted units. In addition, hazardous/mixed wastes are shipped off site for treatment and disposal. The RCRA units operate under three permits at ORNL, as shown in Table 5.4. In 2017, UT-Battelle and UCOR were permitted to transport hazardous wastes under an EPA ID number issued for ORNL activities. On September 15, 2015, the ORR Hazardous Waste Corrective Action Permit TNHW-121 was reissued as TNHW-164. TNHW-164 is a set of conditions pertaining to the current status of all solid waste management units (SWMUs) and areas of concern (AOCs) at East Tennessee Technology Park (ETTP), ORNL, and the Y-12 National Security Complex. The corrective action conditions require that the SWMUs and AOCs be investigated and, as necessary, remediated.
Reporting is required for hazardous waste activities on 34 active waste streams at ORNL, some of which are mixed wastes. The quantity of hazardous/mixed waste generated at ORNL in 2017 was 564,434 kg, with mixed wastewater accounting for 357,429 kg. ORNL generators treated 9,410 kg of hazardous/mixed waste by elementary neutralization, silver recovery, and deactivation. The quantity of hazardous/mixed waste treated in RCRA-permitted treatment facilities at ORNL in 2017 was 2,761 kg. This included waste treated by macroencapsulation, size reduction, stabilization/solidification, and wastewater treatment at the Process Waste Treatment Complex (PWTC). In addition, 357,429 kg of liquid mixed waste was treated at the Liquid Low-Level Waste Treatment Facility. The amount of
Oak Ridge Reservation Annual Site Environmental Report—2017
Oak Ridge National Laboratory 5-20
hazardous/mixed waste shipped off site to commercial treatment, storage, and disposal facilities was 177,040 kg in 2017.
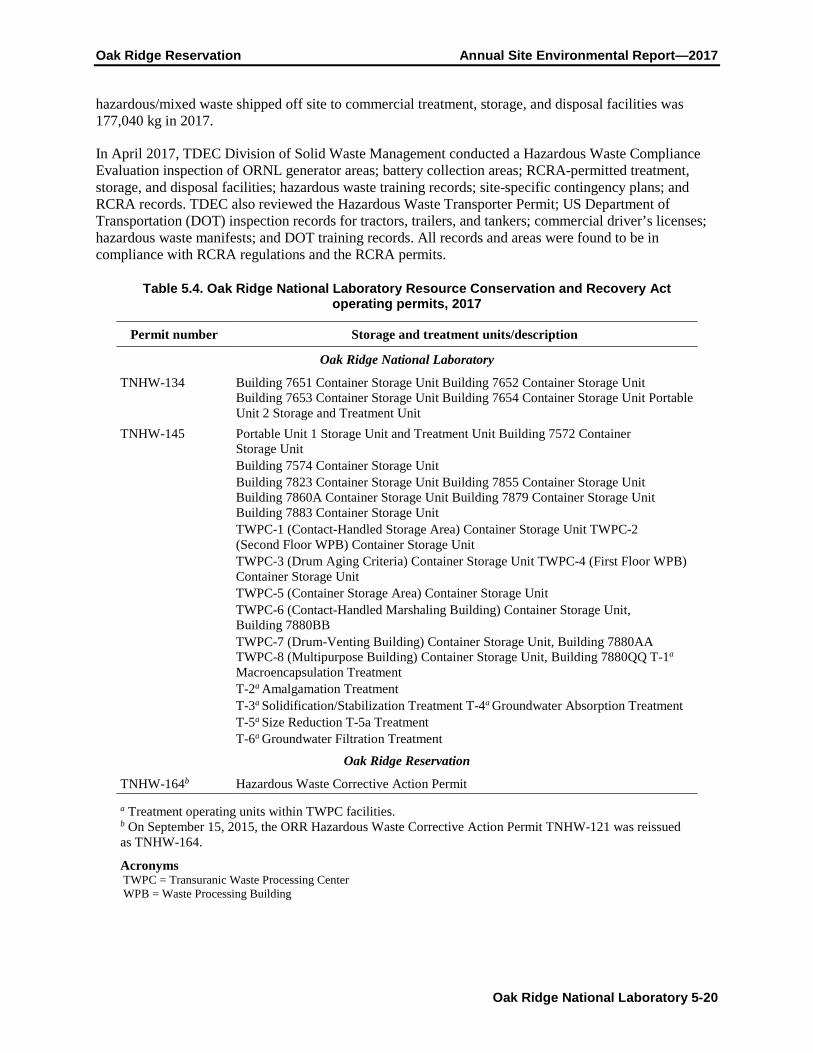
In April 2017, TDEC Division of Solid Waste Management conducted a Hazardous Waste Compliance Evaluation inspection of ORNL generator areas; battery collection areas; RCRA-permitted treatment, storage, and disposal facilities; hazardous waste training records; site-specific contingency plans; and RCRA records. TDEC also reviewed the Hazardous Waste Transporter Permit; US Department of Transportation (DOT) inspection records for tractors, trailers, and tankers; commercial driver’s licenses; hazardous waste manifests; and DOT training records. All records and areas were found to be in compliance with RCRA regulations and the RCRA permits.
Table 5.4. Oak Ridge National Laboratory Resource Conservation and Recovery Act operating permits, 2017
Permit number Storage and treatment units/description
Oak Ridge National Laboratory
TNHW-134 Building 7651 Container Storage Unit Building 7652 Container Storage Unit Building 7653 Container Storage Unit Building 7654 Container Storage Unit Portable Unit 2 Storage and Treatment Unit
TNHW-145 Portable Unit 1 Storage Unit and Treatment Unit Building 7572 Container Storage Unit Building 7574 Container Storage Unit Building 7823 Container Storage Unit Building 7855 Container Storage Unit Building 7860A Container Storage Unit Building 7879 Container Storage Unit Building 7883 Container Storage Unit TWPC-1 (Contact-Handled Storage Area) Container Storage Unit TWPC-2 (Second Floor WPB) Container Storage Unit TWPC-3 (Drum Aging Criteria) Container Storage Unit TWPC-4 (First Floor WPB) Container Storage Unit TWPC-5 (Container Storage Area) Container Storage Unit TWPC-6 (Contact-Handled Marshaling Building) Container Storage Unit, Building 7880BB TWPC-7 (Drum-Venting Building) Container Storage Unit, Building 7880AA TWPC-8 (Multipurpose Building) Container Storage Unit, Building 7880QQ T-1a
Macroencapsulation Treatment T-2a Amalgamation Treatment T-3a Solidification/Stabilization Treatment T-4a Groundwater Absorption Treatment T-5a Size Reduction T-5a Treatment T-6a Groundwater Filtration Treatment
Oak Ridge Reservation
TNHW-164b Hazardous Waste Corrective Action Permit
a Treatment operating units within TWPC facilities. b On September 15, 2015, the ORR Hazardous Waste Corrective Action Permit TNHW-121 was reissued as TNHW-164.
Acronyms TWPC = Transuranic Waste Processing Center WPB = Waste Processing Building

Oak Ridge Reservation Annual Site Environmental Report—2017
Oak Ridge National Laboratory 5-21
DOE and UT-Battelle operations at NTRC and CFTF were regulated as “conditionally exempt small-quantity generators” in 2017, meaning that less than 100 kg of hazardous waste was generated per month.
In 2017, no hazardous/mixed wastes were generated, accumulated, or shipped by DOE or UT-Battelle at the DOE Office of Scientific and Technical Information, the 1916-T2 warehouse, or the 0800 Area.
5.3.7 Oak Ridge National Laboratory RCRA-CERCLA Coordination
The Federal Facility Agreement for the Oak Ridge Reservation (FFA) (DOE 2014) is intended to coordinate the corrective action processes of RCRA required under the Hazardous and Solid Waste Amendments permit with CERCLA response actions. Annual updates for 2016 for ORNL’s SWMUs and AOCs were consolidated with updates for ETTP, the Y-12 Complex, and ORR and were reported to TDEC, DOE, and the EPA Region 4 in January 2017.
Periodic updates of proposed C&D activities and facilities at ORNL have been provided to managers and project personnel from the TDEC Remediation Division and EPA Region 4. A CERCLA screening process is used to identify proposed C&D projects and facilities that warrant CERCLA oversight. The goal is to ensure that modernization efforts do not adversely affect the effectiveness of previously completed CERCLA environmental remediation actions and that they do not adversely affect future CERCLA environmental remediation actions.
5.3.7.1 Resource Conservation and Recovery Act Underground Storage Tanks Underground storage tanks (USTs) containing petroleum and hazardous substances are regulated under RCRA Subtitle I (40 CFR 280). TDEC has been granted authority by EPA to regulate USTs containing petroleum under TDEC Rule 400-18-01; however, hazardous-substance USTs are still regulated by EPA.
ORNL has two USTs registered with TDEC under Facility ID 0-730089. These USTs are in service (petroleum) and meet the current UST standards. One UST was removed in late 2016 and received noncontaminated closure approval from TDEC in March 2017.
5.3.8 Comprehensive Environmental Response, Compensation, and Liability Act Compliance Status
CERCLA, also known as Superfund, was passed in 1980 and was amended in 1986 by the Superfund Amendments and Reauthorization Act (SARA). Under CERCLA, a site is investigated and remediated if it poses significant risk to health or the environment. The EPA National Priorities List (NPL) is a comprehensive list of sites and facilities that have been found to pose a sufficient threat to human health and/or the environment to warrant cleanup under CERCLA.
In 1989, ORR was placed on the EPA NPL. In 1992, the ORR FFA became effective among EPA, TDEC, and DOE and established the framework and schedule for developing, implementing, and monitoring remedial actions (RAs) on ORR. The on-site CERCLA Environmental Management Waste Management Facility (EMWMF) is operated by UCOR for DOE. Located in Bear Creek Valley, the EMWMF is used for disposal of waste resulting from CERCLA cleanup actions on ORR, including ORNL. The EMWMF is an engineered landfill that accepts low-level radioactive, hazardous, asbestos, and polychlorinated biphenyl (PCB) wastes and combinations of the wastes in accordance with specific waste acceptance criteria under an agreement with state and federal regulators.

Oak Ridge Reservation Annual Site Environmental Report—2017
Oak Ridge National Laboratory 5-22
5.3.9 Toxic Substances Control Act Compliance Status
PCB uses and waste at ORNL are regulated under the Toxic Substance Control Act (TSCA). PCB waste generation, transportation, and storage at ORNL are reported under EPA ID TN1890090003. In 2017, UT-Battelle operated seven PCB waste storage areas. When longer-term storage was necessary, PCB/radioactive wastes were stored in RCRA-permitted storage buildings at ORNL. One PCB waste storage area was operated at a UT-Battelle facility in the Y-12 Complex. The continued use of authorized PCBs in electrical systems and/or equipment (e.g., transformers, capacitors, rectifiers) is regulated at ORNL. Most of the equipment at ORNL that required regulation under TSCA has been disposed of. However, some of the ORNL facilities at the Y-12 Complex continue to use (or store for future reuse) PCB equipment.
Because of the age of many of the ORNL facilities and the continued presence of PCBs in gaskets, grease, building construction, and equipment, DOE self-disclosed unauthorized use of PCBs to EPA in the late 1980s. As a result, DOE and ORNL contractors negotiated a compliance agreement with EPA (see Chapter 2) to address the compliance issues related to these unauthorized uses and to allow for continued use pending decontamination or disposal. As a result of that agreement, DOE continues to notify EPA when additional unauthorized uses of PCBs, such as PCBs in paint, adhesives, electrical wiring, or floor tile, are identified at ORNL. No new unauthorized uses of PCBs were identified during 2017.
5.3.10 Emergency Planning and Community Right-to-Know Act Compliance Status
The Emergency Planning and Community Right-to-Know Act (EPCRA) and Title III of SARA require that facilities report inventories and releases of certain chemicals that exceed specific release thresholds. The inventory report is submitted to the University of Texas at Dallas (UT-Dallas) Emergency Response Information System (E-Plan), which is an electronic database managed by UT-Dallas and funded by the U.S. Department of Homeland Security. The State of Tennessee Emergency Response Commission has access to ORNL EPCRA data via the E-Plan system.
Table 5.5 describes the main elements of EPCRA. UT-Battelle complied with these requirements in 2017 through the submittal of reports under EPCRA Sections 302, 303, 311, 312, and 313. The reports contain information on all DOE prime contractors and their subcontractors who reported activities at the ORNL site.
Table 5.5. Main elements of the Emergency Planning and Community Right-to-Know Act
Title Description
Sections 302 and 303, Planning Notification
Requires that local planning committee and state emergency response commission be notified of EPCRA-related planning
Section 304, Extremely Hazardous Substance Release Notification
Addresses reporting to state and local authorities of off-site releases
Sections 311–312, Material Safety Data Sheet/Chemical Inventory
Requires that either safety data sheets or lists of hazardous chemicals for which they are required be provided to state and local authorities for emergency planning. Requires that an inventory of hazardous chemicals maintained in quantities over thresholds be reported annually to EPA
Section 313, Toxic Chemical Release Reporting
Requires that releases of toxic chemicals be reported annually to EPA
Acronyms EPA = US Environmental Protection Agency EPCRA = Emergency Planning and Community Right-to-Know Act

Oak Ridge Reservation Annual Site Environmental Report—2017
Oak Ridge National Laboratory 5-23
ORNL had no releases of extremely hazardous substances, as defined by EPCRA, in 2017. Releases of toxic chemicals that were greater than the Section 313 designated reportable threshold quantities are discussed in Section 5.3.10.2.
5.3.10.1 Material Safety Data Sheet/Chemical Inventory (Section 312) Inventories, locations, and associated hazards of hazardous chemicals and/or extremely hazardous substances were submitted in an annual report to the E-Plan as required by the State of Tennessee. In 2017, there were 36 hazardous and/or extremely hazardous substances at ORNL that met EPCRA reporting criteria.
Private-sector lessees were not included in the 2017 submittals. Under the terms of their leases, lessees must evaluate their own inventories of hazardous and extremely hazardous chemicals and must submit information as required by the regulations.
5.3.10.2 Toxic Chemical Release Reporting (EPCRA Section 313) DOE submits annual toxic release inventory reports to EPA and the Tennessee Emergency Management Agency on or before July 1 of each year. The reports cover the previous calendar year and track the management of certain chemicals that are released to the environment and/or managed through recycling, energy recovery, and treatment. (A “release” of a chemical means that it is emitted to the air or water or that it is placed in some type of land disposal.) Operations involving certain chemicals were compared with regulatory reporting thresholds to determine which chemicals exceeded individual thresholds on amounts manufactured, amounts processed, or amounts otherwise used. Releases and other waste management activities were determined for each chemical that exceeded one or more threshold.
For 2017, ORNL exceeded the reporting threshold and reported on the otherwise use of nitric acid and the manufacture of nitrate compounds. Most of the nitric acid was used in wastewater treatment operations at the PWTC. Nitrate compounds were coincidentally manufactured as by-products of neutralizing the nitric acid waste and as by-products of on-site sewage treatment.
5.3.11 US Department of Agriculture/Tennessee Department of Agriculture
USDA, through Animal and Plant Health Inspection Services, issues permits for the import, transit, and controlled release of regulated animals, animal products, veterinary biologics, plants, plant products, pests, organisms, soil, and genetically engineered organisms. The Tennessee Department of Agriculture issues agreements and jointly regulates domestic soil. In 2017, UT-Battelle personnel had 36 permits and agreements for the receipt, movement, or controlled release of regulated articles.
5.3.12 Wetlands
Wetland delineations of potential project sites are conducted to facilitate compliance with TDEC and US Army Corps of Engineers wetlands protection requirements. Delineation information assists project planners avoiding or mitigating negative impacts to wetlands. In 2017, wetlands were delineated in the Copper Ridge Borrow Area and 294 Power Line Area.
5.3.13 Radiological Clearance of Property at Oak Ridge National Laboratory
DOE O 458.1, Radiation Protection of the Public and the Environment (DOE 2011d), established standards and requirements for operations of DOE and its contractors with respect to protection of members of the public and the environment against undue risk from radiation. In addition to discharges to

Oak Ridge Reservation Annual Site Environmental Report—2017
Oak Ridge National Laboratory 5-24
the environment, the release of property containing residual radioactive material is a potential contributor to the dose received by the public, and DOE O 458.1 established requirements for clearance of property from DOE control and for public notification of clearance of property.
At ORNL, UT-Battelle uses a graded approach for release of material and equipment for unrestricted public use. Material that may be released to the public has been categorized so that in some cases an administrative release can be accomplished without a radiological survey. Such material originates from nonradiological areas and includes items such as the following:
• documents, mail, diskettes, compact disks, and other office media; • nonradioactive items or materials received that are immediately (within the same shift) determined
to have been delivered in error or damaged; • personal items or materials; • paper, plastic products, aluminum beverage cans, toner cartridges, and other items released for
recycling; • office trash; • housekeeping materials and associated waste; • breakroom, cafeteria, and medical wastes; • compressed gas cylinders and fire extinguishers; • medical and bioassay samples; and • other items with an approved release plan.
Items that are not in the listed categories and that originate from nonradiological areas within ORNL’s controlled areas are surveyed before release to the public, or a process knowledge evaluation is conducted to ensure that the material has not been exposed to radioactive material or beams of radiation capable of creating radioactive material. In some cases, both a radiological survey and a process knowledge evaluation are performed (e.g., a radiological survey is conducted on the outside of the item, and a process knowledge form is signed by the custodian for inaccessible surfaces). A similar approach is used for material released to state-permitted landfills on ORR. The only exception is for items that could be internally contaminated; those items are also sampled by laboratory analysis to ensure that landfill permit criteria are met.
When the process knowledge approach is used, the item’s custodian is required to sign a statement that specifies that the history of the item or material is known and that the material is known to be free of contamination. This process knowledge certification is more stringent than what is allowed by DOE O 458.1 (DOE 2011d) in that ORNL requires an individual to take personal responsibility and accountability for knowing the complete history of an item before it can be cleared using process knowledge alone. DOE O 458.1 allows use of procedures for evaluating operational records and operating history to make process knowledge release decisions, but UT-Battelle has chosen to continue to require personal certification of the status of an item. This requirement ensures that each individual certifying the item is aware of the significance of this decision and encourages the individual to obtain a survey of the item if he or she is not confident that the item can be certified as being free of contamination.
A survey and release plan may be developed to direct the radiological survey process for large recycling programs or for clearance of bulk items with low contamination potential. For such projects, survey and release plans are developed based on guidance from the Multi-Agency Radiation Survey and Site Investigation Manual (MARSSIM) (NRC 2000) or the Multi-Agency Radiation Survey and Assessment of Materials and Equipment Manual (MARSAME) (NRC 2009). MARSSIM and MARSAME allow for
Oak Ridge Reservation Annual Site Environmental Report—2017
Oak Ridge National Laboratory 5-25
statistically based survey protocols that typically require survey measurements for a representative portion of the items being released. The survey protocols are documented in separate survey and release plans, and the measurements from such surveys are documented in radiological release survey reports.
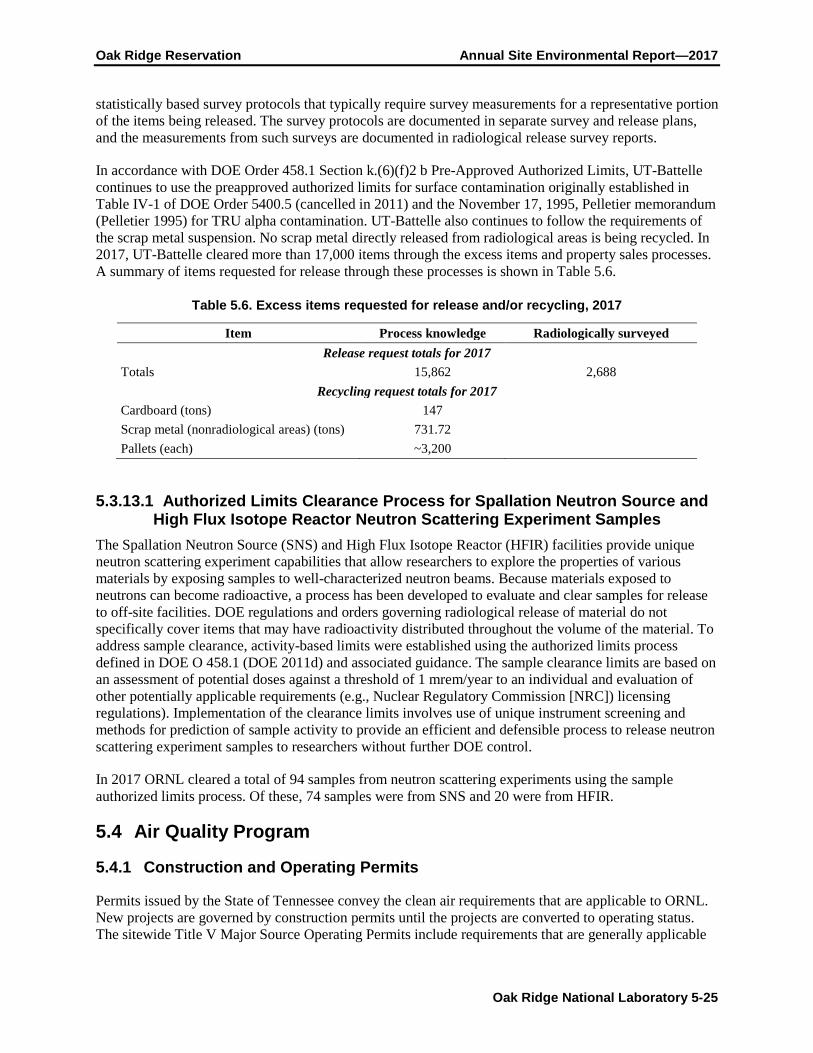
In accordance with DOE Order 458.1 Section k.(6)(f)2 b Pre-Approved Authorized Limits, UT-Battelle continues to use the preapproved authorized limits for surface contamination originally established in Table IV-1 of DOE Order 5400.5 (cancelled in 2011) and the November 17, 1995, Pelletier memorandum (Pelletier 1995) for TRU alpha contamination. UT-Battelle also continues to follow the requirements of the scrap metal suspension. No scrap metal directly released from radiological areas is being recycled. In 2017, UT-Battelle cleared more than 17,000 items through the excess items and property sales processes. A summary of items requested for release through these processes is shown in Table 5.6.
Table 5.6. Excess items requested for release and/or recycling, 2017
Item Process knowledge Radiologically surveyed Release request totals for 2017
Totals 15,862 2,688 Recycling request totals for 2017
Cardboard (tons) 147 Scrap metal (nonradiological areas) (tons) 731.72 Pallets (each) ~3,200
5.3.13.1 Authorized Limits Clearance Process for Spallation Neutron Source and High Flux Isotope Reactor Neutron Scattering Experiment Samples
The Spallation Neutron Source (SNS) and High Flux Isotope Reactor (HFIR) facilities provide unique neutron scattering experiment capabilities that allow researchers to explore the properties of various materials by exposing samples to well-characterized neutron beams. Because materials exposed to neutrons can become radioactive, a process has been developed to evaluate and clear samples for release to off-site facilities. DOE regulations and orders governing radiological release of material do not specifically cover items that may have radioactivity distributed throughout the volume of the material. To address sample clearance, activity-based limits were established using the authorized limits process defined in DOE O 458.1 (DOE 2011d) and associated guidance. The sample clearance limits are based on an assessment of potential doses against a threshold of 1 mrem/year to an individual and evaluation of other potentially applicable requirements (e.g., Nuclear Regulatory Commission [NRC]) licensing regulations). Implementation of the clearance limits involves use of unique instrument screening and methods for prediction of sample activity to provide an efficient and defensible process to release neutron scattering experiment samples to researchers without further DOE control.
In 2017 ORNL cleared a total of 94 samples from neutron scattering experiments using the sample authorized limits process. Of these, 74 samples were from SNS and 20 were from HFIR.
5.4 Air Quality Program
5.4.1 Construction and Operating Permits
Permits issued by the State of Tennessee convey the clean air requirements that are applicable to ORNL. New projects are governed by construction permits until the projects are converted to operating status. The sitewide Title V Major Source Operating Permits include requirements that are generally applicable

Oak Ridge Reservation Annual Site Environmental Report—2017
Oak Ridge National Laboratory 5-26
to large operations such as national laboratories (e.g., asbestos and stratospheric ozone) as well as specific requirements directly applicable to individual air emission sources. Source-specific requirements include Rad-NESHAPs (see Section 5.4.3), requirements applicable to sources of ambient air criteria pollutants, and requirements applicable to sources of other hazardous (nonradiological) air pollutants. In August 2017, the State of Tennessee issued Title V Major Source Operating Permit 571359 to DOE and UT-Battelle operations at ORNL. In January 2015, TDEC also issued two construction permits for the Building 3525 and the 4501/4505 Off Gas System new radionuclide emission sources. DOE and UT-Battelle also maintained a valid minor source operating permit with the Knox County Air Quality Management Division for NTRC facilities located in Knox County.
In 2012 and in 2014 UT-Battelle applied for and received, construction permit numbers 965013P and 967180P, respectively, for the construction of CFTF, located off site at the Horizon Center Business Park in Oak Ridge, Tennessee. The initial start-up of CFTF occurred in March 2013. A True Minor Source Operating Permit for the facility and its emergency generator is anticipated to be issued in 2018.
DOE/NWSol has two non-Title V Major Source Operating Permits for one emission source and two emergency generators at TWPC. Isotek has a Title V Major Source Operating Permit for the Radiochemical Development Facility (Building 3019 complex). During 2017 no permit limits were exceeded. UCOR was issued a Title V Major Source Operating Permit 569768 on September 18, 2015, for the 3039 stack. No permit limits were exceeded for these sources in 2017.
5.4.2 National Emission Standards for Hazardous Air Pollutants—Asbestos
Numerous facilities, structures, and facility components and various pieces of equipment at ORNL contain asbestos-containing material (ACM). UT-Battelle’s Asbestos Management Program manages the compliance of work activities involving the removal and disposal of ACM, which include notifications to TDEC for all demolition activities and required renovation activities, approval of asbestos work authorization requests, current use of engineering controls and work practices, inspections, air monitoring, and waste tracking of asbestos-contaminated waste material. During 2017 there were no deviations or releases of reportable quantities of ACM.
5.4.3 Oak Ridge National Laboratory Radiological Airborne Effluent Monitoring
Radioactive airborne discharges at ORNL are subject to Rad-NESHAP and consist primarily of ventilation air from radioactively contaminated or potentially contaminated areas, vents from tanks and processes, and ventilation for hot cell operations and reactor facilities. The airborne emissions are treated and then filtered with high- efficiency particulate air filters and/or charcoal filters before discharge. Radiological airborne emissions from ORNL consist of solid particulates, tritium, adsorbable gases (e.g., iodine), and nonadsorbable gases (e.g., noble gases).
The major radiological emission point sources for ORNL consist of the following seven stacks. Six are located in Bethel and Melton Valleys, and one, the SNS Central Exhaust Facility stack, is located on Chestnut Ridge (Figure 5.6):
• 2026 Radioactive Materials Analytical Laboratory • 3020 Radiochemical Development Facility • 3039 central off-gas and scrubber system, which includes the 3500 cell ventilation system, isotope
solid-state ventilation system, 3025 area cell ventilation system, 3042 ventilation system, and 3092 central off-gas system
• 7503 Molten Salt Reactor Experiment Facility

Oak Ridge Reservation Annual Site Environmental Report—2017
Oak Ridge National Laboratory 5-27
• 7880 TWPC • 7911 Melton Valley complex, which includes HFIR and the Radiochemical Engineering
Development Center • 8915 SNS Central Exhaust Facility stack
In 2017 there were 12 minor point/group sources, and emission calculations/estimates were made for each of them.
HFIR = High Flux Isotope Reactor, MSRE = Molten Salt Reactor Experiment, and SNS = Spallation Neutron Source
Figure 5.6. Locations of major radiological emission points at Oak Ridge National Laboratory, 2017
5.4.3.1 Sample Collection and Analytical Procedure Four of the major point sources (stacks 2026, 3020, 3039, and 7503) are equipped with in-stack source-sampling systems that comply with criteria in the American National Standards Institute (ANSI) standard ANSI N 13.1-1969R (ANSI 1969). The sampling systems generally consist of a multipoint in-stack sampling probe, a sample transport line, a particulate filter, activated charcoal cartridges, a silica gel cartridge (if required), flow-measurement and totalizing instruments, a sampling pump, and a return line to the stack. The 7911 (Melton Valley complex) and 7880 (TWPC) stacks are equipped with in-stack source-sampling systems that comply with criteria in the ANSI–Health Physics Society standard ANSI/HPS N13.1-1999 (ANSI 1999).
The 7911 sampling system has the same components as the ANSI 1969 sampling systems but uses a stainless-steel-shrouded probe instead of a multipoint in-stack sampling probe. The sampling system also consists of a high-purity germanium detector with an analog-to-digital converter and ORTEC

Oak Ridge Reservation Annual Site Environmental Report—2017
Oak Ridge National Laboratory 5-28
GammaVision software, which allows for continuous isotopic identification and quantification of radioactive noble gases (e.g., 41Ar) in the effluent stream. The 7880 sampling system consists of a stainless-steel-shrouded probe, an in-line filter-cartridge holder placed at the probe to minimize line losses, a particulate filter, a sample transport line, a rotary vane vacuum pump, and a return line to the stack. The sample probes from both the ANSI 1969 and ANSI 1999 stack-sampling systems are removed, inspected, and cleaned annually. The SNS Central Exhaust Facility (8915) stack is equipped with an in- stack radiation detector that complies with criteria in ANSI/HPS N13.1-1999 (ANSI 1999). The detector monitors radioactive gases flowing through the exhaust stack and provides a continual readout of activity detected by a scintillator probe. The detector is calibrated to correlate with isotopic emissions.
Velocity profiles are performed quarterly at major sources (except for the 3039 stack) and at some minor sources; the criteria in EPA Method 2 (EPA 2010) are followed. The profiles provide accurate stack flow data for subsequent emission-rate calculations. An annual leak-check program is carried out to verify the integrity of the sample transport system. An annual comparison is performed for the 7880 stack between the effluent flow rate totalizer and EPA Method 2. The response of the stack effluent-flow-rate monitoring system is checked quarterly with the manufacturer’s instrument test procedures. The stack sampler rotameter is calibrated at least quarterly in comparison with a secondary (transfer) standard. Only a certified secondary standard is used for all rotameter tests.
Starting in 2017, the 3039 emissions are calculated using a fixed stack flow rate. A fixed stack flow rate is used because the stack velocity at the sampling level is at or below the sensitivity of standard methods for measuring the velocity and therefore stack flow rates can no longer be determined. Low effluent velocity measurements are due to stack flow reductions resulting from the removal of facilities exhausting through the stack. The EPA Region 4 office approved a request to use an alternative fixed stack flow for emission calculations for the 3039 stack in a letter dated April 27, 2017 (V. Anne Heard, Acting Regional Administrator, United States Environmental Protection Agency Region 4 to Raymond J. Skwarek, Environmental Safety, Health and Quality Assurance Manager, UCOR, April 27, 2017).
In addition to the major sources, ORNL has a number of minor sources that have the potential to emit radionuclides to the atmosphere. A minor source is defined as any ventilation system or component such as a vent, laboratory hood, room exhaust, or stack that does not meet the approved regulatory criteria for a major source but that is located in or vents from a radiological control area as defined by Radiological Support Services of the UT-Battelle Nuclear and Radiological Protection Division. Various methods are used to determine the emissions from the various minor sources. Methods used for calculations of minor source emissions comply with EPA criteria. The minor sources are evaluated on a 1 to 5 year basis. Major and minor emissions are compiled annually to determine the overall ORNL source term and associated dose.
The charcoal cartridges, particulate filters, and silica-gel traps are collected weekly to biweekly. The use of charcoal cartridges is a standard method for capturing and quantifying radioactive iodine in airborne emissions. Gamma spectrometric analysis of the charcoal samples quantifies the adsorbable gases. Analyses are performed weekly to biweekly. Particulate filters are held for 8 days before a weekly gross alpha and gross beta analysis to minimize the contribution from short-lived isotopes such as 220Rn and its daughter products. At stack 7911, a weekly gamma scan is conducted to better detect short-lived gamma isotopes. The filters are then composited quarterly or semiannually and are analyzed for alpha-, beta-, and gamma-emitting isotopes. At stack 7880, the filters are composited monthly and analyzed for alpha-, beta-, and gamma-emitting isotopes. The sampling system on stack 7880 requires no other type of radionuclide collection media. Compositing provides a better opportunity for quantification of the low-concentration isotopes. Silica-gel traps are used to capture water vapor that may contain tritium. Analysis is performed weekly to biweekly. At the end of the year, the sample probes for all of the stacks are rinsed, except for the 8915 and 7880 probes, and the rinsate is collected and submitted for isotopic analysis
Oak Ridge Reservation Annual Site Environmental Report—2017
Oak Ridge National Laboratory 5-29
identical to that performed on the particulate filters. A probe-cleaning program has been determined unnecessary for 8915 because the sample probe is a scintillator probe used to detect radiation and not to extract a sample of stack exhaust emissions. It is not anticipated that contaminant deposits would collect on the scintillator probe. A probe-cleaning program for 7880 has established that rinse analysis historically showed no detectable contamination. Therefore, the frequency of probe rinse collection and analysis is no more often than every 3 years unless there is an increase in particulate emissions, an increase in detectable radionuclides in the sample media, or process modifications.
The data from the charcoal cartridges, silica gel, probe wash, and filter composites are compiled to give the annual emissions for each major source and some minor sources.
5.4.3.2 Results Annual radioactive airborne emissions for ORNL in 2017 are presented in Table 5.7. All data presented were determined to be statistically different from zero at the 95% confidence level. Any number not statistically different from zero was not included in the emission calculation. Because measuring a radionuclide requires counting random radioactive emissions from a sample, the same result may not be obtained if the sample is analyzed repeatedly. This deviation is referred to as the “counting uncertainty.” Statistical significance at the 95% confidence level means that there is a 5% chance that the results could be erroneous.
Historical trends for tritium (3H) and 131I are presented in Figures 5.7 and 5.8. For 2017, tritium emissions totaled about 897 Ci (Figure 5.7), a decrease in the emissions seen in 2016; 131I emissions totaled 0.39 Ci (Figure 5.8), a tenfold increase from 2016 due to REDC target research. For 2017, of the 324 radionuclides released from ORNL operations and evaluated (see Table 5.7), the isotopes that contributed 10% or more to the off-site dose from ORNL were 212Pb and 11C, contributing about 30% and 17%, respectively. Emissions of 212Pb result from the radiation decay of legacy material stored on-site and areas containing isotopes of 228Th, 232Th, and 232U. Emissions of 212Pb were from the following stacks: 2026, 3020, 3039, 7503, 7856, 7911, the STP Sludge Drier, and the 3000 and 4000 area laboratory hoods. Carbon-11 emissions result from SNS operations and research activities. For 2017, 212Pb emissions totaled 3.94 Ci and 11C emissions totaled 16,510 Ci, over half that of 2016 (see Figure 5.9).
The calculated radiation dose to the maximally exposed individual (MEI) from all radiological airborne release points at ORR during 2017 was 0.3 mrem. The dose contribution to the MEI from all ORNL radiological airborne release points was 23.4% of the ORR dose. This dose is well below the NESHAPs standard of 10 mrem and is equal to approximately 0.1% of the roughly 300 mrem that the average individual receives from natural sources of radiation. (See Section 7.1.2 for an explanation of how the airborne radionuclide dose was determined.)
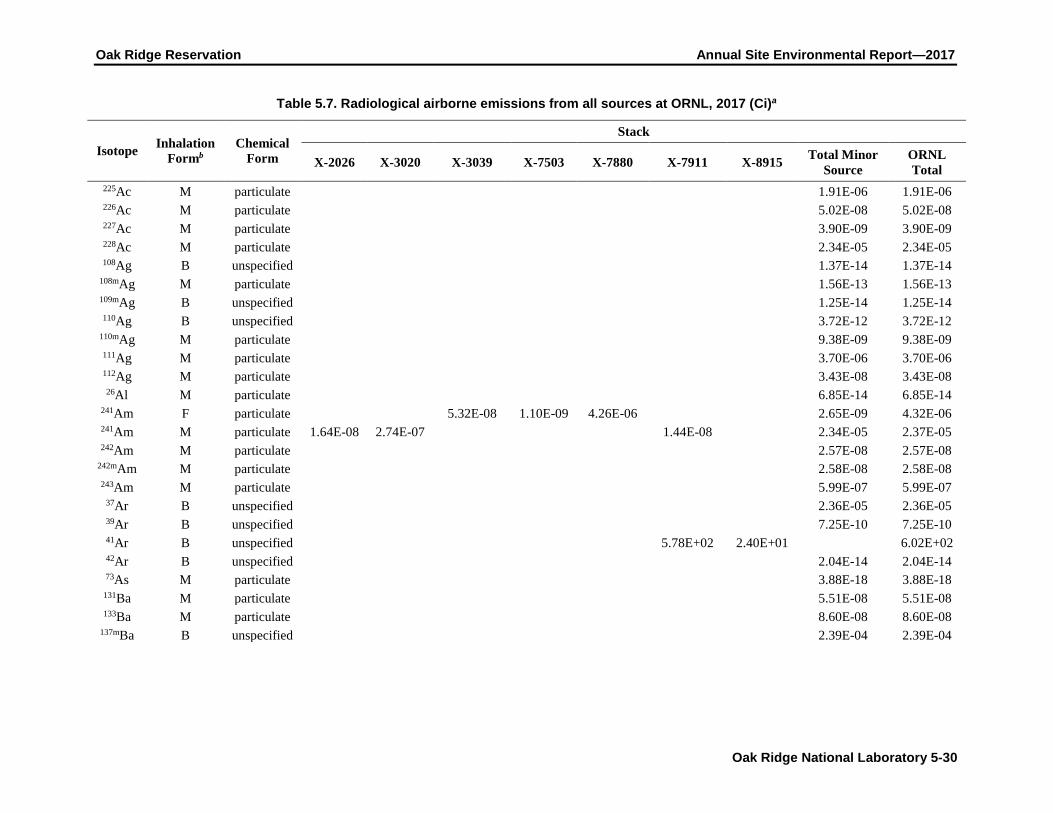
Oak Ridge Reservation Annual Site Environmental Report—2017
Oak Ridge National Laboratory 5-30
Table 5.7. Radiological airborne emissions from all sources at ORNL, 2017 (Ci)a
Isotope Inhalation Formb
Chemical Form
Stack
X-2026 X-3020 X-3039 X-7503 X-7880 X-7911 X-8915 Total Minor Source
ORNL Total
225Ac M particulate 1.91E-06 1.91E-06 226Ac M particulate 5.02E-08 5.02E-08 227Ac M particulate 3.90E-09 3.90E-09 228Ac M particulate 2.34E-05 2.34E-05 108Ag B unspecified 1.37E-14 1.37E-14
108mAg M particulate 1.56E-13 1.56E-13 109mAg B unspecified 1.25E-14 1.25E-14 110Ag B unspecified 3.72E-12 3.72E-12
110mAg M particulate 9.38E-09 9.38E-09 111Ag M particulate 3.70E-06 3.70E-06 112Ag M particulate 3.43E-08 3.43E-08 26Al M particulate 6.85E-14 6.85E-14
241Am F particulate 5.32E-08 1.10E-09 4.26E-06 2.65E-09 4.32E-06 241Am M particulate 1.64E-08 2.74E-07 1.44E-08 2.34E-05 2.37E-05 242Am M particulate 2.57E-08 2.57E-08
242mAm M particulate 2.58E-08 2.58E-08 243Am M particulate 5.99E-07 5.99E-07
37Ar B unspecified 2.36E-05 2.36E-05 39Ar B unspecified 7.25E-10 7.25E-10 41Ar B unspecified 5.78E+02 2.40E+01 6.02E+02 42Ar B unspecified 2.04E-14 2.04E-14 73As M particulate 3.88E-18 3.88E-18
131Ba M particulate 5.51E-08 5.51E-08 133Ba M particulate 8.60E-08 8.60E-08
137mBa B unspecified 2.39E-04 2.39E-04
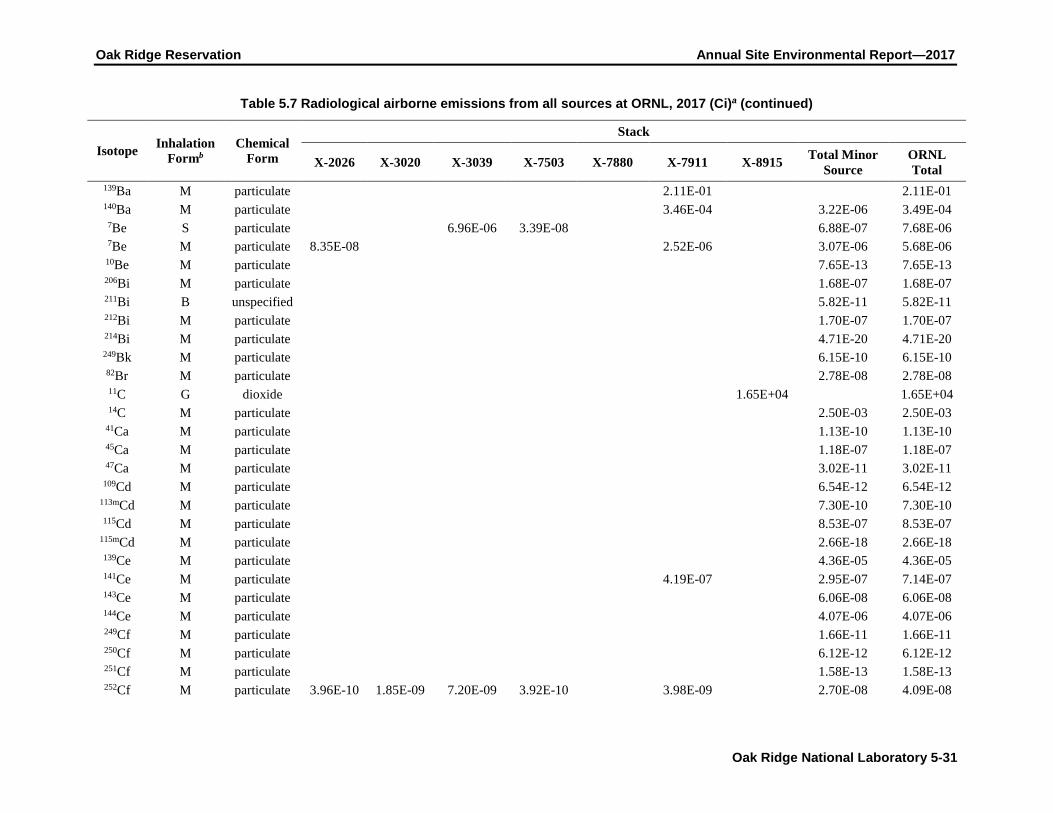
Oak Ridge Reservation Annual Site Environmental Report—2017
Oak Ridge National Laboratory 5-31
Table 5.7 Radiological airborne emissions from all sources at ORNL, 2017 (Ci)a (continued)
Isotope Inhalation Formb
Chemical Form
Stack
X-2026 X-3020 X-3039 X-7503 X-7880 X-7911 X-8915 Total Minor Source
ORNL Total
139Ba M particulate 2.11E-01 2.11E-01 140Ba M particulate 3.46E-04 3.22E-06 3.49E-04 7Be S particulate 6.96E-06 3.39E-08 6.88E-07 7.68E-06 7Be M particulate 8.35E-08 2.52E-06 3.07E-06 5.68E-06 10Be M particulate 7.65E-13 7.65E-13 206Bi M particulate 1.68E-07 1.68E-07 211Bi B unspecified 5.82E-11 5.82E-11 212Bi M particulate 1.70E-07 1.70E-07 214Bi M particulate 4.71E-20 4.71E-20 249Bk M particulate 6.15E-10 6.15E-10 82Br M particulate 2.78E-08 2.78E-08 11C G dioxide 1.65E+04 1.65E+04 14C M particulate 2.50E-03 2.50E-03
41Ca M particulate 1.13E-10 1.13E-10 45Ca M particulate 1.18E-07 1.18E-07 47Ca M particulate 3.02E-11 3.02E-11
109Cd M particulate 6.54E-12 6.54E-12 113mCd M particulate 7.30E-10 7.30E-10 115Cd M particulate 8.53E-07 8.53E-07
115mCd M particulate 2.66E-18 2.66E-18 139Ce M particulate 4.36E-05 4.36E-05 141Ce M particulate 4.19E-07 2.95E-07 7.14E-07 143Ce M particulate 6.06E-08 6.06E-08 144Ce M particulate 4.07E-06 4.07E-06 249Cf M particulate 1.66E-11 1.66E-11 250Cf M particulate 6.12E-12 6.12E-12 251Cf M particulate 1.58E-13 1.58E-13 252Cf M particulate 3.96E-10 1.85E-09 7.20E-09 3.92E-10 3.98E-09 2.70E-08 4.09E-08

Oak Ridge Reservation Annual Site Environmental Report—2017
Oak Ridge National Laboratory 5-32
Table 5.7 Radiological airborne emissions from all sources at ORNL, 2017 (Ci)a (continued)
Isotope Inhalation Formb
Chemical Form
Stack
X-2026 X-3020 X-3039 X-7503 X-7880 X-7911 X-8915 Total Minor Source
ORNL Total
36Cl M particulate 3.90E-10 3.90E-10 242Cm M particulate 7.52E-08 7.52E-08 243Cm F particulate 1.07E-08 5.55E-09 2.16E-07 6.98E-10 2.33E-07 243Cm M particulate 2.80E-08 1.05E-08 9.38E-08 1.32E-07 244Cm F particulate 1.07E-08 5.55E-09 2.16E-07 6.98E-10 2.33E-07 244Cm M particulate 2.80E-08 2.56E-08 1.05E-08 3.47E-05 3.47E-05 245Cm M particulate 8.15E-09 8.15E-09 246Cm M particulate 3.63E-09 3.63E-09 247Cm M particulate 7.02E-09 7.02E-09 248Cm M particulate 4.78E-09 4.78E-09 56Co M particulate 1.80E-13 1.80E-13 57Co M particulate 1.20E-08 1.20E-08 58Co M particulate 3.06E-08 3.06E-08 60Co M particulate 1.26E-04 1.26E-04 60Co S particulate 4.75E-07 4.75E-07
60mCo M particulate 1.05E-13 1.05E-13 51Cr M particulate 5.20E-05 5.20E-05
131Cs F particulate 4.01E-10 4.01E-10 132Cs F particulate 8.87E-09 8.87E-09 134Cs F particulate 7.50E-06 7.50E-06 135Cs F particulate 1.60E-09 1.60E-09 136Cs F particulate 4.12E-07 4.12E-07 137Cs F particulate 1.02E-06 3.98E-06 2.46E-02 7.53E-04 2.54E-02 137Cs S particulate 5.17E-05 1.21E-07 1.01E-07 5.19E-05 138Cs F particulate 2.36E+02 2.36E+02 64Cu M particulate 1.07E-07 1.07E-07 66Cu B unspecified 1.93E-13 1.93E-13 67Cu M particulate 1.25E-09 1.25E-09

Oak Ridge Reservation Annual Site Environmental Report—2017
Oak Ridge National Laboratory 5-33
Table 5.7 Radiological airborne emissions from all sources at ORNL, 2017 (Ci)a (continued)
Isotope Inhalation Formb
Chemical Form
Stack
X-2026 X-3020 X-3039 X-7503 X-7880 X-7911 X-8915 Total Minor Source
ORNL Total
159Dy M particulate 2.86E-16 2.86E-16 152Eu M particulate 3.47E-04 3.47E-04 154Eu M particulate 5.88E-05 5.88E-05 155Eu M particulate 6.69E-06 6.69E-06 156Eu M particulate 3.30E-06 3.30E-06 55Fe M particulate 3.32E-05 3.32E-05 59Fe M particulate 3.91E-07 3.91E-07 60Fe M particulate 1.05E-13 1.05E-13 72Ga M particulate 7.71E-13 7.71E-13
151Gd M particulate 1.88E-12 1.88E-12 153Gd M particulate 4.38E-06 4.38E-06 71Ge M particulate 4.16E-10 4.16E-10
3H V vapor 9.19E-03 3.11E+00 6.38E-01 2.51E+02 6.42E+02 2.79E-01 8.97E+02 175Hf M particulate 1.42E-08 1.42E-08
178mHf M particulate 4.01E-11 4.01E-11 181Hf M particulate 3.22E-07 3.22E-07 203Hg M inorganic 5.75E-13 5.75E-13
166mHo M particulate 1.94E-12 1.94E-12 124I F particulate 1.22E-07 1.22E-07 126I F particulate 1.22E-07 1.22E-07 129I F particulate 1.49E-06 1.22E-04 1.23E-04 131I F particulate 3.89E-01 6.21E-06 3.89E-01 132I F particulate 5.50E-01 5.50E-01 133I F particulate 3.88E-01 4.00E-10 3.88E-01 134I F particulate 8.48E-01 8.48E-01 135I F particulate 1.09E+00 1.09E+00
113mIn M particulate 7.11E-10 7.11E-10 114In B unspecified 8.67E-12 8.67E-12

Oak Ridge Reservation Annual Site Environmental Report—2017
Oak Ridge National Laboratory 5-34
Table 5.7 Radiological airborne emissions from all sources at ORNL, 2017 (Ci)a (continued)
Isotope Inhalation Formb
Chemical Form
Stack
X-2026 X-3020 X-3039 X-7503 X-7880 X-7911 X-8915 Total Minor Source
ORNL Total
114mIn M particulate 4.35E-10 4.35E-10 192Ir M particulate 1.73E-13 1.73E-13 40K M particulate 7.99E-05 7.99E-05 42K M particulate 2.04E-14 2.04E-14
85Kr B unspecified 1.37E+03 3.36E-01 1.37E+03 85mKr B unspecified 6.73E+00 6.73E+00 87Kr B unspecified 4.12E+01 3.50E+01 7.62E+01 88Kr B unspecified 5.32E+01 1.90E+01 7.22E+01 89Kr B unspecified 3.30E+01 3.3E+01 137La M particulate 1.80E-14 1.80E-14 140La M particulate 7.85E-07 7.85E-07 173Lu M particulate 3.32E-13 3.32E-13 174Lu M particulate 1.31E-13 1.31E-13
174mLu M particulate 1.24E-14 1.24E-14 177Lu M particulate 9.28E-11 9.28E-11
177mLu M particulate 2.20E-12 2.20E-12 53Mn M particulate 6.94E-19 6.94E-19 54Mn M particulate 1.86E-06 1.86E-06 56Mn M particulate 6.08E-22 6.08E-22 93Mo M particulate 1.24E-04 1.24E-04 99Mo M particulate 1.56E-06 1.56E-06
13N B unspecified 3.63E+02 3.63E+02 22Na M particulate 2.71E-11 2.71E-11 24Na M particulate 2.72E-08 2.72E-08
91mNb B unspecified 2.75E-13 2.75E-13 92Nb B unspecified 3.23E-18 3.23E-18
93mNb M particulate 3.78E-09 3.78E-09 94Nb M particulate 3.57E-08 3.57E-08

Oak Ridge Reservation Annual Site Environmental Report—2017
Oak Ridge National Laboratory 5-35
Table 5.7 Radiological airborne emissions from all sources at ORNL, 2017 (Ci)a (continued)
Isotope Inhalation Formb
Chemical Form
Stack
X-2026 X-3020 X-3039 X-7503 X-7880 X-7911 X-8915 Total Minor Source
ORNL Total
95Nb M particulate 6.31E-07 6.31E-07 95mNb M particulate 1.78E-13 1.78E-13 96Nb M particulate 5.41E-09 5.41E-09 97Nb M particulate 3.30E-09 3.30E-09 147Nd M particulate 2.58E-07 2.58E-07 59Ni M particulate 1.12E-07 1.12E-07 63Ni M particulate 6.60E-03 6.60E-03 65Ni M particulate 4.69E-25 4.69E-25 66Ni M particulate 1.92E-13 1.92E-13
235Np M particulate 2.24E-14 2.24E-14 237Np M particulate 1.18E-07 1.18E-07 238Np M particulate 1.23E-10 1.23E-10 239Np M particulate 2.14E-07 2.14E-07 185Os M particulate 2.15E-14 2.15E-14 191Os M particulate 7.03E-10 7.03E-10
32P M particulate 7.97E-10 7.97E-10 33P M particulate 1.67E-12 1.67E-12
228Pa M particulate 3.30E-09 3.30E-09 230Pa M particulate 3.80E-07 3.80E-07 231Pa M particulate 4.24E-13 4.24E-13 232Pa M particulate 1.09E-08 1.09E-08 233Pa M particulate 1.51E-06 1.51E-06 234Pa M particulate 1.84E-12 1.84E-12
234mPa B unspecified 1.13E-09 1.13E-09 212Pb M particulate 5.08E-01 3.72E-01 4.15E-02 1.08E-05 9.22E-01 212Pb S particulate 2.89E+00 9.68E-02 3.07E-02 3.02E+00 214Pb M particulate 4.71E-20 4.71E-20 214Pb S particulate 4.83E-02 4.83E-02
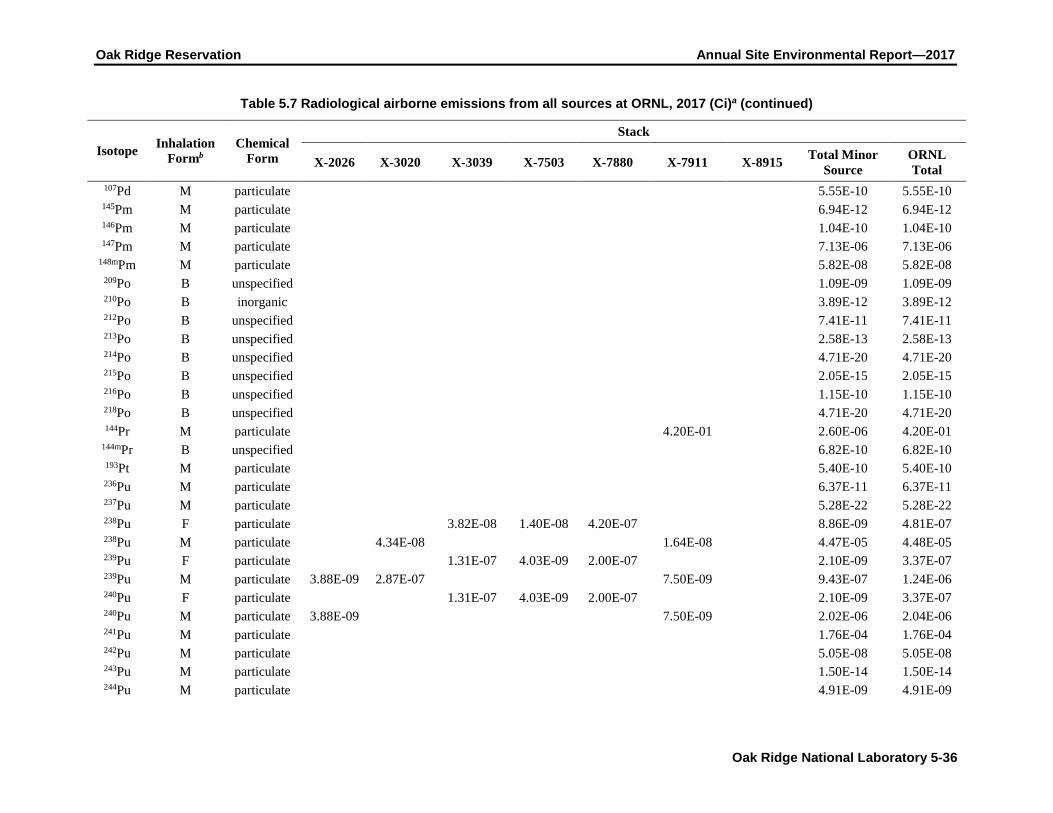
Oak Ridge Reservation Annual Site Environmental Report—2017
Oak Ridge National Laboratory 5-36
Table 5.7 Radiological airborne emissions from all sources at ORNL, 2017 (Ci)a (continued)
Isotope Inhalation Formb
Chemical Form
Stack
X-2026 X-3020 X-3039 X-7503 X-7880 X-7911 X-8915 Total Minor Source
ORNL Total
107Pd M particulate 5.55E-10 5.55E-10 145Pm M particulate 6.94E-12 6.94E-12 146Pm M particulate 1.04E-10 1.04E-10 147Pm M particulate 7.13E-06 7.13E-06
148mPm M particulate 5.82E-08 5.82E-08 209Po B unspecified 1.09E-09 1.09E-09 210Po B inorganic 3.89E-12 3.89E-12 212Po B unspecified 7.41E-11 7.41E-11 213Po B unspecified 2.58E-13 2.58E-13 214Po B unspecified 4.71E-20 4.71E-20 215Po B unspecified 2.05E-15 2.05E-15 216Po B unspecified 1.15E-10 1.15E-10 218Po B unspecified 4.71E-20 4.71E-20 144Pr M particulate 4.20E-01 2.60E-06 4.20E-01
144mPr B unspecified 6.82E-10 6.82E-10 193Pt M particulate 5.40E-10 5.40E-10 236Pu M particulate 6.37E-11 6.37E-11 237Pu M particulate 5.28E-22 5.28E-22 238Pu F particulate 3.82E-08 1.40E-08 4.20E-07 8.86E-09 4.81E-07 238Pu M particulate 4.34E-08 1.64E-08 4.47E-05 4.48E-05 239Pu F particulate 1.31E-07 4.03E-09 2.00E-07 2.10E-09 3.37E-07 239Pu M particulate 3.88E-09 2.87E-07 7.50E-09 9.43E-07 1.24E-06 240Pu F particulate 1.31E-07 4.03E-09 2.00E-07 2.10E-09 3.37E-07 240Pu M particulate 3.88E-09 7.50E-09 2.02E-06 2.04E-06 241Pu M particulate 1.76E-04 1.76E-04 242Pu M particulate 5.05E-08 5.05E-08 243Pu M particulate 1.50E-14 1.50E-14 244Pu M particulate 4.91E-09 4.91E-09
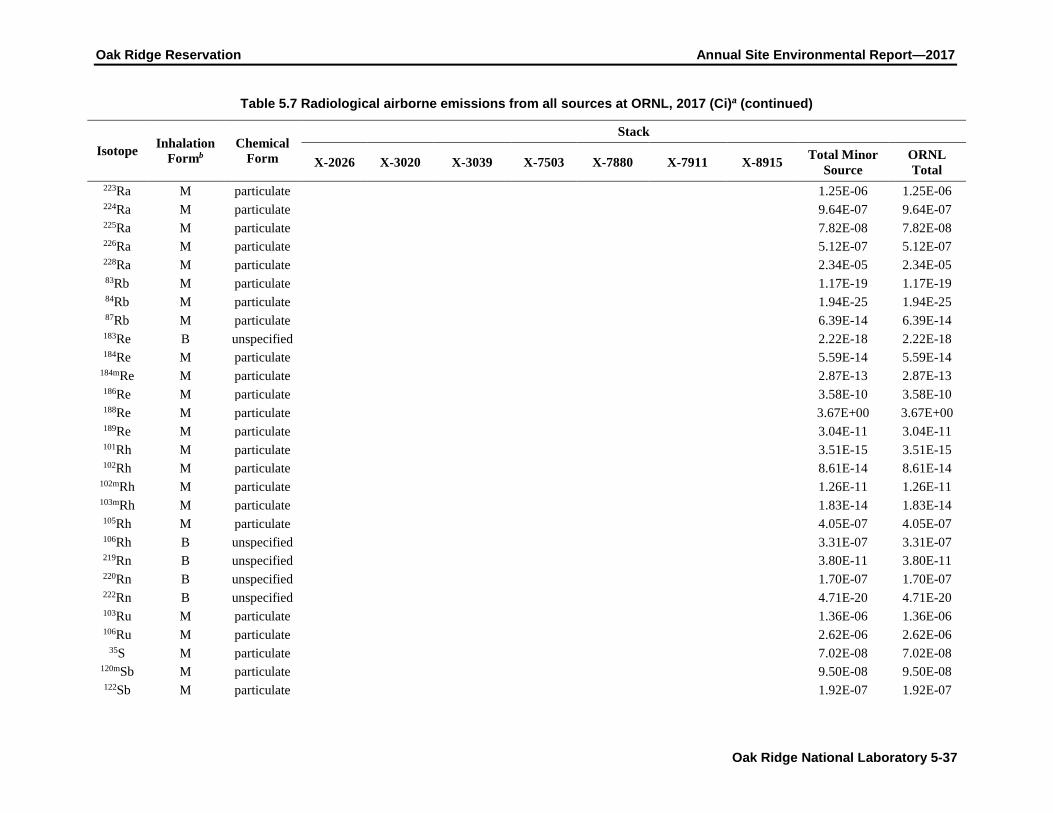
Oak Ridge Reservation Annual Site Environmental Report—2017
Oak Ridge National Laboratory 5-37
Table 5.7 Radiological airborne emissions from all sources at ORNL, 2017 (Ci)a (continued)
Isotope Inhalation Formb
Chemical Form
Stack
X-2026 X-3020 X-3039 X-7503 X-7880 X-7911 X-8915 Total Minor Source
ORNL Total
223Ra M particulate 1.25E-06 1.25E-06 224Ra M particulate 9.64E-07 9.64E-07 225Ra M particulate 7.82E-08 7.82E-08 226Ra M particulate 5.12E-07 5.12E-07 228Ra M particulate 2.34E-05 2.34E-05 83Rb M particulate 1.17E-19 1.17E-19 84Rb M particulate 1.94E-25 1.94E-25 87Rb M particulate 6.39E-14 6.39E-14 183Re B unspecified 2.22E-18 2.22E-18 184Re M particulate 5.59E-14 5.59E-14
184mRe M particulate 2.87E-13 2.87E-13 186Re M particulate 3.58E-10 3.58E-10 188Re M particulate 3.67E+00 3.67E+00 189Re M particulate 3.04E-11 3.04E-11 101Rh M particulate 3.51E-15 3.51E-15 102Rh M particulate 8.61E-14 8.61E-14
102mRh M particulate 1.26E-11 1.26E-11 103mRh M particulate 1.83E-14 1.83E-14 105Rh M particulate 4.05E-07 4.05E-07 106Rh B unspecified 3.31E-07 3.31E-07 219Rn B unspecified 3.80E-11 3.80E-11 220Rn B unspecified 1.70E-07 1.70E-07 222Rn B unspecified 4.71E-20 4.71E-20 103Ru M particulate 1.36E-06 1.36E-06 106Ru M particulate 2.62E-06 2.62E-06
35S M particulate 7.02E-08 7.02E-08 120mSb M particulate 9.50E-08 9.50E-08 122Sb M particulate 1.92E-07 1.92E-07

Oak Ridge Reservation Annual Site Environmental Report—2017
Oak Ridge National Laboratory 5-38
Table 5.7 Radiological airborne emissions from all sources at ORNL, 2017 (Ci)a (continued)
Isotope Inhalation Formb
Chemical Form
Stack
X-2026 X-3020 X-3039 X-7503 X-7880 X-7911 X-8915 Total Minor Source
ORNL Total
124Sb M particulate 7.28E-07 7.28E-07 125Sb M particulate 6.49E-07 8.03E-07 1.45E-06 126Sb M particulate 4.76E-07 4.76E-07
126mSb M particulate 2.17E-09 2.17E-09 127Sb M particulate 3.73E-07 3.73E-07 44Sc M particulate 1.07E-22 1.07E-22 46Sc M particulate 2.44E-04 2.44E-04 47Sc M particulate 1.66E-08 1.66E-08 48Sc M particulate 2.70E-08 2.70E-08 75Se F particulate 4.24E-06 4.24E-06 75Se S particulate 5.95E-05 5.95E-05 79Se F particulate 2.41E-10 2.41E-10 31Si M particulate 4.30E-24 4.30E-24 32Si M particulate 8.73E-15 8.73E-15
145Sm M particulate 2.91E-10 2.91E-10 147Sm M particulate 1.98E-16 1.98E-16 151Sm M particulate 9.06E-07 9.06E-07 113Sn M particulate 8.96E-07 8.96E-07
117mSn M particulate 3.22E-08 3.22E-08 119mSn M particulate 4.88E-10 4.88E-10 121Sn M particulate 3.33E-08 3.33E-08
121mSn M particulate 4.25E-08 4.25E-08 123Sn M particulate 2.64E-04 2.64E-04 125Sn M particulate 4.91E-07 4.91E-07 126Sn M particulate 2.17E-09 2.17E-09 85Sr M particulate 7.29E-08 7.29E-08 89Sr M particulate 4.00E-08 3.46E-06 7.30E-06 3.91E-04 4.01E-04 89Sr S particulate 1.25E-05 1.53E-08 9.82E-08 1.26E-05

Oak Ridge Reservation Annual Site Environmental Report—2017
Oak Ridge National Laboratory 5-39
Table 5.7 Radiological airborne emissions from all sources at ORNL, 2017 (Ci)a (continued)
Isotope Inhalation Formb
Chemical Form
Stack
X-2026 X-3020 X-3039 X-7503 X-7880 X-7911 X-8915 Total Minor Source
ORNL Total
90Sr S particulate 1.25E-05 1.53E-08 3.98E-06 9.82E-08 1.66E-05 90Sr M particulate 4.00E-08 3.46E-06 7.30E-06 5.69E-04 5.80E-04 91Sr M particulate 1.78E-12 1.78E-12
179Ta M particulate 1.87E-12 1.87E-12 182Ta M particulate 7.08E-07 7.08E-07 183Ta M particulate 4.86E-06 4.86E-06 184Ta M particulate 4.08E-14 4.08E-14 157Tb M particulate 4.99E-16 4.99E-16 158Tb M particulate 7.50E-13 7.50E-13 160Tb M particulate 5.55E-11 5.55E-11 95mTc M particulate 2.50E-14 2.50E-14 96Tc M particulate 1.99E-08 1.99E-08 98Tc M particulate 2.08E-14 2.08E-14 99Tc S particulate 3.95E-06 3.95E-06 99Tc M particulate 2.88E-04 2.88E-04 121Te M particulate 4.54E-08 4.54E-08
121mTe M particulate 4.01E-09 4.01E-09 123mTe M particulate 4.90E-09 4.90E-09 125mTe M particulate 1.82E-07 1.82E-07 127Te M particulate 4.01E-13 4.01E-13
127mTe M particulate 2.31E-12 2.31E-12 129mTe M particulate 3.45E-19 3.45E-19 131mTe M particulate 4.71E-08 4.71E-08 132Te M particulate 3.92E-07 3.92E-07 227Th S particulate 1.66E-06 1.66E-06 228Th S particulate 3.64E-09 7.14E-09 1.74E-08 8.38E-09 7.71E-09 4.15E-07 4.59E-07 229Th S particulate 4.19E-08 4.19E-08 230Th S particulate 1.42E-09 3.35E-09 5.62E-09 4.16E-07 4.26E-07
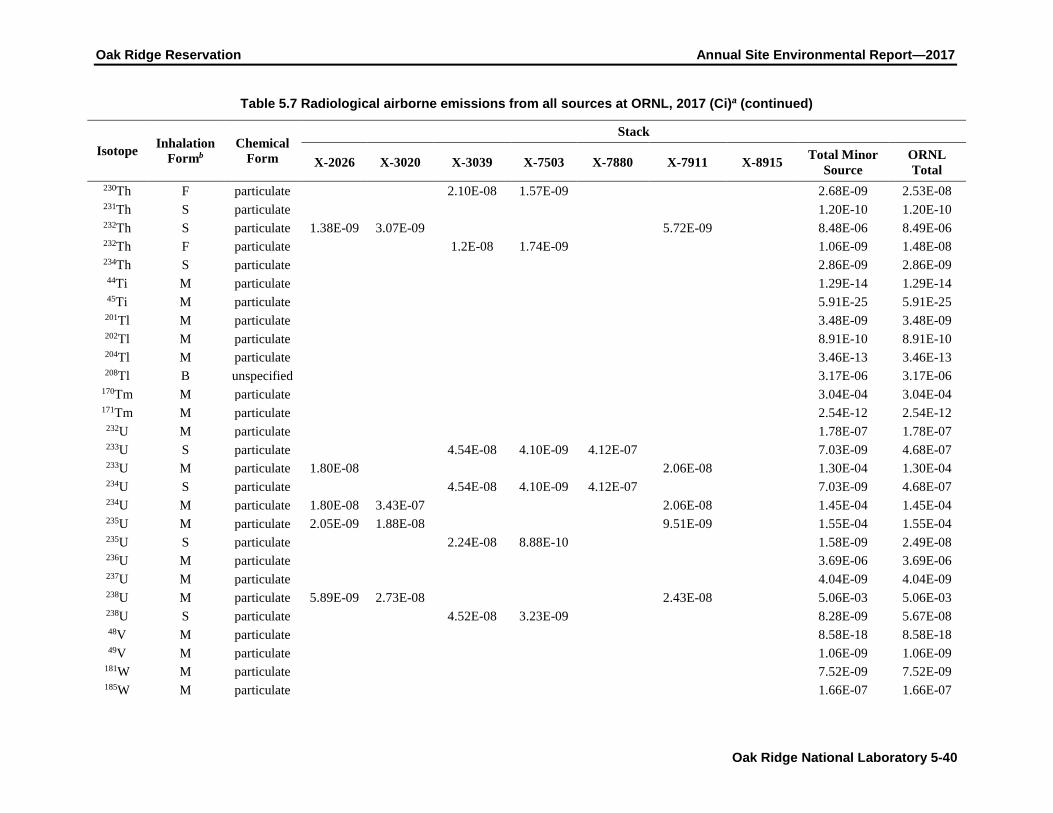
Oak Ridge Reservation Annual Site Environmental Report—2017
Oak Ridge National Laboratory 5-40
Table 5.7 Radiological airborne emissions from all sources at ORNL, 2017 (Ci)a (continued)
Isotope Inhalation Formb
Chemical Form
Stack
X-2026 X-3020 X-3039 X-7503 X-7880 X-7911 X-8915 Total Minor Source
ORNL Total
230Th F particulate 2.10E-08 1.57E-09 2.68E-09 2.53E-08 231Th S particulate 1.20E-10 1.20E-10 232Th S particulate 1.38E-09 3.07E-09 5.72E-09 8.48E-06 8.49E-06 232Th F particulate 1.2E-08 1.74E-09 1.06E-09 1.48E-08 234Th S particulate 2.86E-09 2.86E-09 44Ti M particulate 1.29E-14 1.29E-14 45Ti M particulate 5.91E-25 5.91E-25 201Tl M particulate 3.48E-09 3.48E-09 202Tl M particulate 8.91E-10 8.91E-10 204Tl M particulate 3.46E-13 3.46E-13 208Tl B unspecified 3.17E-06 3.17E-06
170Tm M particulate 3.04E-04 3.04E-04 171Tm M particulate 2.54E-12 2.54E-12
232U M particulate 1.78E-07 1.78E-07 233U S particulate 4.54E-08 4.10E-09 4.12E-07 7.03E-09 4.68E-07 233U M particulate 1.80E-08 2.06E-08 1.30E-04 1.30E-04 234U S particulate 4.54E-08 4.10E-09 4.12E-07 7.03E-09 4.68E-07 234U M particulate 1.80E-08 3.43E-07 2.06E-08 1.45E-04 1.45E-04 235U M particulate 2.05E-09 1.88E-08 9.51E-09 1.55E-04 1.55E-04 235U S particulate 2.24E-08 8.88E-10 1.58E-09 2.49E-08 236U M particulate 3.69E-06 3.69E-06 237U M particulate 4.04E-09 4.04E-09 238U M particulate 5.89E-09 2.73E-08 2.43E-08 5.06E-03 5.06E-03 238U S particulate 4.52E-08 3.23E-09 8.28E-09 5.67E-08 48V M particulate 8.58E-18 8.58E-18 49V M particulate 1.06E-09 1.06E-09
181W M particulate 7.52E-09 7.52E-09 185W M particulate 1.66E-07 1.66E-07

Oak Ridge Reservation Annual Site Environmental Report—2017
Oak Ridge National Laboratory 5-41
Table 5.7 Radiological airborne emissions from all sources at ORNL, 2017 (Ci)a (continued)
Isotope Inhalation Formb
Chemical Form
Stack
X-2026 X-3020 X-3039 X-7503 X-7880 X-7911 X-8915 Total Minor Source
ORNL Total
187W M particulate 3.13E-03 3.13E-03 188W M particulate 3.26E-04 3.26E-04 127Xe B unspecified 3.05E+02 3.05E+02
131mXe B unspecified 1.38E+02 1.38E+02 133Xe B unspecified 9.70E-05 1.47E+01 1.47E+01
133mXe B unspecified 2.62E+01 2.62E+01 135Xe B unspecified 2.68E+01 2.68E+01
135m Xe B unspecified 1.06E+01 1.06E+01 137Xe B unspecified 4.80E+01 4.80E+01 138Xe B unspecified 7.73E+01 7.73E+01
88Y M particulate 3.70E-09 3.70E-09 90Y M particulate 1.47E-04 1.47E-04 91Y M particulate 6.33E-10 6.33E-10
65Zn M particulate 9.89E-06 9.89E-06 69Zn M particulate 7.88E-10 7.88E-10 88Zr M particulate 6.99E-20 6.99E-20 93Zr M particulate 5.66E-09 5.66E-09 95Zr M particulate 7.32E-07 7.32E-07 97Zr M particulate 2.30E-09 2.30E-09
Totals 5.17E-01 3.72E-01 6.05E+00 7.35E-01 1.58E-05 2.91E+03 1.79E+04 4.34E+00 2.08E+04 a Emissions given in curies (Ci). 1 Ci = 3.7E+10 Bq b The designation of F, M, and S refers to the lung clearance type: Fast (F), Moderate (M), and Slow (S) for the given radionuclide. G stands for gaseous, V stands for vapor, and B stands for Blank, unspecified form.

Oak Ridge Reservation Annual Site Environmental Report—2017
Oak Ridge National Laboratory 5-42
Figure 5.7. Total curies of tritium discharged from Oak Ridge National Laboratory to the atmosphere,
2013–2017
Figure 5.8. Total curies of 131I discharged from Oak Ridge National Laboratory to the atmosphere,
2013–2017
Figure 5.9. Total curies of 11C discharged from Oak Ridge National Laboratory to the atmosphere,
2013–2017
5.4.4 Stratospheric Ozone Protection
As required by the CAA Title VI Amendments of 1990 and in accordance with 40 CFR Part 82, actions have been implemented to comply with the prohibition against intentionally releasing ozone-depleting substances (ODSs) during maintenance activities performed on refrigeration equipment. During 2017, EPA enacted major revisions to the Stratospheric Ozone rules to include the regulation of non-ODS substitutes as part of 40 CFR 82 Subpart F. These revisions are effective January 1, 2018, for disposal of small appliances and January 1, 2019, for the leak rate provisions for large appliances. Assessments were
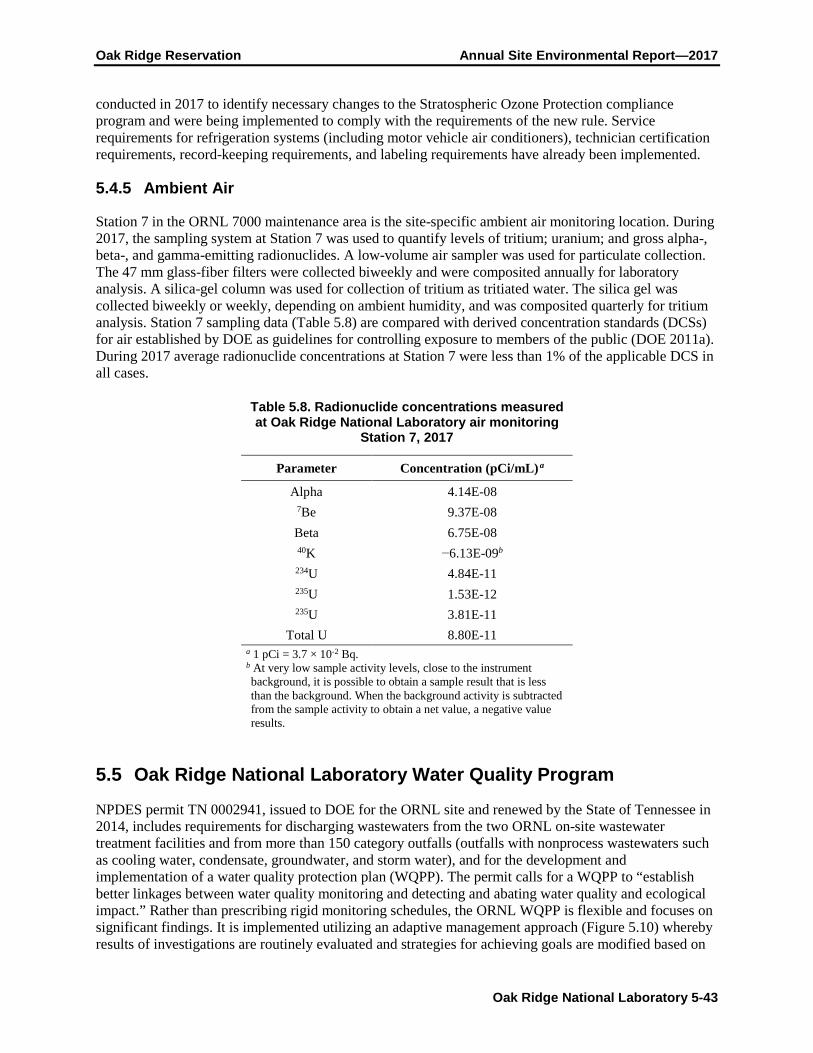
Oak Ridge Reservation Annual Site Environmental Report—2017
Oak Ridge National Laboratory 5-43
conducted in 2017 to identify necessary changes to the Stratospheric Ozone Protection compliance program and were being implemented to comply with the requirements of the new rule. Service requirements for refrigeration systems (including motor vehicle air conditioners), technician certification requirements, record-keeping requirements, and labeling requirements have already been implemented.
5.4.5 Ambient Air
Station 7 in the ORNL 7000 maintenance area is the site-specific ambient air monitoring location. During 2017, the sampling system at Station 7 was used to quantify levels of tritium; uranium; and gross alpha-, beta-, and gamma-emitting radionuclides. A low-volume air sampler was used for particulate collection. The 47 mm glass-fiber filters were collected biweekly and were composited annually for laboratory analysis. A silica-gel column was used for collection of tritium as tritiated water. The silica gel was collected biweekly or weekly, depending on ambient humidity, and was composited quarterly for tritium analysis. Station 7 sampling data (Table 5.8) are compared with derived concentration standards (DCSs) for air established by DOE as guidelines for controlling exposure to members of the public (DOE 2011a). During 2017 average radionuclide concentrations at Station 7 were less than 1% of the applicable DCS in all cases.
Table 5.8. Radionuclide concentrations measured at Oak Ridge National Laboratory air monitoring
Station 7, 2017
Parameter Concentration (pCi/mL) a
Alpha 4.14E-08 7Be 9.37E-08 Beta 6.75E-08 40K −6.13E-09b 234U 4.84E-11 235U 1.53E-12 235U 3.81E-11
Total U 8.80E-11 a 1 pCi = 3.7 × 10⁻² Bq. b At very low sample activity levels, close to the instrument background, it is possible to obtain a sample result that is less than the background. When the background activity is subtracted from the sample activity to obtain a net value, a negative value results.
5.5 Oak Ridge National Laboratory Water Quality Program
NPDES permit TN 0002941, issued to DOE for the ORNL site and renewed by the State of Tennessee in 2014, includes requirements for discharging wastewaters from the two ORNL on-site wastewater treatment facilities and from more than 150 category outfalls (outfalls with nonprocess wastewaters such as cooling water, condensate, groundwater, and storm water), and for the development and implementation of a water quality protection plan (WQPP). The permit calls for a WQPP to “establish better linkages between water quality monitoring and detecting and abating water quality and ecological impact.” Rather than prescribing rigid monitoring schedules, the ORNL WQPP is flexible and focuses on significant findings. It is implemented utilizing an adaptive management approach (Figure 5.10) whereby results of investigations are routinely evaluated and strategies for achieving goals are modified based on

Oak Ridge Reservation Annual Site Environmental Report—2017
Oak Ridge National Laboratory 5-44
those evaluations. The goals established for the WQPP are to meet the requirements of the NPDES permit, improve the quality of aquatic resources on the ORNL site, prevent further impacts to aquatic resources from current activities, identify the stressors that contribute to impairment of aquatic resources, use available resources efficiently, and communicate outcomes with decision makers and stakeholders.
The ORNL WQPP was developed by UT-Battelle and was approved by TDEC in 2008, and the WQPP monitoring was initiated in 2009. Revisions to the WQPP are submitted to TDEC for review and comment. The WQPP incorporated several control plans that were required under the previous NPDES permit, including a biological monitoring and abatement plan (BMAP), a chlorine control strategy, a storm water pollution prevention plan, a non-storm water best management practices plan, and an NPDES radiological monitoring plan.
To prioritize the stressors and/or contaminant sources that may be of greatest concern to water quality and to define conceptual models that would guide any special investigations, the WQPP strategy was defined using EPA’s Stressor Identification Guidance Document (EPA 2000). Figure 5.11 summarizes that process. The process involves three major steps for identifying the cause of any impairment:
1. list candidate causes of impairment (based on historical data and a working conceptual model),
2. analyze the evidence (using both case study and outside data), and
3. characterize the causes.
The first two steps of the stressor identification process were initiated in 2009, focusing first on mercury impairment (Figure 5.11) and then on PCB impairment because mercury and PCB concentrations in fish from White Oak Creek (WOC) are at or near human health risk thresholds (e.g., EPA ambient water quality criteria [AWQCs] and TDEC fish advisory limits). Some of the major sources of mercury to biota in the WOC watershed are known, providing a good basis from which to define an appropriate conceptual model for mercury contamination in WOC. A list of potential causes of PCB contamination was also developed.
After potential causes were listed and the available evidence of mercury and PCB contamination in the WOC watershed was analyzed, it was clear that additional investigation was needed to characterize the causes. Special investigations were designed to identify specific source areas and to revise the conceptual model of the major causes of contamination in the WOC watershed.
Monitoring and investigation data collected under the ORNL WQPP are analyzed, interpreted, reported, and compared with past results at least annually. The significant findings are reported in the Annual Site Environmental Report, and a more comprehensive report of findings is submitted to TDEC on a biannual basis. This information provides an assessment of the status of ORNL’s receiving-stream watersheds and the impact of ongoing efforts to protect and restore those watersheds and will guide efforts to improve the water quality in the watershed.

Oak Ridge Reservation Annual Site Environmental Report—2017
Oak Ridge National Laboratory 5-45
Adapted from the US Environmental Protection Agency (EPA) stressor guidance document (EPA 2000). CWA = Clean Water Act, NPDES = National Pollutant Discharge Elimination System, ORNL = Oak Ridge National Laboratory, PCB = polychlorinated biphenyl, TDEC = Tennessee Department of Environment and Conservation
Figure 5.10. Diagram of the adaptive management framework with step-wise planning specific to the Oak Ridge National Laboratory Water Quality Protection Plan (WQPP)
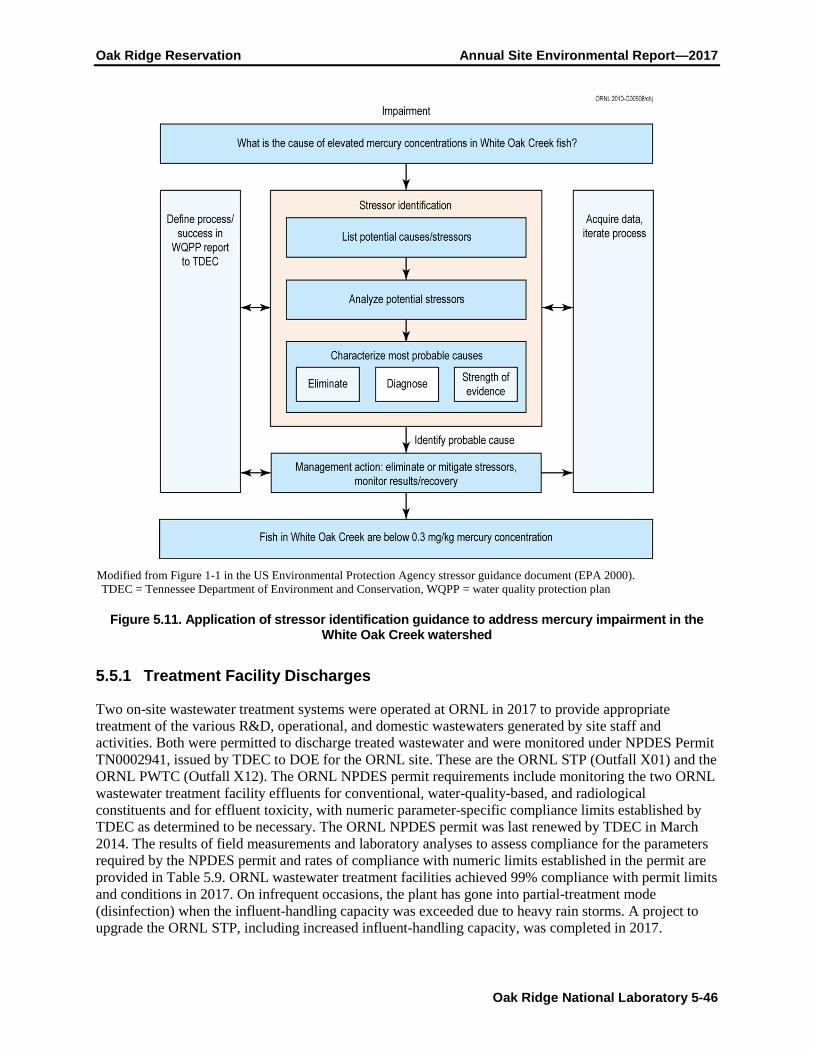
Oak Ridge Reservation Annual Site Environmental Report—2017
Oak Ridge National Laboratory 5-46
Modified from Figure 1-1 in the US Environmental Protection Agency stressor guidance document (EPA 2000). TDEC = Tennessee Department of Environment and Conservation, WQPP = water quality protection plan
Figure 5.11. Application of stressor identification guidance to address mercury impairment in the White Oak Creek watershed
5.5.1 Treatment Facility Discharges
Two on-site wastewater treatment systems were operated at ORNL in 2017 to provide appropriate treatment of the various R&D, operational, and domestic wastewaters generated by site staff and activities. Both were permitted to discharge treated wastewater and were monitored under NPDES Permit TN0002941, issued by TDEC to DOE for the ORNL site. These are the ORNL STP (Outfall X01) and the ORNL PWTC (Outfall X12). The ORNL NPDES permit requirements include monitoring the two ORNL wastewater treatment facility effluents for conventional, water-quality-based, and radiological constituents and for effluent toxicity, with numeric parameter-specific compliance limits established by TDEC as determined to be necessary. The ORNL NPDES permit was last renewed by TDEC in March 2014. The results of field measurements and laboratory analyses to assess compliance for the parameters required by the NPDES permit and rates of compliance with numeric limits established in the permit are provided in Table 5.9. ORNL wastewater treatment facilities achieved 99% compliance with permit limits and conditions in 2017. On infrequent occasions, the plant has gone into partial-treatment mode (disinfection) when the influent-handling capacity was exceeded due to heavy rain storms. A project to upgrade the ORNL STP, including increased influent-handling capacity, was completed in 2017.

Oak Ridge Reservation Annual Site Environmental Report—2017
Oak Ridge National Laboratory 5-47
Table 5.9. National Pollutant Discharge Elimination System compliance at Oak Ridge National Laboratory, January through December 2017
Effluent parameters
Permit limits Permit compliance Monthly average (lb/day)
Daily max.
(lb/day)
Monthly average (mg/L)
Daily max.
(mg/L)
Daily min.
(mg/L)
Number of
noncompliances
Number of
samples
Percentage of
compliancea X01 (ORNL Sewage Treatment Plant)
LC50 for Ceriodaphnia (%)
100 0 1 100
LC50 for fathead minnows (%)
100 0 1 100
Ammonia, as N 6.26 9.39 2.5 3.75 5b 25 80 (summer) Ammonia, as N 13.14 19.78 5.25 7.9 0 29 100 (winter) Carbonaceous biological oxygen demand
19.2 28.8 10 15 1b 53 98
Dissolved oxygen 6 0 53 100 Escherichia coliform (col/100 mL)
941 126 3c 52 94
Oil and grease 15 0 1 100 pH (standard units) 9 6 0 53 100 Total suspended solids
57.5 86.3 30 45 0 53 100
X12 (Process Waste Treatment Complex) LC50 for Ceriodaphnia (%)
100 0 1 100
LC50 for fathead minnows (%)
100 0 1 100
Arsenic, total 0.014 0 4 100 Chromium, total 0.44 0 4 100 Copper, total 0.11 0 4 100 Cyanide, total 0.046 0 2 100 Lead, total 0.69 0 4 100 Oil and grease 15 0 12 100 pH (standard units) 9.0 6.0 0 53 100 Temperature (ºC) 30.5 0 53 100
Instream chlorine monitoring points Total residual oxidant 0.011 0.019 0 288 100 a Percentage compliance = 100 – [(number of noncompliances/number of samples) × 100]. b Heavy rains in April 2017 caused heavy influent flows to the Sewage Treatment Plant (STP). Operations were adjusted to prevent washout of the STP. The operational disruption caused a carbonaceous biological oxygen demand and five ammonia noncompliances during the next several months it took to fully restore STP operations.
c Malfunctioning equipment in the STP ozone disinfection system caused three E. coli noncompliances during May–July 2017.
Acronyms LC50 = lethal concentration; the concentration (as a percentage of full-strength wastewater) that kills 50% of the test species
in 48 h. ORNL = Oak Ridge National Laboratory

Oak Ridge Reservation Annual Site Environmental Report—2017
Oak Ridge National Laboratory 5-48
Toxicity testing provides an assessment of any harmful effects that could occur from the total combined constituents in discharges from ORNL wastewater treatment facilities. Effluents from the STP have been required to be tested for toxicity to aquatic species under the NPDES permit every year since 1986, and effluents from PWTC have been tested since it went into operation in 1990. Test species have been Ceriodaphnia dubia (C. dubia), an aquatic invertebrate, and fathead minnow (Pimephales promelas) larvae. Tests have been conducted using EPA chronic or acute test protocols at frequencies ranging from one to four times per year. Test results have been excellent. PWTC effluent has always been shown to be nontoxic. The STP has shown isolated indications of effluent toxicity, none recent, but confirmatory tests conducted as required by the permit have shown that either the result of the routine test was an anomaly or that the condition of toxicity that existed at the time of the routine test was temporary and of short duration.
Toxicity test requirements under the current NPDES permit include annual testing for acute toxicity from the ORNL STP and PWTC. Both test species are tested on a series of four aliquots of effluent, collected at 6 h intervals over a 24 h period. In 2017, toxicity test results for the ORNL wastewater treatment facilities were once again favorable, with no indication of toxicity in any of the tests that were conducted (Table 5.9).
5.5.2 Residual Bromine and Chlorine Monitoring
At ORNL, chlorine is added to drinking water as a disinfectant prior to consumption. Additional chlorine and bromine are also added for maintenance of cooling system infrastructure to prevent bacterial growth. When waters are discharged to streams, residual chlorine and bromine can be toxic to fish and other aquatic life. The ORNL NPDES permit controls the discharge of chlorinated and brominated waters, reported as “total residual oxidant” (TRO), by limiting the TRO mass loading from outfalls. TRO is monitored to ensure effective dechlorination of cooling tower blowdown systems, once-through cooling water systems, and any infrastructure leaks from water lines. The NPDES permit action level is 1.2 g/day TRO at any outfall. NPDES permit outfalls that may contain TRO are dechlorinated and monitored to ensure that TRO is < 0.05 mg/L, which is the field detection level. Cooling tower blowdown and large cooling water discharges are monitored most frequently (twice a month) to check the effectiveness of dechlorination systems. Other outfalls that have been affected in the past by infrastructure leaks or other temporary incidents are monitored at regular, less-frequent intervals.
In 2017, TRO measurements were performed at 26 outfalls on a semiannual, quarterly, monthly, or semimonthly basis if flow was present. A total of 240 TRO measurements were taken. Table 5.10 shows that in 2017 there was just one instance of an outfall (Outfall 231) discharge that exceeded the TRO permit action level.
In 2016, Outfall 231 also had one incident of a TRO exceedance. Outfall 231 receives cooling tower blowdown from Building 5800 that is dechlorinated inside the building using a sodium sulfite tablet feeder. ORNL staff investigated the exceedance and implemented treatment and reduction measures. All of the tablet dechlorination boxes were inspected. It was determined that eight of the boxes associated with cooling tower discharges needed repair or replacement to keep tablets dry between flows, and to improve flow through the boxes and contact with the sodium sulfite tablets. All eight boxes were replaced in 2017. The tablet feeder at Outfall 231 had already been replaced when TRO was found again in December 2017. It is not known why excess oxidant was found at that time. Prior to the tablet feeder upgrade, backup secondary dichlorination had been utilized for discharges from the two largest cooling tower complexes that discharge to Outfalls 227 and 363. The secondary dichlorination at the larger towers has been retained until the inconsistencies are better understood. As ORNL tries to minimize water use and to replace once-through noncontact cooling water with recirculating systems, troubleshooting and

Oak Ridge Reservation Annual Site Environmental Report—2017
Oak Ridge National Laboratory 5-49
improvements also continue to be made at the two sodium bisulfite liquid feed systems used in the main plant area.
Table 5.10. Outfalls exceeding total residual oxidant NPDES permit action level in 2017
Sample date Outfall TROa
concentration (mg/L)
Flow (gpm)
Load (g/day)
Receiving stream
Downstream integration
point
Instream TRO point
12/18/2017 231 0.7 8 30.52 WOC WCK 4.4 X25 a The NPDES action level is 1.2 g/day.
Acronyms NPDES = National Pollutant Discharge Elimination System TRO = total residual oxidant WCK = White Oak Creek kilometer WOC = White Oak Creek
5.5.3 Radiological Monitoring
At ORNL, monitoring of liquid effluents and selected instream locations for radioactivity is conducted under the WQPP. Table 5.11 details the analyses performed on samples collected in 2017 at two treatment facility outfalls, three instream monitoring locations, and 21 category outfalls (outfalls that are categorized into groups with similar effluent characteristics for the purposes of setting monitoring and reporting requirements in the site NPDES permit). Dry-weather discharges from category outfalls are primarily cooling water, groundwater, and condensate. Low levels of radioactivity can be discharged from category outfalls in areas where groundwater contamination exists and where contaminated groundwater enters category outfall collection systems by direct infiltration and from building sumps, facility sumps, and building footer drains. In 2017, dry-weather grab samples were collected at 17 of the 21 category outfalls targeted for sampling. Four category outfalls (205, 241, 265, and 284) were not sampled because there was no discharge present during sampling attempts.
The two ORNL treatment facility outfalls that were monitored for radioactivity in 2017 were the STP outfall (Outfall X01) and the PWTC outfall (Outfall X12). The three instream locations that were monitored were X13 on Melton Branch, X14 on WOC, and X15 at White Oak Dam (WOD) (Figure 5.12). At each treatment facility and instream monitoring location, monthly flow-proportional composite samples were collected using dedicated automatic water samplers.
For each radioisotope, a DCS is published in DOE directives and is used to evaluate discharges of radioactivity from DOE facilities (DOE 2011a). DCSs were developed for evaluating effluent discharges and are not intended to be applied to instream values, but the comparisons can provide a useful frame of reference. Four percent of the DCS is roughly equivalent to the 4 mrem dose limit on which the EPA radionuclide drinking water standards are based and is a convenient comparison point. Although comparisons are made, neither ORNL effluents nor ambient surface waters are direct sources of drinking water. The annual average concentration of at least one radionuclide exceeded 4% of the relevant DCS concentration in dry-weather discharges from NPDES Outfalls 085, 203, 204, 302, 304, X01, and X12 and at instream sampling locations on WOC (X14) and at WOD (X15) (Figure 5.13).

Oak Ridge Reservation Annual Site Environmental Report—2017
Oak Ridge National Laboratory 5-50
Table 5.11. Radiological monitoring conducted under the Oak Ridge National Laboratory Water Quality Protection Plan, 2017
Location Frequency Gross alpha/beta
Gamma scan
3H 14C 89/90Sr Isotopic uranium
Isotopic plutonium
241Am 243/244Cm
Outfall 001 Annual X Outfall 080 Monthly X X X X Xa X Outfall 081 Annual X Outfall 085 Quarterly X X X X Xa Outfall 203 Semiannual X X X Outfall 204 Semiannual X X X Outfall 205 b Annual Outfall 207 Quarterly X Outfall 211 Annual X Outfall 234 Annual X Outfall 241 b Quarterly Outfall 265 b Annual Outfall 281 Quarterly X X Outfall 282 Quarterly X Outfall 284 b Annual Outfall 302 Monthly X X X X Xa Xa Xa Xa
Outfall 304 Monthly X X X X Xa Xa Xa Xa
Outfall 365 Semiannual X Outfall 368 Annual X Outfall 383 Annual X X Outfall 484 Annual X STP (X01) Monthly X X X X X PWTC (X12) Monthly X X X X X Melton Branch (X13) Monthly X X X X WOC (X14) Monthly X X X X WOD (X15) Monthly X X X X a The Water Quality Protection Plan does not require this parameter for this location, and therefore it may have been monitored on a frequency less than indicated in the table. Additional analyses are sometimes performed on samples, the most common reason being that gross alpha and gross beta activities exceeded a screening criterion (as described in the May 2012 update to the Water Quality Protection Plan).
b The outfall was included in the monitoring plan, but samples were not collected because no discharge was present during sampling attempts.
Acronyms PWTC = Process Waste Treatment Complex, STP = Sewage Treatment Plant, WOC = White Oak Creek, WOD = White Oak Dam

Oak Ridge Reservation Annual Site Environmental Report—2017
Oak Ridge National Laboratory 5-51
Figure 5.12. Selected surface water, National Pollutant Discharge Elimination System, and reference
sampling locations at Oak Ridge National Laboratory, 2017
Figure 5.13. Outfalls and instream locations at Oak Ridge National Laboratory with average
radionuclide concentrations greater than 4% of the relevant derived concentration standards in 2017

Oak Ridge Reservation Annual Site Environmental Report—2017
Oak Ridge National Laboratory 5-52
In 2017, one outfall (304) had an annual mean radioactivity concentration greater than 100% of a DCS. Outfall 304 had an average total radioactive strontium (89/90Sr) concentration that exceeded the DCS for 90Sr (it is reasonable, for an ORNL environmental sample, to assume that 89/90Sr activity is comparable to 90Sr activity due to the relatively short half-life of 89Sr—50.55 days). The concentration of 89/90Sr was 160% of the DCS at Outfall 304. Consequently, concentrations of radioactivity in the discharge from Outfall 304 was also greater than the DCS level on a sum-of-fractions basis (i.e., the summation of DCS percentages of multiple radiological parameters); the sum of the fractions was 170%.
Levels of radioactivity in discharges from Outfall 304 have been elevated since 2014 because of two unrelated infrastructure issues. In 2014, a pump failed in a groundwater suppression sump at the DOE Office of Environmental Management (OREM) WOC-9 (WC-9) Low Level Liquid Waste Tank Farm, a CERCLA soil and groundwater contamination area. Without groundwater suppression in the tank farm area, contaminated groundwater enters the Outfall 304 storm drain system. A second infrastructure issue, which had an even greater influence on Outfall 304 radiological concentrations, occurred in 2015. A leak developed in a pipe leading from Pump Station #2 in the Process Waste Collection System to a downstream diversion box. A dye tracer test confirmed a hydraulic connection between the pipe and the storm water collection system that discharges through Outfall 304, and the pipe was subsequently bypassed and taken out of service. Before the leaky pipe was bypassed, the 89/90Sr concentration at Outfall 304 peaked at 29,000 pCi/L (August and September 2015). Since the bypass was implemented, 89/90Sr levels in the outfall effluent have trended downward, but they remained above DCS levels in 2017. No additional infrastructure issues affecting Outfall 304 have been discovered, and it is believed that concentrations of radioactivity at the outfall will slowly decline as concentrations of radioactivity in the groundwater surrounding the outfall pipe decline by means of normal hydrologic processes.
The total annual discharges (or amounts) of radioactivity measured in stream water at WOD, the final monitoring point on WOC before the stream flow leaves ORNL, were calculated from concentration and flow. Results of those calculations for each of the past 5 years are shown in Figures 5.14 through 5.18. Because discharges of radioactivity are somewhat correlated to stream flow, annual flow volumes measured at the WOD monitoring station are given in Figure 5.19. Discharges of radioactivity at WOD in 2017 were similar to discharges during other recent years, particularly when differences in annual flow volume are taken into account and continue to be generally lower than in the years preceding completion of the waste area caps in Melton Valley (substantially complete by 2006).
Radiological monitoring at category outfalls in 2017 also included monitoring during storm runoff conditions. Eight storm water outfalls were monitored. Storm water samples were analyzed for gross alpha, gross beta, 89/90Sr, and tritium activities. A gamma scan analysis was also performed. The monitoring plan calls for additional analyses to be added when sufficient gross alpha and/or beta activity is present in a sample to indicate that levels of radioactivity may exceed DCS levels, but in 2017 no additional analyses were required for storm water samples.
Concentrations of radioactivity in storm water discharges were compared with DCSs if a DCS existed for that parameter (there are no DCSs for gross alpha or gross beta activities) and if a concentration was greater than or equal to the minimum detectable activity for the measurement. In 2017, none of the outfalls had a radionuclide concentration in storm water that was greater than 4% of a DCS level.
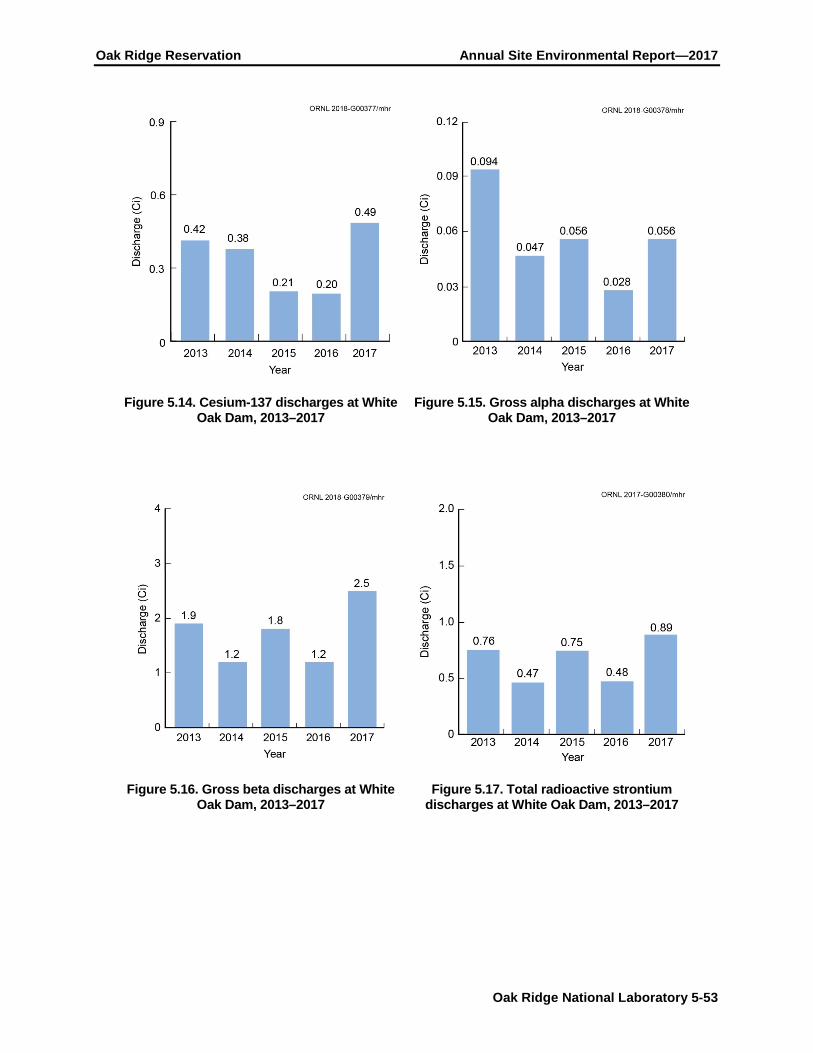
Oak Ridge Reservation Annual Site Environmental Report—2017
Oak Ridge National Laboratory 5-53
Figure 5.14. Cesium-137 discharges at White Oak Dam, 2013–2017
Figure 5.15. Gross alpha discharges at White Oak Dam, 2013–2017
Figure 5.16. Gross beta discharges at White Oak Dam, 2013–2017
Figure 5.17. Total radioactive strontium discharges at White Oak Dam, 2013–2017

Oak Ridge Reservation Annual Site Environmental Report—2017
Oak Ridge National Laboratory 5-54
Figure 5.18. Tritium discharges at White Oak
Dam, 2013–2017
Figure 5.19. Annual flow volume at White Oak Dam, 2013–2017
5.5.4 Mercury in the White Oak Creek Watershed
Due to the persistence of elemental mercury, its volatility, and the complexity of its interactions in soil, mercury continues to be a contaminant associated with groundwater and storm water runoff in and around the facilities and associated piping where it was used. During the 1950s, mercury was used in a number of ORNL facilities (e.g., pilot-scale isotope separation work in Buildings 4501, 4505, and 3592 and in spent-fuel reprocessing in Building 3503). Legacy mercury contamination exists in those facilities and in infrastructure connected to them. Mercury is also present in process wastewater piping north of the intersection of Fifth Street and Central Avenue. The largest releases are known to be associated with Buildings 4501 and 4505, located east of Fifth Creek, where most of the building foundation sumps and storm drains were historically routed south to Outfall 211 on WOC (Figure 5.20). Buildings 3592 and 3503 were removed under the CERCLA remedial process in 2011 and 2012, respectively; however, their footprints and associated storm water drains remain in the Outfall 207 storm water drainage system.

Oak Ridge Reservation Annual Site Environmental Report—2017
Oak Ridge National Laboratory 5-55
Figure 5.20. Outfalls with known historic mercury sources to White Oak Creek, 2017
5.5.4.1 Ambient Mercury in Water In continuation of a monitoring effort initiated in 1997, bimonthly water samples were collected from WOC at four sites in 2017 (Figure 5.21). Stream conditions were selected to be representative of seasonal base-flow conditions (dry weather, clear flow) based on historical results that indicate higher mercury concentrations under those conditions.
The concentration of mercury in WOC upstream from ORNL (White Oak Creek kilometer [WCK] 6.8) was less than 5 ng/L in 2017. Long-term trends in waterborne mercury in the WOC system downstream of ORNL are shown in Figure 5.22.
Waterborne mercury downstream of ORNL declined abruptly in 2008 and remained low through 2017 as a result of rerouting highly contaminated sump water in Building 4501 to PWTC in December 2007. The mean total mercury concentration at WCK 4.1 was 12.70 ± 8.19 ng/L in 2017 compared with 108 ± 33 ng/L in 2007. The decrease was also apparent at WCK 3.4, with mercury averaging 12.48 ± 7.33 ng/L in 2017 vs. 49 ± 23 ng/L in 2007. Mercury concentrations at these two sites were significantly lower than levels in 2007. A pretreatment system for the sump water, which started operation on October 22, 2009, removes almost all the mercury before sending the water to PWTC. The system reduces the mercury concentration in the PWTC influent and effluent. The average aqueous

Oak Ridge Reservation Annual Site Environmental Report—2017
Oak Ridge National Laboratory 5-56
mercury concentration at WOD (WCK 1.5) was 36.38 ± 22.91 ng/L in 2017, higher than concentrations at other sites.
Figure 5.21. Instream monitoring and data locations, 2017
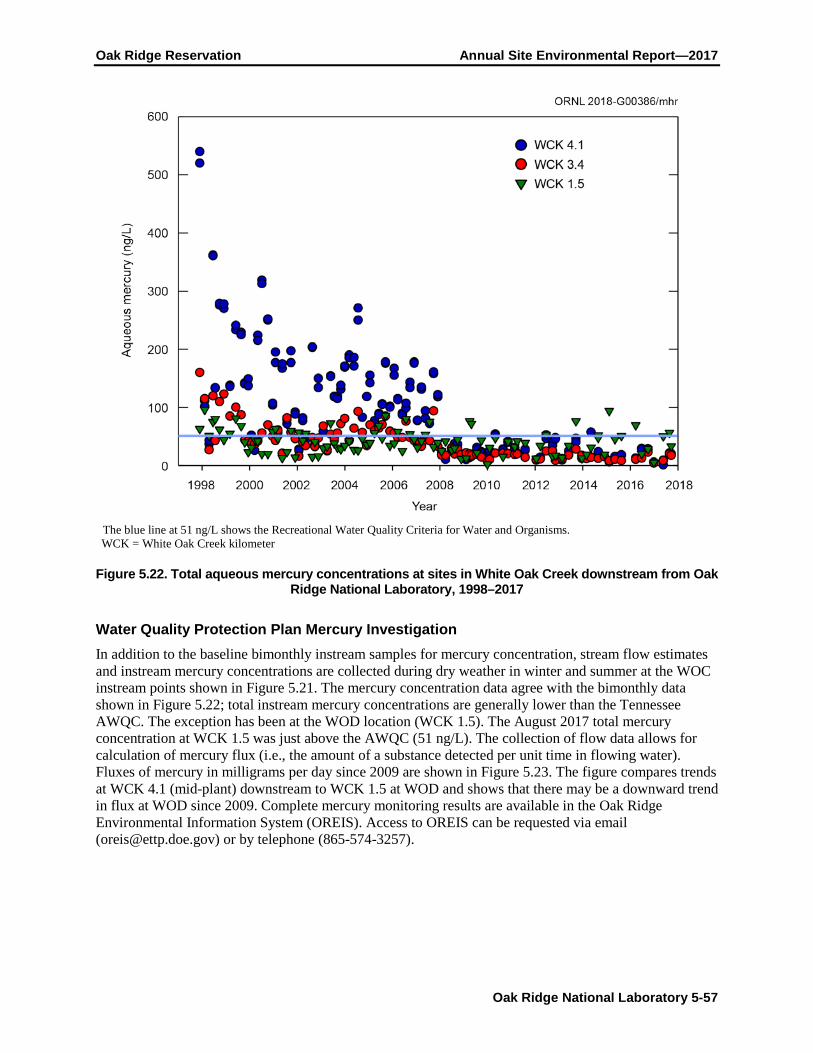
Oak Ridge Reservation Annual Site Environmental Report—2017
Oak Ridge National Laboratory 5-57
The blue line at 51 ng/L shows the Recreational Water Quality Criteria for Water and Organisms. WCK = White Oak Creek kilometer
Figure 5.22. Total aqueous mercury concentrations at sites in White Oak Creek downstream from Oak Ridge National Laboratory, 1998–2017
Water Quality Protection Plan Mercury Investigation In addition to the baseline bimonthly instream samples for mercury concentration, stream flow estimates and instream mercury concentrations are collected during dry weather in winter and summer at the WOC instream points shown in Figure 5.21. The mercury concentration data agree with the bimonthly data shown in Figure 5.22; total instream mercury concentrations are generally lower than the Tennessee AWQC. The exception has been at the WOD location (WCK 1.5). The August 2017 total mercury concentration at WCK 1.5 was just above the AWQC (51 ng/L). The collection of flow data allows for calculation of mercury flux (i.e., the amount of a substance detected per unit time in flowing water). Fluxes of mercury in milligrams per day since 2009 are shown in Figure 5.23. The figure compares trends at WCK 4.1 (mid-plant) downstream to WCK 1.5 at WOD and shows that there may be a downward trend in flux at WOD since 2009. Complete mercury monitoring results are available in the Oak Ridge Environmental Information System (OREIS). Access to OREIS can be requested via email ([email protected]) or by telephone (865-574-3257).
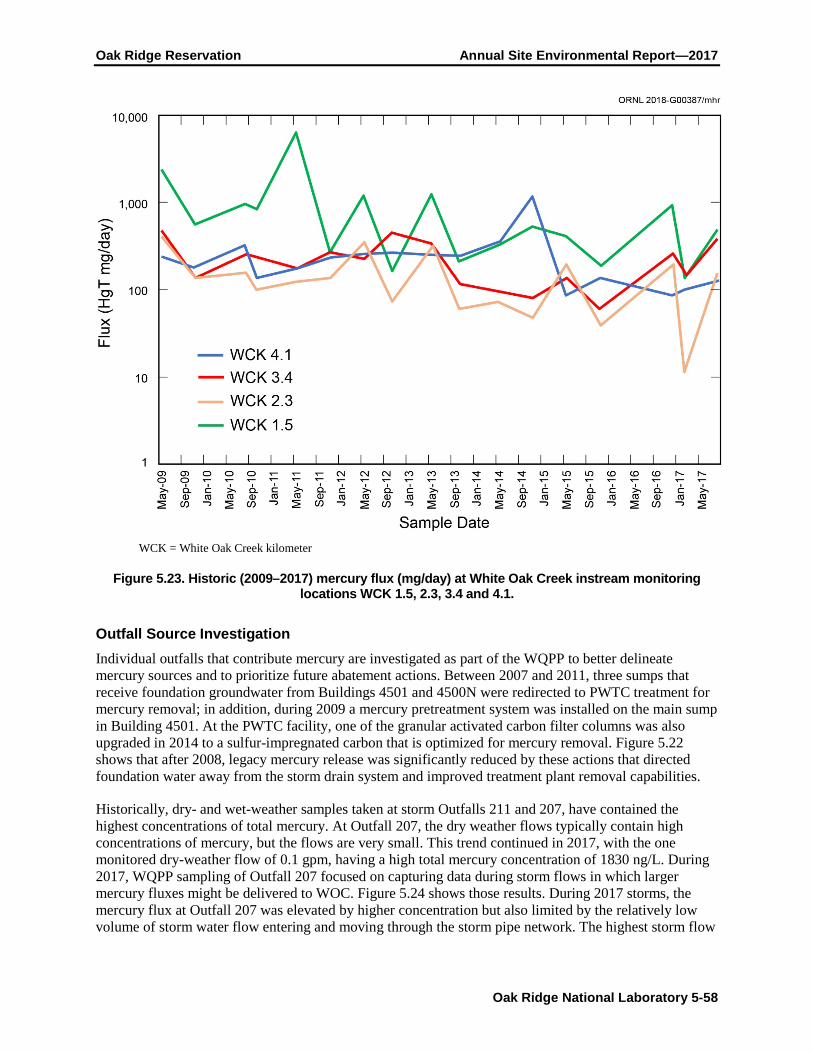
Oak Ridge Reservation Annual Site Environmental Report—2017
Oak Ridge National Laboratory 5-58
WCK = White Oak Creek kilometer
Figure 5.23. Historic (2009–2017) mercury flux (mg/day) at White Oak Creek instream monitoring locations WCK 1.5, 2.3, 3.4 and 4.1.
Outfall Source Investigation Individual outfalls that contribute mercury are investigated as part of the WQPP to better delineate mercury sources and to prioritize future abatement actions. Between 2007 and 2011, three sumps that receive foundation groundwater from Buildings 4501 and 4500N were redirected to PWTC treatment for mercury removal; in addition, during 2009 a mercury pretreatment system was installed on the main sump in Building 4501. At the PWTC facility, one of the granular activated carbon filter columns was also upgraded in 2014 to a sulfur-impregnated carbon that is optimized for mercury removal. Figure 5.22 shows that after 2008, legacy mercury release was significantly reduced by these actions that directed foundation water away from the storm drain system and improved treatment plant removal capabilities.
Historically, dry- and wet-weather samples taken at storm Outfalls 211 and 207, have contained the highest concentrations of total mercury. At Outfall 207, the dry weather flows typically contain high concentrations of mercury, but the flows are very small. This trend continued in 2017, with the one monitored dry-weather flow of 0.1 gpm, having a high total mercury concentration of 1830 ng/L. During 2017, WQPP sampling of Outfall 207 focused on capturing data during storm flows in which larger mercury fluxes might be delivered to WOC. Figure 5.24 shows those results. During 2017 storms, the mercury flux at Outfall 207 was elevated by higher concentration but also limited by the relatively low volume of storm water flow entering and moving through the storm pipe network. The highest storm flow

Oak Ridge Reservation Annual Site Environmental Report—2017
Oak Ridge National Laboratory 5-59
measured was estimated at 50 gpm. Although total mercury flux was as high as 260 mg/day, dissolved mercury flux was no more than 30 mg/day.
Figure 5.24. Outfall 207 storm flow and flux of total and dissolved mercury, 2017
Storm data collected at Outfall 211 during 2016 through 2017 (Figure 5.25) show much higher fluxes of total mercury than seen at Outfall 207. Much bigger storm water flow rates occurred in the Outfall 211 piping system (estimated at 50 to 225 gpm). Even though the 2017 mercury fluxes were lower than the very high ones found in February of 2016, the 2017 total mercury flux values ranged from 202 to 3,532 mg/day. The storm water samples from Outfall 211 that measured the highest total mercury fluxes (>1,000 mg/day) also measured the highest percentage of total mercury flux composed of particulate (total minus dissolved) mercury.
At the terminus of the Outfall 211 pipe, sediment collects behind a weir plate to which two sodium sulfite tablet dechlorination boxes are attached to dechlorinate flows. Storm samples are taken from the area between the pipe terminus and this weir plate because the creek levels during storms are often above the level of the dechlorinator outlets on the creek side. During storms, accumulated sediment behind the Outfall 211 weir plate may be contributing to both nondissolved and dissolved mercury entering WOC via the Outfall 211 storm drain system.

Oak Ridge Reservation Annual Site Environmental Report—2017
Oak Ridge National Laboratory 5-60
Figure 5.25. Outfall 211 storm flow and flux of total and dissolved mercury, 2016–2017
5.5.5 Storm Water Surveillances and Construction Activities
Storm water drainage areas at ORNL are inspected twice per year as stipulated in the WQPP. Land use within drainage areas is typical of office/industrial/research settings with surface features that include laboratories, support facilities, paved areas, and grassy lawns. Outdoor material storage is dynamic in many places but is most prevalent in the 7000 area on the east end of the main ORNL facility, where most of the craft and maintenance shops are located. Smaller outdoor storage areas are located throughout the facility in and around loading docks and material delivery areas at laboratory and office buildings. The types of materials stored outside, as noted in field inspections, include finished metal items (pipes and parts); equipment awaiting use, disposal, or repair; aging (rusting) infrastructure; and construction equipment and material. A site visit to active construction sites also occurs twice per year to evaluate the overall effectiveness of the best management practices in use. In general, no long-term environmental impacts have been noted. While sites that are covered by a Tennessee construction general permit are considered to have more significant potential for runoff impacts, inspections and controls required by an approved Storm Water Pollution Prevention Plan have proven effective at minimizing short-term and long-term impacts to nearby streams and waterways from construction sites.
Some construction activities are performed on third-party-funded construction projects on tORR under agreements with federal agencies other than DOE and with local and state agencies. There are mechanisms in place for ensuring effective storm water controls at the third-party sites, one of which includes staff from UT-Battelle acting as points of contact for communication interface on environmental conditions, erosion and sedimentation controls, spill/emergency responses, and other key issues.
5.5.6 Biological Monitoring
5.5.6.1 Bioaccumulation Studies The bioaccumulation task for BMAP addresses two NPDES permit requirements at ORNL: (1) evaluate whether mercury at the site is contributing to a stream at a level that will adversely affect fish and other aquatic life or that will violate the recreational criteria and (2) monitor the status of PCB contamination in fish tissue in the WOC watershed. Concentrations of mercury in fish in the WOC watershed are monitored
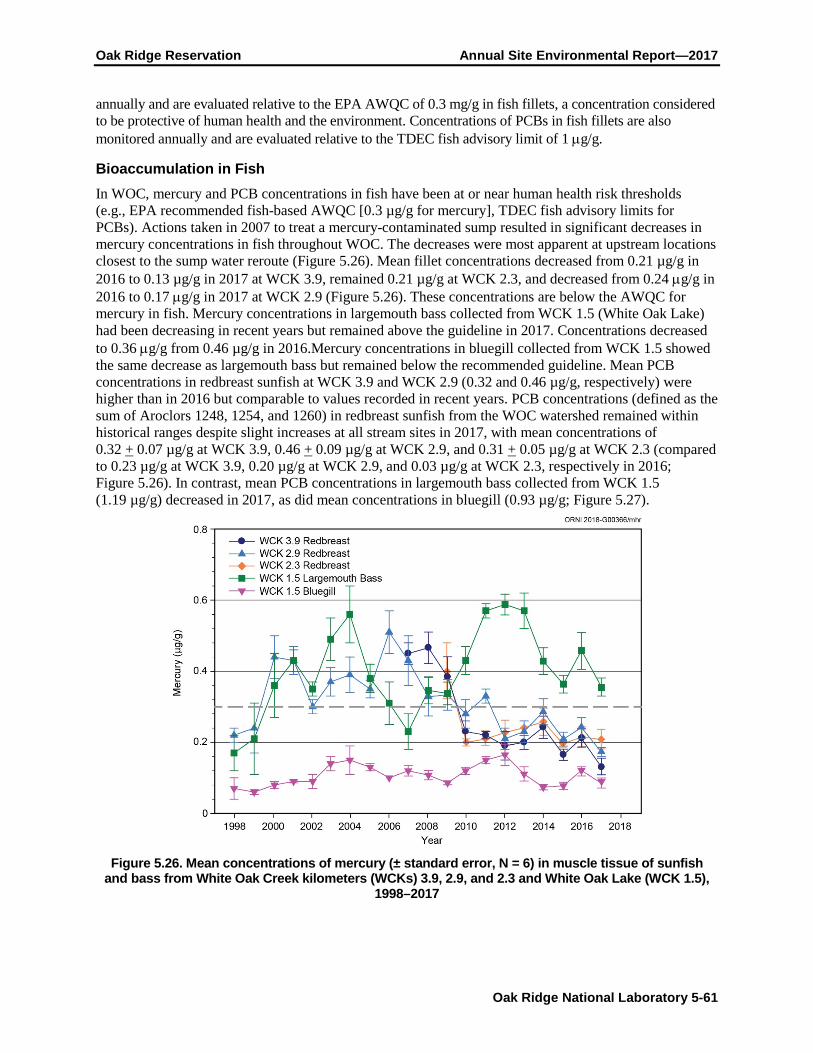
Oak Ridge Reservation Annual Site Environmental Report—2017
Oak Ridge National Laboratory 5-61
annually and are evaluated relative to the EPA AWQC of 0.3 mg/g in fish fillets, a concentration considered to be protective of human health and the environment. Concentrations of PCBs in fish fillets are also monitored annually and are evaluated relative to the TDEC fish advisory limit of 1 µg/g.
Bioaccumulation in Fish In WOC, mercury and PCB concentrations in fish have been at or near human health risk thresholds (e.g., EPA recommended fish-based AWQC [0.3 µg/g for mercury], TDEC fish advisory limits for PCBs). Actions taken in 2007 to treat a mercury-contaminated sump resulted in significant decreases in mercury concentrations in fish throughout WOC. The decreases were most apparent at upstream locations closest to the sump water reroute (Figure 5.26). Mean fillet concentrations decreased from 0.21 µg/g in 2016 to 0.13 µg/g in 2017 at WCK 3.9, remained 0.21 µg/g at WCK 2.3, and decreased from 0.24 µg/g in 2016 to 0.17 µg/g in 2017 at WCK 2.9 (Figure 5.26). These concentrations are below the AWQC for mercury in fish. Mercury concentrations in largemouth bass collected from WCK 1.5 (White Oak Lake) had been decreasing in recent years but remained above the guideline in 2017. Concentrations decreased to 0.36 µg/g from 0.46 µg/g in 2016.Mercury concentrations in bluegill collected from WCK 1.5 showed the same decrease as largemouth bass but remained below the recommended guideline. Mean PCB concentrations in redbreast sunfish at WCK 3.9 and WCK 2.9 (0.32 and 0.46 µg/g, respectively) were higher than in 2016 but comparable to values recorded in recent years. PCB concentrations (defined as the sum of Aroclors 1248, 1254, and 1260) in redbreast sunfish from the WOC watershed remained within historical ranges despite slight increases at all stream sites in 2017, with mean concentrations of 0.32 + 0.07 µg/g at WCK 3.9, 0.46 + 0.09 µg/g at WCK 2.9, and 0.31 + 0.05 µg/g at WCK 2.3 (compared to 0.23 µg/g at WCK 3.9, 0.20 µg/g at WCK 2.9, and 0.03 µg/g at WCK 2.3, respectively in 2016; Figure 5.26). In contrast, mean PCB concentrations in largemouth bass collected from WCK 1.5 (1.19 µg/g) decreased in 2017, as did mean concentrations in bluegill (0.93 µg/g; Figure 5.27).
Figure 5.26. Mean concentrations of mercury (± standard error, N = 6) in muscle tissue of sunfish
and bass from White Oak Creek kilometers (WCKs) 3.9, 2.9, and 2.3 and White Oak Lake (WCK 1.5), 1998–2017

Oak Ridge Reservation Annual Site Environmental Report—2017
Oak Ridge National Laboratory 5-62
Dashed grey line indicates the US Environmental Protection Agency ambient water quality criterion for mercury (0.3 µg/g in fish tissue).
WCK = White Oak Creek kilometer
Figure 5.27. Mean total polychlorinated biphenyl (PCB) concentrations (± standard error, N = 6) in fish fillets collected from the White Oak Creek watershed (WCK 3.9, 2.9, 2.3, and 1.5),
1998–2017
5.5.6.2 Benthic Macroinvertebrate Communities Monitoring of benthic macroinvertebrate communities in WOC, First Creek, and Fifth Creek continued in 2017. Additionally, monitoring of the macroinvertebrate community in lower Melton Branch (Melton Branch kilometer [MEK] 0.6) continued under the OREM Water Resources Restoration Program (WRRP). Benthic macroinvertebrate samples are collected annually following TDEC protocols and protocols developed by ORNL staff and used since 1986. The protocols developed by ORNL staff provide a continuous long-term record (29 years) of spatial and temporal trends in the invertebrate community from which the effectiveness of pollution abatement and remedial actions taken at ORNL can be evaluated and verified. The ORNL protocols also provide quantitative results that can be used to statistically evaluate changes in trends relative to historical conditions. The TDEC protocols provide a qualitative estimate of the condition of a macroinvertebrate community relative to a state-defined reference condition. At the time of publication, 2017 sample results for benthic macroinvertebrate communities in First Creek, Fifth Creek, and WOC downstream of effluent discharges were not available. These results will be reported in the 2018 annual report. The 2016 results, which were not available in time for inclusion in the 2016 annual site environmental report (DOE 2017) are included in this report (see Figure 5.28).

Oak Ridge Reservation Annual Site Environmental Report—2017
Oak Ridge National Laboratory 5-63
Results for 2017 were not available at the time of publication. Horizontal lines show the lower thresholds for biotic condition ratings for index scores; respective narrative ratings for each threshold are shown at right of graph.
Acronyms: FCK = First Creek kilometer, FFK = Fifth Creek kilometer, MEK = Melton Branch kilometer, and WCK = White Oak Creek kilometer
Figure 5.28. Temporal trends in Tennessee Department of Environment and Conservation Biotic Index Scores for White Oak Creek watershed (FCK 0.1; FFK 0.2; MEK 0.6; and WCK 6.8, 3.9, and 2.3),
August 2006–August 2016
In 2016, results of TDEC protocols indicate that sites in First Creek and White Oak Creek immediately downstream of effluent discharges (First Creek kilometer [FCK 0.1] and WCK 3.9) were moderately impaired whereas these sites were rated as slightly impaired in previous years. Although Melton Branch Creek was rated as unimpaired in 2015, it was slightly impaired in 2016. The upper and most downstream White Oak Creek sites (WCK6.8 and WCK2.3, respectively) were rated as unimpaired in 2016. The 2016 ORNL protocols results indicated significant recovery in these communities since 1987, but community characteristics indicated that ecological impairment remains (Figures 5.29–5.31). Relative to respective upstream reference sites, total taxonomic richness (i.e., the mean number of different species per sample) and richness of the pollution-intolerant taxa (i.e., the mean number of different mayfly, stonefly, and caddisfly species per sample or Ephemeroptera, Plecoptera, and Trichoptera [EPT] taxa richness) continued to be lower at these downstream sites. After modest increases in the mid-1990s, total taxa richness appeared to have generally decreased at FCK 0.1, and in 2014 the total number of taxa was the lowest it had been since 1989. Similarly, the number of pollution-intolerant EPT taxa decreased in 2012 and in 2014, EPT taxa richness was the lowest it had been since the early 1990s. EPT taxa richness has remained low for 5 consecutive years, including 2016. These results suggest a change may have occurred in conditions in lower First Creek. If a change has occurred, it is not known whether it is related to a change in chemical conditions (e.g., change in water quality or the possible presence of a toxicant), physical conditions (e.g., unstable substrate, increased frequency of high discharge events), or natural variation. Trends in metrics at Fifth Creek kilometer (FFK) 0.2 since the mid-1990s suggest that a change in conditions at that site occurred between 2007 and 2008. More recent results, however, suggest that improvements have occurred, and the condition of the invertebrate community is now comparable to what it was from the late 1990s through the early 2000s. Metric values for WCK 2.3 and WCK 3.9 continued

Oak Ridge Reservation Annual Site Environmental Report—2017
Oak Ridge National Laboratory 5-64
to remain within the ranges of values found since the early 2000s, although they also continued to be notably lower than those for the reference sites, suggesting that no additional major changes had occurred at those sites for roughly 13 years. Since 2001, Walker Branch has served as an additional reference site for WOC mainstem sites downstream of Bethel Valley Road (Figure 5.31). Comparisons of WCK6.8 to WBK1.0 show that communities in WCK 6.8 represent ideal reference conditions. Additionally, the comparison of Walker Branch to downstream sites in WOC show that these communities remain impaired.
Macroinvertebrate community metrics for lower Melton Branch (MEK 0.6, Figure 5.32) suggested that in 2016 taxa richness metrics continued to be similar to reference conditions. However, like the results from the TDEC protocols, other invertebrate community metrics potentially sensitive to more specific types of pollutants, such as the percent density of pollution-intolerant and pollution-tolerant species (not shown), continued to fluctuate annually between comparable values and values below those of the reference sites. Thus, while the condition of the invertebrate community at MEK 0.6 was generally at or near reference conditions, annual changes in some characteristics of the community suggested that annual fluctuations in environmental conditions at the site appear to have some minor negative influence on the condition of the community.

Oak Ridge Reservation Annual Site Environmental Report—2017
Oak Ridge National Laboratory 5-65
Results for 2017 were not available at the time of publication. FCK = Fifth Creek kilometer; FCK 1.0 = reference site
Figure 5.29. Benthic macroinvertebrate communities in First Creek (FCK 0.1 and 0.8): total taxonomic richness (mean number of all taxa/sample) and taxonomic richness of the pollution-intolerant taxa,
Ephemeroptera, Plecoptera, and Trichoptera (EPT); mean number of EPT taxa/sample, April sampling periods, 1987−2016

Oak Ridge Reservation Annual Site Environmental Report—2017
Oak Ridge National Laboratory 5-66
Results for 2017 were not available at the time of publication. FFK = Fifth Creek kilometer; FFK 1.0 = reference site
Figure 5.30. Benthic macroinvertebrate communities in Fifth Creek (FFK 0.2 and 1.0): total taxonomic richness (mean number of all taxa/sample) and taxonomic richness of the pollution-intolerant taxa,
Ephemeroptera, Plecoptera, and Trichoptera (EPT); mean number of EPT taxa/sample), April sampling periods, 1987−2016

Oak Ridge Reservation Annual Site Environmental Report—2017
Oak Ridge National Laboratory 5-67
Results for 2017 were not available at the time of publication. WCK = White Oak Creek kilometer and WBK = Walker Branch kilometer; WBK 1.0 = reference site
Figure 5.31. Benthic macroinvertebrate communities in White Oak Creek (WBK 1.0 and WCK 6.8, 3.9, and 2.3): (a) total taxonomic richness (mean number of all taxa/ sample) and (b) taxonomic richness of the pollution-intolerant taxa, Ephemeroptera, Plecoptera, and Trichoptera (EPT); mean number of
EPT taxa/sample), April sampling periods, 1987−2016

Oak Ridge Reservation Annual Site Environmental Report—2017
Oak Ridge National Laboratory 5-68
Results for 2017 were not available at the time of publication and maximum values for Oak Ridge National Laboratory Biological Monitoring and Abatement Program reference sites on First Creek and Fifth Creek (1987–2016), Walker Branch (2001–2016), and White Oak Creek (1987–2000, 2007–2016).
Figure 5.32. Benthic macroinvertebrate communities in lower Melton Branch (MEK 0.6): (a) total taxonomic richness (mean number of all taxa/sample) and (b) taxonomic richness of the pollution-
intolerant taxa, Ephemeroptera, Plecoptera, and Trichoptera (EPT); mean number of EPT taxa/sample, April sampling periods, 1987−2016
5.5.6.3 Fish Communities Monitoring of the fish communities in WOC and its major tributaries continued in 2017. Fish community surveys were conducted at 11 sites in the WOC watershed, including 5 sites in the main channel, 2 sites in First Creek, 2 sites in Fifth Creek, and 2 sites in Melton Branch. Streams located near or within the city of Oak Ridge (Mill Branch and Brushy Fork) were also sampled as reference sites for comparison.
In the WOC watershed, the fish community continued to be slightly degraded in 2017 compared with communities in reference streams. Sites closest to outfalls within the ORNL campus had lower species
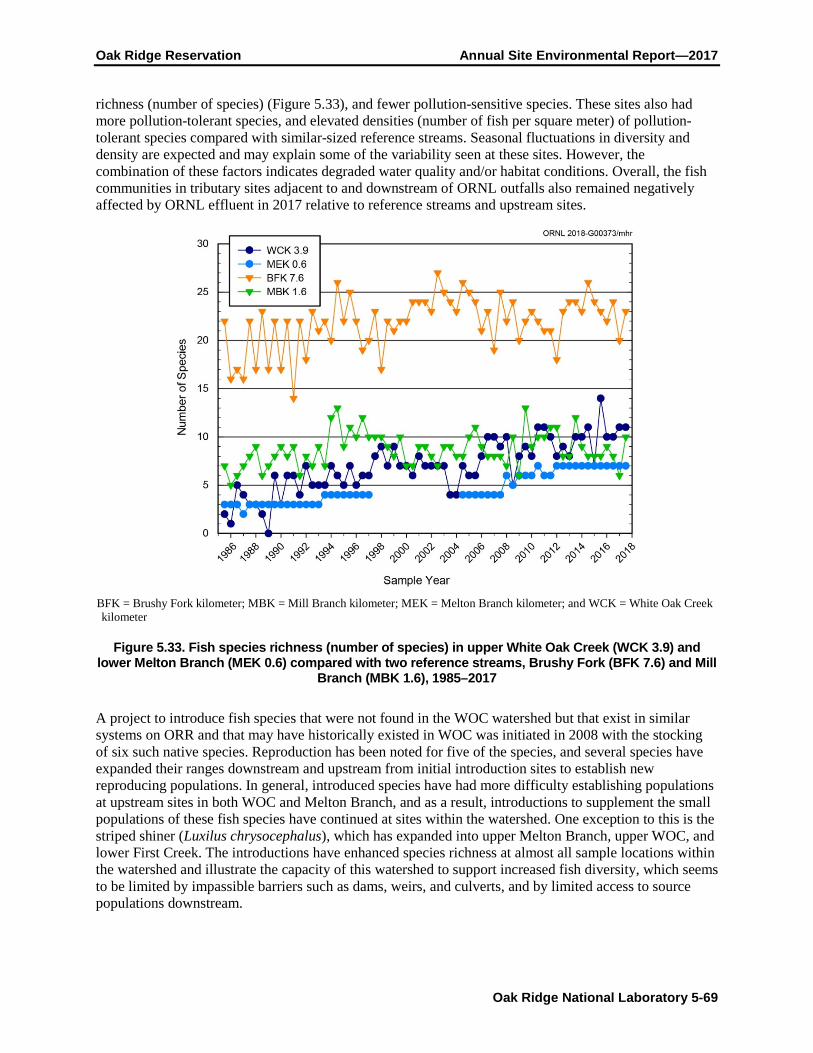
Oak Ridge Reservation Annual Site Environmental Report—2017
Oak Ridge National Laboratory 5-69
richness (number of species) (Figure 5.33), and fewer pollution-sensitive species. These sites also had more pollution-tolerant species, and elevated densities (number of fish per square meter) of pollution-tolerant species compared with similar-sized reference streams. Seasonal fluctuations in diversity and density are expected and may explain some of the variability seen at these sites. However, the combination of these factors indicates degraded water quality and/or habitat conditions. Overall, the fish communities in tributary sites adjacent to and downstream of ORNL outfalls also remained negatively affected by ORNL effluent in 2017 relative to reference streams and upstream sites.
BFK = Brushy Fork kilometer; MBK = Mill Branch kilometer; MEK = Melton Branch kilometer; and WCK = White Oak Creek kilometer
Figure 5.33. Fish species richness (number of species) in upper White Oak Creek (WCK 3.9) and lower Melton Branch (MEK 0.6) compared with two reference streams, Brushy Fork (BFK 7.6) and Mill
Branch (MBK 1.6), 1985–2017
A project to introduce fish species that were not found in the WOC watershed but that exist in similar systems on ORR and that may have historically existed in WOC was initiated in 2008 with the stocking of six such native species. Reproduction has been noted for five of the species, and several species have expanded their ranges downstream and upstream from initial introduction sites to establish new reproducing populations. In general, introduced species have had more difficulty establishing populations at upstream sites in both WOC and Melton Branch, and as a result, introductions to supplement the small populations of these fish species have continued at sites within the watershed. One exception to this is the striped shiner (Luxilus chrysocephalus), which has expanded into upper Melton Branch, upper WOC, and lower First Creek. The introductions have enhanced species richness at almost all sample locations within the watershed and illustrate the capacity of this watershed to support increased fish diversity, which seems to be limited by impassible barriers such as dams, weirs, and culverts, and by limited access to source populations downstream.

Oak Ridge Reservation Annual Site Environmental Report—2017
Oak Ridge National Laboratory 5-70
5.5.7 Cooling Tower Blowdown Whole Effluent Toxicity Monitoring
As part of the WQPP at ORNL, samples of blowdown from cooling towers 7902 (the cooling tower for the HFIR facility) and 8913 (the cooling tower for the SNS facility) were tested for whole effluent toxicity (WET) in May 2017. This was done as part of an ongoing WQPP investigation to identify the causes of biological community impairments in the WOC watershed. Prior to 2017, the investigation was focused on the reach of WOC that encompasses stream kilometer 3.9 (WCK 3.9). Biological communities in that stream reach are moderately impaired relative to reference sites, and several large cooling tower systems discharge blowdown immediately upstream of, or within that stream reach. The cooling tower systems close to WCK 3.9 have been tested for WET on multiple occasions over several years. The 7902 cooling tower discharges blowdown to a small tributary to Melton Branch, which has no influence at all on WCK 3.9. The 8913 tower discharges blowdown to the headwaters of WOC, almost 3 km upstream of WCK 3.9. In addition, at a more distant location, blowdown from the 8913 tower flows through a large storm water detention pond prior to discharge, which is thought to mitigate most negative effects of blowdown from that tower. Although they have little or no effect on water quality at WCK 3.9, blowdown discharges from these two cooling towers were selected for testing in 2017 to determine how they compared to the other towers that had been tested previously. Those towers were of particular interest because the chemical maintenance protocols for the two towers are somewhat different from the towers that have a more direct influence on water quality at WCK 3.9; if blowdown from these towers were to be less toxic, it would provide some insight into potential mitigation options for the other towers.
In WET testing, standard test organisms are exposed to multiple concentrations of effluent under standard test conditions, and the responses of the organisms (e.g., survival, reproduction, and/or growth) are measured. The specific test conducted on 7902 and 8913 effluents was a Ceriodaphnia dubia (C. dubia) three-brood survival and reproduction test, a test designed to estimate chronic toxicity. Previous testing at other locations has demonstrated that C. dubia are more sensitive to cooling tower blowdown than are fathead minnow larvae, the other test species commonly used in testing ORNL effluents. Results of WET testing effluents from towers 7902 and 8913 are presented in Table 5.12.
Table 5.12. Results of chronic toxicity testing using Ceriodaphnia dubia conducted in May 2017 on blowdown
Blowdown concentration (%)
Survival (%)
Reproductiona
(offspring/female)
7902 cooling tower
Control 100 33.4 ± 4.5 5 90 10.8 ± 5.4b
25 50b 5.4 ± 3.7b 50 80 6.0 ± 2.3b
100 60b 6.0 ± 3.0b
8913 cooling tower
Control 100 29.4 ± 5.6 5 80 12.8 ± 6.5b
25 70 7.0 ± 3.9b 50 80 7.6 ± 3.7b
100 70 8.2 ± 3.8b a Mean ± standard deviation b Significantly less than the control at alpha = 0.05

Oak Ridge Reservation Annual Site Environmental Report—2017
Oak Ridge National Laboratory 5-71
Cooling tower blowdown from 7902 and 8913 were found to have similar toxicity to other towers tested in previous years. In the 2017 tests, samples composed of 5% or greater tower blowdown (the rest being diluent, which in these tests were degassed mineral water) caused reductions in C. dubia fecundity. Although results varied temporally and from one tower to another in previous years’ testing, C. dubia reproduction tended to be less than the control sample at blowdown concentrations of approximately 5% to 25%.
In addition to the measured effects on C. dubia reproduction, samples from the 7902 tower also caused reductions in C. dubia survival at blowdown concentrations of 25% or more. Although survival effects have been seen when testing blowdown from other towers, reductions in C. dubia survival have been observed less commonly.
In previous years, WET testing of other cooling tower blowdown discharges has included samples that were exposed in the laboratory to various forms of water treatment. Treatments have included metals chelation by addition of ethylenediaminetetraacetic acid (EDTA), particulate removal by filtration through a 1.2 μm filter, and activated carbon treatment. Treated samples were WET-tested in attempts to infer whether any chemical constituents of the blowdown might be causing toxicity, and to potentially identify processes that might be employed at cooling towers in the future to treat blowdown prior to discharge. In that previous testing, some success at removing toxicity was achieved through the addition of EDTA, with the degree of improvement related to the amount of EDTA added. In testing the 7902 and 8913 towers, samples of 100% blowdown were treated to three different sample EDTA concentrations: 3, 6, and 12 mg/L. Unlike other towers tested in previous years, none of the samples from 7902 or 8913 experienced a reduction in toxicity following the addition of EDTA, indicating that the toxicity in the blowdown discharges of those two towers is less likely to be caused by one of the common cationic metals that react readily with EDTA.
To support evaluation of the WET testing results, samples of cooling tower blowdown were collected for chemical analyses. For the WET tests, three effluent samples were collected at 2 or 3 day intervals to support daily test renewals (in the test protocol, the water to which the C. dubia are exposed in test chambers is changed daily; each of the three effluent samples support 2 or 3 days of water exchanges). At 8913 all three samples were 24 hour composite samples; at 7902, all samples were grab samples (due to limitations encountered with sampling with an automatic water sampler at that location). Analyses for total and dissolved metals were performed on each water sample that was collected for the WET test daily renewals. Field measurements (conductivity, dissolved oxygen, instantaneous flow rate, pH, and temperature) and samples for chemical oxygen demand and suspended-solids analyses were collected once, on the first day of sampling, at each location. Field measurements and analytical results for samples from 7902 and 8913 are shown in Tables 5.13 and 5.14, respectively.
In the tables, metals concentrations are compared to Tennessee AWQCs where one exists. AWQCs are not directly applicable to effluent concentrations; they are applicable to instream pollutant concentrations. They are compared to effluent concentrations here to provide a frame of reference and to indicate which metals in cooling tower blowdown are of most concern by showing which metals require the most dilution in order not to cause concentrations of that metal to exceed the applicable instream AWQC. The data show that at the time the samples were collected, copper in the 8913 tower was the metal that had that greatest potential to cause instream AWQC exceedances. However, the tower 8913 samples were collected for the study at the first accessible point near the tower, still a long distance from the receiving stream and before the effluent flows through a large storm water detention pond. The long travel distance and the effects of the retention pond are thought to do a great deal to mitigate potential negative effects of the tower 8913 blowdown. Three measurements of total Cu exist from previous monitoring at the location where this effluent eventually reaches the receiving stream (at Outfall 435). The maximum total Cu concentration at the outfall was 0.00272 mg/L, comfortably below the AWQC.

Oak Ridge Reservation Annual Site Environmental Report—2017
Oak Ridge National Laboratory 5-72
The dissolved Cu concentration in the May 16, 2017, sample from tower 7902, as reported by the analytical laboratory, was above the lowest applicable AWQC concentration. However, that result is expected to be an analytical anomaly because it is considerably higher than the total Cu concentration measured in the same sample. (Table 5.13). This is also supported by the fact that the 7902 cooling system includes very little copper in its construction (most metal components are constructed of stainless steel or aluminum).
Table 5.13. Field parameters and analytical results from laboratory analyses of blowdown from the 7902 cooling system, compared to Tennessee Ambient Water Quality Criteria (AWQC)
Parameter 5/16/2017 5/18/2017 5/21/2017 Lowest
Applicable AWQCa,b
Chemical oxygen demand (mg/L) 45.6
Conductivity (mS/cm) 1.55
Dissolved oxygen (mg/L) 6.6
Flow (gpm) 100
pH (Standard units) 7.4
Suspended solids (mg/L) < 2
Temperature (°C) 27.4
Ag, dissolved (mg/L) < 0.0000192 < 0.0000192 < 0.0000192 0.0032 Ag, total (mg/L) < 0.0000192 < 0.0000192 < 0.0000192
As, dissolved (mg/L) < 0.001 < 0.001 < 0.001 0.150 As, total (mg/L) < 0.001 < 0.001 < 0.001 0.010 Be, dissolved (mg/L) < 0.0000359 < 0.0000359 < 0.0000359
Be, total (mg/L) < 0.0000359 < 0.0000359 < 0.0000359
Ca, dissolved (mg/L) 194 220 267
Ca, total (mg/L) 335 334 383
Cd, dissolved (mg/L) 0.000204 0.000232c 0.000214 0.00033 Cd, total (mg/L) 0.000254 0.000222 0.000292
Cr, dissolved (mg/L) < 0.000115 < 0.000115 0.00014 0.074 Cr, total (mg/L) 0.000874 0.000838 0.000784
Cu, dissolved (mg/L) 0.0316c,d 0.00273 0.00265 0.013 Cu, total (mg/L) 0.00332 0.00357 0.00333
Fe, dissolved (mg/L) < 0.0206 < 0.0206 < 0.0206
Fe, total (mg/L) < 0.0206 < 0.0206 < 0.0206
K, dissolved (mg/L) 27.2 27.2c 27.1
K, total (mg/L) 30.6 27.1 33.2
Mg, dissolved (mg/L) 59.1 60 62.4
Mg, total (mg/L) 66.5 60.3 76.9
Mn, dissolved (mg/L) 0.0003 0.000582 0.000788
Mn, total (mg/L) 0.00163 0.00256 0.00191
Mo, dissolved (mg/L) 0.00191 0.00189 0.00196
Mo, total (mg/L) 0.00224 0.00196 0.00244

Oak Ridge Reservation Annual Site Environmental Report—2017
Oak Ridge National Laboratory 5-73
Table 5.13 Field parameters and analytical results from laboratory analyses of blowdown from the 7902 cooling system, compared to Tennessee AWQC (continued)
Parameter 5/16/2017 5/18/2017 5/21/2017 Lowest
Applicable AWQCa,b
Na, dissolved (mg/L) 43.2 43.7c 45
Na, total (mg/L) 48.6 43.6 55.4
Ni, dissolved (mg/L) 0.00181 0.00254c 0.00281 0.073 Ni, total (mg/L) 0.00466 0.00233 0.00319 4.600 Pb, dissolved (mg/L) 0.000124 0.00025 < 0.0000951 0.0039 Pb, total (mg/L) 0.000252 0.000334 0.00028
Sb, dissolved (mg/L) 0.00301 0.00285 0.00299
Sb, total (mg/L) 0.00355 0.00301 0.00366 0.640 Se, dissolved (mg/L) < 0.0025 < 0.0025 < 0.0025
Se, total (mg/L) < 0.0025 < 0.0025 < 0.0025 0.005 Tl, dissolved (mg/L) < 0.00000379 < 0.00000379 < 0.00000379
Tl, total (mg/L) < 0.00000379 < 0.00000379 < 0.00000379 0.00047 Zn, dissolved (mg/L) 0.108 0.0956 0.0949 0.165 Zn, total (mg/L) 0.137 0.107 0.124
a For metals that have an AWQC dependent on water hardness, criteria presented here are for a hardness of 150 mg/L (CaCO3 equivalent) (with the exception of Cr which is based on a hardness of 100 mg/L [CaCO3 equivalent] because published hardness correction factors could not be located).
b Some criteria for metals are based on the dissolved form of the metal and some are based on total (dissolved plus particulate) metal concentration; criteria based on dissolved concentration are shown in this table beside the dissolved result; criteria based on total metal are shown beside the total metal result.
c Physically, dissolved metals are a fraction of or are equal to total metals; analytically, dissolved metals can be reported at higher concentrations than total metals; this can occur for several reasons. Each concentration (total and dissolved) has an associated analytical uncertainty that is calculated and reported with the result. Other sources of uncertainty (not included in the reported analytical error) are associated with sample handling and preparation.
d The large difference between total and dissolved Cu on May 16 is too great to be explained by the reported analytical uncertainties. It is suspected that the May 16 filtered water sample was contaminated with Cu during the sample filtration process.
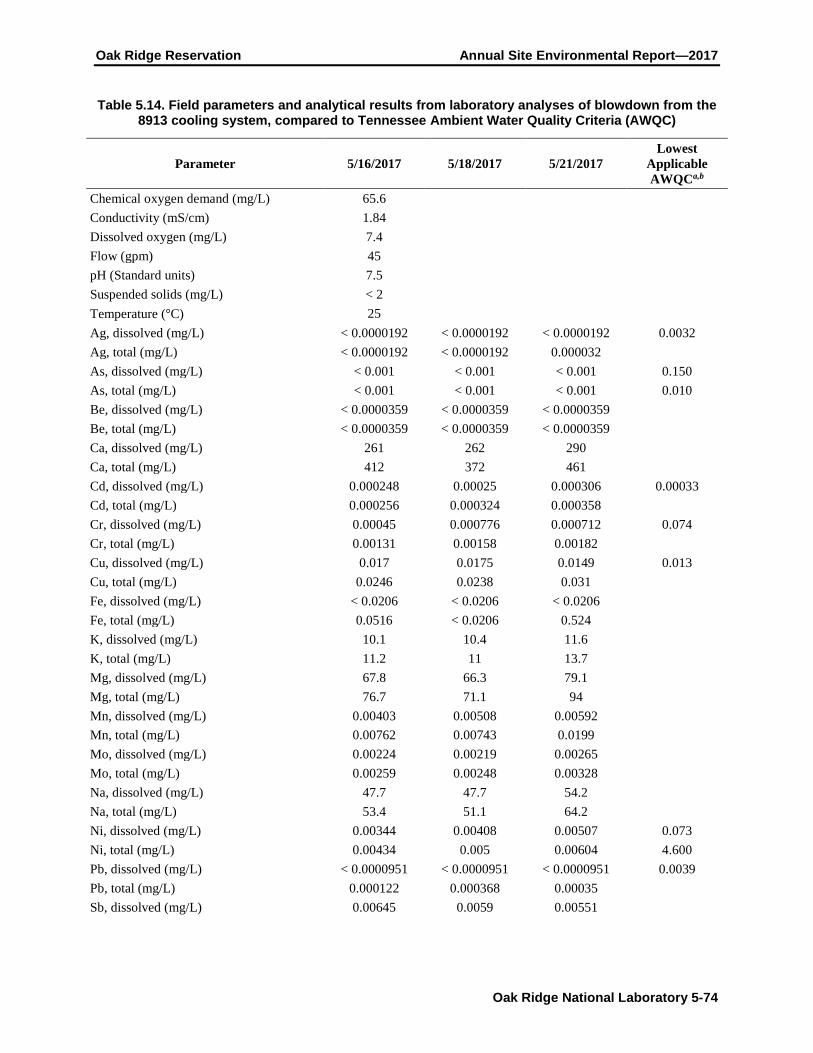
Oak Ridge Reservation Annual Site Environmental Report—2017
Oak Ridge National Laboratory 5-74
Table 5.14. Field parameters and analytical results from laboratory analyses of blowdown from the 8913 cooling system, compared to Tennessee Ambient Water Quality Criteria (AWQC)
Parameter 5/16/2017 5/18/2017 5/21/2017 Lowest
Applicable AWQCa,b
Chemical oxygen demand (mg/L) 65.6 Conductivity (mS/cm) 1.84 Dissolved oxygen (mg/L) 7.4 Flow (gpm) 45 pH (Standard units) 7.5 Suspended solids (mg/L) < 2 Temperature (°C) 25 Ag, dissolved (mg/L) < 0.0000192 < 0.0000192 < 0.0000192 0.0032 Ag, total (mg/L) < 0.0000192 < 0.0000192 0.000032 As, dissolved (mg/L) < 0.001 < 0.001 < 0.001 0.150 As, total (mg/L) < 0.001 < 0.001 < 0.001 0.010 Be, dissolved (mg/L) < 0.0000359 < 0.0000359 < 0.0000359 Be, total (mg/L) < 0.0000359 < 0.0000359 < 0.0000359 Ca, dissolved (mg/L) 261 262 290 Ca, total (mg/L) 412 372 461 Cd, dissolved (mg/L) 0.000248 0.00025 0.000306 0.00033 Cd, total (mg/L) 0.000256 0.000324 0.000358 Cr, dissolved (mg/L) 0.00045 0.000776 0.000712 0.074 Cr, total (mg/L) 0.00131 0.00158 0.00182 Cu, dissolved (mg/L) 0.017 0.0175 0.0149 0.013 Cu, total (mg/L) 0.0246 0.0238 0.031 Fe, dissolved (mg/L) < 0.0206 < 0.0206 < 0.0206 Fe, total (mg/L) 0.0516 < 0.0206 0.524 K, dissolved (mg/L) 10.1 10.4 11.6 K, total (mg/L) 11.2 11 13.7 Mg, dissolved (mg/L) 67.8 66.3 79.1 Mg, total (mg/L) 76.7 71.1 94 Mn, dissolved (mg/L) 0.00403 0.00508 0.00592 Mn, total (mg/L) 0.00762 0.00743 0.0199 Mo, dissolved (mg/L) 0.00224 0.00219 0.00265 Mo, total (mg/L) 0.00259 0.00248 0.00328 Na, dissolved (mg/L) 47.7 47.7 54.2 Na, total (mg/L) 53.4 51.1 64.2 Ni, dissolved (mg/L) 0.00344 0.00408 0.00507 0.073 Ni, total (mg/L) 0.00434 0.005 0.00604 4.600 Pb, dissolved (mg/L) < 0.0000951 < 0.0000951 < 0.0000951 0.0039 Pb, total (mg/L) 0.000122 0.000368 0.00035 Sb, dissolved (mg/L) 0.00645 0.0059 0.00551

Oak Ridge Reservation Annual Site Environmental Report—2017
Oak Ridge National Laboratory 5-75
Table 5.14 Field parameters and analytical results from laboratory analyses of blowdown from the 8913 cooling system, compared to Tennessee AWQCs (continued)
Parameter 5/16/2017 5/18/2017 5/21/2017 Lowest
Applicable AWQCa,b
Sb, total (mg/L) 0.00746 0.00663 0.00734 0.640 Se, dissolved (mg/L) < 0.0025 < 0.0025 < 0.0025
Se, total (mg/L) < 0.0025 < 0.0025 < 0.0025 0.005 Tl, dissolved (mg/L) < 0.00000379 < 0.00000379 0.000014c
Tl, total (mg/L) < 0.00000379 < 0.00000379 < 0.00000379 0.00047 Zn, dissolved (mg/L) 0.132 0.129 0.144 0.165 Zn, total (mg/L) 0.189 0.139 0.291
a For metals that have an AWQC dependent on water hardness, criteria presented here are for a hardness of 150 mg/L (CaCO3 equivalent) (with the exception of Cr which is based on a hardness of 100 mg/L [CaCO3 equivalent] because published hardness correction factors could not be located).
b Some criteria for metals are based on the dissolved form of the metal and some are based on total (dissolved plus particulate) metal concentration; criteria based on dissolved concentration are shown in this table beside the dissolved result; criteria based on total metal are shown beside the total metal result.
c Physically, dissolved metals are a fraction of, or are equal to total metals; analytically, dissolved metals can be reported at higher concentrations than total metals; this can occur for several reasons. Each concentration (total and dissolved) has an associated analytical uncertainty that is calculated and reported with the result. Other sources of uncertainty (not included in the reported analytical error) are associated with sample handling and preparation.
5.5.8 Polychlorinated Biphenyls in the White Oak Creek Watershed
The initial objective of the source identification task in the WOC watershed was to identify the stream reaches, outfalls, or sediment areas that are contributing to elevated PCB levels in the watershed. Sample results for largemouth bass collected from White Oak Lake showed tissue PCB concentrations higher than those recommended by TDEC and EPA for frequent consumption (Figure 5.27), but the mobility of the fish precluded the possibility of source identification. PCBs are hydrophobic and tend not to be dissolved in water, resulting in undetected PCB concentrations in water samples, even if collected from a contaminated site. Therefore, semipermeable membrane devices (SPMDs) are used to assess the chronic low-level sources of PCBs at critical sites on the reservation. SPMDs are thin plastic sleeves filled with oil in which PCBs are soluble. Because SPMDs are in contact with water at a given site for 4 weeks and have a high affinity for PCBs, a time-integrated semiquantitative index of the mean PCB concentration in the water column during the deployment period is obtained. SPMDs also have advantages over “snapshot” water concentration analyses. The long deployment period enables distinction between the relative PCB inputs at sites whose aqueous PCB concentrations are below detection limits in water.
In 2017, ORNL’s PCB monitoring efforts continued focusing on the First Creek watershed, which has been identified as a source of PCBs. Sampling sites on WOC included at kilometers 3.9, 4.1, and at Outfall 204. SPMDs were also deployed on First Creek at Outfalls 250, 341, 341-1 (sampling port), and the piping network of Outfall 250, which contributes to First Creek (Figure 5.34). SPMDs deployed in First Creek at FCK 0.9, downstream of Outfalls 249/250, and in the sampling port of Outfall 341 as well as that in WOC at WCK 3.4 were washed out during a storm event with heavy flows. The results for the remaining SPMDs are summarized in Table 5.15.

Oak Ridge Reservation Annual Site Environmental Report—2017
Oak Ridge National Laboratory 5-76
FCK = First Creek kilometer, WCK = White Oak Creek kilometer, OF = outfall
Figure 5.34. Locations of monitoring points for First Creek source investigation, 2017
Table 5.15. First Creek and WOC PCB source assessment, September 2017, total PCBs
Sample location Location Type SPMD (ppb)
OF 250 Outfall 7,634 250-19 Inlet/Outlet 15,161 OF 341 Outfall 2,021 FCK 0.1 Instream 5,360 OF 204 Outfall 321
WCK 3.9 Instream 1,057 WCK 4.1 Instream 1,057
Acronyms FCK = First Creek kilometer OF = outfall PCB = polychlorinated biphenyl SPMD = semipermeable membrane device WCK = White Oak Creek kilometer WOC = White Oak Creek
Results from the 2017 assessment confirm that upper parts of outfalls 249 and 250 pipe networks continue to be of primary interest for investigation of legacy PCB sources in the First Creek watershed. The results from sample location 250-19 (Table 5.15) indicate that PCBs remain available in that area despite recent actions to remove PCB-contaminated building materials from the upper part of the 250

Oak Ridge Reservation Annual Site Environmental Report—2017
Oak Ridge National Laboratory 5-77
watershed (Table 5.15). Therefore, First Creek remains the greatest area of concern for sources of PCBs and future remediation efforts. Results were within the ranges of past monitoring, giving no indication that the nature of PCB movement is significantly changing in those networks.
5.5.9 Oil Pollution Prevention
CWA Section 311 regulates the discharge of oils or petroleum products to waters of the United States and requires the development and implementation of spill prevention, control, and countermeasures (SPCC) plans to minimize the potential for oil discharges. These requirements are provided in 40 CFR 112, Oil Pollution Prevention. Each ORR facility implements a site-specific SPCC plan. NTRC, which is located off ORR, also has an SPCC plan covering the oil inventory at its location. CFTF is also located off ORR; however, that facility was evaluated, and a determination was made that it did not require a SPCC plan. The ORNL SPCC plan was revised in the later part of 2017. The major revision was the addition of an oil spill contingency plan in order to eliminate reliance on spill control gates at WOD for general spill containment requirements. The Oil Spill Contingency plan will be sent to local authorities in the first quarter of 2018. There were no regulatory actions related to oil pollution prevention at NTRC in 2017. An oil-handler training program exists to comply with training requirements in 40 CFR 112.
5.5.10 Surface Water Surveillance Monitoring
The ORNL surface water monitoring program is conducted in conjunction with the ORR surface water monitoring activities discussed in Section 6.4 to enable assessing the impacts of ongoing DOE operations on the quality of local surface water. The sampling locations (Figure 5.35) are used to monitor conditions upstream of ORNL main plant waste sources (WCK 6.8), within the ORNL campus (FFK 0.1), and downstream of ORNL discharge points (WCK 1.0).
Sampling frequencies and parameters vary by site and are shown in Table 5.16. Radiological monitoring at the discharge point downstream of ORNL (White Oak Lake at WOD) is conducted monthly under the ORNL WQPP (Section 5.5.3) and, therefore, is not duplicated by this program. Radiological monitoring at a point upstream of ORNL is conducted monthly under the ORNL WQPP (Section 5.5.3) and therefore is not duplicated by the surface water monitoring program. Total radioactive strontium is monitored quarterly by this surveillance program.
Samples are collected and analyzed for general water quality parameters and are screened for radioactivity at all locations (either under this program or under WQPP). Samples are further analyzed for specific radionuclides when general screening levels are exceeded. Samples from White Oak Lake at WOD are also checked for volatile organic compounds (VOCs), PCBs, and mercury. WCK 6.8 is also checked for PCBs. WCK 6.8 and WCK 1.0 are classified by the State of Tennessee for freshwater fish and aquatic life. Tennessee Water Quality Criteria (WQCs) associated with these classifications are used as references where applicable (TDEC 2015). The Tennessee WQCs do not include criteria for radionuclides. Four percent of the DOE DCS is used for radionuclide comparison because that value is roughly equivalent to the 4 mrem dose limit from ingestion of drinking water on which the EPA radionuclide drinking water standards are based (DOE 2011a).
There were no radionuclides reported above 4% of DCS at the Fifth Creek location (FFK 0.1). The beta activity and 89/90Sr concentrations are related to known sources in the middle of the ORNL main campus. No 89/90Sr results above 4% of DCS were reported for samples collected at the upstream White Oak Creek sampling location (WCK 6.8). The other radionuclide results from WCK 6.8 and the radionuclide results from samples collected at WOD (before WOC empties into the Clinch River) are discussed in Section 5.5.3.
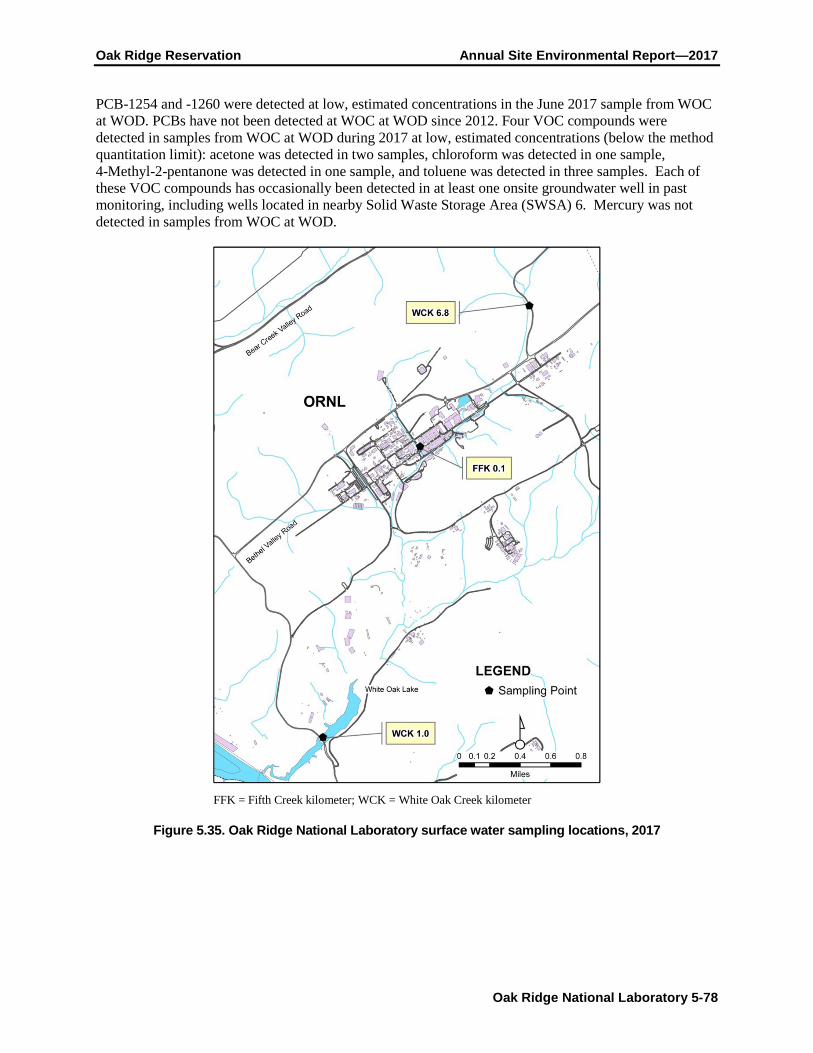
Oak Ridge Reservation Annual Site Environmental Report—2017
Oak Ridge National Laboratory 5-78
PCB-1254 and -1260 were detected at low, estimated concentrations in the June 2017 sample from WOC at WOD. PCBs have not been detected at WOC at WOD since 2012. Four VOC compounds were detected in samples from WOC at WOD during 2017 at low, estimated concentrations (below the method quantitation limit): acetone was detected in two samples, chloroform was detected in one sample, 4-Methyl-2-pentanone was detected in one sample, and toluene was detected in three samples. Each of these VOC compounds has occasionally been detected in at least one onsite groundwater well in past monitoring, including wells located in nearby Solid Waste Storage Area (SWSA) 6. Mercury was not detected in samples from WOC at WOD.
FFK = Fifth Creek kilometer; WCK = White Oak Creek kilometer
Figure 5.35. Oak Ridge National Laboratory surface water sampling locations, 2017

Oak Ridge Reservation Annual Site Environmental Report—2017
Oak Ridge National Laboratory 5-79
Table 5.16. Oak Ridge National Laboratory surface water sampling locations, frequencies, and parameters, 2017
Locationa Description Frequency and type Parametersb
WCK 1.0 White Oak Lake at WOD Quarterly, grab Volatiles, mercury, PCBsc, field measurements
WCK 6.8 WOC upstream from ORNL Quarterly, grab PCBs, Total radioactive strontium, field measurements
FFK 0.1 Fifth Creek just upstream of WOC (ORNL)
Semiannually, grab Gross alpha, gross beta, total radioactive strontium, gamma scan, tritium, field measurements
a Locations identify bodies of water and locations on them (e.g., WCK 1.0 is 1 km upstream from the confluence of White Oak Creek and the Clinch River).
b Field measurements consist of dissolved oxygen, pH, and temperature. c The September PCB sample was accidentally spiked during extraction by the lab. There was no sample left to re-extract and a replacement sample was not collected.
Acronyms FFK = Fifth Creek kilometer ORNL = Oak Ridge National Laboratory PCB = polychlorinated biphenyl WCK = WOC kilometer WOC = White Oak Creek WOD = White Oak Dam
5.5.11 Carbon Fiber Technology Facility Waste Water Monitoring
Facility and process wastewater from activities at CFTF are discharged to the City of Oak Ridge sanitary sewer system under conditions established in City of Oak Ridge Industrial Waste Water Discharge Permit 1-12. Permit limits, parameters, and 2017 compliance status for this permit are summarized in Table 5.17.
Table 5.17. Industrial and commercial user wastewater discharge permit compliance at the Oak Ridge National Laboratory Carbon Fiber Technology Facility, 2017
Effluent parameters
Permit limits Permit compliance
Daily max. (mg/L)
Daily min. (mg/L)
Number of noncompliances
Number of samples
Percentage of compliancea
Outfall 01 (Underground Quench Water Tank)
Cyanide 4.2 0 0 100 pH (standard units) 9.0 6.0 0 0 100
Outfall 02 (Electrolytic Bath Tank)
pH (standard units) 9.0 6.0 0 7 100
Outfall 03 (Sizing Bath Tank)
Copper 0.87 0 0 100 Zinc 1.24 0 0 100 Total phenol 4.20 0 0 100 pH (standard units) 9.0 6.0 0 0 100 a Percentage compliance = 100 – [(number of noncompliances/number of samples) × 100]

Oak Ridge Reservation Annual Site Environmental Report—2017
Oak Ridge National Laboratory 5-80
5.6 Groundwater Monitoring Program Groundwater monitoring at ORNL was conducted under two sampling programs in 2017: DOE OREM monitoring and DOE SC surveillance monitoring. The DOE OREM groundwater monitoring program was conducted by UCOR in 2017. The SC groundwater monitoring surveillance program was conducted by UT-Battelle.
5.6.1 DOE Office of Environmental Management Groundwater Monitoring
Monitoring was performed as part of an ongoing comprehensive CERCLA cleanup effort in Bethel and Melton Valleys, the two administrative watersheds at the ORNL site. Groundwater monitoring for baseline and trend evaluation in addition to measuring effectiveness of completed CERCLA remedial actions (RAs) is conducted as part of the WRRP. The WRRP is managed by UCOR for the DOE OREM program. The results of CERCLA monitoring for ORR for FY 2017, including monitoring at ORNL, are evaluated and reported in the 2018 remediation effectiveness report (DOE 2018) as required by the ORR FFA. The monitoring results and remedial effectiveness evaluations for Bethel and Melton Valley are reported in Sections 2 and 3, respectively, in that report.
Groundwater monitoring conducted as part of the OREM program at ORNL includes routine sampling and analysis of groundwater in Bethel Valley to measure performance of several RAs and to continue contaminant and groundwater quality trend monitoring. In Melton Valley, where CERCLA RAs were completed in 2006 for the extensive waste management areas, the groundwater monitoring program includes monitoring groundwater levels to evaluate the effectiveness of hydrologic isolation of buried waste units. Additionally, groundwater is sampled and analyzed for a wide range of general chemical and contaminant parameters in 46 wells within the interior portion of the closed waste management area.
In FY 2010 DOE initiated activities on a groundwater treatability study at the Bethel Valley 7000 Services Area VOC plume. This plume contains trichloroethylene (TCE) and its transformation products cis-1,2-dichloroethene and vinyl chloride, all at concentrations greater than EPA primary drinking water standards. The treatability study is a laboratory and field demonstration to determine whether microbes inherent to the existing subsurface microbial population can fully degrade the VOCs to nontoxic end products.
During FY 2017 postremediation monitoring continued at SWSA 3 following completion of hydrologic isolation of the area by construction of a multilayer cap and upgradient stormflow/shallow groundwater diversion drain. RAs and monitoring were specified in a CERCLA RA work plan that was developed by DOE and approved by EPA and TDEC before the project was started.
5.6.1.1 Summary of DOE Office of Environmental Management Groundwater Monitoring
Bethel Valley During FY 2011 construction was completed for RAs at SWSA 1 and SWSA 3, two former waste storage sites that were used for disposal of radioactively contaminated solid wastes between 1944 and 1950. Wastes disposed of at SWSA 1 originated from the earliest operations of ORNL; those at SWSA 3 originated from ORNL, Y-12, the K-25 Site (ETTP), and off-site sources. Although most of the wastes disposed of at SWSA 3 were solids, some were containerized liquid wastes. Some wastes were encapsulated in concrete after placement in burial trenches, but most of the waste was covered with soil. The Bethel Valley Record of Decision (ROD) (DOE 2002) selected hydrologic isolation using multilayer caps and groundwater diversion trenches as the RA for the waste burial grounds and construction of soil covers over the former contractor’s landfill and contaminated soil areas near SWSA 3. The baseline

Oak Ridge Reservation Annual Site Environmental Report—2017
Oak Ridge National Laboratory 5-81
monitoring conducted during FY 2010 included measurement of groundwater levels to obtain baseline data to allow evaluation of postremediation groundwater-level suppression. Sampling and analysis of groundwater quality and contaminants were also conducted. Postremediation monitoring was specified for SWSA 3 in the Phased Construction Completion Report for the Bethel Valley Burial Grounds at the Oak Ridge National Laboratory, Oak Ridge, Tennessee (DOE 2012). Required monitoring includes quarterly groundwater-level monitoring in 42 wells with continuous water-level monitoring in 8 wells to confirm cap performance. Groundwater samples are collected semiannually at 13 wells for laboratory analyses to evaluate groundwater contaminant concentration trends.
FY 2017 monitoring results showed that the cap was effective, although target groundwater elevations have not yet been attained at three of eight wells. Drinking water standards are used as screening water quality concentrations to evaluate the site response to remediation. Groundwater quality monitoring at SWSA 3 showed decreasing or stable concentrations of gross beta activity in two wells with beta activities greater than 50 pCi/L. Strontium-90, a signature contaminant at SWSA 3, showed decreasing trends for 90Sr in two wells, a stable trend in one well, and an increasing trend in one well. Benzene, potentially from natural sources, showed a stable concentration trend in two wells where it is routinely detected.
During FY 2017, as part of the DOE OREM program, three groundwater monitoring wells in Bethel Valley to the west of Tennessee Highway 95 were monitored to detect and track contamination from the SWSA 3 area. Data from those three wells supplement data being collected from a multiport well (4579) near SWSA 3 (included in the preceding paragraph discussion) for exit pathway groundwater monitoring in western Bethel Valley. Groundwater monitoring near SWSA 3, along with the exit pathway, and groundwater and surface water monitoring at the northwest tributary of WOC and in the headwaters of Raccoon Creek allow integration of data concerning SWSA 3 contaminant releases. The data are presented in the 2017 remediation effectiveness report (DOE 2018).
Groundwater monitoring continued at the ORNL 7000 Area during FY 2017 to evaluate treatability of the VOC plume at that site. Site characterization testing of the endemic microbial community showed that microbes were present that are capable of fully degrading TCE and its degradation products if sufficient electron donor compounds are present in the subsurface environment. During FY 2011 a mixture of emulsified vegetable oil and a hydrogen-releasing compound was injected into four existing monitoring wells in the 7000 area. Ongoing monitoring of VOC concentrations show that the effects of the biostimulation test continue to be apparent, although at decreasing levels.
The other principal element of the Bethel Valley ROD (DOE 2002) remedy that requires groundwater monitoring is the containment pumping to control and treat discharges from the ORNL Central Campus core hole 8 plume. The original action for the plume was a CERCLA removal action that was implemented in 1995. The remedy had performed well until the latter portion of FY 2008 when conditions changed and 90Sr and 233/234U concentrations in monitoring wells and the groundwater collection system began increasing. During FY 2009 the remedy did not meet its performance goal, which is a reduction of 90Sr in WOC. In March 2012 DOE completed refurbishment and enhancement of the groundwater collection system to increase the effectiveness of the plume containment.
Between FY 2012 and FY 2015 the Bethel Valley ROD goal for 90Sr concentrations at the 7500 Bridge Weir monitoring location was met. During FY 2016 and FY 2017 that goal was exceeded because of contaminant releases from a deteriorated radiological wastewater drain that caused 90Sr discharges from storm drain Outfall 304 into WOC. The 90Sr concentrations in PWTC (X12) discharges were higher than normal during FY 2017 and contributed to Bethel Valley exceedances of the ROD goal for 90Sr at the WOC Bridge Weir location.

Oak Ridge Reservation Annual Site Environmental Report—2017
Oak Ridge National Laboratory 5-82
Melton Valley The Melton Valley ROD (DOE 2000) established goals for a reduction of contaminant levels in surface water, groundwater-level fluctuation reduction goals within hydrologically isolated areas, and minimization of the spread of groundwater contamination. Groundwater monitoring to determine the effectiveness of the remedy in Melton Valley includes groundwater-level monitoring in wells within and adjacent to hydrologically isolated shallow waste burial areas and groundwater quality monitoring in selected wells adjacent to buried waste areas.
Groundwater-level monitoring shows that the hydrologic isolation component of the Melton Valley remedy is effectively minimizing the amount of percolation water contacting buried waste and is reducing contaminated leachate formation. The total amount of rainfall during FY 2017 was about 4 in. greater than the long-term annual average for ORR. In a few areas groundwater levels within capped areas continue to respond to groundwater fluctuations imposed from areas outside the caps, but contact of groundwater with buried waste is minimal. Overall the hydrologic isolation systems are performing as designed.
Groundwater quality monitoring in the interior of Melton Valley shows that in general groundwater contaminant concentrations are declining or are stable following RAs. Groundwater quality monitoring substantively equivalent to the former RCRA monitoring continues at SWSA 6. Several VOC substances continue to be detected in wells along the eastern edge of the site.
During the past 10 years of groundwater monitoring in the Melton Valley exit pathway, several site-related contaminants have been detected in groundwater near the Clinch River. Low concentrations of Sr, tritium, uranium, and VOCs have been detected intermittently in a number of the multizone sampling locations. Groundwater in the exit pathway wells has high alkalinity and sodium and exhibits elevated pH. During FY 2017 an off-site groundwater monitoring well array west of the Clinch River and adjacent to Melton Valley was monitored as part of the OREM program. Monitoring included groundwater-level monitoring to evaluate potential flowpaths near the river and sampling and analysis for a wide array of metals, anions, radionuclides, and VOCs. Groundwater-level monitoring showed that natural head gradient conditions cause groundwater seepage to converge toward the Clinch River from both the DOE (eastern) and off-site (western) sides of the river. Monitoring results are summarized in the 2018 remediation effectiveness report (DOE 2018).
5.6.2 DOE Office of Science Groundwater Monitoring
DOE O 458.1 (DOE 2011d) is the primary requirement for a site-wide groundwater protection program at ORNL. As part of the groundwater protection program, and to be consistent with UT-Battelle management objectives, groundwater surveillance monitoring was performed to monitor ORNL groundwater exit pathways and UT-Battelle facilities (“active sites”) potentially posing a risk to groundwater resources at ORNL. Results of the DOE SC groundwater surveillance monitoring program are reported in the following sections.
Exit pathway and active-sites groundwater surveillance monitoring points sampled during 2017 included seep/spring and surface-water monitoring locations in addition to groundwater surveillance monitoring wells. Seep/spring and surface-water monitoring points located in appropriate groundwater discharge areas were used in the absence of monitoring wells.
Groundwater monitoring performed under the exit pathway groundwater surveillance and active-sites monitoring programs are not regulated by federal or state rules. Consequently, no permit or standards exist for evaluating sampling results. To provide a basis for evaluating analytical results and to assess groundwater quality at locations monitored by UT-Battelle, current federal drinking water standards

Oak Ridge Reservation Annual Site Environmental Report—2017
Oak Ridge National Laboratory 5-83
and/or Tennessee WQCs for radiological and nonradiological contaminants were used as reference standards. If no federal or state standard had been established for a particular radionuclide, 4% of the DCSs for radionuclides (DOE 2011a) were used to evaluate sampling results. Although drinking water standards and DOE DCSs were used for comparative purposes, it is important to note that no members of the public consume groundwater from ORNL wells, nor do any groundwater wells furnish drinking water to personnel at ORNL.
5.6.2.1 Exit Pathway Monitoring During 2017, exit pathway groundwater surveillance monitoring was performed in accordance with the exit pathway sampling and analysis plan (Bonine 2012). Groundwater exit pathways at ORNL include areas from watersheds or sub-watersheds where groundwater discharges to the Clinch River–Melton Hill Reservoir to the west, south, and east of the ORNL main campus. The exit pathway monitoring points were chosen based on hydrologic features, screened interval depths (for wells), and locations relative to discharge areas proximate to DOE facilities operated by, or under the control of, UT-Battelle. The groundwater exit pathways at ORNL include four discharge zones identified by a data quality objectives process. One of the original exit pathway zones was split into two zones for geographic expediency. The Southern Discharge Area Exit Pathway was carved from the East End Discharge Area Exit Pathway.
The five zones are as follows:
• the WOC Discharge Area Exit Pathway, • the 7000–Bearden Creek Watershed Discharge Area Exit Pathway, • the East End Discharge Area Exit Pathway, • the Northwestern Discharge Area Exit Pathway, and • the Southern Discharge Area Exit Pathway.
Figure 5.36 shows the locations of the exit pathway monitoring points sampled in 2017.

Oak Ridge Reservation Annual Site Environmental Report—2017
Oak Ridge National Laboratory 5-84
OREM = DOE Office of Environmental Management; SC = DOE Office of Science
Figure 5.36. UT-Battelle exit pathway groundwater monitoring locations at Oak Ridge National Laboratory, 2017
The efficacy of the exit pathway monitoring program was reviewed in late 2011. As a result, the groundwater monitoring program was modified through an optimization approach that included frequency analysis of parameters and their concentrations based on an exhaustive review of historical groundwater sampling data. The modification resulted in a 10 year staggered groundwater monitoring schedule and analytical suite selection. This approach was initiated in 2012. The groundwater monitoring program implemented in 2017 is outlined in Table 5.18.
Unfiltered samples were collected from the exit pathway groundwater surveillance monitoring points in 2017. The organic suite was composed of VOCs and semivolatile organic compounds (SVOCs); the metallic suite included heavy and non-heavy metals; and the radionuclide suite was composed of gross alpha/gross beta activity, gamma emitters, 89/90Sr, and tritium. Under the monitoring strategy outlined in the exit pathway sampling and analysis plan (Bonine 2012), samples were collected semiannually during the wet (April) and dry (July/August) seasons.

Oak Ridge Reservation Annual Site Environmental Report—2017
Oak Ridge National Laboratory 5-85
Table 5.18. 2017 exit pathway groundwater monitoring schedule
Monitoring point
Season
Wet Dry
7000 Bearden Creek Discharge Area
BC-01 Radiological Radiological
East End Discharge Area
923 Radiological Radiological EE-01 Radiological Radiological EE-02 Radiological, organic, and metals Radiological
Northwestern Discharge Area
531 Radiological Radiological 535 Radiological Radiological, organic, and metals 807 Radiological Radiological 808 Radiological Radiological
Southern Discharge Area
S-01 Radiological Radiological S-02 Radiological Radiological
White Oak Creek Discharge Area
857 Radiological Radiological, organic, and metals 858 Radiological Radiological
1190 Radiological, organic, and metals Radiological, organic, and metals 1191 Radiological, organic, and metals Radiological, organic, and metals 1239 Radiological Radiological
Exit Pathway Monitoring Results Statistical trend analyses were performed on 2017 exit pathway monitoring data sets containing data exceeding reference standards. The bases used for the trend analyses were the historical data collected from the late 1980s through 2016. Trend analyses were not performed on data sets where minimum detection limits exceeded reference standards (i.e., the SVOCs atrazine, benzo(a)pyrene, hexachlorobenzene, and pentachlorophenol) and were not performed on parameters for which there are no reference standards or where data densities were insufficient. Parameters that exhibited statistically significant (80% to 99% confidence levels) upward or downward trends are reported. Trend analysis results are summarized in Table 5.19.
Table 5.20 provides a summary of radiological parameters detected in samples collected from exit pathway monitoring points during 2017. Metals are ubiquitous in groundwater exit pathways and so are not summarized in the table.

Oak Ridge Reservation Annual Site Environmental Report—2017
Oak Ridge National Laboratory 5-86
Table 5.19. 2017 exit pathway groundwater monitoring—results of
trend analyses for parameters exceeding reference standards
Monitoring point Parameter Trend
East End Discharge Area
EE-02 Al No trenda
Northwestern Discharge Area
535 Al No trend 535 Fe No trend 535 Mn No trend
White Oak Creek Discharge Area
857 Al No trend 1190 Fe Downward 1190 Mn Downward 1190 Tritium Downward 1191 Fe No trend 1191 Mn No trend 1191 Gross beta Downward 1191 89/90Sr No trend 1191 Tritium Downward
a Statistically insignificant trend upward or downward.
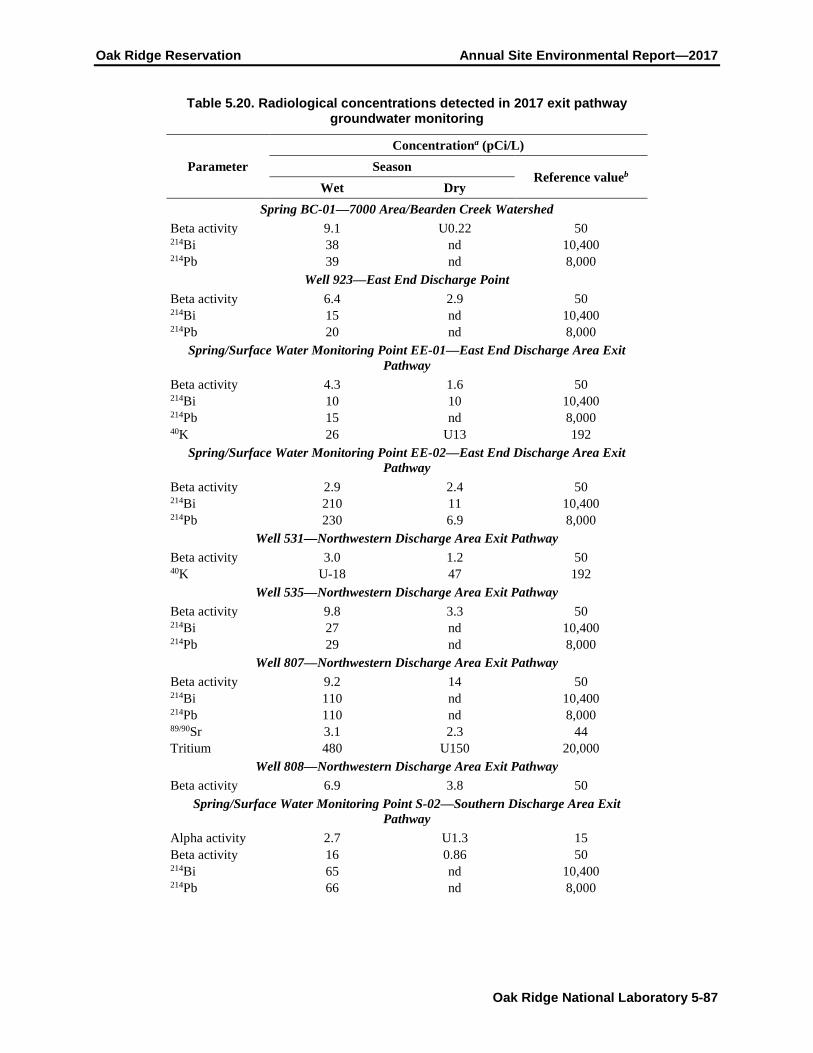
Oak Ridge Reservation Annual Site Environmental Report—2017
Oak Ridge National Laboratory 5-87
Table 5.20. Radiological concentrations detected in 2017 exit pathway groundwater monitoring
Parameter Concentrationa (pCi/L)
Season Reference valueb
Wet Dry Spring BC-01—7000 Area/Bearden Creek Watershed
Beta activity 9.1 U0.22 50 214Bi 38 nd 10,400 214Pb 39 nd 8,000
Well 923—East End Discharge Point Beta activity 6.4 2.9 50 214Bi 15 nd 10,400 214Pb 20 nd 8,000
Spring/Surface Water Monitoring Point EE-01—East End Discharge Area Exit Pathway
Beta activity 4.3 1.6 50 214Bi 10 10 10,400 214Pb 15 nd 8,000 40K 26 U13 192
Spring/Surface Water Monitoring Point EE-02—East End Discharge Area Exit Pathway
Beta activity 2.9 2.4 50 214Bi 210 11 10,400 214Pb 230 6.9 8,000
Well 531—Northwestern Discharge Area Exit Pathway Beta activity 3.0 1.2 50 40K U-18 47 192
Well 535—Northwestern Discharge Area Exit Pathway Beta activity 9.8 3.3 50 214Bi 27 nd 10,400 214Pb 29 nd 8,000
Well 807—Northwestern Discharge Area Exit Pathway Beta activity 9.2 14 50 214Bi 110 nd 10,400 214Pb 110 nd 8,000 89/90Sr 3.1 2.3 44 Tritium 480 U150 20,000
Well 808—Northwestern Discharge Area Exit Pathway Beta activity 6.9 3.8 50
Spring/Surface Water Monitoring Point S-02—Southern Discharge Area Exit Pathway
Alpha activity 2.7 U1.3 15 Beta activity 16 0.86 50 214Bi 65 nd 10,400 214Pb 66 nd 8,000

Oak Ridge Reservation Annual Site Environmental Report—2017
Oak Ridge National Laboratory 5-88
Table 5.20 Radiological concentrations detected in 2017 exit pathway groundwater monitoring (continued)
Parameter Concentrationa (pCi/L)
Season Reference valueb
Wet Dry Well 857—WOC Discharge Area Exit Pathway
Beta activity 6.3 1.3 50 214Bi 120 nd 10,400 214Pb 130 nd 8,000
Well 858—WOC Discharge Area Exit Pathway Beta activity 5.4 U0.44 50 214Bi 19 nd 10,400 214Pb 19 nd 8,000
Well 1190—WOC Discharge Area Exit Pathway Beta activity 5.3 1.8 50 214Bi 44 31 10,400 212Pb 6.0 3.1 152 214Pb 58 29 8,000 89/90Sr 1.8 U-0.52 44 Tritium 24,000 24,000 20,000
Well 1191—WOC Discharge Area Exit Pathway Alpha activity 5.9 U2.6 15 Beta activity 270 220 50 214Bi 32 12 10,400 214Pb 35 13 8,000 89/90Sr 130 120 44 Tritium 24,000 14,000 20,000
Well 1239—WOC Discharge Area Exit Pathway Alpha activity 4.8 U0.55 15 Beta activity 10 0.99 50 a ND: not detected. “U” means that the analyte was analyzed for but not detected above the PQL/CRDL.
b Current federal drinking water standards and/or Tennessee WQCs for radiological contaminants were used as reference standards. If no federal or state standard exists for a particular radionuclide, 4% of the DCS for a radionuclide is used.
Summary The following bullets summarize the exit pathway groundwater surveillance program monitoring efforts for 2017 at ORNL:
• Eight radiological contaminants were detected in exit pathway groundwater samples collected in 2017. Tritium, 89/90Sr, and gross beta activity were the only radiological contaminants exceeding reference standards at any of the discharge areas, and, as in past years, those three contaminants were observed at the WOC discharge area in 2017. Statistical trend analyses show that the concentration trends for those parameters continue downward (or possess no statistically significant trend as was detected in the case of 89/90Sr in Well 1191). No other radiological contaminants exceed reference standards at other discharge areas.
• Twenty-four metallic contaminants were detected in exit pathway groundwater samples collected in 2017; however, only three metals (iron, manganese, and aluminum) were detected at concentrations

Oak Ridge Reservation Annual Site Environmental Report—2017
Oak Ridge National Laboratory 5-89
exceeding reference standards. Statistical trend analyses show that the concentration trends for these parameters continue downward or possess no statistically significant trend. These metals are commonly found in groundwater at ORNL
• No VOCs were detected in exit pathway groundwater at ORNL during 2017.
Radiological and metal contaminant concentrations observed in groundwater exit pathway discharge areas were generally consistent with observations reported in past annual site environmental reports for ORR. Based on the results of the 2017 monitoring effort, there is no indication that current SC operations are significantly introducing contaminants to the groundwater at ORNL.
5.6.2.2 Active Sites Monitoring—High Flux Isotope Reactor Two storm water outfall collection systems (Outfalls 281 and 383) intercept groundwater in the HFIR area and are routinely monitored under a monitoring plan associated with the ORNL NPDES permit. (See Section 5.5 for a discussion of results.)
5.6.2.3 Active Sites Monitoring—Spallation Neutron Source Active sites groundwater surveillance monitoring was performed in 2017 at the SNS site under the SNS operational monitoring plan (OMP) (Bonine, Kettelle, and Trotter 2007) due to the potential for adverse impact on groundwater resources at ORNL should a release occur. Operational monitoring was initiated following a 2 year (2004–2006) baseline monitoring program and will continue throughout the duration of SNS operations.
The SNS site is located atop Chestnut Ridge, northeast of the main ORNL facilities. The site slopes to the north and south, and small stream valleys, populated by springs and seeps, lie on the ridge flanks. Surface water drainage from the site flows into Bear Creek to the north and WOC to the south.
The SNS site is a hydrologic recharge area underlain by geologic formations that form karst geologic features. Groundwater flow directions at the site are based on the generally observed tendency for groundwater to flow parallel to geologic strike (parallel to the orientation of the rock beds) and via karst conduits that break out at the surface in springs and seeps located downgradient of the SNS site. A sizable fraction of infiltrating precipitation (groundwater recharge) flows to springs and seeps via the karst conduits. SNS operations have the potential for introducing radioactivity (via neutron activation) in the shielding berm surrounding the SNS linac, accumulator ring, and/or beam transport lines. A principal concern is the potential for water infiltrating the berm soils to transport radionuclide contamination generated by neutron activation to saturated groundwater zones. The ability to accurately model the fate and transport of neutron activation products generated by beam interactions with the engineered soil berm is complicated by multiple uncertainties resulting from a variety of factors, including hydraulic conductivity differences in earth materials found at depth, the distribution of water-bearing zones, the fate and transport characteristics of neutron activation products produced, diffusion and advection, and the presence of karst geomorphic features found on the SNS site. These uncertainties led to the initiation of the groundwater surveillance monitoring program at the SNS site. Objectives of the groundwater monitoring program outlined in the OMP include the following: (1) maintain compliance with applicable DOE contract requirements and environmental quality standards and (2) provide uninterrupted monitoring of the SNS site.
A total of seven springs, seeps, and surface water sampling points were routinely monitored as analogues to, and in lieu of, groundwater monitoring wells. Locations were chosen based on hydrogeological factors and proximity to the beam line. Figure 5.37 shows the locations of the specific monitoring points sampled during 2017.

Oak Ridge Reservation Annual Site Environmental Report—2017
Oak Ridge National Laboratory 5-90
S = springs, SP = seeps, SW = surface water sampling areas
Figure 5.37. Groundwater monitoring locations at the Spallation Neutron Source, 2017
In November 2011 the SNS historical tritium data were evaluated to determine whether sampling could be optimized. The influence of flow condition on the proportion of tritium detects and nondetects in water samples collected at SNS from April 2004 through September 2011 was examined. In addition, the effect of seasonality on the proportion of detects and nondetects was examined for the same data set. The results of the analysis indicated that the proportion of detects to nondetects is not related to flow conditions or seasonality. This implies that samples could be collected during any flow condition and season with the expectation that there would be no statistical difference in the proportion of tritium detects to nondetects.
The results of this statistical analysis of the April 2004–September 2011 data set were the basis for the modified OMP monitoring scheme implemented in 2012.
Quarterly sampling at each monitoring point continued in 2017, allowing the opportunity for monitoring in wet and dry seasons. All sampling performed in 2017 was performed in conjunction with rainfall events, with samples being collected during rising or falling (recession) limb flow conditions (see Figure 5.38). In Fig. 5.38, the curves represent spring or seep flow (base flow, through flow, overland flow, peak flow); the bars represent rainfall amounts. Table 5.21 shows the sampling and parameter analysis schedule followed in 2017.
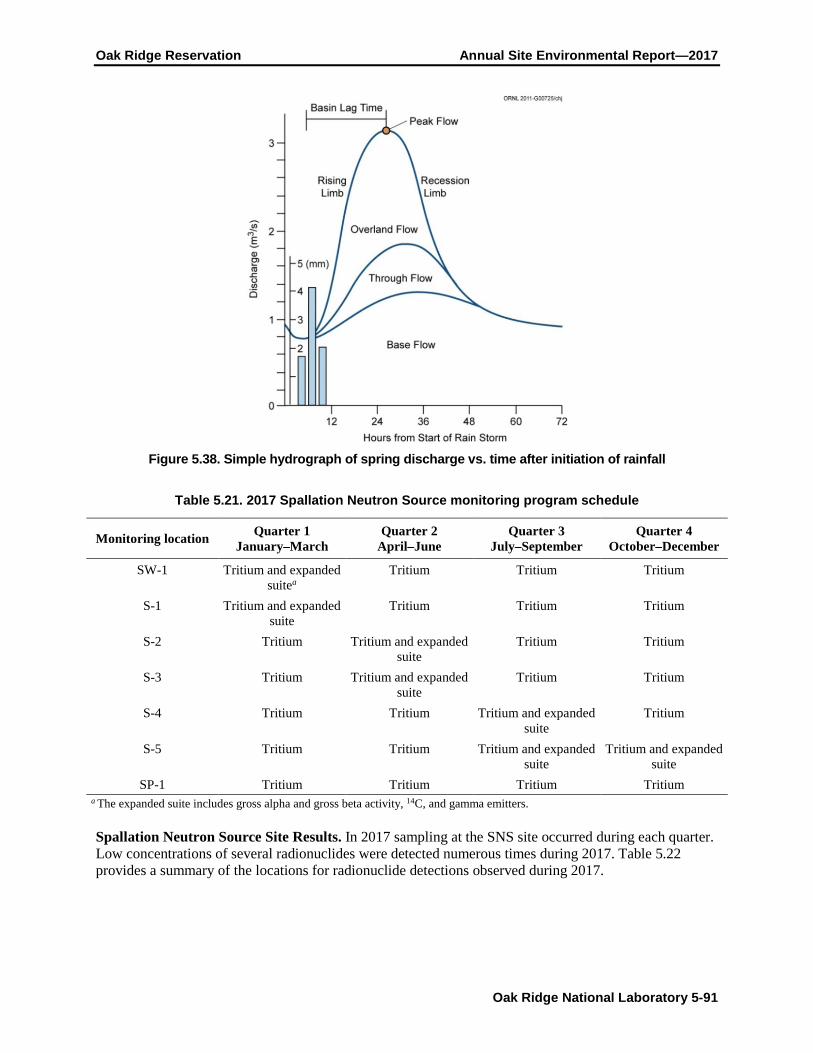
Oak Ridge Reservation Annual Site Environmental Report—2017
Oak Ridge National Laboratory 5-91
Figure 5.38. Simple hydrograph of spring discharge vs. time after initiation of rainfall
Table 5.21. 2017 Spallation Neutron Source monitoring program schedule
Monitoring location Quarter 1 January–March
Quarter 2 April–June
Quarter 3 July–September
Quarter 4 October–December
SW-1 Tritium and expanded suitea
Tritium Tritium Tritium
S-1 Tritium and expanded suite
Tritium Tritium Tritium
S-2 Tritium Tritium and expanded suite
Tritium Tritium
S-3 Tritium Tritium and expanded suite
Tritium Tritium
S-4 Tritium Tritium Tritium and expanded suite
Tritium
S-5 Tritium Tritium Tritium and expanded suite
Tritium and expanded suite
SP-1 Tritium Tritium Tritium Tritium a The expanded suite includes gross alpha and gross beta activity, 14C, and gamma emitters.
Spallation Neutron Source Site Results. In 2017 sampling at the SNS site occurred during each quarter. Low concentrations of several radionuclides were detected numerous times during 2017. Table 5.22 provides a summary of the locations for radionuclide detections observed during 2017.

Oak Ridge Reservation Annual Site Environmental Report—2017
Oak Ridge National Laboratory 5-92
Table 5.22. Radiological concentrations detected in samples collected at the Spallation Neutron Source during 2017
Parameter Concentrationsa (pCi/L) Reference
Standardb March May August November
SW-1 ndc 214Bi 20.4 10,400 214Pb 16.4 8,000 Tritium 2690 1890 3440 2760 20,000
S-1
ndc Beta 6.52 50 Tritium 2340 901 1600 968 20,000
S-2
ndd Tritium 1080 625 1320 1680 20,000
S-3 ndc 214Bi 18.9 10,400 Tritium 986 603 302 323 20,000
S-4
ndd Tritium 1100 646 274 535 20,000
S-5
ndc ndc Alpha 19.6 15 Beta 22 50 Tritium 361 366 389 279 20,000
SP-1
Tritium 314 314 U81.7 U231 20,000 a ND: not detected. “U” means that the analyte was analyzed for but not detected above the PQL/CRDL.
b Current federal drinking water standards and/or Tennessee WQCs for radiological contaminants were used as reference standards. If no federal or state standard exists for a particular radionuclide, 4% of the DCS for a radionuclide is used.
c Only some of the parameters of the expanded suite (gross alpha and gross beta activity, 14C, and gamma emitters) for this location/quarter were detected, and they are listed with their results.
d None of the parameters of the expanded suite (gross alpha and gross beta activity, 14C, and gamma emitters) for this location/quarter were detected.

Oak Ridge Reservation Annual Site Environmental Report—2017
Oak Ridge National Laboratory 5-93
Sampling results were compared against reference standards. Reference standards used for comparison are either 4% of the DOE O 458.1 DCSs or the National Primary Drinking Water Standards (40 CRF 141). Gross alpha activity was detected in S-5 at a concentration exceeding its reference standard of 15 pCi/L during the third-quarter sampling event. However, Additional analysis was not done to identify the alpha activity because uranium isotopes were detected in samples collected from S-5 in 2013 and 2016. The source of these radionuclides is most likely the S-3 Ponds at Y-12. The S-3 Ponds are located up-gradient of S-5 and are interconnected via karst features to S-5. No other radionuclide exceeded its reference standard at SNS monitoring locations in 2017.
5.7 Quality Assurance Program The UT-Battelle Quality Management System (QMS) has been developed to implement the requirements defined in DOE O 414.1D (DOE 2011c). The methods used for successful implementation of the QMS rely on the integration and implementation of quality elements/criteria flowed-down through multiple management systems and daily operating processes. These management systems and processes are described in SBMS, where basic requirements are communicated to UT-Battelle staff. Additional or specific customer requirements are addressed at the project or work activity level. The QMS provides a graded approach to implementation based upon risk. The application of quality assurance (QA) and quality control (QC) programs specifically focused on environmental monitoring activities on ORR is essential for generating data of known and defensible quality. Each aspect of an environmental monitoring program from sample collection to data management and record keeping must address and meet applicable quality standards. The activities associated with administration, sampling, data management, and reporting for ORNL environmental programs are performed by the UT-Battelle Environmental Protection Services Division (EPSD).
UT-Battelle uses SBMS to provide a systematic approach for integrating QA, environmental, and safety considerations into every aspect of environmental monitoring at ORNL. SBMS is a web-based system that provides a single point of access to all the requirements for staff to safely and effectively perform work. SBMS translates laws, orders, directives, policies, and best-management practices into laboratory-wide subject areas and procedures.
5.7.1 Work/Project Planning and Control
UT-Battelle’s work/project planning and control directives establish the processes and requirements for executing work activities at ORNL. All environmental sampling tasks are performed following the four steps required in the work control subject areas:
• define scope of work; • perform work planning—analyze hazards and define controls; • execute work; and • provide feedback.
In addition, EPSD has approved project-specific standard operating procedures for all activities controlled and maintained through the Integrated Document Management System (IDMS).
Environmental sampling standard operating procedures developed for UT-Battelle environmental sampling programs provide detailed instructions on maintaining chain of custody; sample identification; sample collection and handling; sample preservation; equipment decontamination; and collection of QC samples such as field and trip blanks, duplicates, and equipment rinses.

Oak Ridge Reservation Annual Site Environmental Report—2017
Oak Ridge National Laboratory 5-94
5.7.2 Personnel Training and Qualifications
The UT-Battelle Training and Qualification Management System provides employees and nonemployee staff of UT-Battelle with the knowledge and skills necessary to perform their jobs safely, effectively, and efficiently with minimal supervision. This capability is accomplished by establishing site-level procedures and guidance for training program implementation with an infrastructure of supporting systems, services, and processes.
Likewise, the NWSol Training and Qualification program provides employees with the knowledge and skills necessary to perform their jobs safely, effectively, and efficiently with minimal supervision. This capability is accomplished by establishing site-level procedures and guidance for training program implementation with an infrastructure of supporting systems, services, and processes.
5.7.3 Equipment and Instrumentation
5.7.3.1 Calibration The UT-Battelle QMS includes subject area directives that require all UT-Battelle staff to use equipment of known accuracy based on appropriate calibration requirements that are traceable to an authority standard. The UT-Battelle Facilities and Operations Instrumentation and Control Services team tracks all equipment used in the environmental monitoring programs conducted by UT-Battelle for the ORNL site and ORR through a maintenance recall program to ensure that equipment is functioning properly and within defined tolerance ranges. The determination of calibration schedules and frequencies is based on a graded approach at the activity planning level. EPSD environmental monitoring programs follow rigorous calibration schedules to eliminate gross drift and the need for data adjustments. Instrument tolerances, functions, ranges, and calibration frequencies are established based on manufacturer specifications, program requirements, actual operating environment and conditions, and budget considerations.
In addition, a continuous monitor used for CAA compliance monitoring at ORNL boiler 6 is subject to rigorous QA protocols as specified by EPA methods. A relative accuracy test audit (RATA) is performed annually to certify the Predictive Emissions Monitoring System (PEMS) for nitrogen oxides and oxygen. The purpose of a RATA is to provide a rigorous QA assessment in accordance with EPA 40 CFR, Performance Specification 16 (PS-16). The accuracy of PEMS is also evaluated by performing relative accuracy audits in accordance with PS-16. The results of these QA tests are provided to TDEC quarterly, semiannually, or annually as applicable.
5.7.3.2 Standardization The UT-Battelle IDMS provides the necessary functionality and controls to ensure that controlled documents are managed, distributed, revised, and maintained in accordance with ORNL document control requirements. EPSD sampling procedures are maintained in IDMS and include requirements and instructions for the proper standardization and use of monitoring equipment. Requirements include the use of traceable standards and measurements; performance of routine, before-use equipment standardizations; and actions to follow when standardization steps do not produce required values. Standard operating procedures for sampling also include instructions for designating nonconforming instruments as “out-of-service” and initiating requests for maintenance.
5.7.3.3 Visual Inspection, Housekeeping, and Grounds Maintenance EPSD environmental sampling personnel conduct routine visual inspections of all sampling instrumentation and sampling locations. These inspections identify and address any safety, grounds keeping, general maintenance, and housekeeping issues or needs.
Oak Ridge Reservation Annual Site Environmental Report—2017
Oak Ridge National Laboratory 5-95
5.7.4 Assessment
Independent audits, surveillance, and internal management assessments are performed to verify that requirements have been accurately specified and that activities that have been performed conform to expectations and requirements. External assessments are scheduled based on requests from auditing agencies. Table 5.1 presents a list of environmental audits and assessments performed at ORNL in 2017 and information on the number of findings identified, if any. EPSD also conducts internal management assessments of UT-Battelle environmental monitoring procedural compliance, safety performance, and work planning and control. Surveillance results, recommendations, and completion of corrective actions, if required, are also documented and tracked in the UT-Battelle Assessment and Commitment Tracking System.
NWSol and Isotek perform independent audits, surveillances, and internal management assessments to verify that requirements have been accurately specified and that activities that have been performed conform to expectations and requirements. NWSol corrective actions, if required, are documented and tracked in an issues management database or a deficiency reporting database, and Isotek corrective actions are tracked in its Assessment and Commitment Tracking System.
5.7.5 Analytical Quality Assurance
The contract laboratories that perform analyses of environmental samples from the UT-Battelle environmental monitoring programs at ORNL and on ORR are required to have documented QA/QC programs, trained and qualified staff, appropriately maintained equipment and facilities, and applicable certifications. Several laboratories are contracted under basic ordering agreements to perform analytical work to characterize UT-Battelle environmental samples. As applicable, the laboratories participate in accreditation, certification, and performance evaluation programs, including the National Environmental Laboratory Accreditation Program, Mixed Analyte Performance Evaluation Program, Discharge Monitoring Report Quality Assurance Study, and DOE Environmental Management Consolidated Audit Program. Any issues of concern identified through accreditation/certification programs or performance evaluation testing are addressed with analytical laboratories and are considered when determinations are made on data integrity.
A statement of work for each project specifies any additional QA/QC requirements and includes detailed information on data deliverables, turnaround times, and required methods and detection limits. Blank and duplicate samples are routinely submitted along with ORR environmental samples to provide an additional check on analytical laboratory performance.
5.7.6 Data Management and Reporting
Management of data collected by UT-Battelle in conjunction with ORR and ORNL environmental surveillance programs and with CWA activities at ORNL is accomplished using the Environmental Surveillance System (ESS), a web interface data management tool. A software QA plan for ESS has been developed to document ESS user access rules; verification and validation methods; configuration and change management rules; release history; software registration information; and the employed methods, standards, practices, and tools.
Field measurements and sample information are entered into ESS, and an independent verification is performed on all records to ensure accurate data entry. Sample results and associated information are loaded into ESS from electronic files provided by analytical laboratories. An automated screening is performed to ensure that all required analyses were performed, appropriate analytical methods were used, holding times were met, and specified detection levels were achieved.

Oak Ridge Reservation Annual Site Environmental Report—2017
Oak Ridge National Laboratory 5-96
Following the screening, a series of checks is performed to determine whether results are consistent with expected outcomes and historical data. QC sample results (i.e., blanks and duplicates) are reviewed to check for potential sample contamination and to confirm repeatability of analytical methods within required limits. More in-depth investigations are conducted to explain results that are questionable or problematic.
ORNL radiological airborne effluent monitoring data are managed using the Rad-NESHAPs Inventory Web Application and the Rad NESHAPs Source Data Application. Field measurements, analytical data inputs, and emission calculations results are independently verified.
5.7.7 Records Management
The UT-Battelle Records Management System provides the requirements for managing all UT-Battelle records. Requirements include creating and identifying record material; scheduling, protecting, and storing records in office areas and in the UT-Battelle Inactive Records Center; and destroying records.
NWSol and Isotek maintain all records specific to their projects at ORNL, and associated records management programs include the requirements for creating and identifying record material, protecting and storing records in applicable areas, and destroying records.
5.8 Environmental Management and Waste Management Activities at Oak Ridge National Laboratory
The three campuses on ORR have a rich history of research, innovation, and scientific discovery that shaped the course of the world. Unfortunately, today, despite their vitally important missions, they are hindered by environmental legacies remaining from past operations. The contaminated portions of ORR are on the EPA NPL, which includes hazardous waste sites across the nation that are to be cleaned up under CERCLA. Areas that require cleanup or further action on ORR have been clearly defined, and OREM is working to clean those areas under the Federal Facility Agreement with the EPA and TDEC. The 2017 Cleanup Progress Annual Report to the Oak Ridge Regional Community (UCOR 2017) provides detailed information on DOE OREM’s 2017 cleanup activities.
5.8.1 Oak Ridge National Laboratory Wastewater Treatment
At ORNL, DOE OREM operates PWTC and the Liquid Low-Level Waste Treatment Facility. In 2017 368 million L of wastewater was treated and released at PWTC. In addition, the liquid LLW evaporator at ORNL treated 162,680 L of waste. The waste treatment activities of these facilities support both DOE OREM and DOE SC mission activities, ensuring that wastewaters from activities associated with projects of both offices are managed in a safe and compliant manner.
5.8.2 Oak Ridge National Laboratory Newly Generated Waste Management
ORNL is the largest, most diverse DOE SC laboratory in the DOE complex. Although much effort is expended to prevent pollution and to eliminate waste generation, some waste streams are generated as a by-product of performing research and operational activities and must be managed to ensure that the environment is protected from associated hazards. UT-Battelle, as the prime contractor for the management of ORNL, is responsible for management of most of the wastes generated from R&D activities and wastes generated from operation of the R&D facilities. TRU wastes and waste streams that can be treated by on-site liquid and/or gaseous waste treatment facilities operated by OREM are treated via these systems. Other R&D waste streams are generally packaged by UT-Battelle in appropriate

Oak Ridge Reservation Annual Site Environmental Report—2017
Oak Ridge National Laboratory 5-97
shipping containers for off-site transport to commercial waste-processing facilities. In 2017, ORNL performed 89 waste shipments to off-site hazardous/radiological/mixed waste treatment and/or disposal vendors with no shipment rejections or violations.
5.8.3 Transuranic Waste Processing Center
TRU waste-processing activities carried out for DOE in 2017 by NWSol addressed CH solids/debris and RH solids/debris, which involved processing, treating, and repackaging of waste. Off-site transportation and disposal of LLW at the Nevada National Security Site or other approved off-site facilities was also performed in 2017. TRU waste disposal at the Waste Isolation Pilot Plant resumed in 2017. TWPC made 17 CH TRU waste shipments in calendar year 2017 for a total of 459 containers or 96.4 m3.
During 2017, 28.23 m3 of CH waste and 57.52 m3 of RH waste were processed, and 60.27 m3 of mixed LLW (TRU waste that was recharacterized as low-level waste) was shipped off the site.
5.9 References ANSI. 1969. Guide to Sampling Airborne Radioactive Materials in Nuclear Facilities. ANSI N13.1-
1969R. American National Standards Institute, Washington, DC.
ANSI. 1999. Sampling and Monitoring Releases of Airborne Radioactive Substances from the Stacks and Ducts of Nuclear Facilities. ANSI/HPS N13.1-1999. American National Standards Institute, Health Physics Society, New York, New York.
Bonine, T. M., R. H. Ketelle, and S. M. Trotter. 2007. Operational Groundwater Monitoring Plan for the Spallation Neutron Source Site. SNS 102040000-ES0001-R01, ORNL/TM-2004/118. Oak Ridge National Laboratory, Oak Ridge, Tennessee.
Bonine, T. M. 2012. UT-Battelle Sampling and Analysis Plan for Surveillance Monitoring of Exit Pathway Groundwater at Oak Ridge National Laboratory. Oak Ridge National Laboratory, Oak Ridge, Tennessee.
BJC. 2009. Integrated Safety Management System Description, BJC-GM-1400/R12. Bechtel Jacobs, Inc., LLC, Oak Ridge, Tennessee.
CEQ. 2016. Guiding Principles for Sustainable Federal Buildings and Associated Instructions. Council on Environmental Quality, Washington, DC. 2016. (https://www.sustainability.gov/pdfs/guiding_principles_for_sustainable_federal_buildings.pdf)
DOE. 2000. Record of Decision for Interim Actions for the Melton Valley Watershed at the Oak Ridge National Laboratory, Oak Ridge, Tennessee, DOE/OR/01-1826&D3. US Department of Energy, Washington, DC.
DOE. 2002. Record of Decision for Interim Actions in Bethel Valley Watershed, Oak Ridge, Tennessee, DOE/OR/01-1862&D4.
DOE. 2008. Departmental Energy, Renewable Energy, and Transportation Management, DOE O 430.2B. Approved February 27, 2008. US Department of Energy, Washington, DC. https://www.directives.doe.gov/directives-documents/400-series/0430.2-BOrder-b (Accessed June 7, 2018)
DOE. 2008a. Environmental Protection Program, DOE O 450.1A. Approved 6-4-08. US Department of Energy, Washington, DC.
DOE. 2011. Departmental Sustainability, DOE O 436.1. Approved 5-2-11. US Department of Energy, Washington, DC.

Oak Ridge Reservation Annual Site Environmental Report—2017
Oak Ridge National Laboratory 5-98
DOE. 2011a. Derived Concentration Technical Standard. DOE-STD-1196-2011. US Department of Energy, Washington, DC. April 2011. (https://www.standards.doe.gov/standards-documents/1100/1196-astd-2011/@@images/file )
DOE. 2011b. Final Draft U-233 Alternatives Analysis, Phase I Report: Screening of Alternative Disposition Approaches. US Department of Energy, Washington, DC.
DOE. 2011c. Radiation Protection of the Public and the Environment, DOE O 458.1, Approved February 11, 2011; Change 2 approved June 6, 2011. US Department of Energy, Washington, DC.
DOE. 2011d. Quality Assurance, DOE O 414.1D, Approved April 25, 2011. US Department of Energy, Washington, DC.
DOE. 2012. Phased Construction Completion Report for the Bethel Valley Burial Grounds at the Oak Ridge National Laboratory, Oak Ridge, Tennessee. DOE/OR/01-2533&D2. URS | CH2M Oak Ridge, LLC, Oak Ridge, Tennessee.
DOE. 2014. Federal Facility Agreement for the Oak Ridge Reservation. FFA-PM/14-008, DOE/OR- 1014. US Department of Energy, Office of Environmental Management, Oak Ridge, Tennessee; available online at http://www.ucor.com/ettp_ffa.html.
DOE. 2017. Oak Ridge Reservation Annual Site Environmental Report for 2016. DOE/ORO-251. US Department of Energy, Oak Ridge, Tennessee; available online at https://doeic.science.energy.gov/ASER/aser2016/index.html
DOE. 2017a. Oak Ridge National Laboratory FY 2018 Site Sustainability Plan with FY 2017 Performance Data. US Department of Energy Sustainability Performance Office, Washington, DC. https://www.ornl.gov/sustainable-ornl/site-sustainabilty-plans Accessed 6/5/2018.
DOE. 2018. 2018 Remediation Effectiveness Report for the U.S. Department of Energy Oak Ridge Site, Oak Ridge, Tennessee; Data and Evaluations. DOE/OR/01-2757&D1. Prepared by the Water Resources Restoration Program, URS | CH2M Oak Ridge LLC for the US Department of Energy Office of Environmental Management, Oak Ridge, Tennessee.
EISA. 2007. Energy Independence and Security Act of 2007.
Executive Order (EO) 13693, “Planning for Federal Sustainability in the Next Decade,” March 25, 2015.
EPA. 2000. Stressor Identification Guidance Document. EPA-822-B-00-025. US Environmental Protection Agency, Office of Water, Washington, DC.
EPA. 2010. 40 CFR Part 60, Appendix A-1, Method 2 “Method 2—Determination of Stack Gas Velocity and Volumetric Flow Rate (Type S Pitot Tube).”
EPA. 2016. “Criteria Air Pollutants.” US Environmental Protection Agency. https://www.epa.gov/criteria-air-pollutants. July 21, 2016.
ISO. 2004. Environmental Management Systems—Requirements with Guidance for Use. ISO 14001:2004. International Organization for Standardization; available online at http://www.iso.org.
ISO. 2015. Environmental Management Systems—Requirements with Guidance for Use. ISO 14001:2015. International Organization for Standardization; available online at http://www.iso.org.
NRC. 2000. Multi-Agency Radiation Survey and Site Investigation Manual (MARSSIM), NUREG-1575, Rev. 1/EPA 402-R-97-016, Rev. 1/DOE/EH-0624, Rev. 1. US Nuclear Regulatory Commission, Environmental Protection Agency, Department of Defense, and Department of Energy, Washington, DC.

Oak Ridge Reservation Annual Site Environmental Report—2017
Oak Ridge National Laboratory 5-99
NRC. 2009. Multi-Agency Radiation Survey and Assessment of Materials and Equipment Manual (MARSAME), NUREG-1575, Supplement 1/EPA 402-R-09-001/DOE/HS-0004. US Nuclear Regulatory Commission, Environmental Protection Agency, Department of Defense, and Department of Energy, Washington, DC.
NWSol. 2015. Regulatory Management Plan CM-A-EN-006 (site manual). December 9, 2015.
ORNL. 2017. Enabling a Mobile Workforce: How to Implement Effective Teleworking at U.S. Department of Energy National Laboratories—A Guidebook and Toolkit. ORNL/TM-2017/257. Oak Ridge National Laboratory, Oak Ridge, Tennessee. (https://powerpedia.energy.gov/w/images/9/9f/Telework_Report_FINAL_May_18_2017_ORNL.pdf)
ORNL. 2017a. Oak Ridge National Laboratory Annual Sustainability Report. Oak Ridge National Laboratory, Oak Ridge, Tennessee.
Pelletier, Raymond F. 1995. “Application of DOE 5400.5 Requirements for Release and Control of Property Containing Residual Radioactive Material,” correspondence to distribution. US Department of Energy, Office of Environmental Policy and Assistance, Washington, DC. (Note: An abbreviated version minus some of the attachments appears on the web at http://homer.ornl.gov/sesa/environment/guidance/aea/release.pdf.)
Souza, Peter A., Glyn D. DuVall, and Melisa J. Hart. 2001. Cultural Resource Management Plan, DOE Oak Ridge Reservation, Anderson and Roane Counties, Tennessee. DOE/ORO/2085. US Department of Energy, Washington, DC.
TDEC. 2012. Tennessee Regulations for Public Water Systems and Drinking Water Quality, Chap. 0400- 45-01. Tennessee Department of Environment and Conservation, Bureau of Environment, Division of Water Supply (http://share.tn.gov/sos/rules/0400/0400-45/0400-45-01.20160605.pdf).
TDEC. 2015. Rules of the Tennessee Department of Environment and Conservation. Chapter 04000-40-03: General Water Quality Criteria. (http://sharetngov.tnsosfiles.com/sos/rules/0400/0400-40/0400-40.htm).
UCOR. 2017. 2017 Cleanup Progress: Annual Report to the Oak Ridge Regional Community. OREM-17- 2530. URS | CH2M Oak Ridge LLC, Oak Ridge, Tennessee. (http://www.ucor.com/_docs/CleanProg.pdf)