5 october 2021 - solidarity.sgp1.cdn.digitaloceanspaces.com
TRANSCRIPT

1
5 October 2021
Dear Partners: Our quarterly notes are intended to share our thought process and explain actions taken over the last quarter. In this letter we
1. Share an update on performance P 2 2. Provide rationale on why we are cautious on incremental deployment at present P 3 3. Share rationale on exit decisions taken recently P 7 4. Share investment thesis on ITC P 10 5. Provide answers to some questions we have been asked recently including P 12
why we hold an over-weight position in Bharti Airtel Key messages
• Performance remains healthy. On a rolling 5-year basis, our preferred measure, our aggregate performance across all accounts is 24.8% post fees vs 15.3% for NSE 500, well above our 3% outperformance target.
• Challenging set up for long- term investing with high optimism for growth already reflecting in prices and markets ignoring risks of very high inflation. The breadth of opportunities we see, at present prices, is narrow.
• We are cautious and deploying capital very selectively. We are staggering draw down of capital from new partners and/or prepared to hold cash.
• We have been trimming/exiting positions where we see valuation excesses (Sequent, SRF). We have trimmed weight in Small caps which became significantly over-weight due to performance and exposed us to liquidity risk (Privi Spec Chem) and re-invested the proceeds.
• We increased our position size significantly in Bharti Airtel as the sector is entering a period of stable competitive dynamics, tariff increases and regulatory support.
• We have taken an initial position in ITC as part of our “Special Situations” bucket. Important Disclosures
• We construct customised portfolios based on valuations at point of entry and cash available for deployment. Hence, all positions may not be held in your account.
• Performance in individual accounts may vary from aggregate performance due to the above.
• We disclose position names for transparency and context. We reserve the right to change our minds and may not be able to inform you if we do.

2
Performance update
Since inception
• We have registered 25.4% per annum Time Weighted Rate of Return or TWRR1 post fees for our anchor partner since inception (~ 7.5 years) which is 10.2% per annum post fees over NSE 500.
Rolling 5-year basis, our recommended time horizon
• Aggregate performance is TWRR per annum of 24.8% which is 9.5% per annum post fees over NSE 500.
• This implies absolute returns of ~49% over an Index fund.
1 TWRR is the SEBI mandated approach for reporting returns. Read more about TWRR and how it is calculated at https://www.investopedia.com/terms/t/time-weightedror.asp
Anchor partner
Performance (in TWRR) 1 Year 2 Year 3 Year 5 Year Since Inception
SOLIDARITY 64.0% 38.6% 36.6% 22.8% 25.4%
NIFTY 56.6% 23.9% 17.2% 15.4% 13.9%
NIFTY500 61.1% 26.9% 18.2% 15.3% 15.2%
Aggregate across all accounts
Performance (in TWRR) 1 Year 2 Year 3 Year 5 Year Since Inception
SOLIDARITY 72.8% 44.3% 40.0% 24.8% 25.3%
NIFTY 56.6% 23.9% 17.2% 15.4% 16.1%
NIFTY500 61.1% 26.9% 18.2% 15.3% 16.5%
Data as of 30 Sep 2021
We operated with an Investment Advisory license till 11 May 2016 post which we migrated to a PMS License
Solidarity performance is net of all fees & expenses
As of 30 Sep 2021
3
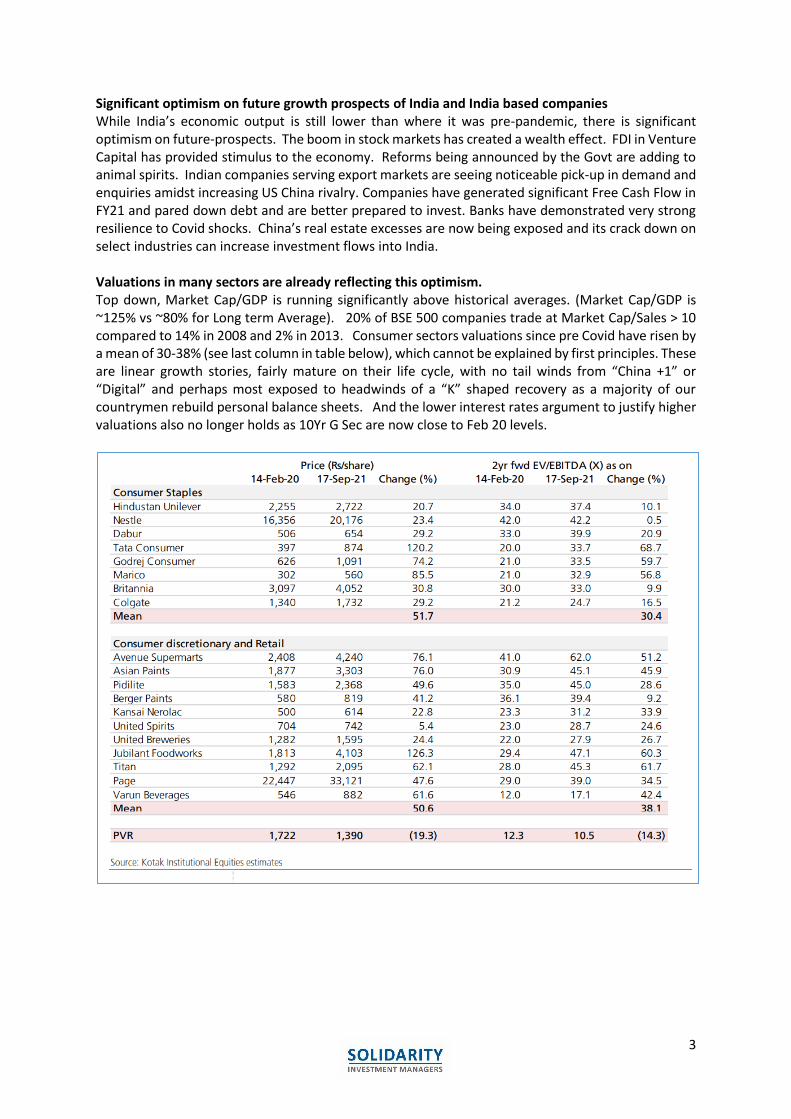
Significant optimism on future growth prospects of India and India based companies While India’s economic output is still lower than where it was pre-pandemic, there is significant optimism on future-prospects. The boom in stock markets has created a wealth effect. FDI in Venture Capital has provided stimulus to the economy. Reforms being announced by the Govt are adding to animal spirits. Indian companies serving export markets are seeing noticeable pick-up in demand and enquiries amidst increasing US China rivalry. Companies have generated significant Free Cash Flow in FY21 and pared down debt and are better prepared to invest. Banks have demonstrated very strong resilience to Covid shocks. China’s real estate excesses are now being exposed and its crack down on select industries can increase investment flows into India. Valuations in many sectors are already reflecting this optimism. Top down, Market Cap/GDP is running significantly above historical averages. (Market Cap/GDP is ~125% vs ~80% for Long term Average). 20% of BSE 500 companies trade at Market Cap/Sales > 10 compared to 14% in 2008 and 2% in 2013. Consumer sectors valuations since pre Covid have risen by a mean of 30-38% (see last column in table below), which cannot be explained by first principles. These are linear growth stories, fairly mature on their life cycle, with no tail winds from “China +1” or “Digital” and perhaps most exposed to headwinds of a “K” shaped recovery as a majority of our countrymen rebuild personal balance sheets. And the lower interest rates argument to justify higher valuations also no longer holds as 10Yr G Sec are now close to Feb 20 levels.

4
Valuations in Chemicals have rerated dramatically in the past year as companies benefit from tail winds of de-risking from China. We too are believers in this theme. The key question that one must answer is “what optimism on growth rates is embedded in current stock prices?” By changing terminal value assumptions and Cost of Equity assumptions, any value can be justified.
Valuations in Private Banks are reasonable vs historical averages; however, they have medium term threats to ROE which should result in lower multiples over time2. Risks of very high inflation are being overlooked Central Banks are keeping liquidity conditions easy and interest rates low to stimulate employment. Smart minds are deeply divided whether money printing and need to ensure full employment will lead to significant inflation down the road or we are in a low inflation world due to the impact of technology trends and demographics. A steep rise in inflation will necessitate a sharp rise in interest rates which would be negative for Equities. Some central Banks have already started raising interest rates (Norway, Brazil, South Korea). The US Fed has also signalled that interest rates may increase sooner.
2 Read our blog at Will technology firms take value away from private banks

5
Our base case scenario is we are in a mediocre return world as valuations will mean revert; however, market momentum in the short term could continue A simple equation to gauge future returns is [EPS growth * Change in Valuation Multiple + Dividends]. Over the long-term stock prices are slaves to earnings. They keep climbing higher as the time element of earnings compounding dominates returns. However, over shorter time periods, valuations matter more. Our hypothesis is that multiples are climbing on the back of flows as investors have poor return options in Debt. This can be seen in the speculative activity in IPOs, behaviour in Venture Capital. Even events like the collapse of Evergrande have not impacted markets trajectory. The “risk on” sentiment can continue for longer in the short term as momentum feeds on itself. However, given very high entry valuations at present almost across the board, multiple decline will be a head win to returns in the medium term. High entry multiples need not imply markets will crash. Just that we have borrowed returns from the future. Equities should still meaningfully outperform Bonds over the next 5 years. However, one should be reasonable on return expectations and not be too aggressive or too conservative.
But do valuation multiples really matter for well-run companies with longevity of growth? Buying growth at any price defies first principles-based thinking. You would not pay any price for a house you would like to own and live in. Why would you do that to buy a minority stake in someone else’s house? Mean reversion of multiples is a truism in investing. Which implies that the higher entry prices you pay, lower the future returns. This is simple Mathematics. Over the last few years, a decline in interest rates has resulted in multiple expansion. Some of this is justified due to longevity as the market recognizes and corrects errors in valuing duration. However, the vast majority of these companies are ripe for mean reversion which has got delayed because of easy liquidity. Companies at the more mature stage of their life cycle are most at risk.

6
We are cautious, not bearish While we do see some opportunities, the breadth is narrow. Our stance:
• We will participate where we see value, but not “buy at any price”.
• Prepared to act big when opportunity knocks (for example we took a big position in Bharti).
• At the margin take more concentration risk.
• Be willing to experiment more with “Special Situations” (for example, ITC).
• Will take money off the table when valuations are euphoric to re-allocate, especially in Small Caps where liquidity can evaporate quickly.
This stance is reflected in our actions
• Recently joined partners: we are not fully invested and are drawing down capital in a staggered manner and/or are holding onto cash.
• Existing partners: exited/trimmed positions where the risk/reward is now going out of favour if we can rotate capital into better return opportunities.
Where could we be wrong
• Sharp decline in interest rates in India that can justify higher multiples.
• Structural change in retail behaviour where financial savings increases manifold and hence higher flows support market levels.
• We miss the longevity and optionality embedded in certain business models and hence don’t recognize the premiums they deserve.
We avoid rigid ideology. We will change our minds if new facts require us to do so. Key Actions take in the last quarter
• Complete Exits: Sequent Scientific, SRF.
• Significant increase in allocations: Bharti Airtel.
• New positions: ITC, Solara Active Pharma Sciences.

7
Exit decisions: Context matters A key choice we need to make is whether to trim on valuation excesses or to let positions compound earnings and accept incremental underperformance in the medium term due to valuation de rating. Essentially
• Are we permanent owners of businesses?
• Are we allocators of Capital amongst companies we may want to own permanently?
As we intend to own 15-20 positions and act with rolling 5-year time horizons, we see ourselves as allocators of capital and not permanent owners of businesses. We believe markets have emotions that vary from depression to euphoria. We act to reduce risk when we encounter significant greed. “The riskiest moment is when you're right. That's when you're in the most trouble, because you tend to overstay the good decisions” – Peter Bernstein
We believe individual sectors and companies follow a “Behavioural Cycle” (see chart below).
• As a sector comes in favour, rising stock prices create more demand pushing prices higher. A consensus view on prospects inevitably leads to Euphoria as analysts start building higher growth rates and dropping Cost of Capital assumptions to justify current prices. The euphoric trend can sustain for quite some time. Hence, one runs the risk of exiting early.
• However, when there is an Earnings surprise vs very high expectations, the trend reverses when supply overwhelms demand leading to steep time or price corrections.
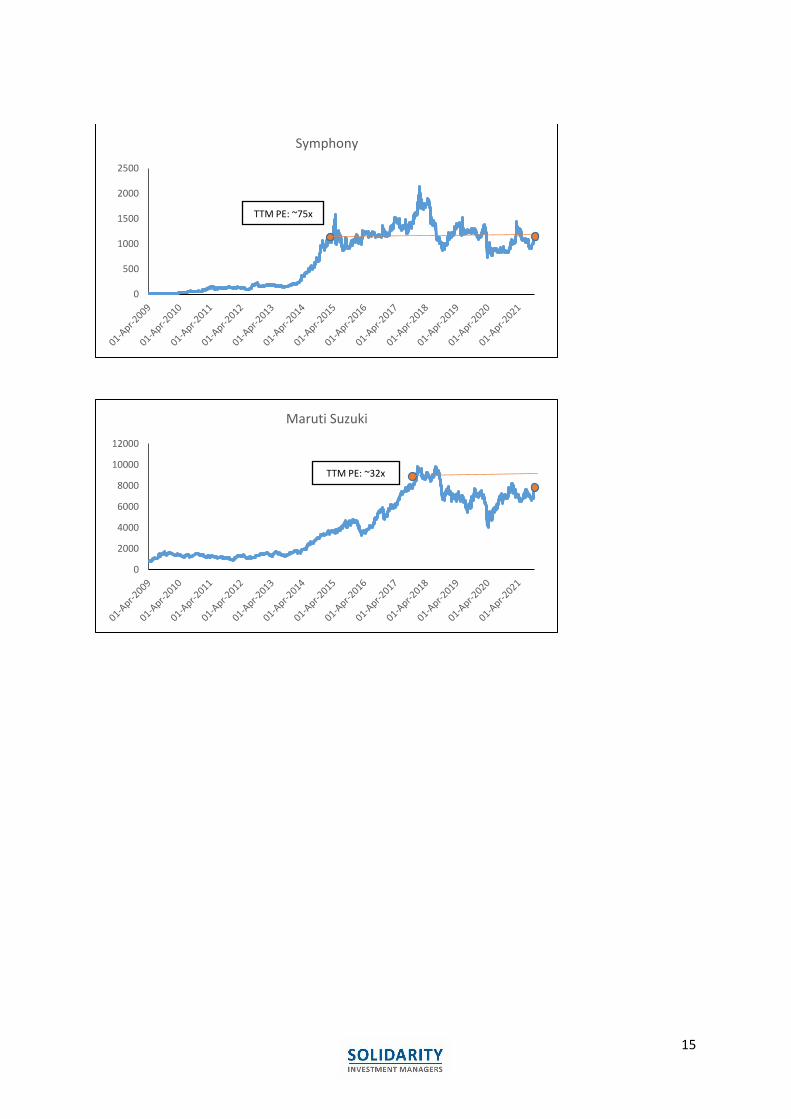
• Hence, as prices keep climbing away from fair value, the investment risk on the position keeps increasing, even due to factors beyond a company’s control. The behavioural cycle has played out in many blue chip companies in the last few years (Blue Dart, Eicher, Page, Symphony, Maruti). Charts shared in Appendix.
Our approach therefore is to have the bulk of the portfolio in “Early believer” or “Consensus” phase where one has a higher probability of benefitting from both Earnings growth and multiple expansion and start exiting gradually when valuations become “Euphoric”. Partners may observe we are gradually slicing out of our Specialty Chemical exposure to allocate to other themes. This approach means you don’t maximize returns on any one position, but achieve meaningful compounding on the portfolio with better risk management.
Despair
Mass Euphoria
Wide adoption
Early Believers
Collapse
Earnings growth supported by rise in multiple … consensus buy
Multiple rise inexplicably … as Demand chases limited supply
Strong narrative … but not well understood
Time correction
Trim/Exit
Re allocate
The Behavioural Cycle
8
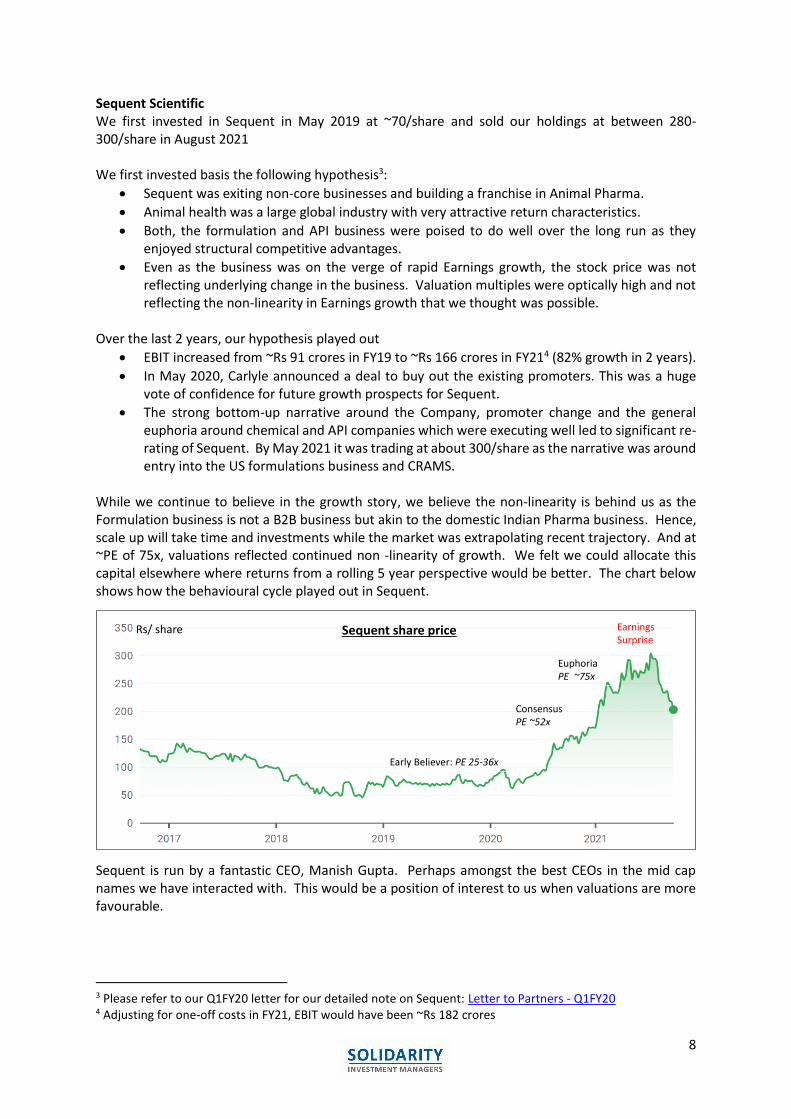
Sequent Scientific We first invested in Sequent in May 2019 at ~70/share and sold our holdings at between 280-300/share in August 2021 We first invested basis the following hypothesis3:
• Sequent was exiting non-core businesses and building a franchise in Animal Pharma.
• Animal health was a large global industry with very attractive return characteristics.
• Both, the formulation and API business were poised to do well over the long run as they enjoyed structural competitive advantages.
• Even as the business was on the verge of rapid Earnings growth, the stock price was not reflecting underlying change in the business. Valuation multiples were optically high and not reflecting the non-linearity in Earnings growth that we thought was possible.
Over the last 2 years, our hypothesis played out
• EBIT increased from ~Rs 91 crores in FY19 to ~Rs 166 crores in FY214 (82% growth in 2 years).
• In May 2020, Carlyle announced a deal to buy out the existing promoters. This was a huge vote of confidence for future growth prospects for Sequent.
• The strong bottom-up narrative around the Company, promoter change and the general euphoria around chemical and API companies which were executing well led to significant re-rating of Sequent. By May 2021 it was trading at about 300/share as the narrative was around entry into the US formulations business and CRAMS.
While we continue to believe in the growth story, we believe the non-linearity is behind us as the Formulation business is not a B2B business but akin to the domestic Indian Pharma business. Hence, scale up will take time and investments while the market was extrapolating recent trajectory. And at ~PE of 75x, valuations reflected continued non -linearity of growth. We felt we could allocate this capital elsewhere where returns from a rolling 5 year perspective would be better. The chart below shows how the behavioural cycle played out in Sequent.
Sequent is run by a fantastic CEO, Manish Gupta. Perhaps amongst the best CEOs in the mid cap names we have interacted with. This would be a position of interest to us when valuations are more favourable.
3 Please refer to our Q1FY20 letter for our detailed note on Sequent: Letter to Partners - Q1FY20 4 Adjusting for one-off costs in FY21, EBIT would have been ~Rs 182 crores
Early Believer: PE 25-36x
ConsensusPE ~52x
EuphoriaPE ~75x
Earnings Surprise
Sequent share priceRs/ share

9
SRF We recently sold our SRF position. Our first purchase in SRF was 1350/share in March 2017. Our last purchase was ~6000/share in April 2021. We sold our last holdings at between 10500-11200/share. SRF is a Clear Leader with its business thesis still intact. They are dominant in all their business lines and their Fluorochemical and refrigerants business will benefit immensely as supply chains de-risk from China. The link to our detailed note on SRF published with our Q4 FY 19 letter is appended5. However, there is now excessive euphoria in the price which can make a great business a poor investment over our time horizons (rolling 5 years). We believe we can allocate capital to an equally attractive business for better returns. Well run companies in sectors with strong industry tailwinds can positively surprise on growth and also have significant Optionality as they can extend competencies to new verticals. One therefore cannot be excessively mathematical on valuations. However, one needs to be wary of this argument slipping into the domain that valuations do not matter. That would defy first principles-based thinking.
SRFs Technical Textiles business is run for cash flow. That implies say a ~12-15x PAT multiple. The Packaging Film business has growth and leadership but its margins depend on demand-supply gaps in the market. The current high margins cannot sustain indefinitely. That implies say a ~20x PAT Multiple. That means the Core Chemical business, which is the real prize, is being valued at ~110x trailing PAT6. Trailing PEs can be misleading when companies have prospects of non-linear growth and/or have significant Option value. Even if we consider a longer time horizon, a reverse DCF suggests PAT growth for the Chemical business should be ~20-25% CAGR over next 2 decades at 25% ROE to justify these valuations. (7-8% Terminal value and 12% Cost of Equity). These valuations imply near perfect execution and leave no margin of safety for any shocks from circumstances beyond a company’s control.
What we are witnessing at present is euphoria for the entire Specialty Chemical sector as a strong growth narrative is making participants ignore valuations. Consider the evidence from a behavioural perspective. SRFs current price is ~2.5x price at which they raised QIP money in Oct 2020. SRF promoters think long term. They invested their earnings from Carbon Credits in early 2000s in research capabilities which explain their dominance in Fluoro Chemicals today. They also continue to invest in Capacity well ahead of demand. SRF remains a company of interest and we will continue to track it for a better entry price point.
Why not ride momentum? We don’t have the competency to time the “Cinderella moment” and its best to act when one finds opportunity to re-allocate capital and liquidity is on your side.
5 Letter to Partners – Q4FY19 6 Implied valuations for the chemical business is based on Solidarity assumptions for SRF individual business segments (Chemical, Packaging films, technical textiles and others)
10
ITC
ITC has multiple business lines.
• A low earnings growth tobacco business where it is the undisputed leader (75% market share) and which throws out ~ 9500 Cr of Free Cash flow a year.
• A ~ 15000 Cr FMCG business with many marquee brands, that is seeding new categories and therefore is still not at peak margins. However, at 8% margins, it is self-sustaining.
• An agricultural supply chain which it has been building over 20 years and provides strong cost benefits to the FMCG business.
• A packaging business which lends support to the FMCG business.
• And multiple other non-core businesses (e.g. Hotels) which are not core or synergistic, and are not contributing much to value, but have consumed significant Capital.
ITC is a business with significant moats. Its ~30000 Cr cash pile, free cash flow generation and entrenched competencies in the agricultural supply chain and retail distribution provide a great platform for growth longevity in FMCG and related categories. We have not owned ITC in the past for the following reasons.
• We dislike conglomerates because it is very difficult to be a leader in multiple business lines. However, human psychology never lets you admit this and as a result there is sub optimal Capital allocation discipline. Hotels has 25% of Capital Employed and has contributed less than 1% of aggregate EBIT over last 5 years. There has been excessive adventurism in tough categories where ITC has no right to win, for example Fashion.
• Very poor equity ownership amongst the senior management team. Its therefore unclear how much their thinking is driven by need to grow vs grow in a manner that creates value for shareholders (leadership, ROE, Capital allocation discipline). The two need not be correlated.
• We had owned United Spirits for a long time and did not want to own 2 sin businesses from a ESG risk in the portfolio, despite ITC having amongst the highest ratings on ESG.
ITC enters our portfolios as part of our “Special Situations” category. While our core approach to investing is to buy “disciplined compounding stories at a fair price”, it is equally true that “at the right price, all assets are AAA” (except where one suspects governance issues). We buy companies in “Special Situations” when we are not convinced to own them under our leadership compounding buckets, however, they trade at a meaningful discount to fair value.
• ITC has underperformed the market for the last 5 years and at our entry price offers ~5% dividend yield. Hence it is like a Bond with an upside kicker. It provides strong downside protection and significant opportunity to boost growth from its FCF generation and ~30000 Cr cash pile.
• Its cigarette franchise has implied valuations lower than peers in the developed world despite potential for ITC to gain share from the illicit market.

11
The starting point for great returns is often deep cynicism/pessimism which then meets a trigger that causes value to unlock. There are triggers that have led us to reconsider our stance.
• ITC management has guided to pay out 80-85% of PAT as dividends and conceded in recent communication the openness to re-examine its Corporate structure7. Further, they have guided that incremental growth in the Hotel business will be under a Capital light model.
• Recent incidences of minority shareholder activism which resulted in a surge in stock prices.
• ITC management is engaging with analysts to hear counter view-points. These create a credible hypothesis that one can expect more disciplined Capital allocation in future. One should also be open to a view that the future could be different from the recent past - “see what everyone is seeing, but imagine what no one else is thinking”. One can outline 3 scenarios of the future over the next 5 years. Pessimistic scenario where we see a credible path to 9-12% IRRs
• Management’s historical approach to building the company does not change.
• ESG concerns on tobacco result in no re-rating.
• The company pays out 80-85% of PAT that provides 4-6% dividend yield and about 5-7% Earnings growth.
Base case scenario where one could potentially earn 15-18% IRRs as the valuation multiples re-rate as the Consumer business margins increase and there is more credibility on Capital allocation discipline.
• Cigarette business earnings growth picks up to high single digit over next 5 years and valuations of the cigarette business expand to trade in line with global peers.
• FMCG EBITDA margins grow to ~14% in the next 5 years.
• The Hotel business is sold or demerged some-time over the next 5 years and overall multiple re rate as the market believes Capital allocation discipline is here to stay.
7 https://timesofindia.indiatimes.com/business/india-business/itc-open-to-demerge-hotels-business-list-it-arm-sanjiv-puri/articleshow/85260855.cms
0
50
100
150
200
250Se
p-1
6
De
c-1
6
Mar
-17
Jun
-17
Sep
-17
De
c-1
7
Mar
-18
Jun
-18
Sep
-18
De
c-1
8
Mar
-19
Jun
-19
Sep
-19
De
c-1
9
Mar
-20
Jun
-20
Sep
-20
De
c-2
0
Mar
-21
Jun
-21
Sep
-21
ITC's price flat over 5 years vs. ~2x for index/sector
ITC Ltd. NIFTY 50 NIFTY FMCG

12
Optimistic scenario: This scenario requires more imagination of possibilities and a belief that good management teams learn from peers and wherein one can imagine an IRR road map in excess of 20%
• Some volume growth in cigarettes as ITC gains share from unorganized sector.
• There is more focus on select categories where it has “right to win”, larger categories become more profitable with scale and there is more disciplined experimentation in new categories. ITCs cash pile is used to do meaningful M&A in FMCG where it buys regional brands and uses its distribution muscle to scale them. Hence, the FMCG business grows ~15%+ and increases EBITDA margins to ~16-18% from ~8% today in the next 5 years.
• Partners may note that Britannia’s FY 22 operating margins are expected to be ~17% (~6% margin increase over 7 years) and its revenues are ~25% higher than ITC’s food categories which form 80-85% of ITC’s overall FMCG business.
• Some option values from its deep agricultural supply chain emerge.
• Non-core businesses are sold/spun off. Risks that will cause us to change our stance.
• Aggressive regulations by Govt in tobacco that can cause material volume declines.
• Additional material non-related diversifications.
• Very slow pace of margin expansion in FMCG.
In summary, ITC offers base case prospects of 15-18% IRR and a chance of significantly higher returns under certain conditions. This is very attractive in context of where aggregate valuations in the market are at present. Some questions we have been asked
Why do we have an overweight position in Bharti Airtel? One needs to take on concentration risk when odds are greatly in favour and especially when opportunities to deploy in other names are limited. Bharti has built a toll road: the Govt, users of the toll road, and establishments riding on the traffic on the toll road (e.g. Amazon, Zomato) have all benefitted, except for the company who took on the risk of construction. This is now poised to change. The Telecom sector has been a value destroyer for over a decade and conditions are ripe for this to reverse with a very favourable industry structure, no regulatory ambiguity, Govt support and high probability of tariff increases. Over time, we believe Bharti will not be a “boring Telco” but new revenue streams will emerge as the company monetizes its 300M+ customers for new sources of revenue which are not visible today. We believe Bharti Airtel by virtue of its leadership position, value potential in its core business and Option value of monetizing its customer base offers incredible potential. How would we protect the portfolio against a 30% draw down? We cannot protect you from a steep draw down due to a high impact macro event. The risk of large declines in the short term needs to be managed by Asset Allocation. It’s hard to assess upfront the impact of a significant event: SARS and MERS were pandemics that got contained locally and quickly. COVID escalated quickly. One can protect the portfolio by taking a massive cash call (“panicking early”) but that creates a trading mindset as every tremor gets sold into. Hence, while we believe in keeping an open mind, our process is not designed to take large cash calls. Even if we could protect the portfolio by taking cash calls, one cannot foresee the scale and timing of policy maker response. That exposes the portfolio to re-entry risks. Hence, the odds of taking cash calls are not in favour when evaluated over medium term outcomes.

13
When do you run out of investing capacity?
We don’t operate on a “model portfolio” construct that buys at any price but “customize portfolios” for prices available at point of entry. We construct multi cap portfolios where Small cap exposure is typically capped at 25% at cost. If we don’t see opportunity, we will not draw down capital. We don’t intend to be widely distributed where we are having to deal with an avalanche of uncontrolled inflows. For these reasons, “investing capacity” should not be a constraint for us even at 10x of our size.
As you don’t follow model portfolio, are you carrying risks of underperforming in a bull market and differential returns across clients? Every approach has some trade-offs. Buying at any price makes no sense to us which is what a model portfolio essentially does. We may underperform benchmarks in the short term during a bull phase; but we are playing the long game (rolling 5 year time horizons). Differential returns across clients is not a risk but the outcome of customization. Why should a few percentage points difference in return matter if personal investment objectives have been met? Investing should not be competitive sport.
Financials are ~35% allocation, broadly similar for the NIFTY. Is that planned or a coincidence? This is a coincidence. Most of the NIFTY Financials are Lending businesses while our weights are almost equally split between Lending businesses and Life Insurance. At present we own no IT Services while they are 15% allocation in the NIFTY. We go where we think the best opportunities are and don’t worry about staying close to sectoral allocations in the Index. We look forward to speaking with you at 12 PM on the 9th of October. With best wishes,
Manish Gupta Manjeet Buaria Anirudh Shetty Chief Investment Officer Principal Principal

14
Appendix8: Stock price of some blue chip names over time that illustrate “The Behaviour Cycle”
8 Data Source: Ace Equity
0
1000
2000
3000
4000
5000
6000
7000
8000
9000Blue Dart
0
500
1000
1500
2000
2500
3000
3500Eicher Motors
0
5000
10000
15000
20000
25000
30000
35000
40000
Page Industries
TTM PE: ~ 126x
TTM PE: ~ 52x
TTM PE: ~ 94x
15
0
500
1000
1500
2000
2500
Symphony
0
2000
4000
6000
8000
10000
12000
Maruti Suzuki
TTM PE: ~75x
TTM PE: ~32x