5. school age children 5.1 background - national · pdf file · 2013-09-25growth...
TRANSCRIPT

5. SCHOOL AGE CHILDREN
5.1 Background
This group encompasses both middle childhood (between the age of 5 and 10 years) and pre-adolescence (generally age 9 to 11 year in girls and 10 to 12 years for boys). During the school age years, children continue to grow physically at a steady rate through a series of irregular growth spurts that last an average of 8 weeks and occur three to six times a year (159). Appetite and intake generally increase before a growth spurt and decrease during periods of slower growth.
In the school age years, children experience tremendous cognitive, emotional, and social growth and development (159). Children develop self-efficacy and the ability to focus on several aspects of a situation at the same time. They develop increased cause and effect reasoning; become able to classify, reclassify, and generalize; and learn to read and write. Children transition from consuming most food intake under adult control and supervision to taking increasing responsibility for their food choices.
Parents and primary caretakers remain the surrogate reporters of children’s intake until their cognitive and literacy skills are sufficiently developed to permit independent reporting of their own food intake. The cognitive abilities required to self-report food intake include an adequately developed concept of time, a good memory and attention span, and a knowledge of the names of food (160;161). These abilities develop rapidly from age 8 years and studies in the early 1990s provided evidence that by age 10 years (fourth grade), children can reliably report their food intake for the previous 24 hours (161-164). However, the average age at which children develop the cognitive skills relevant to self-reporting of diet intake differs cross-culturally and between individuals (165), and the minimum age at which children gain the ability to conceptualize the time frame used in dietary instruments (24 hours, 1 week, 1 month) is not well established. The ability of children younger than 10 years to give valid responses to food frequency questionnaires covering periods greater than 1 day is questionable because of their inability to conceptualize frequency and averaging (166;167). The need for adult assistance in dietary reporting is also driven by the limited scope of the child’s experience and knowledge of food preparation. Children may be inattentive to aspects of food and drink that are of interest to interviewers (e.g., brand names, fat content of milk) (165).
Baranowski and Domel (160) proposed a cognitive processing model to understand how children recall dietary data. The model includes three structural components—sensory register, short-term memory, and long-term memory—that can be applied to categorize the errors in children’s dietary reporting. These components result from attention, perception (or interpretation), organization, retention, retrieval, and response formulation. Further work on the
105

model showed that during self-report of intake, children employ a number of retrieval mechanisms: visual imagery (appearance of food), usual practice (familiarity with food), behavior chaining (association with preferred food or favorite activity during a meal or day), and preference (favorite food) (168). Perceived importance of food also affects recall ability in children (169). Further research is needed to refine the model and advance dietary assessment methodology for children.
Exhibit 5.1 compares dietary assessment methodological issues relevant to school age children and adolescents. Preadolescent children are transitioning between the two age groups, and many adolescent issues assume importance as children mature. Exhibit 5.1. Respondent-observer issues in the dietary assessment of school age children and
adolescents.a
School Age Adolescence
Dietary Habits • Rapidly changing food habits • Eating patterns generally
structured • Under supervision of adults • More in-home eating than
adolescence, but meals and snacks also at school, child care, and friends
• Parental influence important
• Rapidly changing food habits • Unstructured eating patterns • Less supervision by adults • Less in-home eating
• Peer influence important
Cognitive Abilities
• Low literacy skills • Limited attention span • Limited concept of time • Limited memory • Limited knowledge of food and
food preparation • Dietary reporting by surrogate
respondents
• Full cognitive capability
• Extensive knowledge of food, but food preparation experience may be limited
• Responsibility for self-reporting
Psychological • Food satisfies hunger • Food is a means of self-expression
aAdapted from Livingston and Robson, 2000 (161).
5.2 Validation of Dietary Assessment Methods in School Age Populations
Two recent comprehensive reviews examined the validation of dietary assessment methods in school age children through 2000 (1;161). This report summarizes the conclusions of these two independent reviews and then discusses validation studies published since 2000.
McPherson et al. (1) reviewed 41 validity and 9 reliability studies of children age 5 to 18 years that included a sample size of at least 30. These studies were published in peer-reviewed
106

English-language journals between 1970 and August 2000. About two-thirds of the studies examined school age children (Exhibit 5.2). Studies on adolescent populations are discussed in Chapter 6. The full review article includes a series of tables summarizing the relevant design issues and the results of the examined studies. The authors concluded that the evaluation of dietary assessment methods for school age children is difficult for several reasons:
• The reference methods against which the instruments have been compared have inconsistent
validity.
• The effect of correlated errors between the method being examined and the reference method must be considered.
• Different reference periods were often used for the examined instrument and reference method.
• The heterogeneity of the study designs, study populations, and instruments (e.g., different FFQs, the number of days and recording method for food records, or one meal versus 24HR) makes comparisons uncertain both within a type of assessment method and between methods (1).
With these considerations in mind, the studies reviewed showed that correlations between the reference method and dietary assessment tool were almost always higher for the food recalls and food records than for the FFQs (1). Almost all of the reviewed validity and reliability studies among children younger than age 9 years included adult assistance providing information on the child’s intake. Little data on the effect of gender, race, or ethnicity on instrument validity were found. The review concurred with another recent review of portion size estimating aides (126), which concluded that children generally have difficulty estimating portion sizes and insufficient information is available to make guidelines for portion size estimation in children.
The review by Livingston and Robson (161) evaluated key measurement issues in the dietary assessment of children and adolescents and examined the issues of misreporting and the identification of misreporters. This review includes a table of studies validating dietary assessment methods with total energy expenditure (TEE) measured by doubly labeled water (DLW) in school age children (7 studies) and adolescents (4 studies). The review concludes with a discussion of criteria to consider in selecting a dietary survey method in young children and older children and adolescents. Exhibit 5.3 summarizes the relevant conclusions of this review.
107

108
Exhibit 5.2. Summary of validation studies on children age 6 to 12 years, reviewed by McPherson et al. (1;170)
24-Hour Recall 3 studies evaluated full 24 hours (163;164;171); 6 studies evaluated portion of day, usually school
lunch (140;141;172-175) Reference Method TEE by DLW Method = 1 study (171) Direct Observation = 7 studies (140;141;163;172-175) Food Record = 1 study Comparison with Reference Method Food recall underestimated intake = 5 studies (141;164;171;174;175) Food recall overestimated intake = 4 studies (140;163;173) Difference in mean energy intake ranged from 34% underestimation to 18% overestimation Food Record (FR) 2 studies evaluated audiotaped records, 1 day (164) or 7 days (171) 2 studies evaluated 7 consecutive days (171;176) 1 study evaluated 8 consecutive days (177) 1 study evaluated 3 and 7 non-consecutive days (178) Reference Method TEE by DLW Method = 3 studies (171;176;177) Direct Observation = 2 studies (164;178) Duplicate portions = 1 study (178) Comparison with Reference Method Food record underestimated intake = 4 studies Food record overestimated intake = 2 studies Difference in mean energy intake ranged from 28% underestimation to 31% overestimation Correlation coefficients ranted from: 0.52 to 0.71 for energy; 0.56 to 0.66 for protein; and 0.58 to 0.63 for total fat. Food Frequency Questionnaire 13 studies, each using different FFQ instruments (128;146;167;179-188) Reference Method TEE by DLW Method = 1 study (146) 7 day Food Record = 3 studies (128;180;183) 14 day Food Record = 4 studies (167;179;181;186) 14 day Food Checklist = 1 study (185) 22 day Fruit/Vegetable Record = 1 study (167) 24-Hour Recall = 3 studies (182;187;188) Serum carotenoids, vitamins A, C, and E = 1 study (184) Comparison with Reference Method FFQ overestimated intake in 12 studies (128;146;150;167;179-182;184-188) In 3 studies comparing full diet FFQ with multiple FRs, correlation coefficients ranged from: 0.25 to 0.46 for energy; 0.18 to 0.34 for protein; and 0.19 to 0.39 for total fat.

109
Exhibit 5.3 Summary and conclusions from Livingston and Robson, 2000 review (161)
Parental Recall of Dietary Intake Children (< 7 years) • Parents can be reliable reporters of their children’s food intake in the home environment
(139;140;143;144), particularly if both parents participate in the reporting process (141). • Parents may not be reliable reporters of the child’s food intake out-of-home (139).
Portion Size Estimation in Children • Studies of the ability of children and adolescents to estimate portion size have shown
inconclusive and contradictory results (163;164;186). • The assumption that inclusion of any quantification tool will improve the estimating
capabilities of children has not been verified. • Portion size estimation improved with an intensive 45-minute training session in children age 9
to 10 years, but errors for several foods remained >100% (189).
Variability and Tracking of Nutrient Intake • The variance ratio (within-subject to between-subject ratio) of most nutrients is much higher in
children and adolescents (5-17 years) than adults (190-194); ratios are approximately twice adult values and are consistently higher in females than males. Variability is lowest for nutrients eaten regularly and highest for nutrients eaten in large amounts only occasionally. Up to 20 days of recording may be required to capture habitual vitamin intakes.
• Self-reported intakes, particularly in adolescents, are likely to be biased, mainly in the direction of underreporting (61;138;176;195;196).
• Evidence for tracking (maintenance of relative position in rank over time) of nutrient intake over time is inconsistent for school age children and adolescents.
Validation of Dietary Intakes with DLW Method • The overall trend for energy intake underreporting tends to increase with increasing age;
intakes from children younger than age 10 years are more accurate than from older children. • Obese children and adolescents underreport energy intake significantly more than do non-
obese children and adolescents. • The influence of parental adiposity on children’s food intake is inconsistent. • The small number of studies to date preclude any firm conclusions about the advocacy of one
dietary assessment over another; the small number of studies suggest: - Weighed or estimated food records provide unbiased records of energy intake in lean
children <9yrs; but adolescents underreport intake by 20% (138;176) - Diet History method overestimates energy intake in children age <9 years, but is
accurate in older children (138) - 24HR energy intake accurate at group level for children age 4 to 7 yrs, but is not
precise at the individual level (144) - FFQ overestimates energy intake by 53% in children age 4 to 7 yrs (146)
• Evidence exists for a subject-specific response in dietary reporting; subjects who underreported by the weighed food record also did so by Diet History (138).
Detection of Misreporting • At present, the identification of the presence and magnitude of overreporting of energy intake
is impossible; more experimentally-derived data on TEE assessed by the DLW method is needed to calculate the upper limit confidence intervals.
• The selective underreporting of different foods has not been addressed in dietary studies of children and adolescents.
• To detect misreporting, apply appropriate age- and gender-specific cut-offs for evaluating reported energy intake in pediatric populations by comparisons with presumed energy requirements; apply different cut-offs for subjects with low, medium, or high physical activity levels.

110
Table 5.1 at the end of this chapter presents 17 validation studies on school age children published since 2000.
Food Records (FRs). Two studies on school age children age 6 to 9 years found close agreement between mean group energy intake reported on either estimated or weighed FRs and TEE measured by the DLW method (197;198). In both studies, reported energy intake was not representative of TEE at the individual level. The study of predominately white Northern Ireland children found obese children underreported energy intake by 14% (197), and the study on Australian children of mixed socioeconomic status found no relationship between misreporting and body mass index (198).
Livingston and colleagues (199) re-examined a dataset of concurrent measurements of TEE by the DLW method, basal metabolic rate (BMR), heart rate monitoring, 7-day weighed food records (FR), and diet history (DH) in 36 children age 7 to 15 years to identify children as underreporters, acceptable reporters, and overreporters. At least 80% of the children were classified as acceptable reporters by both FR and DH. Underreporting was more prevalent by the weighed FR (11% weighed FR vs. 6% DH), and overreporting was more prevalent by DH (17% DH vs. 6% weighed FR). Only 25% of children who underreported energy intake on weighed FRs were identified by cut-offs based on age-specific physical activity levels (PAL), leading the authors to conclude that “all cut-offs based on assumed PAL levels used for screening the energy intake data of children should be applied with caution” (199). Though this analysis provided evidence that estimating physical activity levels by heart rate monitoring shows promise, its sensitivity and specificity for detecting misreporters needs further study.
24-Hour Recall (24HR). Since 2000, seven studies have examined the accuracy of the 24HR in school age children. Two studies (200;201) found close (within 10%) agreement at the group level between mean energy intake reported on three multiple pass 24HRs and TEE by the DLW method, but wide individual variability. Evaluation of reporting accuracy in a diverse free-living population of children classified as Tanner index stage 1 (pre-puberty) found that children who underreported intake had a higher relative weight and adiposity than overreporters (p<.0001), and overreporters were lighter and had less body fat than under- and accurate reporters (201). In addition, 46% of children reported intakes greater than 110% of TEE measurements, raising the possibility that overreporting may constitute a major form of children’s and parents’ inaccurate dietary reporting or that “overreporting” reflected actual child energy intake contributing to the increasing prevalence of overweight among children.
Five studies validated 24HR methods with direct observation of school meals focusing on accuracy of recalled foods rather than total energy or nutrient intake. Children 5 to 7 years in the United Kingdom were able to accurately recall only 58% of food eaten from the school lunch menu or 70% of packed lunch items within 2 hours of finishing the meal (202). In this study, non-directed prompts increased recall by 66 to 80%, but the authors concluded that the ability of

111
children age 5 to 7 years to recall intake from lunch at school varies widely and that this dietary assessment method is unlikely to be suitable at the individual level.
Baranowski and colleagues (203) developed and evaluated an interactive multimedia, and multiple pass 24HR for older students to self-report dietary intake. This system is called the Food Intake Recording Software System (FIRSSt). Compared with observation of intake at the school lunch meal the previous day in a diverse group of 4th grade (age 9 to 11 years) public school students, FIRSSt was somewhat less accurate (46% matches of observed and recalled foods) than a dietitian administered multiple pass 24HR (59% matches of observed and recalled foods). However, FIRSSt attained 60% match, 15% intrusion (added foods), and 24% omission rates for all meals when compared with a 24HR. This study is also the first study to evaluate a bogus pipeline effect for diet in children. Children were asked to provide a hair sample and told, “We can tell some of what you eat from a chemical analysis of your hair.” Obtaining a hair sample reduced the omission rate for FIRSSt versus 24HR and increased the match rate for 24HR versus observation. This finding suggests that a small part of the inaccuracy of children’s self report is wished for or willful and thereby subject to correction by a bogus pipeline procedure (203).
Domel-Baxter and colleagues conducted a series of 24HR methodology and validation studies in diverse groups of public school students in Georgia that question the ability of 10-year olds to accurately report intake. A study of fourth grade students (10 years old) found no difference in 24HR omission rates and total inaccuracy between telephone-administered 24HRs or in-person 24HRs. Whether interviewed in person or by telephone using a 4-pass method, children reported only 67% of items observed at school breakfast and lunch the previous day, and 17% of items reported were not observed (204). Fourth graders in a second study (205) completed a dietitian administered 4-pass 24HR the day after observation of three school breakfasts and lunches. Less than half of the items observed eaten were reported accurately, and almost 40% of what the students reported eating was not observed. Furthermore, accuracy was inconsistent from one recall to another in the same child.
In a study of first grade (mean age 7.2 years) and fourth grade (mean age 10.1 years) students interviewed the morning after observed intake at school lunch (206), specific prompting methods (preference, food category, or visual) decreased the accuracy of intake reporting among first graders. Among fourth graders, prompting for food category yielded small gains in recall accuracy.
Food Frequency Questionnaires (FFQ). Three studies evaluated three different FFQs in populations including children age 11 and 12 years. The Eating Habits Questionnaire adapted from the Health Habits Questionnaire used in the Bogalusa Heart study was validated in diverse group of 24 students (mean age 12.7 years) using three 24HR recalls as the reference measurement (207). Although perfect agreement between instruments was achieved for only 56% of the food categories, factor analysis suggested that 10 factors explained 81.3% of the

112
variance. The investigators concluded the instrument is a valid instrument in African American and white adolescents in the Southeast.
Validation of the Youth Adolescent FFQ with TEE measurements by the DLW method found the instrument provided accurate estimates of mean energy intakes of prepubertal boys and girls as a group, but not for individuals (208). Fifty percent of the subjects misreported intake (difference >10%); there was an inverse relation between the energy discrepancy and both body weight and percentage of body fat.
Agreement between the European Prospective Investigation of Cancer (EPIC) FFQ and 7-day weighed FRs for energy and all nutrients was poor at both the group and individual level for Scottish school children (mean age 12.3 years) (209). The FFQ did correctly classified low, medium, and high intake consumers.
Other Validation Studies. Two studies examined portion size estimating methods by comparing estimates with direct observation of intake. The magnitude of errors in the children’s quantitative estimates of food portions were large when using manipulative props (modeling clay, small plastic beads, paper strips, and water) (210), 2-dimensional food models (210), food photographs (210;211), or descriptions of food portions as small, medium, or large (210;211).
5.3 Surveys of School Age Populations
Table 5.2 presents summary data from epidemiologic surveys of at least 100 subjects that collected food and supplement intake data from school age populations. The two most recent US nutrition monitoring surveys, the 1999-2000 National Health and Nutrition Examination Survey (NHANES) and the 1994-96 Continuing Survey of Food Intake of Individuals (CSFII), each included 24HR interviews to assess food and beverage intake. In both surveys, children younger than 12 years were interviewed with a parent or guardian present. If the child or parent/guardian was not able to provide intake for meals at school or day care, the school or child care provider was contacted by survey staff for information on the menu served. The diet-related questions in NHANES, CSFII and the integrated What We Eat in America-NHANES survey which is currently in the field, are presented in Table 2.5 in Chapter 2. The integrated What We Eat in America-NHANES includes two 24HR interviews, one in-person and one by telephone, and a propensity questionnaire (100-item NCI DHQ without portion size information) in all children older than 2 years. Supplement use is queried in a separate questionnaire on frequency, dosage, and duration of use of specific products. The rationale for selecting the instruments for the integrated survey as well as the history of past CSFII and NHANES surveys were recently reviewed (9).
The most commonly used dietary assessment method in school age children in the US is the 24HR. The Bogalusa Heart Study (212), the Study of Children’s Activity and Nutrition Study (213), the Child and Adolescent Trial for Cardiovascular Health (214), the Dietary Intervention
Study in Children (DISC) (164;215), and the School Nutrition Dietary Assessment Study (216) all used 24HR interviews to assess food and nutrient intake.

113
Estimated or weighed food records were used in 7 of the 25 studies in Table 5.2. It is important to note that use of the food record outside of the US usually involved intensive training and monitoring of subject recording through a series of interviews conducted in the home or by telephone. FFQ instruments were used in 6 studies, two of which used versions of the Youth and Adolescent Questionnaire, which is a modification for children and adolescents of the Harvard FFQ for adults.
Most of the studies and surveys presented in Table 5.2 did not include discussion of methods to assess vitamin and mineral supplement intake in the literature cited.
5.4 Research Needs
“Even after 40 years of research, and a plethora of comparative studies, there are no universal criteria which can be applied when selecting data-collection methods suitable for studies of children and adolescents.” Livingston and Robson, 2000 (161)
Drawing conclusions about the validity of available dietary assessment instruments in school
age children is hampered by the differences in instruments, research design, reference methods, and populations in the validation literature. Research needs have been identified by a number of authors:
• Studies need to examine the validity and reliability of each dietary assessment method by
age, gender, ethnic subgroup, and socioeconomic status to understand the best application of each tool (1).
• Development and validation of improved methods for assessing dietary supplement use are needed (9;64).
• Studies that compare multiple reference measures for a particular reference assessment method would allow comparisons of the validation standards best suited for particular situations (161).
• Physiologically-based measures, such as DLW or serum micronutrient concentrations, merit further study because these reference measures are not affected by respondent error; (1;161;201) a more extensive database of assessments of TEE by the DLW method is needed.
• Identification and characterization of subgroups most likely to misreport food intakes, together with the reasons for doing so, need further study, as does the development of improved techniques to identify underreporters and overreporters at the individual level (161;201).
• The issue of whether underreporting of diet applies to the diet as a whole or whether there is selective underreporting of nutrient intake, whether by food types, meals, or snack foods, needs examination (161).

114
• The reasons for, and effects of, non-participation by children and adolescents should be examined to identify possible sources of bias (non-response bias) and to assess implications for design analysis and interpretation of results (161;217).
• Developing new or refining existing dietary survey methods that are sensitive to different ages, cognitive abilities and motivation levels and that improve accuracy and are not time consuming is needed (1;160;161;204;205).
• The effect of body size on reporting of dietary intake requires further study (1;161).
• Further research is needed to refine the cognitive model for children’s recall of dietary intake proposed by Barnowski and Domel (160) and to address many unresolved issues, such as the impact of time and less experimentally controlled conditions on retention and retrieval processes (161).
• The effects of a longer time lag between meal recall and environmental factors on the accuracy of recall in children need to be established (202).
• The accuracy of child versus parent or caretaker respondents needs further study (165;218).
• New methods for estimating portion sizes that are sensitive to the cognitive abilities of children are needed (1;161;202).
• More research is needed on the prompts that can aid memory retrieval at various ages without increasing the risk of eliciting socially-desirable responses. Environmentally specific probes (e.g., school, fast food restaurants, extracurricular activities, media and entertainment, food industry packaging of foods for children) within a food record or food frequency questionnaire also are needed (160;161;206;218).
• Refinement of statistical techniques to account for systematic bias in pediatric populations is needed. Statistical models need to be developed that will estimate the impact of systematic bias on estimates such as relative risk, variance ratios, or proportions on the populations with inadequate intakes (161).
• Emerging technologies should be applied to developing new dietary assessment methods (e.g., Internet-based self-administered methods or dietary assessment methods that incorporate cellular telephones, personal digital assistants, or video recording) (219).

115
Table 5.1. Validation of dietary assessment methods in school age children (6-12 years)
Reference
Study Population
Test Method
TM
Reference Measurement
(RM)
Design Features
Correlation Between
TM and RM
Mean Intake Difference Between TM and RM
FOOD RECORDS (FR) or DIET HISTORY (DH) Livingston et al., 2003 (199)
7 yrs = 11 (7 M; 5 F) 9 yrs = 9 (5 M; 4 F) 12 yrs = 10 (5 M; 5 F) 15 yrs = 6 (3 M; 3 F) Total = 36 UK
7d Weighed FR DH
DLW Method for TEE (EEDLW) Heart Rate Monitoring for EE (EEHR) BMR by indirect calorimetry
Retrospective analysis of 1990 dataset (138) to identify underreporters (UR). Students recruited from schools with mixed SES. Parents of children 7-9 yrs completed 7d weighed FR; older children were assisted by parents. Subjects visited at home least 4 times during the weighing period. DH conducted with the child and/or parent either 2-4 wks. before or after 7d FR. TEE was measured over 10 days with daily spot urine collection after dosing. HR monitoring for 4 days. BMR measured in early morning in fasting state. School Intake: For weighed FR, pocket notebook carried for recording food and beverages consumed away from home. For DH, school menu obtained and child asked about which foods and amounts eaten.
Weighed FR vs. TEE Acceptable reporters (AR) = 83.3% Overreporters (OR) = 5.6% Underreporters (UR) = 11.1%
Diet History vs. TEE AR = 80.6% OR = 16.7% UR = 2.8% The sensitivity of energy intake measured by heart rate monitoring was 0.50 and specificity was 1.00. Only 25% of children who underreported energy intake on weighed FR were identified by cut offs based on a blanket PAL of 1.55; none of the underreporting by DH was identified.

116
Table 5.1. Validation of dietary assessment methods in school age children (6-12 years), continued
Reference
Study Population
Test Method
TM
Reference Measurement
(RM)
Design Features
Correlation Between
TM and RM
Mean Intake Difference Between TM and RM
FOOD RECORDS (FR) or DIET HISTORY (DH), CONTINUED McGloin et al., 2002 (197)
6-8 yrs = 114 58% male; 44% high risk for obesity; 44% low risk for obesity; and 2% obese; mixed SES status; predominantly white. Northern Ireland, UK
7d Weighed FR DLW Method for TEE
Cross-sectional study of energy and fat intake in children using 7d weighed FRs validated by DLW (DLW dosing and 10d spot urine collection). 7d weighed FRs collected during spot urine collection period. Subjects visited daily in home. Reported energy intake was compared with estimated TEE in lean children at high risk (HR) and low risk (LR) of obesity and with obese children. Obese children had BMI over 95th percentile. HR children had one parent with BMI>29.5; LR children had two lean biological parents (BMI<25). School Intake: Child reported
7d FR Energy Intake (EI) vs. DLW TEE
2, 5, and 14% underestimation in low risk, high risk and obese children.
EI/TEE x 100 Mean(SD)
Low Risk = 98.4% (16.7) High Risk = 95.3% (19.2) Obese = 86.3% (16.3) No significant difference in energy intake between groups, but obese children consumed significantly more fat than did lean children.
Zive et al., 2002 (220) Study of Children’s Activity and Nutrition (SCAN)
4-12 yrs = 22 Demographics of validation study subjects not specified; in main study 49.6% males; 45% non-Hispanic whites; 55% Mexican –Americans; 31% of mothers < HS education California
1d Estimated FR (modified 24HR) (Intake observed at lunch and dinner at school or home; parent interviewed for breakfast meal and unobserved snacks)
12 Hour Direct Observation
This study validated method used for longitudinal study of 350 children. Intake was directly observed for 12 hours and compared with FR-modified 24HR method. School Intake: Direct observation
FR vs. DO
Saturated fat r = 0.20 Cholesterol r = 0.86 Average for 9 nutrients r = 0.58
Not Specified

117
Table 5.1. Validation of dietary assessment methods in school age children (6-12 years), continued
Reference
Study Population
Test Method
TM
Reference Measurement
(RM)
Design Features
Correlation Between
TM and RM
Mean Intake Difference Between TM and RM
FOOD RECORDS (FR) or DIET HISTORY (DH), CONTINUED O’Connor et al., 2001 (198)
6-9 yrs = 47 47% male; mixed SES Sydney, Australia
3d Estimated FR
DLW Method for TEE
Anthropometric measurements included standing height, and body weight to calculate BMI. Fat-free body mass derived from the 18O dilution space. TEE was measured over a 10d period with post-DLW dose urine samples collected daily. Parents recorded child’s food and drink intake for 3 consecutive days. Goldberg’s cut offs of EI:REE of 1.06 applied to child intakes to identify misreporting. School Intake: Parent’s asked caretakers to document food intake when child away form home.
3d FR EI vs. TEE r = 0.10, p = 0.51
Most significant predictor of misreporting was dietary fat intake (r(2) = 0.45, p<0.0001)
3d FR EI vs. TEE 118kJ/d or 1.6% overestimation
Limits of agreement (bias + 2 SD) = -3226 KJ and 3462
kJ Misreporting = EI-TEE
(kJ/d) x 100 33% of children within 10% of TEE Mean % misreporting = 4% + 23%. 55% of children had EI > TEE. Range from an underestimation of 33% to an overestimation of 56%. Misreporting not associated with sex or body composition

118
Table 5.1. Validation of dietary assessment methods in school age children (6-12 years), continued
Reference
Study Population
Test Method
TM
Reference Measurement
(RM)
Design Features
Correlation Between
TM and RM
Mean Intake Difference Between TM and RM
24-HOUR RECALL (24HR) Warren et al., 2003 (202)
5-7 yrs = 203 public school grades 1 and 2; 51% male; 50% high SES households; race not specified Oxford, UK
Recall of lunch meal Interview included free recall and then non-directed prompts.
Direct Observation
From December 1999 to September 2000, children observed eating lunch in school cafeteria. Within 2 hours of finishing lunch, child interviewed. Foods recalled were classified as matches (recalled food agreed with observation) omissions (failed to report food observed) or phantoms (reported but not observed). Before lunch and secretly, foods in packed lunches were listed (65% of children ate packed lunches from home).
Pearson’s Correlation
Packed lunch: r = 0.22 between number of foods offered and number of foods recalled School lunch: r = 0.16 between number of foods offered and number of foods recalled No child offered 6 or 7 foods recalled all; children offered 8 foods recalled 4
Lunch Recall vs. DO Accurate Recall (# Foods
Recalled/# Foods Observed x 100)
Packed lunch: mean percentage of accurate recall = 70% (+ 29%) School lunch: mean percentage of accurate recall = 58% (+ 28%) Non-directed prompts increased recall by 66 to 80 percent (p<0.001). Year 2 children had significantly higher recall (p<0.05)
Baranowski et al., 2002 (203)
9 yrs = 58 10 yrs = 73 11 yrs = 7 public school 4th graders; 45% male; 33.7% white; 30.4% black; 14.5% Hispanic Texas
Food Intake Recording Software System (FIRSSt) 24HR
Multiple pass 24HR by dietitian using laptop computer with NDS software Direct observation of food eaten during lunch at school (packed lunch or school lunch program meal) Prompts included school lunch menu
FIRSSt is an interactive, multimedia, and multiple pass 24HR for students to self report intake. Students randomly assigned to 6 study groups systematically varying the sequence of self report (FIRSSt vs. standard 24HR), observation of school lunch, and hair sample collection as a bogus pipeline manipulation (to make students think hair sample could validate report of food intake). Recalls were conducted the morning after observation. Accuracy measured in terms of matches, intrusions, and omissions.
Pearson’s Correlation
For portion size estimates: FIRSSt & 24HR = 0.75 FIRSSt & DO = 0.73 24HR & DO = 0.76
FIRSSt vs. DO % matches = 46% % intrusions = 24% % omission = 30%
24HR vs. DO % matches = 59% % intrusions = 17% % omission = 24%
FIRSSt vs 24HR % matches = 60% % intrusions = 15% % omission = 24% match = item reported eaten and observed eaten intrusion = item reported eaten, but not observed omission = item not reported but observed eaten

119
Table 5.1. Validation of dietary assessment methods in school age children (6-12 years), continued
Reference
Study Population
Test Method
TM
Reference Measurement
(RM)
Design Features
Correlation Between
TM and RM
Mean Intake Difference Between TM and RM
24-HOUR RECALL (24HR) CONTINUED Baxter et al., 2003 (204)
4th grade students = 69 49% male; 54% black Georgia
24HR Telephone 24HR (n = 36) In-person 24HR (n = 33) 4-pass method based on NDS protocol with written (vs. computerized) recording.
Direct observation of school breakfast and lunch (Only children eating meals provided by school participated.)
In 2001-2002, 451 children were recruited from 4th grade classes at 10 public schools. A random sample of 69 stratified by ethnicity and gender was selected. In a 2-arm parallel design, each child was observed eating school breakfast and school lunch once and was interviewed that evening about the day’s intake. Half were interviewed in person and half by telephone. In-person interviews conducted in research van outside of child’s home. Omission rate = [sum of omissions/(sum of omissions + sum of matches)] x 100 Intrusion rate = [sum of intrusions/(sum of intrusions + sum of matches)] x 100 Inaccuracy = (absolute difference between amounts reported and observed for each match x statistical weight) + (each omitted amount x statistical weight) + (each intruded amount x statistical weight) summed over all items. A score of 0 servings indicated a perfect recall compared to observation.
Telephone 24HR vs. In-Person 24HR
ANOVAs on omission rates and total inaccuracy found no difference between interview type. Chi-square test found no difference between proportion passing or failing intrusion rates by interview type.
Telephone 24HR vs. DO Mean omission rate = 32% Mean intrusion rate = 16% Mean total inaccuracy = 4.3 servings
Telephone 24HR vs. DO Mean omission rate = 34% Mean intrusion rate = 19% Mean total inaccuracy = 4.6 servings

120
Table 5.1. Validation of dietary assessment methods in school age children (6-12 years), continued
Reference
Study Population
Test Method
TM
Reference Measurement
(RM)
Design Features
Correlation Between
TM and RM
Mean Intake Difference Between TM and RM
24-HOUR RECALL (24HR), CONTINUED Baxter et al., 2002 (205)
4th grade students = 104 47% male; 49% black Georgia
24HR 3x 1 24HR = 104 2 24HR = 92 3 24HR = 79 Total = 275 4-pass method based on NDS protocol with written (vs. computerized) recording.
Direct observation of school breakfast and lunch (Only children eating meals provided by school participated.)
523 children were recruited from 22 4th grade classes at 6 public schools. A sample of 104 stratified by ethnicity and gender was randomly selected. Multiple pass 24HR was administered the morning after school breakfast and lunch was observed. There was a minimum of 4 wks. between each recall.
Interclass Correlation Coefficient 1st to 3rd 24HR = 0.29 for total inaccuracy and 0.15 for omission rate.
24HR vs. DO % matches = 35% % omissions = 41% % intrusions = 24% Mean omission rate = 51% Mean intrusion rate = 39% Omission rate = [sum of omissions/(sum of omissions + sum of matches)] x 100 Intrusion rate = [sum of intrusions/(sum of intrusions + sum of matches)] x 100
Baxter et al., 2000 (206)
1st grade students = 48 (7.2 yrs mean age) 4th grade students = 48 (10.1 yrs mean age) Lower to middle socioeconomic status students; 50% black Georgia
Lunch recall 1st pass–free recall or non suggestive prompt recall 2nd pass: specific prompted recall assigned to study group a) Preference prompting; b) Food category prompting; or c) Visual prompting.
Direct observation of lunch meal (Only children eating meals provided by school participated.)
12 children assigned in each of 8 cells as follows: grade (1st or 4th); gender; ethnicity (white or black); and by prompting method (preference, food category, or visual). Children were interviewed the morning after observed eating school lunch using free recall, non suggestive prompted recall, and specific prompted method. Inaccuracy score: calculated from the absolute difference between amounts reported and observed eaten multiplied by each items assigned weighted value and then summed across all items for each child.
Authors conclusion: Among 1st graders, prompting may hurt rather than help recall; among 4th graders, food category prompting yields small gains in recall accuracy with minimum losses.
Lunch Recall vs. DO Median Inaccuracy Score
Before Prompting 1st graders = 2.7 serving 4th graders = 1.7 servings After Prompting (All) 1st graders = 2.6 serving 4th graders = 1.8 servings After Preference Prompting 1st graders = 2.3 serving 4th graders = 1.8 servings After Food Category Prompting 1st graders = 3.2 serving 4th graders = 1.3 servings After Visual Prompting 1st graders = 2.8 serving 4th graders = 2.0 servings

121
Table 5.1. Validation of dietary assessment methods in school age children (6-12 years), continued
Reference
Study Population
Test Method
TM
Reference Measurement
(RM)
Design Features
Correlation Between
TM and RM
Mean Intake Difference Between TM and RM
24-HOUR RECALL (24HR), CONTINUED Brady et al., 2000 (200) Longitudinal Study of Childhood Obesity, University of Alabama
7-14 yrs = 110 9.9 yrs mean age; 20.1 kg/m2 mean BMI; 43% male; 52% white; 48% black Birmingham, AL
24HR 3x Three pass method; 2 in-person and 1 by telephone; 2 dimensional food models
DLW Method
Children admitted to the metabolic unit overnight for DLW dosing and 24HR 1. Two weeks later, children returned to nutrition center for 24HR 2. Third recall by telephone. Energy-adjusted 24HR intake compared to recommended servings from food guide pyramid. Parents consulted during 24HR interview. School or Childcare Intake: Method of collection not specified.
24HR Energy Intake vs. DLW
TEE
0.32 (P=0.08)
Wide individual variability but nearly identical group mean energy intake measured by 24HR and DLW method.
24HR Energy Intake vs. DLW TEE
Energy = 0.04MJ/d
difference (Not Specified)
Fisher et al., 2000 (201)
4-11 yrs = 146 52% male; 34% black; 66% white; all Tanner Index stage 1 Alabama and Vermont
24HR 2 or 3 in-person 24HR during 14d post DLW dose Multiple pass 24HR with child with parental assistance
DLW Method for TEE under free living conditions
Subjects recruited by newspaper advertisements in proximity to study sites. 14-d post DLW dosing urine collections. Tanner Index assessed and height and weight measured. Body composition measured by DEXA (fat free mass included soft lean tissue and bone mass). Children classified as having had an underreported, accurately reported, or overreported dietary intake relative to TEE. School or Childcare Intake: Method of collection not specified. Parents of younger children more involved in interview than parents of older children.
24HR vs. DLW kcal 0.27 (p<0.01)
24HR vs. DLW TEE 110% + 31% kcal
overestimation 1,881 + 470 kcal/d vs. 1,704
+ 318 kcal/d (p<0.01)
Accurate reporters (24HR with 10% TEE) = 34%
Underreporters (24HR below 90% TEE) = 20%
Overreporters (24HR
above 110% TEE) = 46%
Underreporters had higher relative weight and higher adiposity than overreporters (p<0.0001).

122
Table 5.1. Validation of dietary assessment methods in school age children (6-12 years), continued
Reference Study Population
Test Method TM
Reference Measurement
(RM) Design Features
Correlation Between
TM and RM
Mean Intake Difference Between TM and RM
FOOD FREQUENCY QUESTIONNAIRE (FFQ) Lietz et al., 2002 (209)
11-13 yrs = 50 Mean age 12.3 yrs; 36% male; 10% overweight; 2% obese Scotland
EPIC FFQ Interviewer- administered
7d Weighed FR 24h urine collection for urea, sodium, potassium and creatinine
Between November 2000 and February 2001, subjects were recruited from secondary school. The EPIC FFQ was completed by interview one day before the 7d weighed FR. Subjects kept 24h urine collection on the Sunday during the 7d FR.
Spearman Energy-Adjusted
Correlation Coefficients
Range of 0.19 for sodium to 0.67 for total fat; mean correlation for all nutrients of 0.48. Correlations for potassium, calcium, fibre, sugar, total CHO, and total fat were significant. 7d Weighed FR and 24h urine: Nitrogen = 0.45 (p<0.05) K = 0.78 (p<0.001)
FFQ vs. 7d FR 30% overestimation of
energy intake Bland-Altman plots
FFQ vs 7d FR Energy = 2/4 MJ Protein = 31g Total fat = 22g Sugar = 53g Calcium = 203 mg. 95% Confidence Intervals Energy = 1.3-3.6 MJ Protein = 22-41g Total fat = 10-33g Sugar = 29-77g Calcium = 791 - -384 mg.
Limits of Agreement Energy = 13.4 MJ Protein = 120g Total fat = 120g Sugar = 270g Calcium = 1,170 mg Median % classified into same and opposite third of intake was 45.9% and 10.8%. Conclusion: Agreement between EPIC FFQ and 7dFR was poor on both a group and individual bases, and demonstrates that the EPIC FFQ is not an appropriate method for estimating absolute intakes in adolescents.

123
Table 5.1. Validation of dietary assessment methods in school age children (6-12 years), continued
Reference Study Population
Test Method TM
Reference Measurement
(RM) Design Features
Correlation Between
TM and RM
Mean Intake Difference Between TM and RM
FOOD FREQUENCY QUESTIONNAIRE (FFQ), CONTINUED Speck et al., 2001 (207)
6th – 8th grade = 24 in validation study; 446 in survey 12.7 yrs mean age; 50% male; 50% black North Carolina
Eating Habits Questionnaire (EHQ) Section 1 = 83-item FFQ on foods eaten for past week. Section 2 = 14 questions on general food habits, food preparation, and eating out. Section 3 = specific foods eaten one day in past week.
24HR = 3x on week before EHQ
EHQ was adapted from the Health Habits Questionnaire used in the Bogalusa Heart study. EHQ administered to groups of 30-40 students by trained research assistants during health classes. A subset of 24 students were randomly selected to completed 3 24HR administered by a dietitian on week before EHQ. A subset of 31 students repeated EHQ in 48 hours and again 2 weeks later.
EHQ vs. 24HR Mean % (SD) Food
Categories in Perfect Agreement
56.0% (20.3%) Factor analysis found 10 factors explained 81.3% of the variance in eating habits (sweet snacks, meats, vegetables, breads/starch, snack foods, fruits, salad dressing, dairy, butter, and miscellaneous).
Perks et al., 2000 (208)
8.6-16.2 yrs = 50 Mean age 12.6 yrs; 46% male Charlottesville, Virginia
Youth-Adolescent Food Frequency Questionnaire (YAQ) 131 item; Semi- quantitative; Self- administered
DLW Method for TEE
Subjects completed YAQ within 1 year of TEE measurement by DLW. Subjects also had the following measurements: BMI, BMR, and body composition by 4-compartment model of Lohman.
YAQ EI vs. DLW TEE
r = 0.22 (p = 0.13) The discrepancy in energy intake (YAQ – TEE) was related to body weight (r = -0.25, P: = 0.077) and percentage body fat (r = -0.24, P: = 0.09) but not to age (r = -0.07, P: = 0.63) or the time between measures.
YAQ EI vs. DLW TEE 2% overestimation
10.03 + 3.12 vs. 9.84 + 1.79 (p = 0.91) Limits of agreement = -6.30 MJ and 6.67 MJ 26% of subjects YAQ EI within 10% of TEE 50% of subjects misreported intake

124
Table 5.1. Validation of dietary assessment methods in school age children (6-12 years), continued
Reference Study Population
Test Method TM
Reference Measurement
(RM) Design Features
Correlation Between
TM and RM
Mean Intake Difference Between TM and RM
FOOD FREQUENCY QUESTIONNAIRE (FFQ), CONTINUED Koehler et al., 2000 (187) Pathways to Health
11-13 yrs (5th -7th grade) = 120 American Indian; non Hispanic white, Hispanic Southwest United States
33 items; Yesterday’s Food Choices (YFC) Self-administered; past day intake; non- quantitative Categories: yes, not sure, no
24HR Compared child’s reported intake of particular foods against child’s 24HR, both completed on same day
Spearman correlations
FFQ vs. 24HR
Low fat foods = 0.71 High fiber foods = 0.35 Fruits & veg. = 0.29 High fat foods = 0.40
FFQ vs. 24HR
Percentage agreement for all food items = 60%
OTHER QUESTIONNAIRES Frobisher et al., 2003 (211)
6-16 yrs = 37 17-82 yrs = 42 (Mean age 12 yrs for children and 42 yrs for adults; university academic and administrative personnel or their children; 25 of adults and 8 of children overweight) UK
Portion size estimation
Weighed portion sizes
Subjects served themselves usual portion of food. Food was immediately removed and weighed. Subjects described the portions size (S,M,L) and choose a photograph. Three to four days later the subjects described the portion size again (S,M,L) and choose a photograph. 9 foods studied: baked beans, cheese, chips, cornflakes, margarine on a slice of bread, mashed potato, rice, spaghetti, and sausage roll.
Using descriptions (S,M,L)the percentage of children within + 10% and + 50% of the actual weights ranged from 3 to 31% and 19 to 84% respectively, compared with 9 to 64% and 60 to 91% for adults. For both children and adults, the food photographs produced higher estimated weights than did the descriptions.
125
Table 5.1. Validation of dietary assessment methods in school age children (6-12 years), continued
Reference Study Population
Test Method TM
Reference Measurement
(RM) Design Features
Correlation Between
TM and RM
Mean Intake Difference Between TM and RM
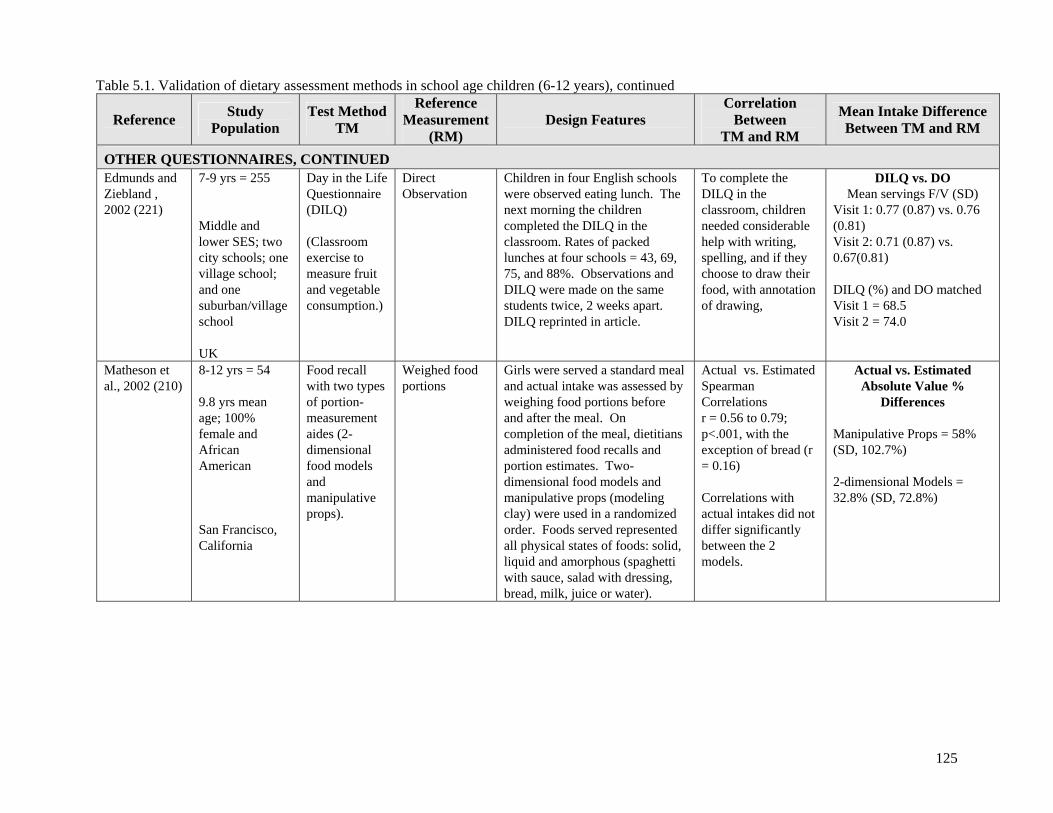
OTHER QUESTIONNAIRES, CONTINUED Edmunds and Ziebland , 2002 (221)
7-9 yrs = 255 Middle and lower SES; two city schools; one village school; and one suburban/village school UK
Day in the Life Questionnaire (DILQ) (Classroom exercise to measure fruit and vegetable consumption.)
Direct Observation
Children in four English schools were observed eating lunch. The next morning the children completed the DILQ in the classroom. Rates of packed lunches at four schools = 43, 69, 75, and 88%. Observations and DILQ were made on the same students twice, 2 weeks apart. DILQ reprinted in article.
To complete the DILQ in the classroom, children needed considerable help with writing, spelling, and if they choose to draw their food, with annotation of drawing,
DILQ vs. DO Mean servings F/V (SD)
Visit 1: 0.77 (0.87) vs. 0.76 (0.81) Visit 2: 0.71 (0.87) vs. 0.67(0.81) DILQ (%) and DO matched Visit 1 = 68.5 Visit 2 = 74.0
Matheson et al., 2002 (210)
8-12 yrs = 54 9.8 yrs mean age; 100% female and African American San Francisco, California
Food recall with two types of portion- measurement aides (2-dimensional food models and manipulative props).
Weighed food portions
Girls were served a standard meal and actual intake was assessed by weighing food portions before and after the meal. On completion of the meal, dietitians administered food recalls and portion estimates. Two-dimensional food models and manipulative props (modeling clay) were used in a randomized order. Foods served represented all physical states of foods: solid, liquid and amorphous (spaghetti with sauce, salad with dressing, bread, milk, juice or water).
Actual vs. Estimated Spearman Correlations r = 0.56 to 0.79; p<.001, with the exception of bread (r = 0.16) Correlations with actual intakes did not differ significantly between the 2 models.
Actual vs. Estimated Absolute Value %
Differences
Manipulative Props = 58% (SD, 102.7%) 2-dimensional Models = 32.8% (SD, 72.8%)

126
Table 5.2. Summary Table: Studies of school age populations
Assessment Method
Num
ber
(n)
Age
(yea
rs)
Eth
nica
lly D
iver
se
Lon
gitu
dina
l Stu
dy
Cro
ss se
ctio
nal S
tudy
Whe
d Fo
od R
ecor
d (n
o. d
ayei
gs)
uppl
emak
e M
Est
imat
ed F
ood
Rec
ord
(no.
day
s)
24-H
our
Rec
all (
n)
FFQ
Typ
e
Oth
er Q
uest
ionn
aire
Nut
rien
t Bio
mar
kers
Sen
t Int
Ass
essm
ent
etho
d
Outcomes National Surveys
US National Health and Nutrition Examination Survey (NHANES) 1999-2000 (41) 992 6-11
1; 2 in 10%
Quest.& 24HR
Food, nutrient, physical activity, and chemical exposures
Continuing Survey of Food Intake of Individuals (CSFII) 1994-96 (42) 2,000 6-11 2 24HR Food and nutrient exposures, diet
and health knowledge
US School Nutrition Dietary Survey, 1995 (216;222) 3,350 6-18 1
NS*
Dietary intake assessed; other questionnaires collected information on school lunch and breakfast; students in grades 1 and 2 interviewed with parents
Survey of School Children in Spain, 1998-99 (223;224) 1,112 6-7 NS
77 item
NS
Height, weight, energy and nutrient intake, and food groups (bakery items, sweetened soft drinks, and yogurt.
Austrian Study of Nutritional Status, 1999 (225) 2,173 6-18 NS 7d NS Nutrients and food consumption assessed, biomarkers (cholesterol and fat soluble vitamins)
Cross-National Survey on Health Behavior in School Age Children, 20 countries, 1993-94 (226)
33,084 11-15
NS Soft drink and sweets consumption recorded on 10-item dietary habits questionnaire similar to FFQ.
HEUREKA 1991, Switzerland (Sample recruited from visitors to national exhibit) (227;228)
903 7-18 NS
FFQ-like 24 HR
NS
Self-administered 24HR with food photos used FFQ format listing 240 foods; assessed energy intake, 10 food groups, and main nutrients.
NS* = Not Specified

127
Table 5.2. Summary Table: Studies of school age populations, continued Assessment Method
Num
ber
(n)
Age
(yea
rs)
Eth
nica
lly D
iver
se
Lon
gitu
dina
l Stu
dy
Cro
ss se
ctio
nal S
tudy
Whe
d Fo
od R
ecor
d (n
o. d
ayei
gs)
ed
ec
o
uppl
eme
ake
M
Est
imat
Food
R
rd (n
o. d
ays)
24-H
our
Rec
all (
n)
FFQ
Typ
e
Oth
er Q
uest
ionn
aire
Nut
rien
t Bio
mar
kers
Snt
Int
Ass
essm
ent
etho
d
Outcomes National Surveys, continued
General Mills Dietary Intake Study, Market Research Corporation of (MRCA) Menu Census Panel Surveys 1980-1992 (229)
1,946 11-18 NS
14d
NS
Four cross-sectional surveys evaluated dietary calcium intake over a 12-year period; serving size information not collected
Population Studies of Food and Nutrient Exposures
The Bogalusa Heart Study-21 years, Bogalusa, LA (192;212;230;231) 1,562 10 1 NS
Cross-sectional sample of 10 year olds over 21 years evaluated 24HR and lipid and cardiovascular screening; food and nutrient intake assessed
Study of Children’s Activity and Nutrition Project (SCAN), 2002 (213) 228 4-12
2 per 6mo
NS 24HR with observation of lunch and dinner and interview of primary food preparer for children 4-7 years, and standard 24HR for children 11-12 yrs.
Tracking energy, % fat kcal, sodium intake over 8 years using modified
Child and Adolescent Trial for Cardiovascular Health (CATCH), 2002, California, Texas, Minnesota, California (214;232)
1,874 8-14 1d
3x 3 NS
Three Food Record assisted 24HR at baseline (3rd grade) and follow-up at 5th and 8th grade assessed energy and nutrient intake and compared (3rd and 5th grade) energy intake cholesterol, dietary fat, fatty acid intake, and dietary fiber with serum lipids and height and weight.
NS* = Not Specified

128
Table 5.2. Summary Table: Studies of school age populations, continued
Assessment Method
Num
ber
(n)
Age
(yea
rs)
Eth
nica
lly D
iver
se
Lon
gitu
dina
l Stu
dy
Cro
ss se
ctio
nal S
tudy
Whe
d Fo
od R
ecor
d (n
o. d
ayei
gs)
ed
ec
oE
stim
atFo
od
Rrd
(no.
day
s)
24-H
our
Rec
all (
n)
FFQ
Typ
e
Oth
er Q
uest
ionn
aire
N
utri
ent B
iom
arke
rs
Supp
lem
ent I
ntak
e A
sses
smen
t Met
hod
Outcomes Population Studies of Food and Nutrient Exposures, continued
DONALD Study, 1985-2000 (Germany) (154;155;233;234) 787 2-18 3d NS
Energy and nutrient intake (total vs. fortified foods), growth.
Food Intake and Obesity in Italian School Children, 2000 (235) 530 7-11 NS
Diet History interview of mother and child assessed usual weekly food intake; diet composition compared with child’s adiposity and parents BMI
Growing Up Today Study (GUTS), US, 1996-1999 (236-239)
10,769-16,882 9-14 95%
C
Youth Adol. Quest.
(YAQ) 132- item
YAQ
Survey of offspring of participants in Nurses Health Study II examined energy, dietary patterns, physical activity and weight change over 1 yr (236); energy and nutrient intake (237); self reported height, weight, and Tanner Index (by drawings); 18 questions on physical activity; changes in fruit and vegetable consumption and changes in BMI over a 3-yr period (238;239)
Survey of Ylivieska, Finland School Children, 1999 (240) 404 10-11 NS 55-item NS
Food intake and meal patterns; parents and children completed FFQ and Child Behavior Checklist (screens for behavioral and emotional problems)
Gimme 5 School Health Program, Georgia (241;242) 640 8-12 7d none Fruit and vegetable intake
NS* = Not Specified

129
Table 5.2. Summary Table: Studies of school age populations, continued
Assessment Method
Num
ber
(n)
Age
(yea
rs)
Eth
nica
lly D
iver
se
Lon
gitu
dina
l Stu
dy
Cro
ss se
ctio
nal S
tudy
Whe
d Fo
od R
ecor
d (n
o. d
ayei
gs)
ed
ec
oE
stim
atFo
od
Rrd
(no.
day
s)
24-H
our
Rec
all (
n)
FFQ
Typ
e
Oth
er Q
uest
ionn
aire
N
utri
ent B
iom
arke
rs
Supp
lem
ent I
ntak
e A
sses
smen
t Met
hod
Outcomes Population Surveys of Food and Nutrient Exposures, continued
Coronary Artery Risk Detection in Appalachian Communities, 1998-1999, West Virginia (243) 325 10-12 NS
YAQ 143 item past mo.
NS
Energy, total fat, and saturated fat intake; socio-demographic and environmental variables; nutrition knowledge (assessed by 10-item questionnaire adapted from CATCH)
National Heart and Lung Growth and Health Study, 1997, US (244) 2,379 9-10 3d
NS
Food and energy intake, eating practices, and snacking practices; Nutrition Patterns Questionnaire collected on nutrition patterns and practices.
Survey of Children on Mexico-US Border, Mexico, 1997 (245) 3,325 9-11
36 item Interv.-Admin.
NS Food intake (fruits, vegetables, soft drinks, high fat snacks, sweets).
Active Programs Promoting Lifestyle Education in Schools, 1996-97 Leeds, UK (246;246) 636 7-11 3d 2 NS Food groups (fruits, vegetables,
high fat, high sugar); BMI
Dietary Intervention Study in Children (DISC), 1993-1997, 6 US Clinical Centers (215;247) 663 8-10
3x per 6-12
mo.
NS
Three 24HR (2 by telephone) at baseline, 12, and 36 mo and also at 6 mo in feasibility study assessed energy, nutrient, and food intake; total cholesterol, LDL-cholesterol, and HDL-cholesterol measured.
NS* = Not Specified

130
Table 5.2. Summary Table: Studies of school age populations, continued
Assessment Method
Num
ber
(n)
Age
(yea
rs)
Eth
nica
lly D
iver
se
Lon
gitu
dina
l Stu
dy
Cro
ss se
ctio
nal S
tudy
Whe
d Fo
od R
ecor
d (n
o. d
ayei
gs)
ed
ec
oE
stim
atFo
od
Rrd
(no.
day
s)
24-H
our
Rec
all (
n)
FFQ
Typ
e
Oth
er Q
uest
ionn
aire
N
utri
ent B
iom
arke
rs
Supp
lem
ent I
ntak
e A
sses
smen
t Met
hod
Outcomes Population Surveys of Food and Nutrient Exposures, continued
Survey of Calcium Intake of Italian School Children, 1995 (248) 35,000 7-10 116
item NS
Parents assisted children in completing FFQ for previous 6 mo intake; calcium intake assessed.
Fleurbaix Laventie Ville Sante Study (FLVS), 1993 (249) 501 5-11 1 NS
Energy intake; % kcal from complex CHO, protein, total fat, and saturated fats; anthropometric measurements
Fleurbaix Laventie Ville Sante Study (FLVS), 1993 (249) 501 5-11 1 NS
Energy intake; % kcal from complex CHO, protein, total fat, and saturated fats; anthropometric measurements
Northumbrian Study of Children 11-12 Years, 1980-1990, UK (250) 379 11-12 3d NS
Height, weight, energy and nutrient intakes.
NS* = Not Specified