5. standard deviations
TRANSCRIPT
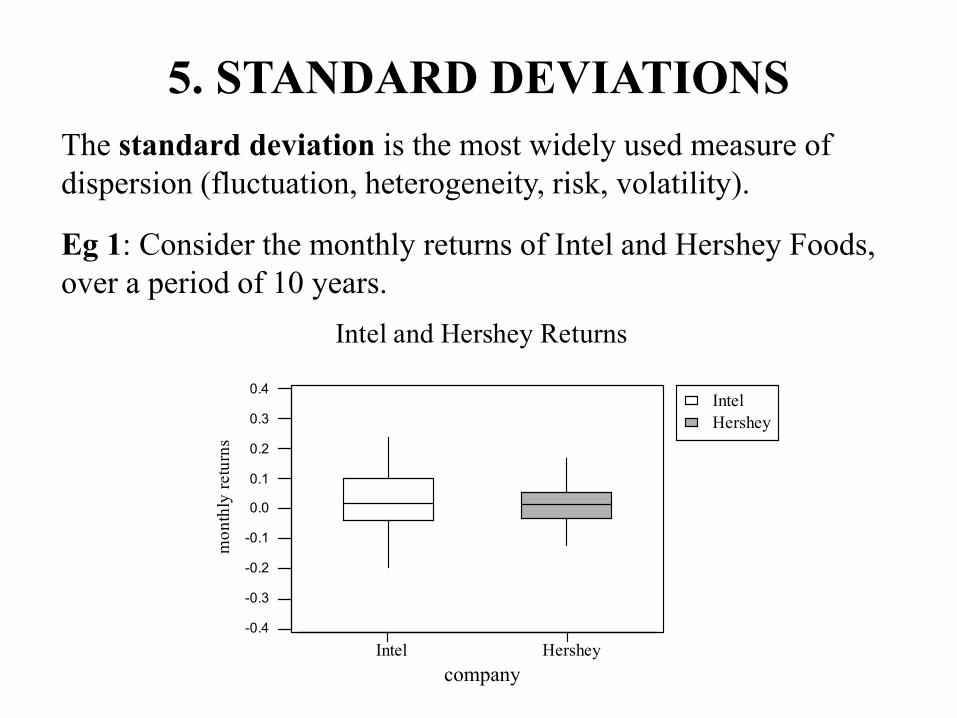
5. STANDARD DEVIATIONSThe standard deviation is the most widely used measure of dispersion (fluctuation, heterogeneity, risk, volatility).
Eg 1: Consider the monthly returns of Intel and Hershey Foods, over a period of 10 years.
HersheyIntel
Intel Hershey
0.4
0.3
0.2
0.1
0.0
-0.1
-0.2
-0.3
-0.4
company
mon
thly
retu
rns
Intel and Hershey Returns

The boxplots indicate that Intel has a higher mean return, but is much more volatile than Hershey.
Which stock is a better investment?
To answer this, we need a more refined measure of risk. The IQR is not adequate here, since it ignores the most extreme 50% of the returns.
These are the months of the largest profits and losses!
The standard deviation uses all available data, and therefore provides a more sensitive measure of volatility.
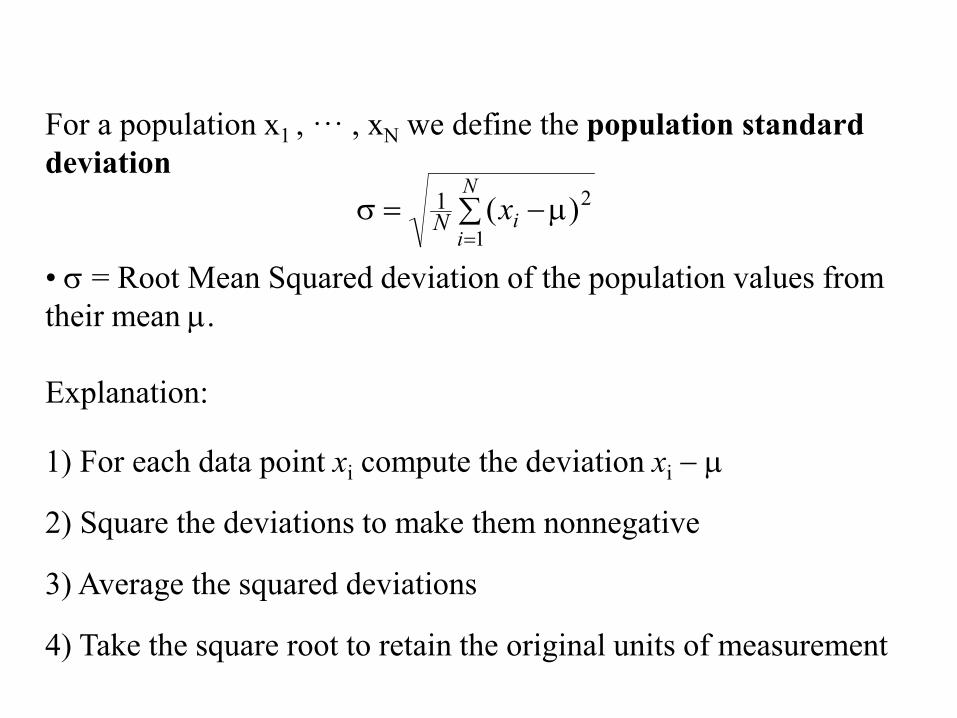
For a population x1 , ··· , xN we define the population standard deviation
• σ = Root Mean Squared deviation of the population values from their mean µ.
Explanation:
1) For each data point xi compute the deviation xi − µ
2) Square the deviations to make them nonnegative
3) Average the squared deviations
4) Take the square root to retain the original units of measurement
∑ µ−=σ=
N
iixN
1
2)(1
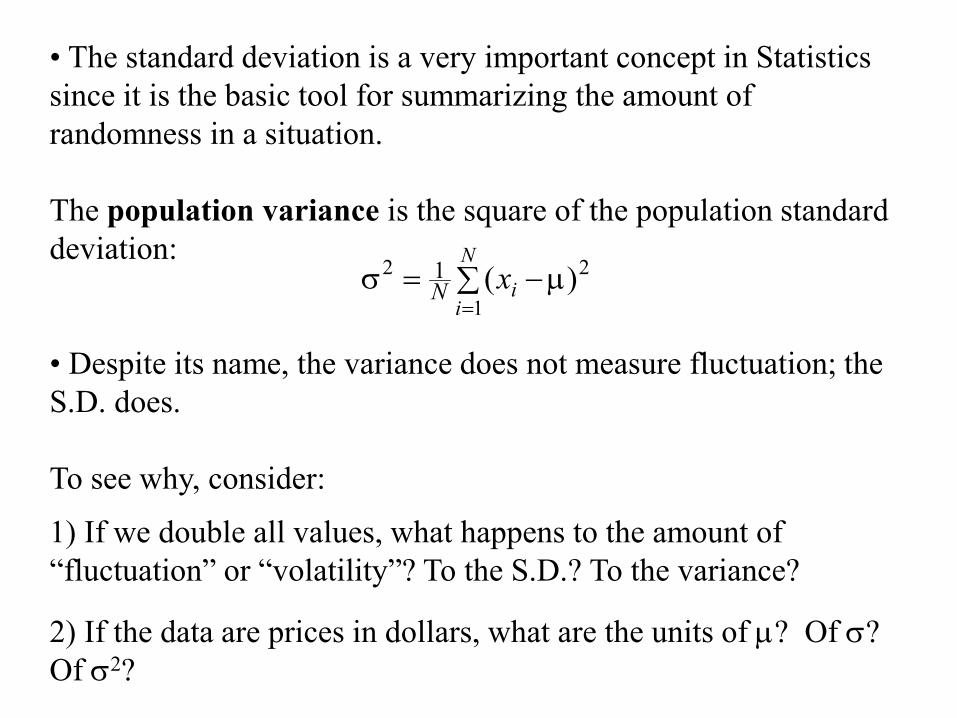
• The standard deviation is a very important concept in Statistics since it is the basic tool for summarizing the amount of randomness in a situation.
The population variance is the square of the population standard deviation:
• Despite its name, the variance does not measure fluctuation; the S.D. does.
To see why, consider:
1) If we double all values, what happens to the amount of “fluctuation” or “volatility”? To the S.D.? To the variance?
2) If the data are prices in dollars, what are the units of µ? Of σ? Of σ2?
∑ µ−=σ=
N
iixN
1
22 )(1

• Variance is nevertheless sometimes used in Finance for measuring risk.
Given a sample x1, ··· , xn from the population, we ask: How much do the data values fluctuate from their mean, ?
Measure the dispersion of a sample by the sample standard deviation:
The square of the sample standard deviation,
is called the sample variance.
Again, s2 does not measure dispersion; s does.
x
∑ −==
−n
ii xxs n
1
2)(11
∑ −==
−n
ii xxs n
1
22 )(11

• Reason for using n − 1: To ensure that s2 neither underestimates nor overestimates σ2, on the average.
[R Demo: SampleVariance]
• Aside from the n − 1, there is a strong similarity between the definitions for s and σ.

Eg 2: The earnings per share (EPS) for FedEx in the first quarter were $2.66, failing to meet analysts' expectations of $2.70(consensus forecast). The earnings surprise for FedEx was 2.66 − 2.70 = −.04. Is this bad compared to the earnings surpriseof five other NYSE companies observed in a similar time period?

Company Surprise
Kroger .04
Red Hat .04
Rite Aid .02
Pier 1 .00
Oracle −.08

Preliminary Calculations: The other earnings surprise values are .04, .04, .02, 0, −.08. The sample mean is
The sample variance is
The sample standard deviation is
How does this help us put the surprise for FedEx (−.04) into context? We’ll return to this later, after we define the Z-score.
])004.08.()004.0()004.02(. 222 −−+−+−+
.0498.00248. ==s
.004.5/02.)08.002.04.04)(.5/1( ==−+++=x
.00248.4/00992. ==
222 )004.04(.)004.04)[(.4/1( −+−=s

Risk-Adjusted Returns and Portfolio Analysis
In Finance, the risk-adjusted return for an investment is defined as the ratio of the mean to the standard deviation. This can be usefulfor selecting a portfolio.
In Example 1, we considered the monthly returns for Intel Corp andHershey Foods. Let’s also consider a portfolio consisting of an equal dollar amount of the stocks.

Hershey Intel
Portfolio
PortfolioIntel Hershey
0.4
0.3
0.2
0.1
0.0
-0.1
-0.2
-0.3
-0.4
Type
Ret
urns
Intel, Hershey, and Portfolio Returns
The investments performed as follows:
Intel Hershey PortfolioMean Return, 0.0169 0.0089 0.0129Standard Deviation, s 0.1349 0.0735 0.0826Risk-Adjusted Return , 0.1253 0.1211 0.1562
x
sx
Intel had a higher mean return (1.7% per month) than Hershey (0.9% per month), but Intel was much more volatile. In terms of risk-adjusted return, the two stocks are roughly equivalent, and both are inferior to the portfolio.
Note that the portfolio provides a mean return which is the average of that of the two stocks, but achieves (through diversification) a standard deviation close to that of the less risky stock, Hershey.
The main point of diversification is to reduce risk, and herethe portfolio achieved this goal.

Z-ScoresSuppose x is a value, or “score”, which we wish to compare to a data set with mean (or µ) and standard deviation s (or σ).x may or may not be a part of the data set.
Define the z-score for x as or
• The z-score tells us how many standard deviations x is from the mean.
• The further z is from zero, the more “atypical” x is, relative tothe given data set. In fact, the “empirical rule” states that for normal distributions:
about 68% of the data values will have z-scores between ±1, about 95% between ±2, and about 99.7% (i.e., almost all) between ±3.
x
sxxz −=
σxz µ−
=

Thus, for example, roughly 95% of the data should lie within two standard deviations of the mean, that is, in the interval
The empirical rule is only exactly correct for normal distributions (using known population means and variances), but in some cases it provides a useful approximation, even for non-normal distributions.
It is worth memorizing the empirical rule.
)2 ,2( sxsx +−
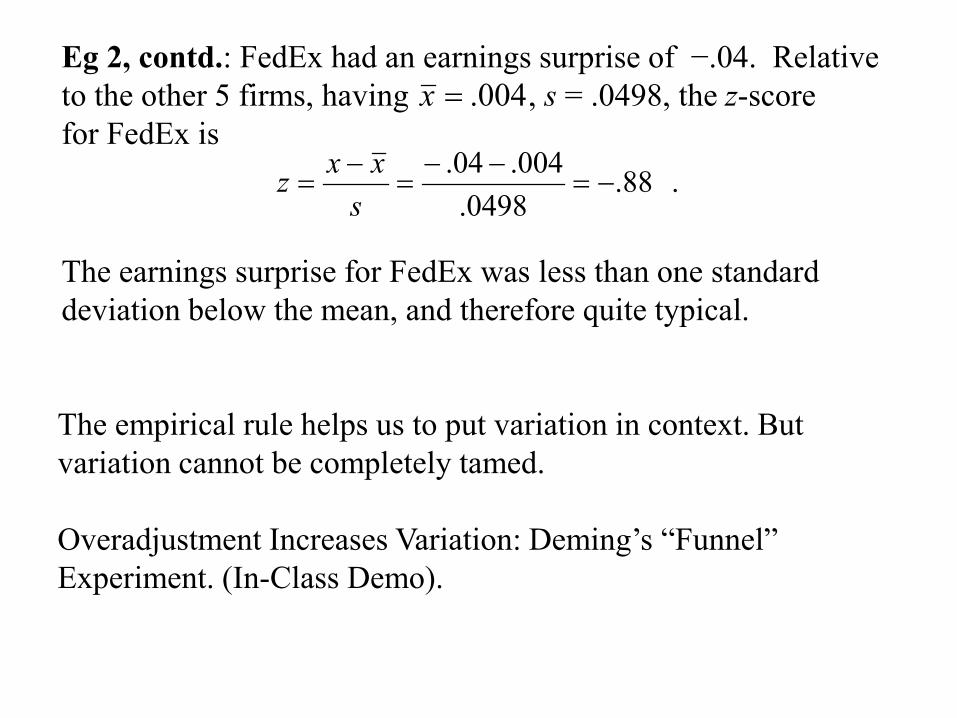
Eg 2, contd.: FedEx had an earnings surprise of −.04. Relative to the other 5 firms, having , s = .0498, the z-scorefor FedEx is
The earnings surprise for FedEx was less than one standard deviation below the mean, and therefore quite typical.
004.=x
. 88.0498.
004.04.−=
−−=
−=
sxxz
The empirical rule helps us to put variation in context. But variation cannot be completely tamed.
Overadjustment Increases Variation: Deming’s “Funnel” Experiment. (In-Class Demo).

Eg: Consider the daily returns on the Dow.

Minitab’s descriptive statistics gives the following output.
Using Calculator in Minitab, we find that the proportion of all observations within 1, 2, 3 standard deviations of the mean is 0.814, 0.955, and 0.982. Compared with Empirical Rule, there is too much data in the middle and too much data in the tails.
The daily return on the Dow for the day of March 16, 2020 was −0.129. The corresponding z-score for that day was −11.5. This is an amazingly large z-score for supposedly normally distributed stock returns, as we will discuss later.
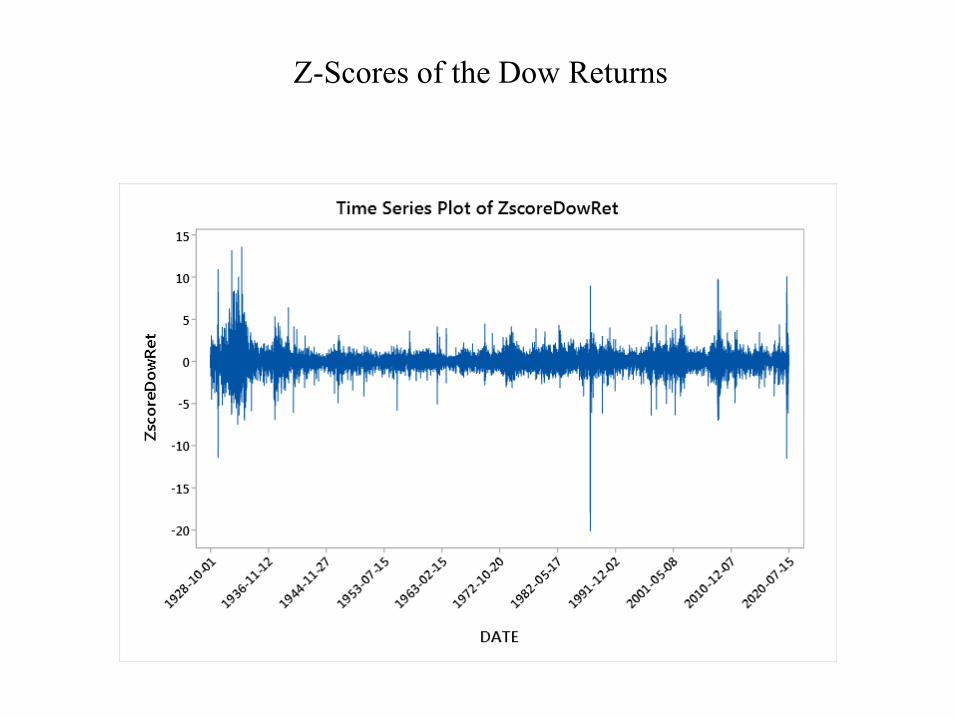
Z-Scores of the Dow Returns

The New York Times, January 3, 1991
Variability in PracticeEg: The natural variability in temperatures.