50. analysis of downhole logs, leg 57, deep sea drilling ... · porosity calculation from the...
TRANSCRIPT

50. ANALYSIS OF DOWNHOLE LOGS, LEG 57, DEEP SEA DRILLING PROJECT
Takao Saki, Japan National Oil Corporation, Tokyo, JapanEiichi Honza, Geological Survey of Japan, Tsukuba, Japan
Roland von Huene, U. S. Geological Survey, Menlo Park, CaliforniaNoriyuki Nasu, Ocean Research Institute, University of Tokyo, Tokyo, Japan
andYasufumi Ishiwada, Japanese National Oil Corporation, Tokyo, Japan
INTRODUCTION
All sites drilled on Leg 57 were logged as weatherconditions permitted. The logging was done by the Sing-apore office of Schlumberger, and because of shortnotice the special logging tools required to pass throughthe Challenger drill pipe were not available. The stan-dard centralizer, excentralizer, and caliper tools werenot appropriate, and those modified aboard ship werenot completely satisfactory. In addition, we suspectedthat vertical motion from the ship's heave degraded thequality of logs. Both the sonic and neutron density toolswere operated beyond their normal working ranges. De-spite these operational difficulties, the logs from dif-ferent runs in a hole, both repeat sections and runs withdifferent tools, show generally the same features. Overintervals of 5 to 10 meters the field logs seem to be goodindicators of the physical character of the section pene-trated (Carson and Bruns, this volume).
The recovery of continuous core as well as logs dif-fers from normal industrial drilling practice, in which amajor purpose of logging is to establish lithology. Sincelithology is best established by direct examination, thelog analysis focused less on identifying a specific li-thology than on continuous measurement of in situphysical properties, especially at Sites 438, 439, and 440,where recovery was good. However, the logs were usedto establish the lithology of missing intervals, especiallyat Site 441, where recovery was poor. Lithology andphysical properties aspects of the log analysis are cov-ered in the individual site chapters and in a comparativeanalysis of laboratory measurements of physical proper-ties and logged physical parameters (Carson and Bruns,this volume). In the present chapter we concentrate onlog precision, correlation of key horizons in seismicrecords and core lithology, and on fracturing as indi-cated by the logs. We do this by using the results of astudy of corrected logs and the derivative products fromcomputer programs developed by the Scientific Soft-ware Corporation (SSC) and Technology Research Cen-ter and of corrected logs from Schlumberger (availablefrom DSDP).
DATA ANALYSIS PROGRAM
The analytical programs developed by the SSC andTRC, JNOC were used to make the following calcula-tions (see Table 1 for abbreviation of log names and pa-rameters):
1) Correction of bulk density log (RHOB) for a mea-sured or an assumed change in borehole diameter.(RHOC)
2) Correction of gamma ray log (GR) for changes ofborehole diameter and for corrections of mud water andwater density (when possible, the hole was filled withmud for logging). (GRCO)
3) Calculation of porosity from the sonic (PHIS) andthe formation density (PHID) logs and calculation ofthe sonic compaction factor (CP).
4) Calculation of velocity (VEL) from the sonic log.5) Calculation of cross plots.6) Check of time-depth relationships and calculation
of synthetic seismograms.The analog log traces produced on the ship were first
digitized manually at 2-mm intervals on the trace, whichis equal to 40 cm in the hole, and a digital tape compiledin a format compatible with the SSC program. Duringcompilation some noise was rejected and the dataresampled at an interval equivalent to 1 meter in thehole. The tape was then run with the SSC program. Theinput and output are given in Table 1, although not alloutput products are presented.
The borehole compensated sonic (DLT), correctedformation density (RHOC), and compensated neutronporosity (PHIN) were used to calculate porosities.
Porosity from sonic data in the clean sandstone (Φss)was calculated using the Wyllie time-average equation(Wyllie et al., 1956, 1958)
Δ// — Atma
where Δ, is a reading of the sonic log, Atma is sonic tran-sit time of the formation matrix, and Δ,/is sonic transittime in the sea water. When the shaly (muddy) materialis contained, the equation becomes
At
sh- tma
where Φs is sonic porosity, Vsh is shale fraction, and Atsh
is sonic transit time of the shale.We considered zero for Φss and 1 for Vsh, since most
of the section drilled was mud or mudstone, whichresulted in use of the upper, simple equation. We used205 µs/ft. (1.49 km/s) for Atf and 55.5 µs/ü. (5.49km/s) for Alma in the analysis. Direct application of the
1169

T. SAKIETAL.
TABLE 1Logging Data, Site 438-441
Abbreviation
DLT ( T)RHOB (pb)RHOC (pc)GRGRCOPHIN (0n)TEMPCALRLLDVELPHID (0d)PHIS (0s)CPMPLTNPLT
WaterDepth (m)
GRRLLDCALRHOBDLTPHINTEMP
GRCORLLDCALRHOCDLTPHINTEMPPHISPHIDCPVELM-NLITH-OLOGYSEISMO-GRAM
Logging Data
Term
Borehole Compensated !Formation DensityCorrected RHOBGamma RayCorrected GRNeutron PorosityTemperatureCaliperDual Laterolog DeepVelocity from SonicPorosity from DensityPorosity from SonicCompaction Factor
M-N Plot
Unit
Sonic µsec/ftg/ccg/ccAPI unitAPI unit%°Cinch
n -mkm/s%%
Input Data and Logging Interval (m)
Hole 438A Hole 439
1558 1666
1675-2400 1765-26001675-2420 1850-2600
— —1675-2420 1765-26201675-2420 1775-27501675-2424 1765-26001500-2430 1600-2600
Output
Hole 43 8A Hole 439
a aa ab b
a aa aa aa aa aa aa aa ac c
d d
d d
?Tlot and List.— = no data
C T *
dPlot'.
Hole 440B Hole 441A
4507 5646
4625-5249 5763-6223- -
4627-52494625-5274 5763-62234625-52494624-52754510-5004
Hole 440B Hole 441A
a a_b _ba _b
a aa _ba _ba __ba _ba _ba _ba _bc _b
d c
d _b
Average Geothermal Gradient (uncorrected, °C/100m)
1600-24001750-25504550-2950
Hole 438A Hole 439
2.952.64
Hole 440B
1.41
Wyllie equation gives values of porosity which are toohigh in unconsolidated and insufficiently compactedlayers. Such lack of compaction may be present inshales exhibiting Δ, values greater than 100 µs/ft. Whenformations are not sufficiently compacted, the observedΔ, values are greater than 100 µs/ft., which would cor-respond to the porosity according to the Wyllie equa-tion. An empirical compaction factor CP is applied to theWyllie equation to give a corrected porosity (Φsc)•
Ar - A[ma 1
Alf ~ Atma C P .
The values of CP are best determined by comparingΦs with the true porosity. Because we used Φd (porosityfrom the density log) instead of true porosity, the com-paction factor (CP) is expressed as follows,
C P = Φs/Φd •
Porosity calculation from the formation density log(Φd) is similar to that from the sonic log,
+ KQsh
Qma ~ Qf
where Φds is clean sandstone porosity ( = 0 ) , Vsh is shalefraction (– 1), ρma is formation matrix density ( =2.65), ρf is formation water density ( = 1.0), and ρsn is areading from the log.
The porosity calculated from the density log is sen-sitive to total porosity (including vuggy and/or fractureporosity); the porosity calculated from the sonic logcannot detect vuggy and/or fracture porosity but is sen-sitive largely to intergranular porosity.
The secondary porosity index (SPI) may be computedas the difference between total porosity as determinedfrom the neutron and/or density log (Φ) and a correctedporosity from the sonic log results, using the followingequation:
SPI = Φ - Φsc •
Neutron porosity logs respond primarily to theamount of hydrogen present in the formation. In a"clean formation" whose pores are filled with water theneutron logs indicate directly the amount of water-filledporosity. When the shaly (muddy) materials are present,values of (</>„) are obtained by
Φn = Φ + ysh Φnsh >
where Φ is true porosity (clean sand porosity) and Φnsh isthe logged value when Vsh (shale fraction) equals 1. Thevalue of Φnsh depends on the type of shale, the compac-tion, and the type of tool.
On Leg 57, the formation was essentially mud or mud-stone, and although the neutron log was not useful inestimating the formation porosity, it did indicate a com-paction effect.
1170

DOWNHOLE LOGS ANALYSIS
Other calculations, such as crossplots of DLT/RHOBand M-N plots, were made, but not all are shown here.The log-derived lithologies were compared with smearslide summaries.
Reflection coefficients for a given horizon (R) werecalculated from the sonic velocity (V) and correctedbulk density (ρ) results using the following equation:
V2ρ2 - VlQl
R =
2Q2 + V\Q\
where K,ρ, is the acoustic impedance of the upper layerand V2ρ2 is the impedance of the lower layer. Syntheticseismograms were constructed using the reflection coef-ficients by convolution of a 30-Hz Ricker wavelet. Thetime-depth conversion was derived from a few points oftime-depth calibration points and integration of thesonic log curves.
DESCRIPTION OF LOG AND DERIVATIVE PLOTS
The data input and derivative output are summarizedin Table 1. Certain operational problems that affect thelogs should be noted. Only one caliper log was obtained(Site 440). This log indicates general enlargement of theupper parts of the hole. In addition it shows abrupt holediameter changes, usually of 1 inch and sometimes of 3inches. Hole diameter varies between about 11 (bit size)and 15.5 inches (28 and 40 cm). This is considered arough hole for logging, particularly if the springs thathold a tool against the side of the hole are weak. Thusthese logs were significantly affected by contact betweenthe tool and the side of the hole and by hole diameter.Abrupt washout cannot be strictly correlated withlithology, because drilling fluid (sea water) was cir-culated for about 20 minutes at positions about 9.5meters apart during "pump down" of a core barrel,thus exposing various intervals to greater than normalcirculation. In the holes where the correction for holediameter was assumed but not measured (438, 439, and441), there may be an effect from uncompensated wash-out; however, such an effect is not apparent from thelog interpretations for Sites 438, 439, and 441 (Figures1-3).
The sonic log showed signs of cycle-skipping that ap-peared obvious in the field prints. Cycle-skippinggenerally occurs when the sonic signal is strongly at-tenuated by unconsolidated formations, formation frac-ture, and gas saturation, causing a very abrupt and largeexcursion toward higher DLT values. Perhaps somecycle-skipping occurred when the tool was not in con-tact with the hole. Most effects from cycle-skippinghave been removed in the environmentally correctedlogs shown in Figures 1 through 3). This is verified bycomparing logged velocity and laboratory measure-ments of velocity on the core.
A description of the character of the logs from eachsite follows. We have grouped those from Sites 438 and439.
Sites 438 and 439
The site chapter for Site 439 discusses the good corre-lation among all logs from 438 and 439. The similarityof trends, the corresponding events in all the logs from ahole, and the good correlation between two holes 6 kmapart argue for the general validity of the gamma ray,sonic, formation density, and temperature log data de-spite operational difficulties. The dual laterolog deep(RLLD) and neutron porosity log (PHIN) have less"character" than other logs, perhaps because of theuniform water-saturated muddy lithology. More char-acter is apparent on large-scale printouts than on thosein Figures 1 and 2.
The general character of a log trace corresponds wellwith lithology.
Sub-unit 2A, a homogenous unit, is characterized bya smooth curve and uniform values of bulk density andsonic velocity. Some spikes on the log curves areperhaps the response of a goup of thin volcanic ashlayers.
Sub-unit 2B has heterogenous lithology because itmarks the beginning of diagenetic changes and in-creased compaction; the corresponding log traces areconsiderably more variable. Generally, density andvelocity curves increase with depth, but at the lowerparts of Site 439, there may be a slight decrease densitycurve with depth.
Sub-unit 2C consists of thicker units and numerouslimestone layers; the corresponding traces show a shortperiod variability superimposed on a long period wan-der. Sonic velocity generally increases with depth, but inthe lower part of this unit, bulk density decreases withdepth. At the boundary between Units 2 and 3, the pro-nounced change in lithology is marked by a pronouncedshift in all the log traces. In Unit 3, both density andsonic velocity increase with depth. For greater detail,the reader is referred to the logs available at DSDP.
The in situ physical properties correspond generallyto those measured on core analysis in the laboratory(Carson and Bruns, this volume). Sonic velocity at Site438 ranges from 1.5 to 1.9 km/s in Unit 2 and shows ageneral smooth increase with depth. Unit 2 is deeper at439 and has a correspondingly higher range (1.5-2.2km/s). Units 3 to 5 range from 2.1 to 2.8 km/s.
The laboratory-measured density values are system-atically lower (0.2 - 0.3 mg/m3) than the formation den-sity log values. We have no adequate explanation forthis offset, but the two types of measurement reflect thesame trend.
In the calculated porosity for both Sites 438 and 439,the traces are separated by about 40 per cent at the up-per end of the derivative plot and gradually converge atthe lower end of the logging interval. The convergencewith increasing depth may be caused by increasing com-paction, which tends to minimize the calculated dif-ferences.
Cross plots of sonic transit time vs. formation density(DLT/RHOB), and M-N show some general trends of
1171
T. SAKIETAL.
100
150
200
250
300
350
400
RLLD
GRCO
120 DLT 220 0 TEMP 30
0.5 RHOC 2.5 0
^J>
PHIN 100
II 0.
PHID 100 1 VEL 3
,,,,
!,,,
,!,,
,,1
,,,,
ΠH
IIM
III,,,!,.,,
. i l
...
l .
l i I
4
""
i""
i""
r "•
—
11 |
11
i 11
i
2A
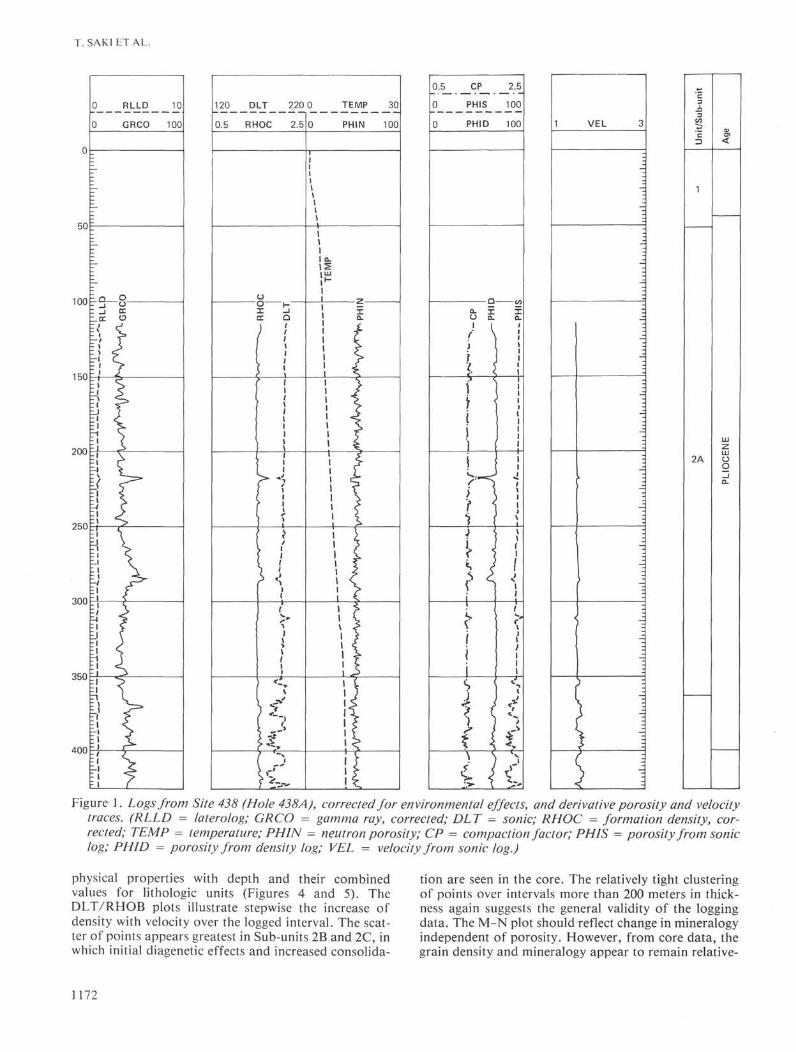
Figure 1. Logs from Site 438 (Hole 438A), corrected for environmental effects, and derivative porosity and velocitytraces. (RLLD = laterolog; GRCO = gamma ray, corrected; DLT = sonic; RHOC = formation density, cor-rected; TEMP = temperature; PHIN = neutron porosity; CP = compaction factor; PHIS = porosity from soniclog; PHID = porosity from density log; VEL = velocity from sonic log.)
physical properties with depth and their combinedvalues for lithologic units (Figures 4 and 5). TheDLT/RHOB plots illustrate stepwise the increase ofdensity with velocity over the logged interval. The scat-ter of points appears greatest in Sub-units 2B and 2C, inwhich initial diagenetic effects and increased consolida-
tion are seen in the core. The relatively tight clusteringof points over intervals more than 200 meters in thick-ness again suggests the general validity of the loggingdata. The M-N plot should reflect change in mineralogyindependent of porosity. However, from core data, thegrain density and mineralogy appear to remain relative-
1172

DOWNHOLE LOGS ANALYSIS
450
500
550
600
650
700
750
800
RLLD 10
GRCO 100
120 DLT 220 0 TEMP 30
0.5 RHOC 2.5 0 PHIN 100
850
Figure I. (Continued).
ly constant. Thus the shifts in M-N plots for each unitmust also reflect other changes.
Site 440
Because logging at Site 440 was done during stormyconditions, the large swells must have been superim-posed on the logs to some degree as motion during therun. The suite of logs is responsive to physical changesthat result from fracture, synsedimentary folding, and,
0.5 CP
0 PHIS
0 PHID
2.5
100
100
y
\)>•s
flit
)
Ijr.
5 c\ <^ (> I
i
<
(
> IU 0.
\ >
1i
I<
s
>
<
fti<(j
i
*Λ
v <Λ
a.
VEL
Un
it/S
ub
-un
it
2B
2C
3
Ag
eU
PP
ER
MIO
CE
NE
L.M
.MIO
CE
NE
perhaps, secondary porosity. Considered together withthe lithology of a well-recovered suite of core, the logsshow important changes from the physical conditions atthe top of the Japan Trench slope at Sites 438 and 439.The logs and the measurements of physical propertiesare in good agreement (Carson and Bruns, this volume).
The caliper log is a key log because it shows a largewashout that affected the values (Figure 3). The hole ap-pears relatively smooth but of oversized diameter
1173

T. SAKIETAL.
50
100
150
200
250
300
350
400
450
500 E
550
0_ RLLD 10
0 GRCO 100
f)
120 DLT 220 0 TEMP 30
0.5 RHOC 2.5 0 PHIN 100 PHID 100 1 VEL 3
A
<
j
in 111111 j11 iT
pm11
""
1"
" 1"" |"
"
...i
t..1
.1..
..!.
...
i \
2A
2B
Figure 2. Logs from Site 439, corrected for environmental effects, and derivative porosity and velocitytraces. (RLLD = laterolog; GRCO = gamma ray, corrected; DLT = sonic; RHOC = formation den-sity, corrected; TEMP = temperature; PHIN = neutron porosity; CP = compaction factor; PHIS =porosity from sonic log; PHID = porosity from density log; VEL = velocity from sonic log.)
1174

DOWNHOLE LOGS ANALYSIS
0.5 CP 2.5 ~. — . — c
0 RLLD 10 120 DLT 220 0 TEMP 30 0 PHIS 100 J_ _ _ _ - 3
0 GRCO 100 0.5 RHOC 2.5 0 PHIN 100 0 PHID 100 1 VEL 3 £ β
I I c a
O <
600^ <^ * à S . J• I 1 -; 2B
650^-5 1 | j f 1 T \ \ |z1 "\_ 5 ' •' ? i - ^r? 3" $ I \ / i •: J
-' c. ^ ' ?' y ' ' Q
700^ 5 <X V-T <Lf'% f \
750 H — ^ •£\ ?—1— 7—f-*— ( ^
800^4 ^ 1 ^± L 1 > Zi ( :
850 =4—-J —i?—f A—1— — ^ S?*— T: ^
H V ^ r i 1 I % ) ^900 [v• % "c—1—f—p ~ g — —)—I ~[i i i i » I f^ U i
950^ — ^ - ^ S
r s ^ i I1000 E :
1050 E : w
L ^ oLI I I I I I 1 I J LLJ
ü<111oco
6
Figure 2. (Continued).
1175
T. SAKIETAL.
Or
5 0 :
100
150
200
250
300
350
CAL 15
GRCO 100
120 DLT 220 0 TEMP 30
0.5 RHOC 2.5 0 PHIN 100 VEL
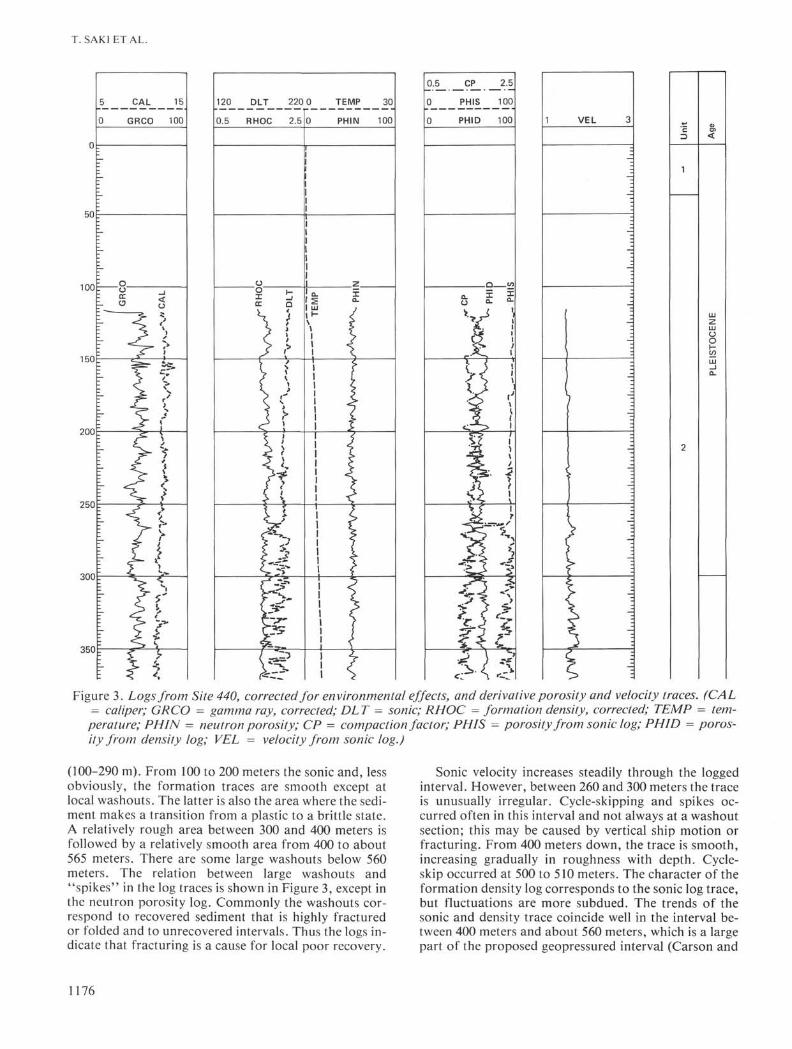
Figure 3. Logs from Site 440, corrected for environmental effects, and derivative porosity and velocity traces. (CAL= caliper; GRCO = gamma ray, corrected; DL T = sonic; RHOC = formation density, corrected; TEMP = tem-perature; PHIN = neutron porosity; CP = compaction factor; PHIS = porosity from sonic log; PHID = poros-ity from density log; VEL = velocity from sonic log.)
(100-290 m). From 100 to 200 meters the sonic and, lessobviously, the formation traces are smooth except atlocal washouts. The latter is also the area where the sedi-ment makes a transition from a plastic to a brittle state.A relatively rough area between 300 and 400 meters isfollowed by a relatively smooth area from 400 to about565 meters. There are some large washouts below 560meters. The relation between large washouts and"spikes" in the log traces is shown in Figure 3, except inthe neutron porosity log. Commonly the washouts cor-respond to recovered sediment that is highly fracturedor folded and to unrecovered intervals. Thus the logs in-dicate that fracturing is a cause for local poor recovery.
Sonic velocity increases steadily through the loggedinterval. However, between 260 and 300 meters the traceis unusually irregular. Cycle-skipping and spikes oc-curred often in this interval and not always at a washoutsection; this may be caused by vertical ship motion orfracturing. From 400 meters down, the trace is smooth,increasing gradually in roughness with depth. Cycle-skip occurred at 500 to 510 meters. The character of theformation density log corresponds to the sonic log trace,but fluctuations are more subdued. The trends of thesonic and density trace coincide well in the interval be-tween 400 meters and about 560 meters, which is a largepart of the proposed geopressured interval (Carson and
1176

DOWNHOLE LOGS ANALYSIS
400
450
500
550
600
650
700
750
CAL 15
GRCO 100
120 DLT 220 0 TEMP 30
0.5 RHOC 2.5 0 PHIN 100
t
Figure 3. (Continued).
Bruns and Arthur et al., this volume). The decrease indensity discussed by these authors is best seen in the CPtrace (Figure 3) and on the full-scale logs, particularly atthe scale of the field print.
It may be instructive to note that the values of thePHID trace increase to about 550 meters and only thenbegin to decrease, another supporting argument for thedevelopment of secondary porosity. The PHIS trace hasan opposing trend to 400 meters, where both traces runparallel and at a nearly constant value to 560 meters andthen slowly converge. The adjacent velocity shows a
_CP_ 2.5
PHIS 100
PHID 100 VEL
similar interval of constant value between 400 and 560meters as the sonic derivative porosity trace.
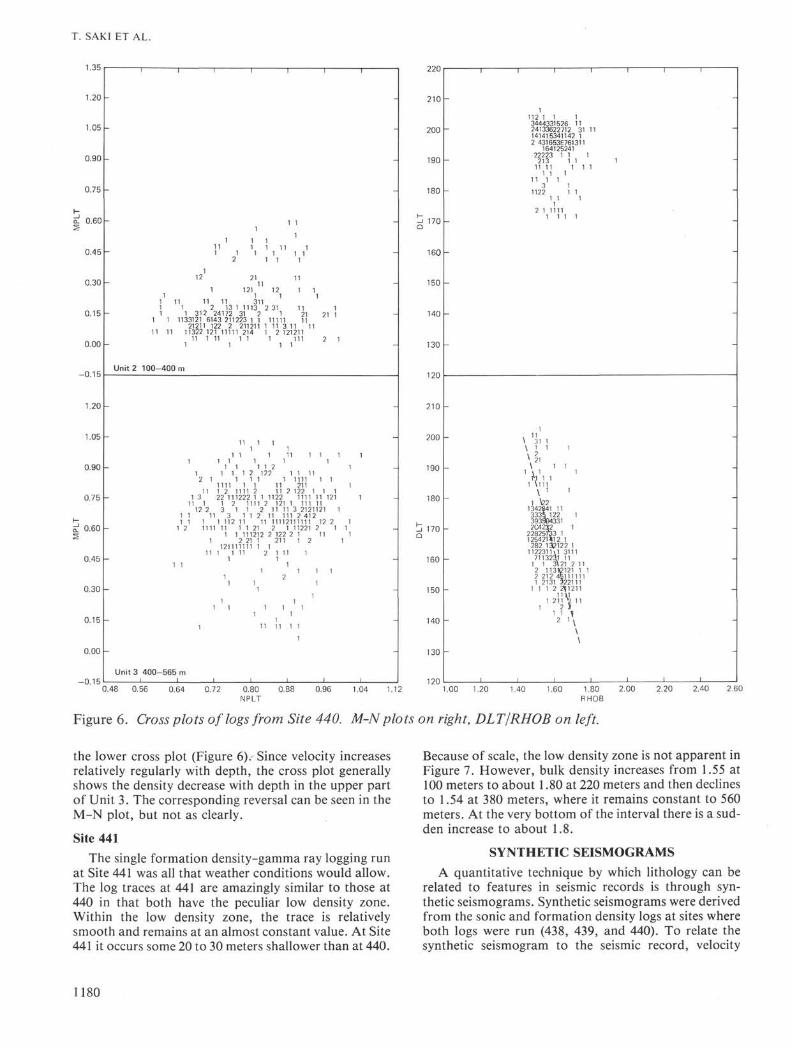
The unusual character of the interval between 400and 560 meters is seen again in the cross plots (Figure 6).The DLT/RHOB plot of Sites 438 and 439 shows a shiftof increasing density with increasing velocity in Units 2and 3; at Site 440 density decreases with increasingvelocity in the interval between 400 and 560 meters (up-per part of Unit 3, Site 440). To see this clearly, onemust isolate points with a DLT greater than 160 (cor-responding to the DLT above 560 meters in Unit 3) on
1177

T. SAKIETAL.
C . 7 5
0.16
0.75
0.60
0.45
0.30
1 l l 1 1 1 12 1 2 312 1211322 312121
2 112112 11511243421 11 111 511231 2368 1434242413 21
111 1122126231395332232243 13 21 11 2 13 111 1
11
Sub-unit 2A
1 111 1 1 1 121 1 21
1 12 111 21 1 2112 111 31 12 1 1
1 1 2 231122 22 111 3 1 11 12 1 12 121 11 1 2 1 1 1
1 2 2211 12 2 131 111 11 12 1 1 1 1 3 2 2
1 1 21 11 11 12211 2 1
1 1 1 1 3 111111 1 1 1 1 2
1 1 I 1 11 11II 1 11
1 1 1 2 11
0.48 0.56 0.64 0.72 0.80 0.88 0.96 1.04 1.12NPLT
0.75
0.60
0.45
0.30
0.15
0.75
0.60
0.45
0.30 -
0.15 -
0.00 -
1 1 1112 1 1111112 2 11112
11131 111 12211 21111 1 2131111111112 3
1 111 12231 21 232 121 1 11111 1112 1112212 21 1 2
1 11 21111 1 112122 212 1 11111 1 2 111 1 111 3 21 31 11 1 112 1
11 1 21 1
Sub-unit 2C
11 11 1 21 1 11 11 111 1 2 3 1 1 1 1
1 1 3 11 1
Unit 3
0.48 0.56 0.64 0.72 0.80 0.88 0.96 1.04 1.11NPLT
i 90
180
170
160
150
140
130
190
180
170
140 -
1301.20 1.30
2LUI722J321 13C1D882 1 138KA64 21
133111 211 11
•1572 1Ti l 2 1
V111 1 1N 11 1 1
122411113 111 11 3S213 1 1114214111 1
2 25>11 111642M
12232231M 1 133592122H 1513542133 22 111
111244 32 1 1 \ 22 1 21 1 \
2 1 \
1.50 1.60 1.70RHOB
Figure 4. Cross plots of logs from Site 438. (M-N plots on right, DLT/RHOB on left.)
1.90 2.00
zuu
190
180
170
160
150
140
130
190
180
170
160
150
140
-
-
^T•>bi 11 1 M.1
•j i 1
-
-
-
-
**1VI 11 11 1*1*1
-
-
-
-
-
1 1•MJJ 32 1
TV8111 f?v.1
1 v ^
-
-
1 1<U1 32 1
^IJJ 2TIM.
-
1.20 1.30 1.40 1.50 1.60 1.70 1.80 1.90 2.00RHOB
1178

DOWNHOLE LOGS ANALYSIS
1.05
0.90
0.75
0.60
0.45
0.30
0.15
0.00
0.90
0.75
0.60
0.45
0.30
0.15
0.00
0.90
0.75
0.60
0.45
0.30
0.15
0.00
0.90
0.75
0.60
0.45
0.30
0.15
0.00
0.90
0.75
0.60
0.45
0.30
0.15
0.00
1 1 21211 112 11 1 1
1 1 1 2 2 111 131 1 1 1 1 1 2132
1 I 2 1532 121 111 1 131 1221111 2211322232 1 u
31221231443132 2122
13 3213322 5123 2 21 11 3 11 2 1 1 21 3
Sub-unit 2A
1 3 121 215 221
1 4 11 3 31 22 2H23 1 3341311 2 2
1 122 21 221 3 11
Sub-unit 2B
234222 22121 H I 2
Sub-unit 2C
Unit 3
Unit 4
0.48 0.56 0.64 0.72 0.80 0.88 0.96 1.04 1.12 1.20NPLT
200
190
180
170
160
150
140
130
190
180
170
160
150
140
130
190
180
170
160
150
140
130
190
180
170
160
150
140
130
190
180
170
160
150
140
130
1
-
-
-
-
-
-
1 1
1 1
1 1
1 1
1
-
1
1 6C33lll2M 1 ' ,1 ' '27724542 22 1
2233232*2 1 1 1
122221 1 l i l1167643 1 1 2 11
1 588SA422 1 1
64573487431 '
1175641 121 11835231 1
1 22311 112231 1
12
^ U Z 2 3 1 I ' 1 1 1311 > 4 1 3 1 1 1 1 1
1 223 1134S22 3 12 1i 331 654341S12 1 1
1323412462HJ1 1
1', rV ",i N
H 12 1 11 - V 123 1
Ns 1"* . 223212 11 1
1 11*4. 11 3311 1II213JW56322 12 1
11 12 31234-45141 2 11 521 -4. 2 22
11 111 1 iTi 1 11 1 l lV
, ', S11 1 I ] N
X,, ,i \ i i i1 1 2 V 1 '1111 13 2J . 3 1 11 2 121112N 1
11 l X 2'1 ' \
h , N
1 1
11 n 112 1 1
1 1 1 1 1 1
1 1
1 1
-
-
-
_
-
1 1
1 1
-
1
' in1 !
1.20 1.30 1.40 1.50 1.60 1.70 1.80 1.90 2.00RHOB
Figure 5. Cross plots of logs from Site 439. (M-N plots on right, DLT/RHOB on left.)
1179
T. SAK1 ET AL.
1 .03
1.20
1.05
0.90
0.75
ö! 0.60
0.45
0.30
0.15
0.00
0 15
1.20
1.05
0.90
0.75
—5! 0.60
0.45
0.30
0.15
0.00
n 1R
l 1—
-
-
-
-
_
_
-
l1 111 11 1
1111 i
2
112
1
11 112 13 1
312 24172
I
1
111
2111
1211311
111331 2
1 1 11331221211 122 2
11 11 1132
1
Unit 2 100-400 m
-
11
1 2
1 1
Unit 3 400-565 mi |
11 1 111
11 1 1
1 11 1 1
2 1 11111
11 1 2 1
211211214
1 1
11 11
11
1
1
1
11 11
1 1
121
2 311
11111
1
1
11 1
1
11
1 1
112111
1 1 1 3 11 111 2 121211
11 1
11
1 111
1 21 2 122
1 11 1
111 21 3 22 111222 1 •
11 1 1 212 2 3 1
1 11 31 1 1 112
1111 111 1
1
11111 2
1 1 2
11111 2
11222 121 1
111111 111
111
1
1 111111211
122 11111
111
I
1
121 1
2 1
1 11
1 1
1 111 12111
3 21211212 412
11 11 111121111 1 21
1112122 21 1
1211111111 1 1
1
11
11 1
1
11
1
11
1
2 12 122 2
2111
2 1 111
1
2
1 11
111 11 1
I I
1122111 2
1
1
11
1
1
1
12 22 1
11
1 1
1
I
1
-
-
-
_
_
—
_
-
1
1
1
1
11
11
-
-
I
ZZö
210
200
190
180
ti 170O
160
150
140
130
120
210
200
190
180
Li 170
160
150
140
130
i?n
1 1 1 1 1 —
_
i112 1 1 13444331526 1124133622712 31 11141415341142 12 431653E761311
16412524122223 1 1 1
213 1 11111 1 1 1
1 1 11 1 1 1
3 1- 1122 1 1
1 1 11
2 1 11111 1 1 1
-
-
-
-
_
1
\ " 1 1\ \ 1 1
_ \ 1 11 i 1 1
1'1 1 11 \111
\ 1 1
1 \221342B41 113335 122 13939B43312C4232 1
22825T33 1125421*12 1
282 132122 11122311»1 3111
- 7113231 111 1 3\ 21 2 112 1131C121 1 12 212 451111111 2131 322111
1 1 1 2 21)12111111
1 211 ? 1 11 2 1
1 1 >j2 1 V
\\
1
1
1 1
-
-
-
_
-
-
-
-
_
-
-
-
-
-
-
-
1
0.48 0.56 0.64 0.72 0.80NPLT
0.96 1.04 1.12 .20 1.60 2.00 2.20 2.40
FSHOB
Figure 6. Cross plots of logs from Site 440. M-N plots on right, DLT/RHOB on left.
the lower cross plot (Figure 6). Since velocity increasesrelatively regularly with depth, the cross plot generallyshows the density decrease with depth in the upper partof Unit 3. The corresponding reversal can be seen in theM-N plot, but not as clearly.
Site 441
The single formation density-gamma ray logging runat Site 441 was all that weather conditions would allow.The log traces at 441 are amazingly similar to those at440 in that both have the peculiar low density zone.Within the low density zone, the trace is relativelysmooth and remains at an almost constant value. At Site441 it occurs some 20 to 30 meters shallower than at 440.
Because of scale, the low density zone is not apparent inFigure 7. However, bulk density increases from 1.55 at100 meters to about 1.80 at 220 meters and then declinesto 1.54 at 380 meters, where it remains constant to 560meters. At the very bottom of the interval there is a sud-den increase to about 1.8.
SYNTHETIC SEISMOGRAMS
A quantitative technique by which lithology can berelated to features in seismic records is through syn-thetic seismograms. Synthetic seismograms were derivedfrom the sonic and formation density logs at sites whereboth logs were run (438, 439, and 440). To relate thesynthetic seismogram to the seismic record, velocity
1180

DOWNHOLE LOGS ANALYSIS
150
200
250
300
350
400
450
500
550
0 GR 100 0.5 RHOB 2.5
Figure 7. Formation density (RHOB) and gamma ray(GR) logs from Site 441.
must be known well enough to relate core and logdepths to the time along the vertical axis of the seismicrecord. This is not always straightforward, because, forone thing, marine seismic sources examine a large areaof the ocean floor. Thus the reflection record is a com-posite of the effects from a wide area, whereas the log-ging tool measures effects in a small radius around thedrill hole. Only the contrasts of rock density and sonicvelocity over a broad area would be expected to corre-spond in both the synthetic seismogram and the seismicrecordings.
The logs and synthetic seismograms are shown withtime rather than depth as the vertical axis (Figures 8, 9,and 10). The time is the two-way travel time along thevertical axis of the seismic records. Time-depth equiva-lents were derived from sonic velocities at variousdepths as measured by seismic refraction, intervalvelocities derived from the stacking velocities in themultichannel records (see seismic records, back pocket,this volume, Pt. 1), velocity measurements (Carson andBruns, this volume), and the downhole sonic log.
Before drilling, a general curve of seismic velocity asa function of time was constructed using interval veloci-ty derived from the stacking velocity at two shotpointsnear Sites 438 and 439 (Figure 11). At these shotpointsthe reflections are near-horizontal and continuous,making the stacking velocities relatively reliable. In ad-dition the refraction velocities were used (Murauchi,this volume). This general curve agrees well with equiva-lent curves from the sonic logs of Sites 438 and 439. Thelog curve from Site 439 has slightly higher velocities atequivalent subsurface depths. An explanation for therapid increase in velocity below 1 s at Site 439 is the in-crease of sand turbidites in Units 3 and 4. The curvefrom the Site 440 sonic log shows an even greater in-crease in velocity, and this site is in 2949 meters deeperwater than Site 438.
The differences between the general (derived fromseismic data) and log (derived from the 438 and 439sonic log) curves are an indication of the magnitude ofuncertainty in depth determinations. Since imprecisionis additive, the uncertainty will increase with depth. At900 meters, the general and log derived velocities differby about 150 m/s. At 1 s, the general and the log curvesgive depths that differ by about 30 meters. These dif-ferences are of about the same scale as the seismic re-flections. In the seismic records, reflections are spacedabout 22 ± 4 meters apart.
Prominent or high amplitude reflections in the syn-thetic seismogram correlate well with high amplitude re-flections in seismic records across Site 438 (Figure 12),particularly if the reflections are traced a few kilometerslandward and out of the zone of small faults near thesite. The correspondence between synthetic and re-corded sequences is within Vi phase, above reflector D(Figure 12) and within one phase below it. The loggedevents that produce a marked change in impedance arecommonly a pronounced density event corresponding toa noisy velocity event. Perhaps the sonic log was af-
1181

T. SAKIETAL.
Figure 8. Synthetic seismogram, Site 438. (Vertical axis in milliseconds round trip travel time, corresponding to seis-mic reflection record across the site. Far right, sonic velocity trace, horizontal axis in M/S, then formation densitytrace, horizontal axis in Mg/M3. At left, reflectance, horizontal axis is amplitude ratio [reflection coefficient]; atfar left, resulting synthetic seismogram.)
Figure 9. Synthetic seismogram, Site 439. (See Figure 8 for explanation.)
fected by hole roughness in these areas. The log featureswere converted from depth to time by a series of straightlines approximating the velocity with depth curve de-rived from the logs; this could explain some of the im-precision in matching synthetic and recorded reflec-tions.
In the hemipelagic mud section, high amplitudereflections occur most frequently in intervals withnumerous thin ash beds and associated carbonate richor limestone horizons. Less frequently, the changes cor-respond to sharp variation in diatom content—for in-
stance, from a diatomaceous mud to a diatom ooze.Deeper in the section (below about 450 m) silicificationmay contribute to a high amplitude reflection. At theboundary between Sub-unit 2C and Unit 3, greater sandcontent correlates with a strong reflection.
The log correlation described in the site chapter forSites 438 and 439 between the two was done aboard theChallenger, using field prints of the logs. Our correla-tion, using corrected logs, the synthetic seismograms,and reflection traces in the seismic records (Figure 12),differs by about 20 milliseconds (approximately 20 m
1182

DOWNHOLE LOGS ANALYSIS
Figure 10. Synthetic seismogram, Site 440. (See Figure 8 for explanation.)
shallower at Site 439) for reflections above D. We haveno explanation for this other than a depth-to-time con-version error during the synthetic seismogram process.
Reflections X, A, and B (Figure 12) have a character-istic pattern in both sets of logs and can also be traced inthe seismic records from one site to the other. ReflectionD, one of the strongest in the observed seismic record,does not correspond in a straightforward way to thelogs, the synthetic seismograms, or the lithology. Ourinterpretation of its position at Site 439 is heavily in-fluenced by the tracing of the reflection from one site tothe other.
At Site 440 the synthetic seismogram and seismic re-flection record cannot be interpreted straightforwardly(Figure 13). First, the seismic record does not recordamplitude information well, probably because of frac-turing or seismic processing. Second, the logs were rununder adverse weather conditions and are relativelynoisier than other logs (compare the 439 and 440 sonictraces). Thus, many of the short wavelength (10 m orless) events are probably noise, particularly in intervalswhere the hole was rough. Rough and washed-out holeintervals commonly correspond to highly fractured in-tervals. Third, the section is lithologically very monoto-nous, consisting of claystone with small variation indiatoms and volcanic ash and pumice fragments. Wherethe ash content is greater by 10 per cent or more, theformation density shows a small increase over a 10- to50-meter-thick interval which corresponds to a low fre-quency reflection in the synthetic seismogram. Such lowfrequency reflections are seen in the seismic record (cf.6300-6500 ms).
SUMMARY AND CONCLUSIONS
Despite severe shipboard operational problems, espe-cially at Sites 440 and 441, studying the log traces pro-duced a great deal of confidence in their general valid-ity. When the logs are compared with laboratory mea-
surements, lithology, and seismic records, and when anintertrace comparison is made, that general validity be-comes apparent. The precision across an interval of afew meters is good, and uncertainty increases with suc-ceeding smaller intervals. The precision of small fea-tures (1-3 m) is difficult to establish. Although some2-to 5-meter excursions of the traces correspond wellwith lithologic and seismic features, the uncertainty inthe precision of other features at this scale is problem-atical. Thus further detailed interpretation of lithologybased on the logs must be done with considerable careand caution, particularly at Sites 440 and 441, where un-known environmental effects are superimposed on thetraces.
The evidence for secondary porosity is derived prin-cipally from the unusual decrease with depth in the for-mation density log supported by the sonic log. The trendin M-N plots derived from these logs, the derivativeporosity curves, and cycle-skipping in the sonic log sup-port and emphasize the logging evidence. The sonicsignal is attenuated in a highly fractured medium andcould cause cycle skip. Because the core was not espe-cially gassy in the interval in question, gas can be ruledout as a cause. An increase in the porosity derived fromthe formation density log at Site 440 is highly indicativeof secondary porosity, and the trend of successive M-Nplots for the logs from Site 440 is consistent with sec-ondary porosity. The case for fracture porosity is devel-oped more fully elsewhere (Arthur et al., this volume).
There is a good correspondence between log traces,lithology, and the seismic records. The logs are a set ofdata at an intermediate scale between core informationand seismic records that aid in correlating lithology withseismic data. The use of synthetic seismograms hasmade this correlation of different data far less subjec-tive than is usual in Glomar Challenger studies. Themost frequent correspondence between strong reflec-tions and core lithology is at ash beds, then at lime-rich
1183

T. SAK1 ETAL.
Depth (m)1000 2000
3.5 km/s
2 . 0 -
Figure 11. Summary of velocity analyses. (Stepped trace REFisfrom refraction measurements; stepped traces 541 and601 are summations of interval velocities from stacking velocities at those shotpoints; and traces with site numbersare from the sonic logs. The corresponding depth-time traces are on the right.)
or limestone beds (Figure 14). In the section penetrated,these beds are usually too thin to cause a changein acoustic impedance and relativity by themselves,but when they are sufficiently numerous and properlyspaced, they are capable of causing greater than averagereflectance. The lateral continuity of reflections is con-sistent with an airfall origin of the ash layers and withthe development of the thin limestone beds associatedwith the greater permeability of the ash relative to themudstone. The variation in diatom and sand contentcorresponds less frequently with change in reflectivity.
The basic conclusions from our study are as follows:1) The formation density and sonic log traces give
precise values over intervals about a few meters long. Inshorter intervals the precision of a particular log mustbe judged on the basis of log character, a comparisonbetween all log traces and lithology, and a comparisonwith the physical properties data.
2) The consistency between laboratory measurementsof physical properties and the log values indicate ageneral correspondence between in situ and laboratoryvalues (also discussed in Carson and Bruns, this volume).
1184

DOWNHOLE LOGS ANALYSIS
Figure 12. Seismic record and superimposed synthetic seismogram, Sites 438 and 439.
^X^^^s^"-
»
Figure 13. Seismic record and superimposed synthetic seismogram, Site 440.
1185

T. SAK1ETAL.
353.5 m
Core 32
359.7 m
363 m
Core 33
Reflection B
372.5 m
Core 34
382 m
Core 35
391.5 m
:-i-i-:-i-z-
nra
• ••Z•l-•l•l
- r~_£. - -
: .-.-_ - .-
— Silt-size ash (354.5 m)
1—Fine- to medium-grained ash (357.4 m)
Coarse clayey sand (366.8 ml-Chalk (367.4 ml
1 "Ash (368.2 ml
— Medium sand (369.2 m)
— Slightly graded sand (371.7 m)1—Mθdium to coarsθ sand (373 m)
Firm clayey diatom ooze
— Silt-size ash (377.2 m)
limestone (382 m)
Firm clayey diatom ooze
z—-Fine-grained ash (385.3 ml— > V e r y fine-grained ash (385.6 m)
Clayey diatomacθouslimestone (386.1 m)
, Siltyash (390.5 m)
(391 m, 391.3 m)
\
\
Λ
_4 _3 _2 - 1 0 1 2 3 4
Reflection Coefficients (× 10~3)
Figure 14. Correspondence between strong reflections,reflection coefficients, and core lithology, Site 438.
3) Most intervals not recovered in coring have thesame character in the logs as the recovered intervals.Thus no unusual lithologies appear to have been missedduring coring. The most consistent correlation is be-tween poor core recovery at highly fractured intervals
and noisy log traces, particularly the sonic trace at Site440.
4) The decrease with depth in formation density logvalues at Sites 440 and 441, in reference to those at 438and 439, are consistent with the development of second-ary porosity and overpressured zones. The sonic traceshows some similar decreases at Site 440, but the inter-pretation is not as straightforward.
5) In the rather monotonous mudstone section, se-quences of thin volcanic ash beds and related limestonesand obvious lithological change appear to form themost prominent horizons in seismic records. The time-consistent nature of airfall ash deposits lends supportfor the assumption that prominent seismic reflectionsare also time-consistent.
This study has made clear to us the need for logs withproper environmental measurements in relating lithol-ogy to seismic data in the DSDP program.
ACKNOWLEDGMENTS
We thank Bob Brune and Roy Hyndman for reviewing themanuscript. We also thank Dieter Bartsch of the Singaporeoffice of Schlumberger who served on board.
REFERENCES
Wyllie, M. R. J., Gregory, A. R., and Gardner, G. H. F.,1956. Elastic wave velocities in heterogeneous and porousmedia. Geophysics, 21 (No. 1), 41-70.
,1958. An experimental investigation of factors af-fecting elastic wave velocities in porous media. Geophysics,23 (No. 3), 459-493.
GENERAL BIBLIOGRAPHY FOR LOGGING
Log Interpretation. Principles (Vol. 1): New York (Schlum-berger Limited). 1972.
Log Interpretation Charts: New York (Schlumberger Limited).1977.
1186