5.0 consequence analysis - usbr.gov · pdf file5.1 an economic approach to consequence...
TRANSCRIPT
Section 5, Biota Transfer Report, Consequence Analysis 1
5.0 Consequence Analysis Abstract. Analysis summarized in Section 5 estimated the potential consequences associated with interbasin water transfers between the Upper Missouri River and Red River basins. Two economic approaches were used to estimate these consequences. Habitat equivalency analysis was used to estimate consequences throughout the assessment area including the Red River and Lake Winnipeg. That analysis indicated risk consequences ranging from 0.6 to 3.1 river-miles of offsetting restoration on the Red River and from 1.9 to 27,750 acres of offsetting restoration on Lake Winnipeg. While those results suggest potentially significant consequences for Lake Winnipeg, their interpretation depends on the feasibility and availability of appropriate restoration measures.
Since the feasibility and availability of those restoration measures is not clear at this time, a second economic approach was used to focus the consequence analysis on Lake Winnipeg. Regional economic impact analysis was used to estimate the impacts on output (sales revenue) and employment in the Lake Winnipeg commercial fishery. The invasion scenarios with the largest consequences (slow and fast invasions given a jump dispersal event) indicated a total expected present value between $33,000 and $136,000 in direct and indirect output impacts for all Canadian provinces. All other invasion scenarios indicated smaller output impacts. Expected employment impacts in the very high risk category (i.e., certainty) reach 331 full-time equivalent (FTE) jobs. The average expected employment impacts weighted by the percent outcomes of respective risk categories is zero FTE for all invasion scenarios.
Given the quantitative results from the habitat equivalency analysis and the regional economic impact analysis, the following three conclusions can be drawn. First, the overall results are sensitive to the distribution of probabilistic outcomes from the risk characterization. Consequence levels for the individual risk categories vary substantially. That variance reflects the different probabilities of successful invasion. A different distribution of probabilistic outcomes would change the weighted averages of the consequence levels. Therefore, this consequence analysis is sensitive to the results of the risk analysis. In this particular case, the weighted average consequences are heavily weighted toward the lowest risk category (87% of outcomes in the very low-risk category). A distribution more heavily weighted toward the higher-risk categories would yield substantially higher-weighted averages of consequences.
The second conclusion of this consequence analysis is that the speed of invasion significantly affects the quantitative results. As many as four orders of magnitude difference in offsetting restoration levels exists between the two invasions speeds assumed in this analysis, and one order of magnitude difference is captured by output impacts. A much more detailed analysis would match individually estimated invasion speeds to respective organisms, and then aggregate the indicated consequence levels over the species of concern. However, the information regarding species-specific invasion speeds was not available to conduct that level of analysis. Therefore, this analysis
Section 5, Biota Transfer Report, Consequence Analysis 2
indicates not only the significance of this analytic factor but also the need for additional research in this area.
This consequence analysis also concludes that the anticipated distribution of the method and number of dispersal events substantially affects the quantitative results. This analysis considered only a limited set of potential dispersal scenarios. No information was available to inform the distribution of these scenarios to include in the analysis. However, the limited number of potential dispersal scenarios analyzed here indicated as many as four orders of magnitude difference in offsetting restoration levels between them. Similar to the conclusion regarding the speed of biotic invasion, this analysis indicates a significant analytic factor and a need for further research.
5.0 Consequence Analysis: Introduction
This section presents a consequence analysis of specific risks that are potentially associated with interbasin water transfers between the Upper Missouri River and Red River basins. The specific risks addressed involve the possibility of biological invasions between the two river basins. The analysis presented in the previous sections of this report resulted in a risk characterization that integrates exposure and effects information to estimate and describe the risks of adverse effects resulting from these potential biological invasions. As an integral part of watershed management, consequence analysis interprets a risk characterization to illustrate the significance of risk in meaningful terms that promote public understanding and involvement in risk management. The specific goals of this consequence analysis include the following:
• Present the consequences of risk in a meaningful way that is easily understood by stakeholders
• Estimate a relevant range of the magnitude of risk consequences • Determine critical factors that influence the magnitude of risk consequences
This consequence analysis uses two economic approaches to illustrate the significance of risk. The integration of ecological risk assessment and economic analysis in watershed management is a relatively new concept with little empirical application (US Environmental Protection Agency 2003). However, economic analysis typically forms a key element of policy analysis for decision making (Loomis and Helfand 2001). That is because economic analysis is often required in governmental decision processes (e.g., promulgation of federal regulations), and because the public in a market-oriented society is generally familiar with economic indicators.
One economic approach used in this analysis, habitat equivalency analysis (HEA), borrows from the established field of natural resource damage assessment. Natural resource damage assessments are conducted to determine the specific restoration measures needed to address injuries resulting from hazardous substance releases and discharges of oil. A key assumption of the HEA method is that appropriate restoration measures are feasible and available. This application of HEA was useful in quantifying the relative consequences within the assessment area and indicated potentially significant
Section 5, Biota Transfer Report, Consequence Analysis 3
consequences for Lake Winnipeg. Nevertheless, whether appropriate restoration measures are feasible and available either now or in the future is yet another level of uncertainty that was not addressed in this analysis.
Recognizing the possibility that appropriate restoration measures may not be feasible or available, a second economic approach, regional economic impact analysis, was used to describe potential consequences for Lake Winnipeg in terms of their impacts on the economy (sales revenue and employment). Regional economic impact analysis does not assume the feasibility or availability of appropriate restoration measures.
This section first provides a brief background of various economic approaches to establish the context for this consequence analysis. The particular economic approaches selected for this analysis are then presented, followed by descriptions of their application in this consequence analysis. Finally, the conclusions of this consequence analysis are presented.
5.1 An Economic Approach to Consequence Analysis
Policy analysts commonly employ economic approaches to present relevant information to the public and ultimately to decision makers. For example, federal agencies are required to conduct cost/benefit analyses of proposed government regulations.1 Those analyses present the estimated costs and benefits that can be attributed to the particular regulations under consideration. Such economic analyses present the consequences of policies in terms that are relevant for people in evaluating their tradeoffs of current and future resources. While these tradeoffs are frequently presented in monetary terms, they can also be cast in terms of other resource needs such as habitat restoration.
The presentation of consequences in terms of resource tradeoffs is also appropriate for watershed management issues (Bruins and Heberling 2005). In the event of an adverse ecological impact resulting from a watershed management action, individuals and firms may lose income, affected habitats may require restoration, and the recreational services provided by those habitats may be diminished. Recognition of these tradeoffs is an important part of communicating the consequences of risk to the public and to decision makers.
An economic approach to this consequence analysis was chosen in order to recognize some of the potential tradeoffs resulting from interbasin water transfers. The field of economics is wide and provides a number of approaches to estimating tradeoffs. These various approaches are briefly described below and specific approaches are selected for the consequence analysis.
1 See Executive Order 12866 on regulatory planning and review in the October 4, 1993, issue of the Federal Register (Volume 58, Number 190).
Section 5, Biota Transfer Report, Consequence Analysis 4
5.1.1 Background of economic approaches. A key distinction among different economic approaches is the type of economic values they are designed to address. One economic approach frequently encountered involves estimating “regional economic impacts.” These impacts describe the domino effect of spending (by commercial fishers for example) that reverberates through a local economy. Such impacts are experienced in the form of jobs, wages, tax revenues, and output or sales revenues.
These regional economic impacts are often gross economic values, meaning that their associated costs have not been subtracted. Examples of associated costs include the wages and taxes that businesses must pay out of their sales revenues. Since those costs have not been subtracted, regional economic impacts double-count to some extent. For example, the regional economic impacts of wages and tax revenues are also included in the regional economic impacts of sales revenues. Therefore, the interpretation of gross values like regional economic impacts must be cautioned by the potential for double-counting and by the fact that certain costs must be paid out of them. However, the regional economic impacts of various projects are frequently reported in the popular press and are easily understood by the public.
Another type of economic value is net economic value. Net values are gross values minus their associated costs. An example of net value is equity in real estate, which is the sales value of property in excess of all claims against it. Another example is business profit, which is sales revenue minus the costs of capital and labor. Since all costs or claims have been subtracted, net values reflect the true worth of a resource since its owner is free to spend or invest that amount at will. Further, net values do not double-count and can therefore be aggregated meaningfully in a cost/benefit analysis.
A number of methods have been developed to estimate net economic values.2 These methods frequently rely on public surveys, which require significant investments in time and budget to design and implement.3 Therefore, expedited methods have been developed for use in a number of contexts including public policy analysis and natural resource damage assessment. These expedited methods either estimate net economic values or incorporate their consideration in the analysis of management actions.
Expedited economic methods appropriate to watershed management include benefits transfer and HEA. Benefits transfer involves using economic values that have been previously estimated and reported in existing studies to address similar issues in other contexts. Specifically, per-unit value estimates from existing economic studies are combined with site-specific resource information to estimate total costs and benefits. For example, suppose a management action results in the loss of 150 angler-days of fishing along a river. Then, per angler-day value estimates from studies of comparable resources could be obtained from the economics literature and multiplied by 150 to estimate the
2 See Freeman (1993) for a comprehensive survey of economic methods that are applicable to natural resources. 3 If conducted by or for federal agencies, surveys must also be approved by the Office of Management and Budget.
Section 5, Biota Transfer Report, Consequence Analysis 5
total cost of that action. Some original research may be required to obtain the necessary site-specific resource information such as the number of affected angler-days.4
The habitat equivalency analysis method does not estimate net economic values,
but HEA does incorporate its consideration in quantifying the impacts of management actions. This method is widely used in natural resource damage assessments, which determine compensation for lost or diminished ecological services.5 In that context, compensation is provided by restoration projects that provide replacement services with an economic value at least as great as the economic value of the lost services. That is, the size of the restoration project must be sufficient to offset the economic value of lost services. Therefore, the impacts are quantified as the size or cost of the required restoration project. For example, replacement services could include the monitoring and removal of existing invasive species that are not related to the project. Those replacement services would improve habitat and represent real economic value. Obviously, a key assumption of the HEA method is that appropriate restoration measures are both feasible and available for implementation.
HEA employs other assumptions in order to avoid explicitly estimating economic value. One assumption is that the unit economic values of the replacement services are comparable to those of the lost services. This assumption is required because HEA determines the size of the restoration project such that the total quantity of replacement services provided through time is sufficient to offset the total quantity of lost services.6 These services are quantified in physical units of measure such as acre years.7 Given the offset of the total physical quantity of lost services, the restoration project will be sufficient to offset the total economic value of lost services if the unit economic values of the replacement services are comparable to those of the lost services. This is reasonable if the replacement services are comparable in type and quality to the lost services. Therefore, to apply HEA, selected restoration projects must provide ecological services that are comparable to those lost as a result of the resource impact. For example, if aquatic habitat services are diminished as a result of an impact, then restoration must provide similar aquatic habitat services in replacement.8
The simplifying assumptions of HEA impose certain restrictions on its
application. However, the method also has the distinct advantage of focusing on environmental restoration measures rather than on the estimation of economic values. In
4 See Kaval and Loomis (2003) and Desvousges et al. (1992) for a more detailed description of the benefits transfer method. Also, see page 499 of the January 5, 1996, issue of the Federal Register (Volume 61, Number 4) for a description of the application of benefits transfer in natural resource damage assessment. 5 Ecological services are the functions performed by a natural resource for the benefit of other resources. For example, habitats provide food and refuge for wildlife populations. 6 Services lost or provided at different times are discounted at an appropriate rate to reflect time preference considerations. See Brennan (1999) for a discussion of discounting. 7 An acre year refers to all the resource services provided by one acre of habitat for one year. This measure of resource services is specific to habitat since different habitats provide different services. Other metrics, such as river-mile years, can also be used. 8 See Unsworth and Bishop (1994), Jones and Pease (1997), and Allen et al. (2005) for a detailed description of the HEA method. See Penn and Tomasi (2002) for an example application of this method.
Section 5, Biota Transfer Report, Consequence Analysis 6
natural resource damage assessments, this restoration focus is more easily understood by a wider audience than the more theoretic valuation approaches.
5.1.2 Selection of specific economic approaches. Two economic approaches were selected for this consequence analysis: habitat equivalency analysis and regional economic impact analysis. HEA was selected for two reasons. First, HEA is a relatively transparent economic approach. It describes consequences in terms of the amount of restoration that would be needed to address potential impacts. The analytic inputs and results of HEA are directly associated with the potentially affected resources and their services. Because of that, the results of HEA are easily understood by a broad range of interested parties.
The second reason HEA was selected is because it is readily available in terms of the time and budget resources required for implementation. Unlike methods relying on public surveys, HEA can be conducted relatively quickly and at a modest cost. Therefore, HEA was considered to be the most cost-effective approach for describing the consequences of risk throughout the entire assessment area. In that capacity, HEA was used to quantify potential consequences for both the Red River and Lake Winnipeg.
This application of HEA indicated potentially significant consequences for Lake Winnipeg. However, that indication of consequences relies on the feasibility and availability of appropriate restoration measures. Since the feasibility and availability of appropriate restoration measures is not clear at this time, a regional economic impact analysis of the Lake Winnipeg commercial fishery was also conducted. Regional economic impact analysis describes potential consequences in terms of their impacts on the economy (output or sales revenue and employment) and does not assume the feasibility or availability of restoration measures. Additionally, regional economic impact analysis can be conducted quickly and at a modest cost since the necessary data are readily available from Statistics Canada. Therefore, regional economic impact analysis was used to focus the consequence analysis on the area indicated by HEA as potentially most affected by the risks of biological invasions.
5.2 Habitat Equivalency Analysis: Model Development
In this section, the habitat equivalency analysis model is developed for the consequence analysis. This model is essentially the same used in natural resource damage assessments with one significant difference. Damage assessments are conducted after the occurrence of an ecological injury. Therefore, that analysis is of a certain event. Ecological risk assessments, on the other hand, address uncertain events in the future. To accommodate this uncertainty, the probability of successful biological invasion is introduced into the HEA model development. This probability is applied to the future ecological losses that would occur given a successful invasion. This analysis presents the consequences of this risk as the certain level of restoration that would be required to address these uncertain losses. That is, a certain level of restoration is calculated to offset
Section 5, Biota Transfer Report, Consequence Analysis 7
an uncertain risk of successful biological invasion. This quantification of risk consequences is termed offsetting restoration.
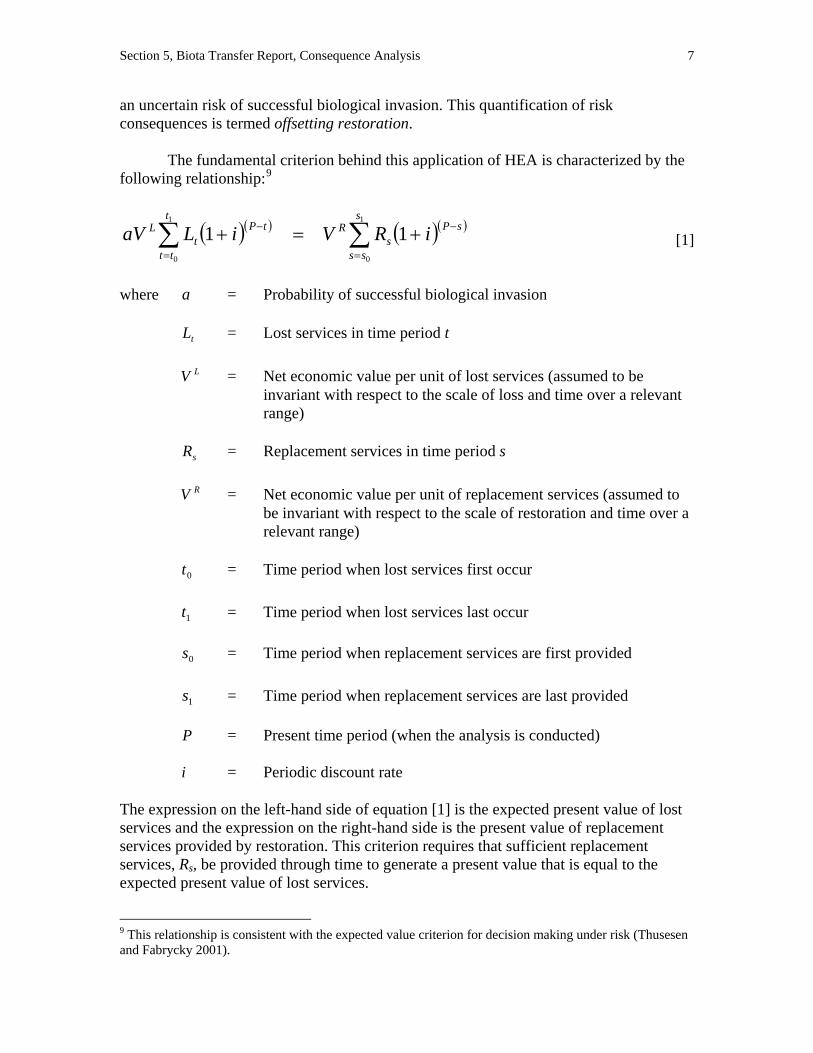
The fundamental criterion behind this application of HEA is characterized by the following relationship:9
( )( ) ( )( )sPs
sss
Rt
tt
tPt
L iRViLaV −
==
− +=+ ∑∑ 111
0
1
0
[1]
where = Probability of successful biological invasion a = Lost services in time period t tL = Net economic value per unit of lost services (assumed to be
invariant with respect to the scale of loss and time over a relevant range)
LV
= Replacement services in time period s sR = Net economic value per unit of replacement services (assumed to
be invariant with respect to the scale of restoration and time over a relevant range)
RV
= Time period when lost services first occur 0t = Time period when lost services last occur 1t = Time period when replacement services are first provided 0s = Time period when replacement services are last provided 1s P = Present time period (when the analysis is conducted) = Periodic discount rate i The expression on the left-hand side of equation [1] is the expected present value of lost services and the expression on the right-hand side is the present value of replacement services provided by restoration. This criterion requires that sufficient replacement services, Rs, be provided through time to generate a present value that is equal to the expected present value of lost services.
9 This relationship is consistent with the expected value criterion for decision making under risk (Thusesen and Fabrycky 2001).
Section 5, Biota Transfer Report, Consequence Analysis 8
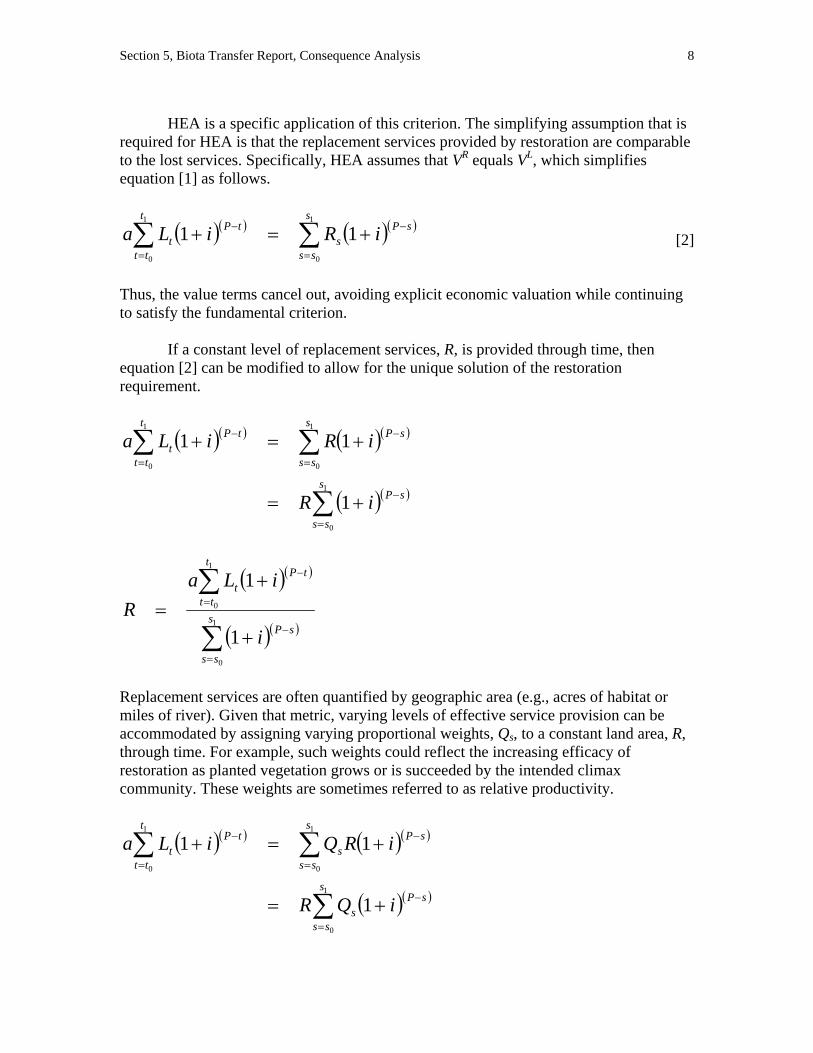
HEA is a specific application of this criterion. The simplifying assumption that is
required for HEA is that the replacement services provided by restoration are comparable to the lost services. Specifically, HEA assumes that VR equals VL, which simplifies equation [1] as follows.
( )( ) ( )( )sPs
sss
t
tt
tPt iRiLa −
==
− +=+ ∑∑ 111
0
1
0
[2]
Thus, the value terms cancel out, avoiding explicit economic valuation while continuing to satisfy the fundamental criterion.
If a constant level of replacement services, R, is provided through time, then equation [2] can be modified to allow for the unique solution of the restoration requirement.
( )( ) ( )( )
( )( )∑
∑∑
=
−
−
==
−
+=
+=+
1
0
1
0
1
0
1
11
s
ss
sP
sPs
ss
t
tt
tPt
iR
iRiLa
( )( )
( )( )∑
∑
=
−
=
−
+
+=
1
0
1
0
1
1
s
ss
sP
t
tt
tPt
i
iLaR
Replacement services are often quantified by geographic area (e.g., acres of habitat or miles of river). Given that metric, varying levels of effective service provision can be accommodated by assigning varying proportional weights, Qs, to a constant land area, R, through time. For example, such weights could reflect the increasing efficacy of restoration as planted vegetation grows or is succeeded by the intended climax community. These weights are sometimes referred to as relative productivity.
( )( ) ( )( )
( )( )∑
∑∑
=
−
−
==
−
+=
+=+
1
0
1
0
1
0
1
11
s
ss
sPs
sPs
sss
t
tt
tPt
iQR
iRQiLa
Section 5, Biota Transfer Report, Consequence Analysis 9
( )( )
( )( )∑
∑
=
−
=
−
+
+=
1
0
1
0
1
1
s
ss
sPs
t
tt
tPt
iQ
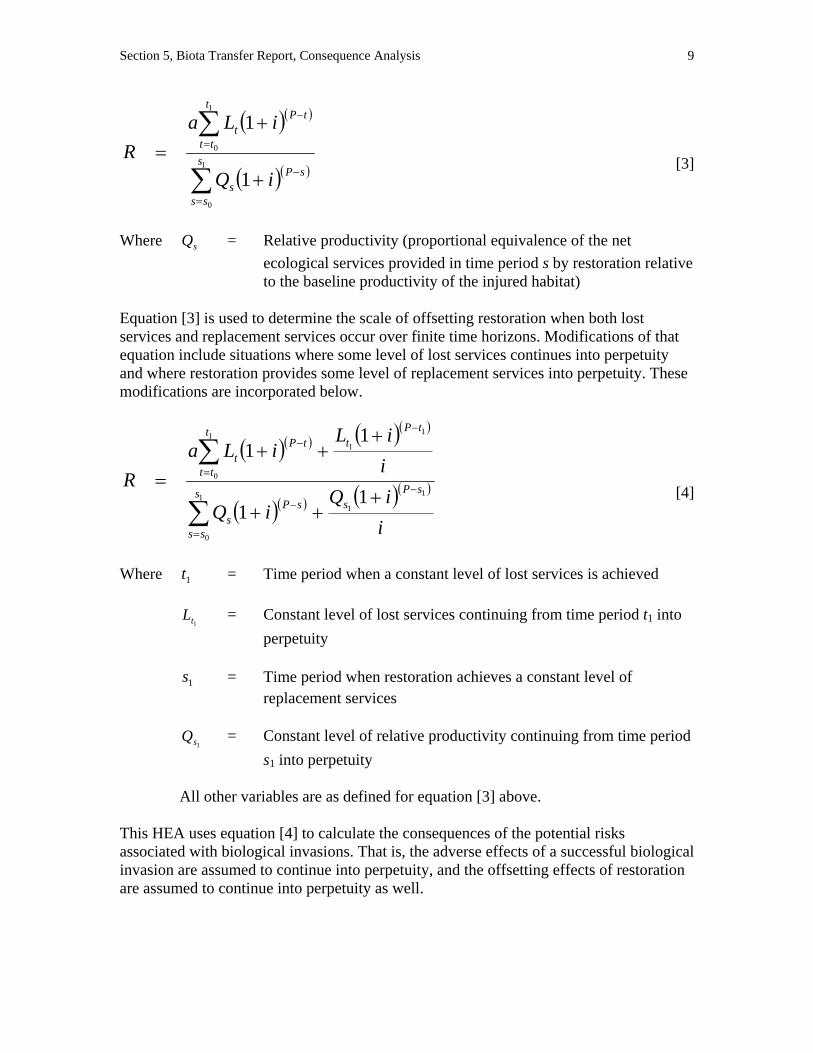
iLaR [3]
Where = Relative productivity (proportional equivalence of the net
ecological services provided in time period s by restoration relative to the baseline productivity of the injured habitat)
sQ
Equation [3] is used to determine the scale of offsetting restoration when both lost services and replacement services occur over finite time horizons. Modifications of that equation include situations where some level of lost services continues into perpetuity and where restoration provides some level of replacement services into perpetuity. These modifications are incorporated below.
( )( ) ( )( )
( )( ) ( )( )
iiQ
iQ
iiL
iLaR sP
ss
ss
sPs
tPt
t
tt
tPt
1
11
0
1
11
0
11
11
−
=
−
−
=
−
+++
+++
=
∑
∑ [4]
Where = Time period when a constant level of lost services is achieved 1t = Constant level of lost services continuing from time period t
1tL 1 into
perpetuity = Time period when restoration achieves a constant level of
replacement services 1s
= Constant level of relative productivity continuing from time period
s1s
Q1 into perpetuity
All other variables are as defined for equation [3] above. This HEA uses equation [4] to calculate the consequences of the potential risks associated with biological invasions. That is, the adverse effects of a successful biological invasion are assumed to continue into perpetuity, and the offsetting effects of restoration are assumed to continue into perpetuity as well.
Section 5, Biota Transfer Report, Consequence Analysis 10
5.3 Habitat Equivalency Analysis: Model Estimation
This habitat equivalency analysis addresses two distinct but related water bodies that could be affected by a potential biological invasion: the Red River and Lake Winnipeg. For purposes of this analysis, the Red River habitat is defined as the 455.4 river-miles from the I-94 bridge in Fargo, North Dakota, to the southern shore of Lake Winnipeg (US Army Corps of Engineers 2004). The Lake Winnipeg habitat is defined as its 5,868,625 acres (23,750 square kilometers) of surface area (Manitoba Water Stewardship 2004). The consequences of risk are estimated separately for these two habitats.
Critical factors in this analysis include the method and rate of the dispersal of biological invaders. Two potential dispersal methods are considered: progressive and jump. The progressive dispersal method assumes a linear, geographically incremental advancement of a biological invasion. In this analysis, a progressive dispersal in the Red River is assumed to begin at the I-94 bridge and to progress incrementally northward toward the southern shore of Lake Winnipeg at a constant rate of advancement. In Lake Winnipeg, a progressive dispersal is similarly assumed to begin at its southern shore and to progress incrementally northward toward its northern shore at a constant rate.
The jump dispersal method is represented in this analysis by an instantaneous introduction of a biological invader into Lake Winnipeg. In this scenario, a progressive invasion of Lake Winnipeg is assumed to begin at its southern shore at the same time that a progressive invasion of the Red River begins at the I-94 bridge. Once these two invasions begin, they are assumed to progress incrementally northward to the northern extents of their respective habitats at a constant rate.
It should be recognized that the quantitative results of this analysis are significantly influenced by the particular assumptions adopted here regarding dispersal methods. For example, this analysis assumes that given a jump dispersal event, the introduction of a biological invader will occur at the southern shore of Lake Winnipeg, and that a progressive dispersion will subsequently proceed northward toward its northern shore. Alternatively, it could have been assumed that the introduction would occur at the middle of Lake Winnipeg with subsequent progressive dispersions both north and south. That assumption would yield higher-risk consequences as quantified by the HEA model.
The number of permutations of possible dispersal scenarios is large given the large geographic extent of the habitats considered in this analysis. The particular assumptions adopted here were chosen to illustrate risk consequences under two broad categories of dispersal methods, not to provide an exhaustive analysis of all potential events. This analytic approach was chosen to efficiently yield qualitative results that clearly communicate the nature of the risk consequences resulting from interbasin water transfers between the Upper Missouri River and Red River basins.
Section 5, Biota Transfer Report, Consequence Analysis 11
The rates of advancement of a biological invasion are assumed to range between 2.5 and 25 kilometers, or between 1.55 and 15.5 miles, per year.10 Accordingly, a slow invasion would traverse the Red River in 294 years (455.5 river-miles divided by 1.55 miles per year). Lake Winnipeg extends 271 miles (436 kilometers) from its southern shore to its northern shore (Manitoba Water Stewardship 2004). Given that extent, a slow invasion would require 175 years, on average, to traverse the lake (271 miles divided by 1.55 miles per year). Alternatively, a fast invasion would require 29 years to traverse the Red River (455.5 river-miles divided by 15.5 miles per year), and 17 years to traverse Lake Winnipeg (271 miles divided by 15.5 miles per year). After these habitats have been traversed by biological invasions, the resulting ecological service losses are assumed to continue into perpetuity.
Assumptions must also be made regarding the nature of offsetting restoration. Offsetting restoration provides certain levels of ecological services to replace uncertain losses of similar services. That is, this HEA quantifies the consequences of risk as the quantity of a certain provision of restoration that is required to offset an uncertain risk of successful biological invasion. Offsetting restoration is quantified in the same terms that are used to quantify habitat losses: river-miles for the Red River and acres for Lake Winnipeg.
This analysis assumes that offsetting restoration begins five years after the onset of successful invasion, and requires 20 years to become fully functional. These assumptions are made to allow sufficient time for planning, implementation, and mid-course corrections under adaptive management. Once offsetting restoration becomes fully functional, it is assumed to provide replacement ecological services that are equivalent to those potentially lost from biological invasion. Further, these replacement services are assumed to continue into perpetuity.
As with the assumptions made regarding dispersal methods, alternative assumptions for offsetting restoration will also yield different quantitative results. For example, specifically designed restoration measures for different invasive organisms would likely have different timing requirements and different success levels. However, at its most basic level, this analysis quantifies risk consequences for a single representative organism. Consistent with that approach, this HEA incorporates a single representative description of offsetting restoration. This approach was considered the best way to determine useful qualitative results without an exhaustive description of applicable restoration methods.
Finally, an appropriate discount rate must be selected in order to meaningfully aggregate ecological services over time (the parameter i in the model specification). A 3-percent annual discount rate was selected for this analysis. The economics literature supports an annual 3% discount rate for natural resource valuation (e.g., Freeman 1993). Two federal rule-makings also support an annual 3% discount rate for lost natural
10 See, for example, Pearce and Smith (2002; 2003), Skalski and Gilliam (2000), and Speirs and Gurney (2001).
Section 5, Biota Transfer Report, Consequence Analysis 12
resource use valuation11. Also see Peacock (1995) for a discussion of the theory and estimation of the discount rate.
The economics literature has recently addressed whether the discount rate used to analyze long-term projects should be adjusted to account for intergenerational equity concerns (e.g., Portney and Weyant 1999). Since the ecological service losses and replacements analyzed here occur over periods approaching 300 years, and into perpetuity, intergenerational equity is certainly a consideration. However, the literature is not conclusive as to whether such adjustments are appropriate. For example, Weitzman (1999) recommends applying a declining discount rate over time, while Arrow (1999) recommends using a positive and constant discount rate, even in the face of irreversible changes. In light of this unsettled controversy and the previous references cited, a constant 3% annual discount rate was selected as appropriate for this analysis.
The HEA was calculated for a single representative invasive organism given the progressive and jump dispersal methods and the slow and fast dispersal rates described above for the five different risk categories considered (very low, low, moderate, high, and very high risk). The results of those HEA calculations are presented in Table 1. Detailed HEA calculations are presented in Appendix 15.
Probabilistic outcomes from the risk characterization were incorporated in Table 1 by calculating the average of the HEA results for the different risk categories weighted by their respective percentage outcomes (Figure 1 in Section 4). These weighted averages were then aggregated to the 31 species of concern according certain assumptions regarding the number of jump dispersal events that might occur.
The number of expected jump dispersal events was not addressed in the foregoing analysis of risk. Therefore, the following three dispersal scenarios were assumed in order to estimate a range of potential risk consequences for the 31 species of concern.
• 0 Jump - 31 Progressive: There are no jump dispersal events in this scenario. All 31 species of concern are assumed to begin their invasions at the I-94 bridge on the Red River, progress incrementally to the southern shore of Lake Winnipeg, and then progress incrementally to the northern shore of the lake. That is, the potential invasions of Lake Winnipeg by all 31 species of concern are assumed to begin only after their progressive invasions of the Red River have been completed. This dispersal scenario yields the lowest levels of risk consequences in present value terms since it has the longest time horizon for any potential biological invasion to traverse the Red River and Lake Winnipeg.
• 1 Jump - 30 Progressive: There is one jump dispersal event in this scenario. One species of concern is assumed to begin its progressive invasion of Lake Winnipeg at the same time that it begins its progressive invasion of the Red River.
11 See the January 5, 1996, Federal Register notice (61 FR 453) for damage assessments conducted under the Oil Pollution Act and the May 7, 1996, Federal Register notice (61 FR 20584) for damage assessments conducted under the Comprehensive Environmental Response, Compensation, and Liability Act.
Section 5, Biota Transfer Report, Consequence Analysis 13
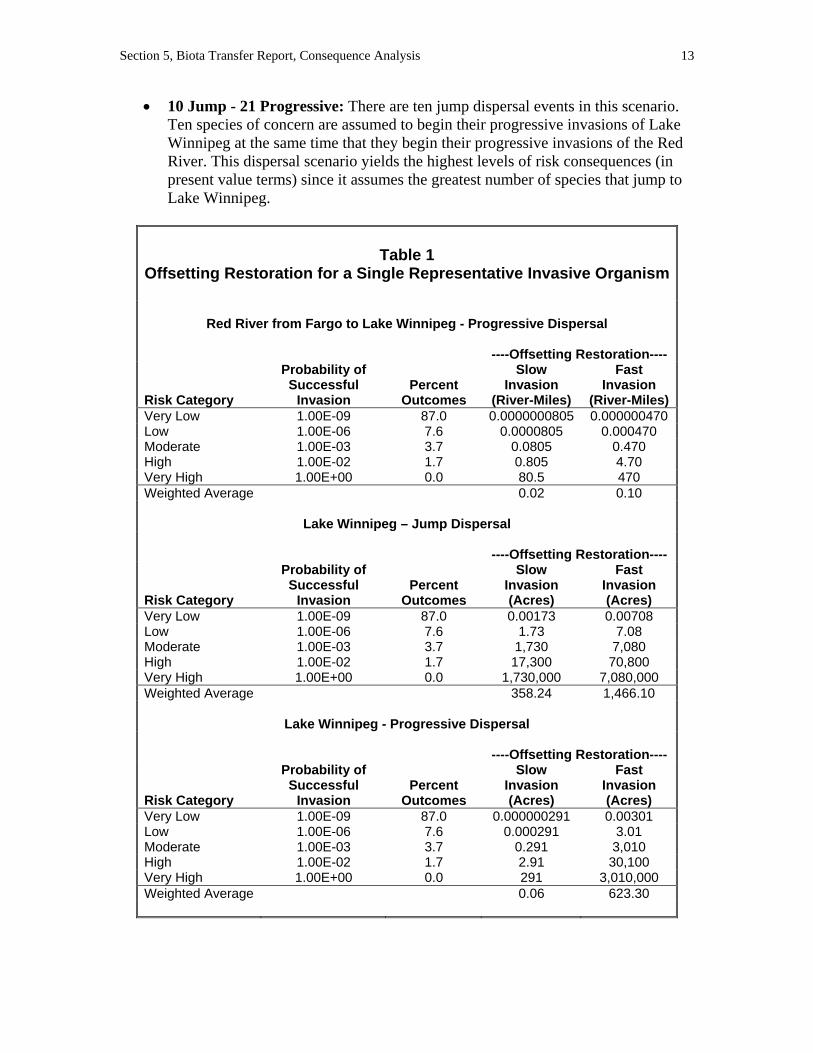
• 10 Jump - 21 Progressive: There are ten jump dispersal events in this scenario. Ten species of concern are assumed to begin their progressive invasions of Lake Winnipeg at the same time that they begin their progressive invasions of the Red River. This dispersal scenario yields the highest levels of risk consequences (in present value terms) since it assumes the greatest number of species that jump to Lake Winnipeg.
Table 1 Offsetting Restoration for a Single Representative Invasive Organism
Red River from Fargo to Lake Winnipeg - Progressive Dispersal
----Offsetting Restoration----
Risk Category
Probability of Successful
Invasion Percent
Outcomes
Slow Invasion
(River-Miles)
Fast Invasion
(River-Miles)Very Low 1.00E-09 87.0 0.0000000805 0.000000470 Low 1.00E-06 7.6 0.0000805 0.000470 Moderate 1.00E-03 3.7 0.0805 0.470 High 1.00E-02 1.7 0.805 4.70 Very High 1.00E+00 0.0 80.5 470 Weighted Average 0.02 0.10
Lake Winnipeg – Jump Dispersal
----Offsetting Restoration----
Risk Category
Probability of Successful
Invasion Percent
Outcomes
Slow Invasion (Acres)
Fast Invasion (Acres)
Very Low 1.00E-09 87.0 0.00173 0.00708 Low 1.00E-06 7.6 1.73 7.08 Moderate 1.00E-03 3.7 1,730 7,080 High 1.00E-02 1.7 17,300 70,800 Very High 1.00E+00 0.0 1,730,000 7,080,000 Weighted Average 358.24 1,466.10
Lake Winnipeg - Progressive Dispersal
----Offsetting Restoration----
Risk Category
Probability of Successful
Invasion Percent
Outcomes
Slow Invasion (Acres)
Fast Invasion (Acres)
Very Low 1.00E-09 87.0 0.000000291 0.00301 Low 1.00E-06 7.6 0.000291 3.01 Moderate 1.00E-03 3.7 0.291 3,010 High 1.00E-02 1.7 2.91 30,100 Very High 1.00E+00 0.0 291 3,010,000 Weighted Average 0.06 623.30
Section 5, Biota Transfer Report, Consequence Analysis 14
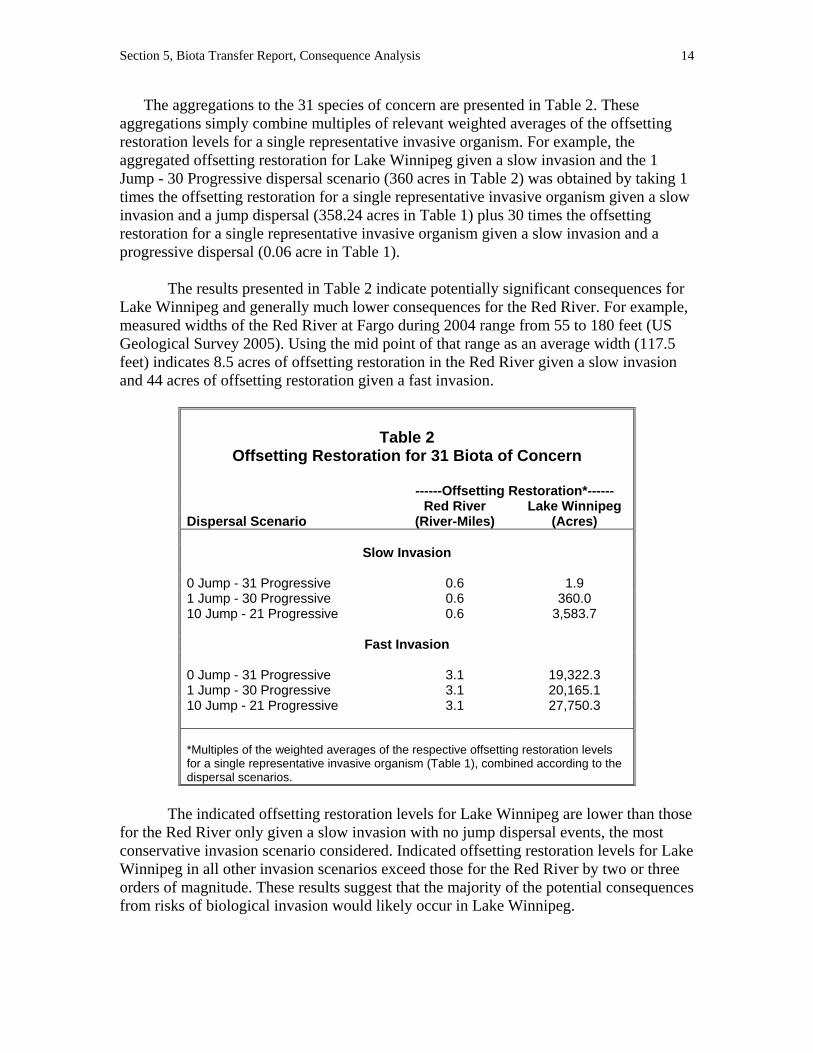
The aggregations to the 31 species of concern are presented in Table 2. These aggregations simply combine multiples of relevant weighted averages of the offsetting restoration levels for a single representative invasive organism. For example, the aggregated offsetting restoration for Lake Winnipeg given a slow invasion and the 1 Jump - 30 Progressive dispersal scenario (360 acres in Table 2) was obtained by taking 1 times the offsetting restoration for a single representative invasive organism given a slow invasion and a jump dispersal (358.24 acres in Table 1) plus 30 times the offsetting restoration for a single representative invasive organism given a slow invasion and a progressive dispersal (0.06 acre in Table 1).
The results presented in Table 2 indicate potentially significant consequences for Lake Winnipeg and generally much lower consequences for the Red River. For example, measured widths of the Red River at Fargo during 2004 range from 55 to 180 feet (US Geological Survey 2005). Using the mid point of that range as an average width (117.5 feet) indicates 8.5 acres of offsetting restoration in the Red River given a slow invasion and 44 acres of offsetting restoration given a fast invasion.
Table 2
Offsetting Restoration for 31 Biota of Concern
------Offsetting Restoration*------ Red River Lake Winnipeg Dispersal Scenario (River-Miles) (Acres)
Slow Invasion 0 Jump - 31 Progressive 0.6 1.9 1 Jump - 30 Progressive 0.6 360.0 10 Jump - 21 Progressive 0.6 3,583.7
Fast Invasion 0 Jump - 31 Progressive 3.1 19,322.3 1 Jump - 30 Progressive 3.1 20,165.1 10 Jump - 21 Progressive 3.1 27,750.3
*Multiples of the weighted averages of the respective offsetting restoration levels for a single representative invasive organism (Table 1), combined according to the dispersal scenarios.
The indicated offsetting restoration levels for Lake Winnipeg are lower than those
for the Red River only given a slow invasion with no jump dispersal events, the most conservative invasion scenario considered. Indicated offsetting restoration levels for Lake Winnipeg in all other invasion scenarios exceed those for the Red River by two or three orders of magnitude. These results suggest that the majority of the potential consequences from risks of biological invasion would likely occur in Lake Winnipeg.
Section 5, Biota Transfer Report, Consequence Analysis 15
This analysis indicates potentially significant consequences for Lake Winnipeg. However, the HEA method relies on an assumption that offsetting restoration is both feasible and available for implementation. Recognizing the possibility that appropriate restoration measures may not be feasible or available, a second economic approach, regional economic impact analysis, was used to describe potential consequences for Lake Winnipeg commercial fishing in terms of the impacts of risk on the economy (output or sales revenue and employment). Regional economic impact analysis does not assume the feasibility or availability of appropriate restoration measures. That analysis is described next.
5.4 Regional Economic Impact Analysis of Lake Winnipeg Commercial Fishing
Lake Winnipeg supports the largest commercial fishery in Manitoba, contributing 41% of total production and 58% of total landed value in the province (Manitoba Conservation 2003). From 1992 through 2002, the average landed value from the lake was $14,838,754 per year (Canadian 2003 $) and an average of 1,013 fishermen were employed in the fishery (ibid.). Commercial fishing is permitted at Lake Winnipeg only during specific seasons of the year (summer open water, fall open water, and winter).
The regional economic impacts of this fishery include both direct and indirect impacts. The direct impacts are the initial sales of the commercial fishing industry (an average of $14,838,754 per year). The indirect impacts arise as these initial sales reverberate through the economy from the purchase of necessary inputs from other industries (e.g., labor, fuel, and tackle).12 While the direct impacts occur within Manitoba, the indirect impacts can occur throughout the entire Canadian economy. Therefore, this analysis calculates the direct and indirect impacts of the Lake Winnipeg commercial fishery for all Canadian provinces.
The direct and indirect impacts estimated in this analysis are for sales revenue (also called output) and employment. These impacts were calculated using data purchased from Statistics Canada specifically for this analysis. These data, called multipliers, were determined by Statistics Canada through economic modeling and relate the output and employment impacts to the initial sales of the commercial fishing industry. Statistics Canada did not have multipliers available specifically for the commercial fishing industry in Manitoba, but did have multipliers for the broader “fishing, hunting, and trapping” industry for that province. Therefore, this analysis relies on the fishing, hunting, and trapping multipliers provided by Statistics Canada.
For consistency, the same biological invasion scenarios that were used in the HEA were also used in the regional economic impact analysis. For Lake Winnipeg, the
12 Regional economic impacts can also include induced impacts, which refer to the increased economic activity arising from household spending from income earned in either the directly affected or supporting industries. However, induced impacts were not quantified in this analysis due to data limitations.
Section 5, Biota Transfer Report, Consequence Analysis 16
relevant scenarios are defined by whether or not a jump dispersal event occurs. If a jump dispersal event occurs, a progressive invasion of Lake Winnipeg is assumed to begin at its southern shore at the same time that a progressive invasion of the Red River begins. If a jump dispersal event does not occur, the progressive invasion of Lake Winnipeg is assumed to begin only after the biological invasion has traversed the Red River.
The same slow and fast invasion rates used in the HEA were also used in the regional economic impact analysis. Therefore, a slow invasion would take 175 years to traverse Lake Winnipeg, and a fast invasion would take 17 years. Both the slow and fast invasions of Lake Winnipeg are assumed to begin immediately given a jump dispersal event. If a jump dispersal event does not occur, a slow invasion of Lake Winnipeg would begin after the 294 years it would take to traverse the Red River, and a fast invasion of Lake Winnipeg would begin after 29 years. See section 5.3 for an explanation of these invasion rates.
Once an invasion of Lake Winnipeg by any of the 31 species of concern begins, it is assumed to incrementally displace all commercial fishing at a constant rate. For example, a fast invasion is assumed to displace the entire commercial fishery in 17 years. This conservative approach recognizes the possibility that a single invasive organism might displace the entire fishery, and thereby sets an upper bound on the estimate of consequences for any invasion scenario considered.
Finally, since a potential displacement of the Lake Winnipeg commercial fishery would occur over a number of years, impacts occurring in the future are discounted to the present time so they can be added up in a meaningful way. This discounting applies to the output impacts since they are expressed in monetary terms. However, the employment impacts, which are expressed in terms of full-time equivalent jobs, are not discounted. For consistency, the same discount rate used in the HEA (3% per year) was used in the regional economic impact analysis as well.
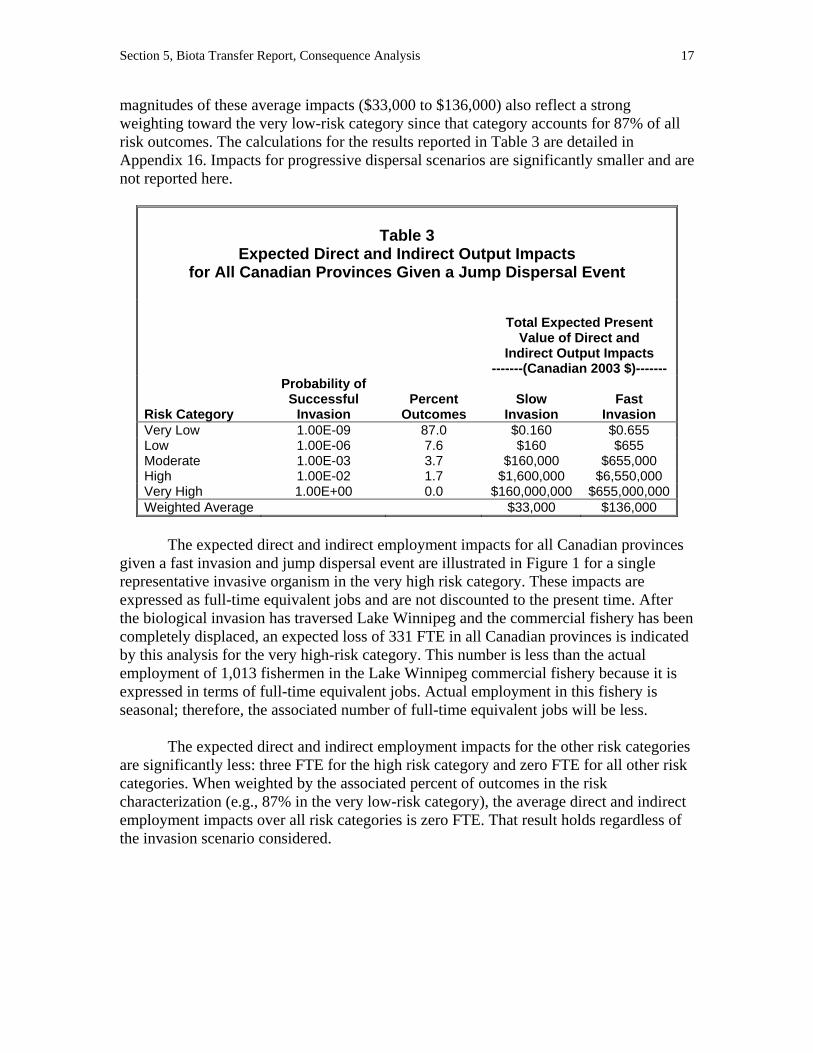
The potential direct and indirect output (sales revenue) impacts for all Canadian provinces given a jump dispersal event are reported in Table 3. Biological invasion scenarios involving a jump dispersal event will produce larger impacts than other scenarios since they are assumed to begin immediately (i.e., the effects of discounting are minimized). These impacts were first calculated separately for each risk category (very low, low, moderate, high, and very high). The probabilistic outcomes described in the risk characterization were then incorporated by calculating the average of these separate impact calculations for the different risk categories weighted by their respective percentage outcomes (Figure 1 in Section 4).
Given a jump dispersal event, the average total expected present value of the direct and indirect output impacts for all Canadian provinces ranges between $33,000 and $136,000, depending on whether the biological invasion is slow or fast. It is important to note that these impacts are expected values. Similar to the lost services included in the HEA, the economic impacts for each risk category reflect the associated probabilities of successful invasion (e.g., 1.00E-03 for the moderate risk category). The indicated
Section 5, Biota Transfer Report, Consequence Analysis 17
magnitudes of these average impacts ($33,000 to $136,000) also reflect a strong weighting toward the very low-risk category since that category accounts for 87% of all risk outcomes. The calculations for the results reported in Table 3 are detailed in Appendix 16. Impacts for progressive dispersal scenarios are significantly smaller and are not reported here.
Table 3
Expected Direct and Indirect Output Impacts for All Canadian Provinces Given a Jump Dispersal Event
Total Expected Present Value of Direct and
Indirect Output Impacts -------(Canadian 2003 $)-------
Risk Category
Probability of Successful
Invasion Percent
Outcomes Slow
Invasion Fast
Invasion Very Low 1.00E-09 87.0 $0.160 $0.655 Low 1.00E-06 7.6 $160 $655 Moderate 1.00E-03 3.7 $160,000 $655,000 High 1.00E-02 1.7 $1,600,000 $6,550,000 Very High 1.00E+00 0.0 $160,000,000 $655,000,000Weighted Average $33,000 $136,000
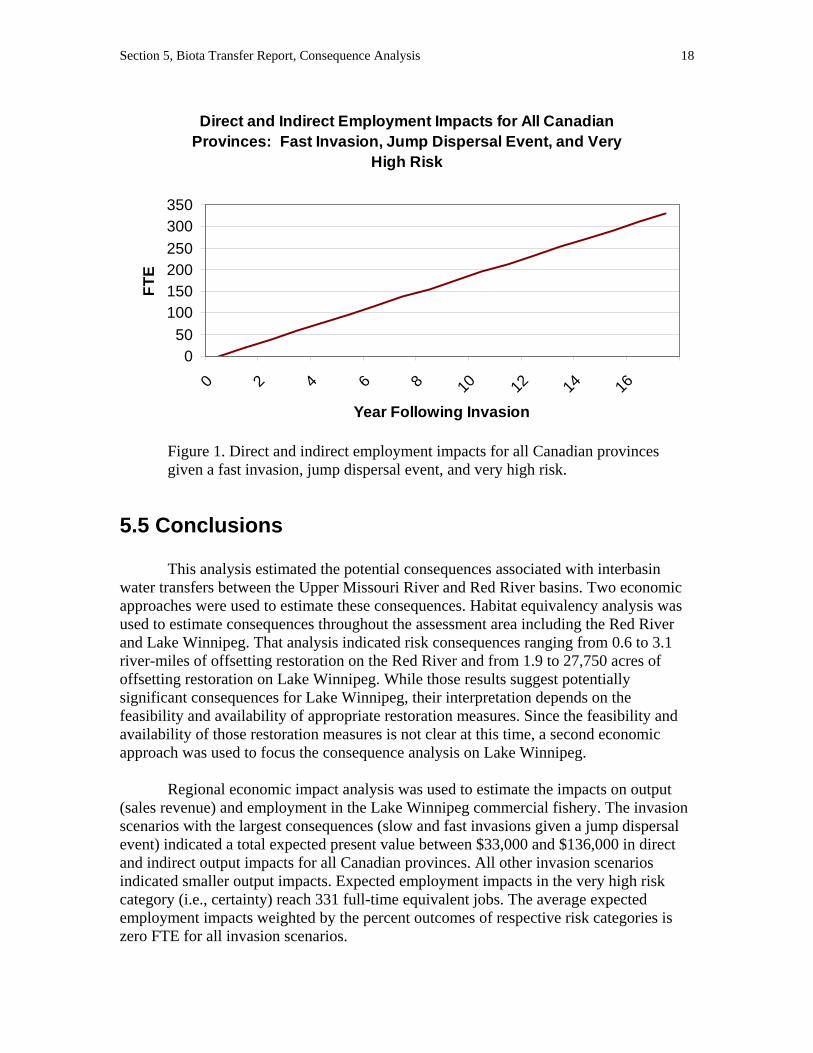
The expected direct and indirect employment impacts for all Canadian provinces
given a fast invasion and jump dispersal event are illustrated in Figure 1 for a single representative invasive organism in the very high risk category. These impacts are expressed as full-time equivalent jobs and are not discounted to the present time. After the biological invasion has traversed Lake Winnipeg and the commercial fishery has been completely displaced, an expected loss of 331 FTE in all Canadian provinces is indicated by this analysis for the very high-risk category. This number is less than the actual employment of 1,013 fishermen in the Lake Winnipeg commercial fishery because it is expressed in terms of full-time equivalent jobs. Actual employment in this fishery is seasonal; therefore, the associated number of full-time equivalent jobs will be less.
The expected direct and indirect employment impacts for the other risk categories are significantly less: three FTE for the high risk category and zero FTE for all other risk categories. When weighted by the associated percent of outcomes in the risk characterization (e.g., 87% in the very low-risk category), the average direct and indirect employment impacts over all risk categories is zero FTE. That result holds regardless of the invasion scenario considered.
Section 5, Biota Transfer Report, Consequence Analysis 18
Direct and Indirect Employment Impacts for All Canadian Provinces: Fast Invasion, Jump Dispersal Event, and Very
High Risk
050
100150200250300350
0 2 4 6 8 10 12 14 16
Year Following Invasion
FTE
Figure 1. Direct and indirect employment impacts for all Canadian provinces given a fast invasion, jump dispersal event, and very high risk.
5.5 Conclusions
This analysis estimated the potential consequences associated with interbasin water transfers between the Upper Missouri River and Red River basins. Two economic approaches were used to estimate these consequences. Habitat equivalency analysis was used to estimate consequences throughout the assessment area including the Red River and Lake Winnipeg. That analysis indicated risk consequences ranging from 0.6 to 3.1 river-miles of offsetting restoration on the Red River and from 1.9 to 27,750 acres of offsetting restoration on Lake Winnipeg. While those results suggest potentially significant consequences for Lake Winnipeg, their interpretation depends on the feasibility and availability of appropriate restoration measures. Since the feasibility and availability of those restoration measures is not clear at this time, a second economic approach was used to focus the consequence analysis on Lake Winnipeg.
Regional economic impact analysis was used to estimate the impacts on output (sales revenue) and employment in the Lake Winnipeg commercial fishery. The invasion scenarios with the largest consequences (slow and fast invasions given a jump dispersal event) indicated a total expected present value between $33,000 and $136,000 in direct and indirect output impacts for all Canadian provinces. All other invasion scenarios indicated smaller output impacts. Expected employment impacts in the very high risk category (i.e., certainty) reach 331 full-time equivalent jobs. The average expected employment impacts weighted by the percent outcomes of respective risk categories is zero FTE for all invasion scenarios.
Section 5, Biota Transfer Report, Consequence Analysis 19
Given the quantitative results from the habitat equivalency analysis and the
regional economic impact analysis, the following three conclusions can be drawn. First, the overall results are sensitive to the distribution of probabilistic outcomes from the risk characterization. From Tables 5-1 and 5-3, it can be seen that the indicated consequence levels for the individual risk categories vary substantially. That variance reflects the different probabilities of successful invasion. A different distribution of probabilistic outcomes would change the weighted averages of the consequence levels. Therefore, this consequence analysis is sensitive to the results of the risk analysis. In this particular case, the weighted average consequences are heavily weighted toward the lowest-risk category (87% of outcomes in the very low-risk category). A distribution more heavily weighted toward the higher-risk categories would yield substantially higher-weighted averages of consequences.
The second conclusion of this consequence analysis is that the speed of invasion significantly affects the quantitative results. Tables 5-1 and 5-2 indicate as many as four orders of magnitude difference in offsetting restoration levels between the two invasions speeds assumed in this analysis, and Table 3 indicates one order of magnitude difference in output impacts. A much more detailed analysis would match individually estimated invasion speeds to respective organisms and then aggregate the indicated consequence levels over the species of concern. However, the information regarding species-specific invasion speeds was not available to conduct that level of analysis. Therefore, this analysis indicates not only the significance of this analytic factor but also the need for additional research in this area.
Finally, this consequence analysis concludes that the anticipated distribution of the method and number of dispersal events substantially affects the quantitative results. This analysis considered only a limited set of potential dispersal scenarios. No information was available to inform the distribution of these scenarios to include in the analysis. However, the limited number of potential dispersal scenarios analyzed here indicated as many as four orders of magnitude difference in offsetting restoration levels between them. Similar to the conclusion regarding the speed of biotic invasion, this analysis indicates a significant analytic factor and a need for further research.
The questions raised about invasion speeds and the distribution of dispersal events are biological/ecological in nature and must be answered through additional biological/ecological research. However, additional economic research would also improve the estimates of risk consequences. For example, primary research and original economic modeling could be conducted to more accurately estimate the regional economic impacts associated with the Lake Winnipeg commercial fishery. Impact multipliers specifically for the commercial fishing industry in Manitoba were not available for the present analysis. Therefore, research to estimate those multipliers would improve the estimates of risk consequences.
Additional economic research could also be conducted to estimate other consequences than those related to commercial fishing. For example, biological invasions

Section 5, Biota Transfer Report, Consequence Analysis 20
could potentially impact the recreational fishing industry of Lake Winnipeg. Similar to commercial fishing, recreational fishing generates economic activity in Manitoba and throughout the Canadian economy. In addition to estimating the regional economic impacts on the recreational fishing industry, additional research could be conducted to estimate potential losses of net economic value to recreational anglers. That research would likely require public surveys and original economic modeling.13
5.6 References Allen, P.D., II, D.J. Chapman, and D. Lane, 2005, “Scaling Environmental Restoration to Offset Injury Using Habitat Equivalency Analysis,” in R.J.F. Bruins and M.T. Heberling (editors), Economics and Ecological Risk Assessment: Applications to Watershed Management, CRC Press, Boca Raton, FL. Arrow, K.J., 1999, “Discounting, Morality, and Gaming” in P.R. Portney and J.P. Weyant (editors), Discounting and Intergenerational Equity, Resources for the Future, Washington, DC. Brennan, T.J., 1999, “Discounting the Future: Economics and Ethics” in W.E. Oates (editor), The RFF Reader in Environmental and Resource Management, Resources for the Future, Washington, DC. Bruins, R.J.F., and M.T. Heberling (editors), 2005, Economics and Ecological Risk Assessment: Applications to Watershed Management, CRC Press, Boca Raton, FL. Desvousges, W.H., M.C. Naughton, and G.R. Parsons, 1992, “Benefits Transfer: Conceptual Problems in Estimating Water Quality Benefits Using Existing Studies,” Water Resources Research, 28: 675-683. Freeman, A.M., III, 1993, The Measurement of Environmental and Resource Values: Theory and Methods, Resources for the Future, Washington, DC. Jones, C.A., and K.A. Pease, 1997, “Restoration-Based Compensation Measures in Natural Resource Liability Statutes,” Contemporary Economic Policy, 15: 111-122. Kaval, P., and J. Loomis, 2003, “Updated Outdoor Recreation Use Values with Emphasis on National Park Recreation,” Department of Agricultural and Resource Economics, Colorado State University, Fort Collins, CO. Loomis, J., and G. Helfand, 2001, Environmental Policy Analysis for Decision Making, Kluwer Academic Publishers, Dordrecht, The Netherlands.
13 Relevant economic approaches include revealed preference methods such as the travel cost method and stated preference methods such as conjoint analysis.
Section 5, Biota Transfer Report, Consequence Analysis 21
Manitoba Conservation, 2003, “A Profile of Manitoba’s Commercial Fishery,” Fisheries Branch, Manitoba Conservation, Winnipeg, Manitoba. Manitoba Water Stewardship, 2004, “Lake Winnipeg Quick Facts,” http://www.gov.mb.ca/lakewinnipeg/facts/ (accessed October 7, 2004). Peacock, B.E., 1995, “The Appropriate Discount Rate for Social Policy Analysis: Discussion and Estimation,” Office of Policy Analysis, U.S. Department of the Interior, Washington, DC. Pearce, C.M., and D.G. Smith, 2002, “Introduced Saltcedar: Its distribution, abundance, and transport mechanisms in the northern Great Plains and implications for western Canada” in B. Tellman (editor), Weeds Across Borders: Proceedings of a North American Conference, Arizona-Sonoran Desert Museum, Tucson, AZ, pp. 75-82. Pearce, C.M., and D.G. Smith, 2003, “Saltcedar: distribution, abundance, and dispersal mechanisms, northern Great Plains,” Wetlands, 23: 215-228. Penn, T., and T. Tomasi, 2002, “Environmental Assessment: Calculating Resource Restoration for an Oil Discharge in Lake Barre, Louisiana, USA,” Environmental Management, 29: 691-702. Portney, P.R., and J.P. Weyant (editors), 1999, Discounting and Intergenerational Equity, Resources for the Future, Washington, DC. Skalski, G.T., and J.F. Gilliam, 2000, “Modeling diffusive spread in a heterogeneous population: A movement study with stream fish,” Ecology, 81: 1685-1700. Speirs, D.C., and W.S.C. Gurney, 2001, “Population persistence in rivers and streams,” Ecology, 82: 1219-1237 (including Appendix D. Parameters and their sources, Ecological Archives E082-016-A4). Thuesen, G.J., and W.J. Fabrycky, 2001, Engineering Economy, Prentice Hall, Upper Saddle River, NJ. Unsworth, R.E., and R.C. Bishop, 1994, “Assessing Natural Resource Damages Using Environmental Annuities,” Ecological Economics, 11: 35-41. US Army Corps of Engineers, 2004, “Red River of the North Main Stem Landmarks and River Mileage,” http://www.mvp-wc.usace.army.mil/org/RRN/Landmarks.shtml (accessed October 7, 2004). US Environmental Protection Agency, 2003, “Integrating Ecological Risk Assessment and Economic Analysis in Watersheds: A Conceptual Approach and Three Case Studies,” National Center for Environmental Assessment, U.S. Environmental Protection Agency, Report EPA/600/R-03/140R, Cincinnati, OH.

Section 5, Biota Transfer Report, Consequence Analysis 22
US Geological Survey, 2005, “Streamflow Measurements for North Dakota,” http://nwis.waterdata.usgs.gov/nd/nwis/measurements/ (accessed June 8, 2005). Weitzman, M.L., 1999, “Just Keep Discounting, But . . .” in P.R. Portney and J.P. Weyant (editors), Discounting and Intergenerational Equity, Resources for the Future, Washington, DC.