· 502 hay street mr rudolf brunovs non-executive director . subiaco western australia 6008 mr...
TRANSCRIPT

2014 Annual Report
Level 4, 502 Hay Street, Subiaco, Western Australia 6008Tel: 61 8 9286 6999 Fax: 61 8 9286 6969
www: deepyellow.com.au
DEEP YELLO
W LIM
ITED
2014 AN
UA
L REPORT
For
per
sona
l use
onl
y

CORPORATE DIRECTORY
BOARD OF DIRECTORS REGISTERED OFFICE
Mr Tim Netscher Chairman (Non-executive) Level 4
Mr Greg Cochran Managing Director 502 Hay Street
Mr Rudolf Brunovs Non-executive Director Subiaco Western Australia 6008
Mr Mervyn Greene Non-executive Director Telephone: + 61 8 9286 6999
Ms Gillian Swaby Non-executive Director Facsimile: + 61 8 9286 6969
Mr Christophe Urtel Non-executive Director Email: [email protected]
COMPANY SECRETARY POSTAL ADDRESS
Mr Mark Pitts PO Box 1770 Subiaco Western Australia 6904
STOCK EXCHANGE LISTINGS AUDITOR
Australian Securities Exchange (ASX) Code: DYL Ernst & Young Namibian Stock Exchange (NSX) Code: DYL 11 Mounts Bay Road
Perth Western Australia 6000
WEBSITE ADDRESS SHARE REGISTRY
www.deepyellow.com.au Computershare Investor Services Pty Limited Level 2, Reserve Bank Building
45 St George’s Terrace
AUSTRALIAN BUSINESS NUMBER Perth Western Australia 6000
97 006 391 948 Telephone: 1300 557 010
Facsimile: +61 8 9323 2033
CONTENTS Summary Information 1
Highlights of the 2014 Financial Year 2
Chairman’s Letter 3
Review of Operations
Namibia Projects 4
Target Generation 10
Mineral Resource Statements 12
Corporate Governance Statement 15
Directors’ Report 21
Remuneration Report 26
Auditor’s Independence Declaration 37
Financial Statements 38
Notes to the Financial Statements 42
Directors’ Declaration 63
Independent Audit Report 64
ASX Additional Information 66
Deep Ye l l ow L im i t ed 2014 Annual R ep or t
For
per
sona
l use
onl
y

SUMMARY INFORMATION COMPANY PROFILE Deep Yellow Ltd (‘DYL’ or the ‘Company’) is an advanced stage uranium exploration company. The Company’s focus is in Namibia, where exploration is conducted by its wholly-owned subsidiary Reptile Uranium Namibia (Pty) Ltd. Omahola is the Company’s flagship project, the last remaining independently held high grade alaskite project in Namibia, which has a JORC (2004) Compliant Mineral Resource of 48.7 Mt at 420 ppm U3O8 for 45.1 Mlbs U3O8 from three relatively shallow hard rock deposits, Ongolo, MS7 and INCA. Omahola is at scoping stage, with drilling having for the moment been concluded at the three existing deposits. The results of a Preliminary Economic Assessment (“PEA”) were announced during the year which demonstrated that the Project was better suited to the development of an acid heap leach as opposed to tank leach operation. A successful column leach test on a composite of drill samples collected from the Ongolo and MS7 alaskite deposits was completed in the previous financial year which opened up the potential for the adoption of heap leach processing for the Project. Clearly, extensive metallurgical testwork must still be conducted to ensure the technical feasibility of such a strategy. The results of the PEA had the added benefit of obviating the need for expensive trade-off metallurgical studies at this stage. Ongoing work at the end of the financial year included a further review of the mining studies conducted as a part of the PEA as well as and planning of the next phase of scoping level metallurgical testwork. The timing of the completion of these studies and further testwork is largely dependent on capital availability and the state of the uranium market. In its quest to add to the Omahola resource base the Company completed a major prospectivity analysis designed to identify the next generation of high grade alaskite targets in the region. As a result fifteen alaskite-type targets were identified and assessment was ongoing at year-end. DYL also made progress on its Tubas Sand Project during the year. We published a JORC 2012 Compliant Mineral Resource update for the project covering a slightly higher grade and more precisely defined subset of the ore body and also completed a preliminary techno-economic trade-off study. The study confirmed the economics of the project under various operating scenarios, with the production of a higher grade sand concentrate for sale to an existing Namibian uranium producer being the preferred operating strategy in the short term. Critically, this approach still retains the option of incorporating the sand into DYL’s flagship Omahola Project in the medium to longer term. While securing an offtaker is the critical next step, interim planning is also underway for further studies which could, depending on funding and market conditions, be completed by end-2015. The Company ran a process that lasted throughout the financial year to find a suitable buyer for its Shiyela Iron Project. A preferred bidder was selected at the beginning of 2014 but commercial issues indirectly related to the bidder resulted in extended delays in finalising a transaction. By the end of the financial year doubts had arisen over the bidder’s ability to close a transaction in the short term. DYL continued to drop exploration tenements in Australia and by the end of the year retained only the Napperby Project in the Northern Territory and some free-carried joint venture exploration tenements in Queensland. CORPORATE STRATEGY DYL’s strategy is to successfully make the transition from advanced explorer to developer and producer by single-mindedly focussing on advancing its flagship Omahola Project.
Deep Ye l l ow L im i t ed 1 2014 Annual R ep or t
For
per
sona
l use
onl
y
HIGHLIGHTS OF THE 2014 FINANCIAL YEAR OMAHOLA PROJECT
∗ An in-house preliminary economic analysis was completed resulting in the recommendation that the project would likely be developed as a heap leach rather than a tank leach operation.
∗ The study obviated the need for a costly comparative metallurgical testwork program at this stage to compare an
acid tank leach project for Omahola against an acid heap leach project.
∗ The analysis also generated estimates of a likely range of strip ratios and cut-off and cut-over grades.
∗ A previous metallurgical sighter test demonstrated the potential for the application of heap leach processing with encouraging uranium recovery and comparatively low acid consumption – more testwork in the scoping and feasibility stages will be required to confirm expected performance levels.
∗ Omahola’s resource is currently reported as 48.7 Mt at an average grade of 420 ppm U3O8 for 45.1 Mlbs U3O8 at a
250 ppm U3O8 cut-off but will be re-evaluated at a lower cut-off, likely to be 100 ppm U3O8.
∗ The study also concluded that deeper drilling at the MS7 deposit, which is open to depth, could be economically justified.
TUBAS SAND PROJECT
∗ As a result of the previous year’s resource update which defined a larger higher grade resource DRA Mineral Projects was engaged to complete a preliminary techno-economic trade-off study for the Project. The study confirmed the economics of the project under various operating scenarios.
∗ Production of a sand concentrate for sale to an existing Namibian producer was selected as the preferred operating
strategy in the short term, making the securing an offtaker the critical next step.
∗ Importantly, this approach still retains the option of incorporating the sand into Deep Yellow’s flagship Omahola Project in the longer term.
∗ CSA Global completed a JORC 2012 compliant Mineral Resource Estimate update for the Project over a higher grade
subset of the existing resource; the estimate being 34 Mt at 170 ppm U3O8 for 12.7 Mlbs U3O8 (Indicated and Inferred) at a 100 ppm U3O8 cut-off.
∗ An infill, extension and expansion drilling program was designed and a decision to proceed is pending.
PROSPECTIVTY ANALYSIS AND TARGET GENERATION
∗ Fifteen alaskite-type targets were identified in a major prospectivity analysis designed to identify the next generation of high grade alaskite targets on Exclusive Prospecting Licence 3496 and other contiguous licences.
∗ The Prospectivity Analysis was completed utilising multiple tools, databases and geological models.
∗ Six targets were assigned a high priority for follow-up, based on degree of outcrop, radiometric response and extent of previous drilling.
∗ It was the first time that some elements of the analysis were used to attempt to identify alaskite targets in Namibia.
∗ Most of the targets were reviewed by geological mapping by the end of the financial year with varying results – on
some of the targets potential was confirmed whilst on other targets’ prospectivity was downgraded.
LICENCE RENEWALS
∗ Three Exclusive Prospecting Licences held by the Company’s wholly-owned Namibian operating subsidiary were renewed for a further two years.
∗ The Company’s key projects, Omahola, Tubas Sand and the Palaeochannels are hosted on these Exclusive Prospecting Licences.
∗ The three Nova Joint Venture Exclusive Prospecting Licences, majority owned and managed by Deep Yellow were
also renewed for a further two years. Two of these Licences are considered prospective for uranium bearing alaskites and palaeochannel occurrences.
Deep Ye l l ow L im i t ed 2 2014 Annual R ep or t
For
per
sona
l use
onl
y

CHAIRMAN’S LETTER
Dear shareholders,
This is my first chairman’s letter, having become chairman of your company on 1 September 2013, upon taking over from long-time Deep Yellow chairman, Mervyn Green. In his last chairman’s letter, Mervyn talked about FY2013 being a difficult year for the uranium industry but he foreshadowed positive changes driven by a looming supply deficit.Unfortunately, the positive changes did not materialise during FY2014. Against this backdrop, the spot uranium price relentlessly trended down for most of FY2014. Indeed, the price tracked below US$30/lb for several months during FY2014, a price at which three quarters of the world’s uranium mines would not even cover their cash costs of production and they have only survived because many have been able to sell their output at higher legacy contract prices.
That said, fortunately all the signs of the positive changes predicted in Mervyn’s letter are still there. With 72 nuclear power stations currently under construction, the robust build of nuclear power stations continues in several countries, particularly China. To put this in context, the current fleet of operational reactors is 435, generating about 373 GW of electricity. Focussing on China briefly: studies predict that in the next 20 years, China’s GDP per person is likely to rise from the approximately $10,000/person measured in 2012 to approximately $30,000/ person, which will be about 60% of that currently being enjoyed in the US. It is estimated from studies on electricity consumed per person at that level of GDP/person in other countries that about 1250GW of extra generating capacity will need to be installed in China. Almost 4 billion tonnes p.a. of coal is burnt in China each year for electricity generation. This already creates significant coal transport logistics and pollution problems. Similarly, there are logistics problems associated with getting gas from the well to the points of consumption and there is a limit to what can be generated by renewable sources such as wind, solar and hydro-power. Even if 20% of this additional 1250 GW is sourced from nuclear power, this represents a significant extra uranium requirement over the next 20 years when compared with the current global nuclear generating capacity of 373 GWe. It is also important to note that the cost of nuclear power is relatively insensitive to the uranium price. In the past year, the only negative factor to emerge in this picture has been the slower than expected restarts of closed reactors in Japan, where the permitting process is taking longer than expected. However, even here there has been some welcome but belated movement in the past few months.
On the supply side, in the current price environment, there is little incentive to bring new uranium supply onto the market. As a result, many potential projects have made little progress in the past few years and given the long gestation period of new projects, as they make their way through permitting and the various approval processes and eventually through the construction phase, supply is expected to be constrained for the foreseeable future.
In short, there is still a looming uranium supply deficit, with the only question being when it will manifest in the form of more robust uranium prices.
In the environment of last year, it became extremely difficult for Deep Yellow to raise meaningful funding to progress its exciting suite of projects. Nonetheless, in the early part of FY2014, we completed a successful SPP, raising almost $1 million and subsequent to year end we completed an entitlement offer and placement, raising in excess of $4.5 million. These were remarkable achievements in the prevailing depressed circumstances and reflect the faith of our investors, including our major shareholders, in the uranium story and Deep Yellow’s part in it. In this difficult environment, the board’s strategy is to:
• Minimise overheads and thereby maximise the “bang for the buck” with the company’s limited financial resources;
• Protect our valuable assets in Namibia (where the environment remains very supportive of the uranium industry) and keep them in good standing for the inevitable turnaround in the fortunes of the uranium industry; and
• Position ourselves to quickly take advantage of the coming price turnaround.
To this end, for the entire year, the board and management of Deep Yellow Limited have relentlessly striven to reduce costs, particularly overhead costs, in order to channel as much of our available funds as possible into productive uses. In this regard, since July 2011, excluding modest committee fees, directors’ cash fees have reduced from $75,000 p.a. to $34,000 p.a. and the Managing Director’s cash salary has reduced from $507,000 p.a. to $275,000 p.a. over the same period. Australian corporate costs are projected to fall from $383,000 p.a. in FY2012 to approximately $179,000 p.a. in the current financial year. These are very significant reductions and demonstrate the resolve by management and the board to deliver shareholder value in extremely difficult circumstances for the uranium industry and for our company.
By these and other means, the board and management firmly believes that it now has sufficient financial resources to deliver this prudent strategy without recourse to further funding until well into the 2016 financial year. In short, we have taken timeous steps to cut our coat according to our cloth and we will be well positioned to rapidly capitalise on the upturn in the uranium price when it occurs.
In conclusion, I would like to thank Mervyn Greene, the previous chairman for competently steering the company over 6 years to the end of August 2013. Also, thank you to my fellow directors and management who have unstintingly stepped up to the plate to deliver shareholder value, despite ever-declining remuneration. Finally thank you to our hard-working and very competent staff in both Australia and Namibia for their loyal service.
Yours sincerely,
Tim Netscher
Deep Ye l l ow L im i t ed 3 2014 Annual R ep or t
For
per
sona
l use
onl
y

NAMIBIA - PROJECTS
Figure 1: Locality map showing DYL’s interests in Namibia as well as uranium mines and projects held by other companies
in the region
OMAHOLA PROJECT Overview The Omahola Project is the Company’s flagship project which consists of three relatively shallow open pitable hard rock deposits – the Ongolo and MS7 Alaskite deposits and the INCA deposit (Figure 2). Omahola’s JORC (2004) Compliant Measured, Indicated and Inferred Mineral Resource is 48.7 Mt at 420 ppm U3O8 for 45.1 Mlbs U3O8 at a 250 ppm cut-off. A cut-off grade of 250 ppm ensures that the average project grade is above 400 ppm which historically was estimated to be the grade required for an economically attractive, shallow open pit acid tank leach uranium mining project. However, recent desktop studies have indicated that a heap leach process may be more economically attractive and allow a greater resource recovery. Metallurgical testwork will be required to ensure technical feasibility of the concept.
Deep Ye l l ow L im i t ed 4 2014 Annual R ep or t
For
per
sona
l use
onl
y

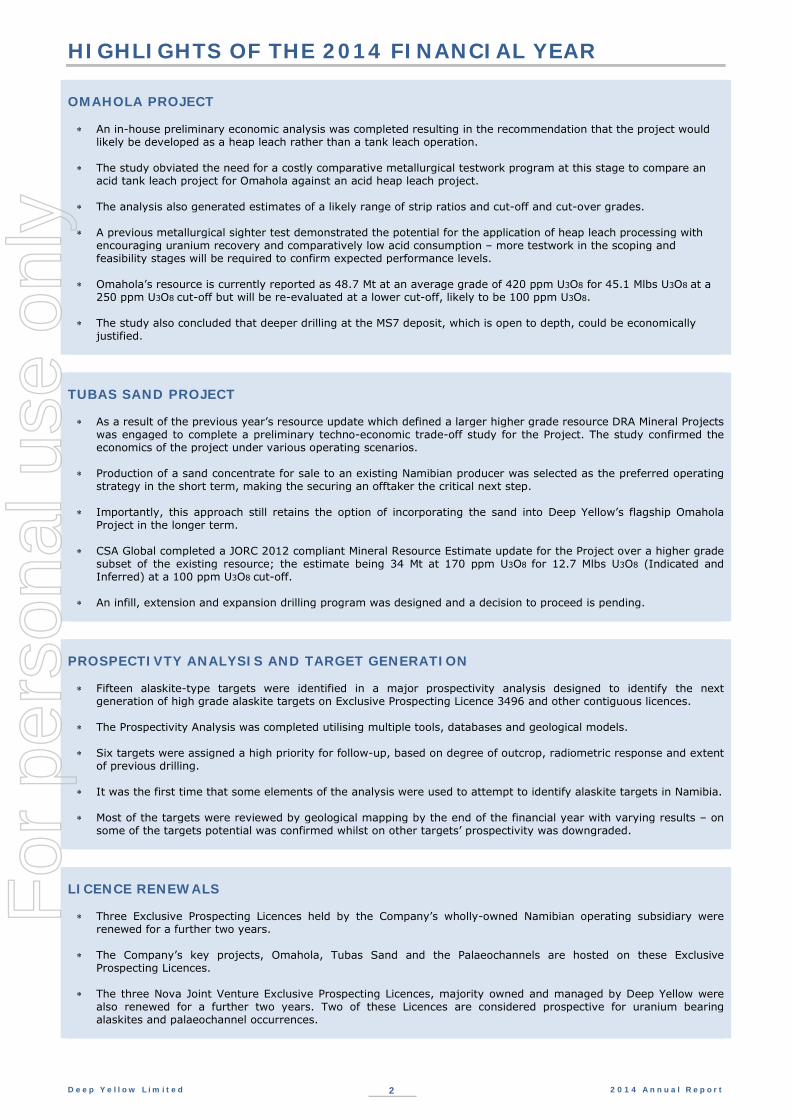
Figure 2: Omahola Project – Resource Outlines and Drilling – Ongolo - MS7 - INCA Area INCA Deposit INCA was the first new uranium discovery made by the Company towards the end of 2008. The mineralisation is best described as a hybrid skarn/alaskite deposit with metasomatic introduction of uranium and some iron into a north-east plunging syncline. Although the footwall to the syncline is competent crystalline marble, the skarn formation is limited and mostly occurs within other calc-silicate strata within the syncline. A small drill programme was completed at the beginning of the financial year which was aimed at converting unclassified mineralisation into Inferred material and thereby increases INCA’s Mineral Resource. (Figure 3). Seven of the fifteen holes drilled intercepted low to medium grade mineralisation which was below expectations, making a Mineral Resource update unwarranted.
Ongolo Alaskite Deposit The Ongolo Alaskite deposit is the largest but lowest grade deposit for the Omahola Project. Evaluation of the potential of alaskites in the northern part of EPL 3496 commenced in late 2007 however after the discovery of the INCA deposit, drilling was focused on that deposit for resource definition. Subsequently, Ongolo was discovered and an intensive campaign (completed in March 2011) was conducted to allow a maiden Ongolo JORC resource to be declared by Coffey Mining Pty Ltd (Perth) in May 2011. A resource upgrade was announced towards the end of 2011 and drilling continued through to the 2013 financial year to further enhance the resource base. The last resource update, which was conducted by CSA Global (UK) Pty Ltd, was announced in February 2013, saw a 39% increase in contained U3O8 with 58% of the Resource in the Measured or Indicated category. No further drilling has been conducted at Ongolo.
Deep Ye l l ow L im i t ed 5 2014 Annual R ep or t
For
per
sona
l use
onl
y
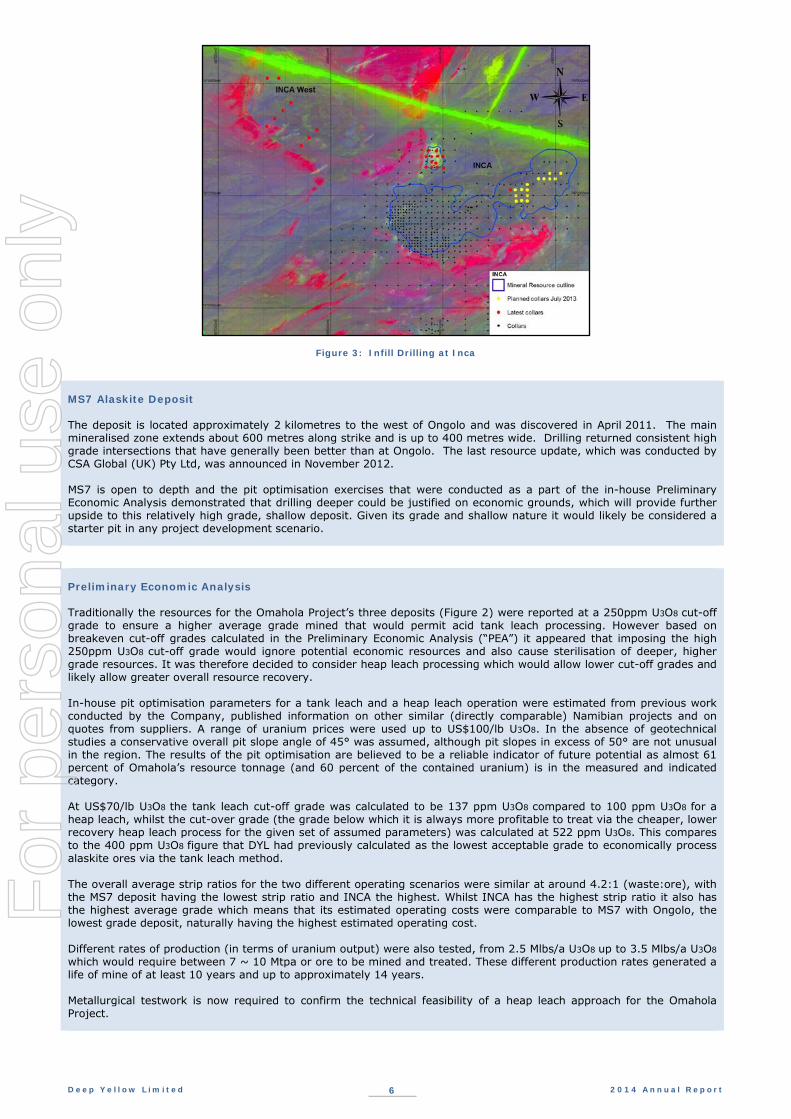
Figure 3: Infill Drilling at Inca
MS7 Alaskite Deposit The deposit is located approximately 2 kilometres to the west of Ongolo and was discovered in April 2011. The main mineralised zone extends about 600 metres along strike and is up to 400 metres wide. Drilling returned consistent high grade intersections that have generally been better than at Ongolo. The last resource update, which was conducted by CSA Global (UK) Pty Ltd, was announced in November 2012. MS7 is open to depth and the pit optimisation exercises that were conducted as a part of the in-house Preliminary Economic Analysis demonstrated that drilling deeper could be justified on economic grounds, which will provide further upside to this relatively high grade, shallow deposit. Given its grade and shallow nature it would likely be considered a starter pit in any project development scenario.
Preliminary Economic Analysis Traditionally the resources for the Omahola Project’s three deposits (Figure 2) were reported at a 250ppm U3O8 cut-off grade to ensure a higher average grade mined that would permit acid tank leach processing. However based on breakeven cut-off grades calculated in the Preliminary Economic Analysis (“PEA”) it appeared that imposing the high 250ppm U3O8 cut-off grade would ignore potential economic resources and also cause sterilisation of deeper, higher grade resources. It was therefore decided to consider heap leach processing which would allow lower cut-off grades and likely allow greater overall resource recovery. In-house pit optimisation parameters for a tank leach and a heap leach operation were estimated from previous work conducted by the Company, published information on other similar (directly comparable) Namibian projects and on quotes from suppliers. A range of uranium prices were used up to US$100/lb U3O8. In the absence of geotechnical studies a conservative overall pit slope angle of 45° was assumed, although pit slopes in excess of 50° are not unusual in the region. The results of the pit optimisation are believed to be a reliable indicator of future potential as almost 61 percent of Omahola’s resource tonnage (and 60 percent of the contained uranium) is in the measured and indicated category. At US$70/lb U3O8 the tank leach cut-off grade was calculated to be 137 ppm U3O8 compared to 100 ppm U3O8 for a heap leach, whilst the cut-over grade (the grade below which it is always more profitable to treat via the cheaper, lower recovery heap leach process for the given set of assumed parameters) was calculated at 522 ppm U3O8. This compares to the 400 ppm U3O8 figure that DYL had previously calculated as the lowest acceptable grade to economically process alaskite ores via the tank leach method. The overall average strip ratios for the two different operating scenarios were similar at around 4.2:1 (waste:ore), with the MS7 deposit having the lowest strip ratio and INCA the highest. Whilst INCA has the highest strip ratio it also has the highest average grade which means that its estimated operating costs were comparable to MS7 with Ongolo, the lowest grade deposit, naturally having the highest estimated operating cost. Different rates of production (in terms of uranium output) were also tested, from 2.5 Mlbs/a U3O8 up to 3.5 Mlbs/a U3O8 which would require between 7 ~ 10 Mtpa or ore to be mined and treated. These different production rates generated a life of mine of at least 10 years and up to approximately 14 years. Metallurgical testwork is now required to confirm the technical feasibility of a heap leach approach for the Omahola Project.
Deep Ye l l ow L im i t ed 6 2014 Annual R ep or t
For
per
sona
l use
onl
y

Omahola Project Competent Persons’ Statements Exploration Results and Mineral Resource Statement (JORC 2004) The information in this report that relates to Exploration Results for the Ongolo, MS7 and INCA deposits is based on information compiled by Dr Katrin Kärner who is a Member of the Australasian Institute of Mining and Metallurgy (MAusIMM CP(Geo)). Dr Kärner, who was the Exploration Manager for Reptile Uranium Namibia (Pty) Ltd, has sufficient experience which is relevant to the style of mineralisation and type of deposit under consideration and to the activity which she is undertaking, to qualify as a Competent Person in terms of the ‘Australasian Code for Reporting of Exploration Results, Mineral Resources and Ore Reserves’ (JORC Code 2004 Edition). Dr Kärner consents to the inclusion in the report of the matters based on her information in the form and context in which it appears. The information in this report that relates to the Ongolo and MS7 Mineral Resources is based on information compiled by Malcolm Titley of CSA Global UK Ltd. Malcolm Titley takes overall responsibility for the Report. He is a Member of the Australasian Institute of Geoscientists (‘AIG’) and the Australasian Institute of Mining and Metallurgy (‘AusIMM’) and has sufficient experience, which is relevant to the style of mineralisation and type of deposit under consideration, and to the activity he is undertaking, to qualify as a Competent Person in terms of the ‘Australasian Code for Reporting of Exploration Results, Mineral Resources and Ore Reserves’ (JORC Code 2004 Edition). Malcolm Titley consents to the inclusion of such information in this Report in the form and context in which it appears. The information in this report that relates to the INCA Mineral Resource Estimates is based on information compiled by Neil Inwood who is a Fellow of the AUSIMM. Mr Inwood was employed by Coffey Mining as a consultant to the Company at the time of the resource estimates and public release of results. As Mr Inwood is no longer employed by Coffey Mining, Coffey Mining has reviewed this report and consents to the inclusion, form and context of the relevant information herein as derived from the original resource reports for which Mr Inwood’s consents have previously been given. Mr Inwood has sufficient experience relevant to the style of mineralisation and type of deposit under consideration and to the activity which is being undertaken to qualify as a Competent Person in terms of the ‘Australasian Code for Reporting of Exploration Results, Mineral Resources and Ore Reserves’ (JORC Code 2004 Edition). The information in this report relating to the Omahola Project Exploration Results and Mineral Resource Estimates was prepared and first disclosed under the JORC Code 2004. It has not been updated since to comply with the JORC Code 2012 on the basis that the information has not materially changed since it was last reported.
TUBAS SAND PROJECT Overview The Tubas Sand Project consists primarily of a low grade secondary uranium mineralisation deposit (carnotite) in well-sorted aeolian (windblown) sand within the Tubas palaeochannel. The mineralisation is classified as free-dig sand and gravel amenable to upgrading via physical beneficiation. Pilot plant (Figure 4) testwork in 2011 demonstrated that the deposit could readily be physically beneficiated in an economical and chemical free process to produce a low carbonate, uranium rich sand concentrate that is amenable to alkali or acid leaching. Deep Yellow has long pursued a dual development strategy for the Tubas Sand Project to keep its options open – one being to produce an intermediate product which could be sold to an existing Namibian uranium producer whilst the other is to supply the Company’s own Omahola Project plant. The strategies are not mutually exclusive.
Figure 4: Schauenburg Pilot Plant in RUN’s Laboratory
Deep Ye l l ow L im i t ed 7 2014 Annual R ep or t
For
per
sona
l use
onl
y

Mineral Resource Update A 2012 review of the project’s resource base identified some resource risk that could be addressed by infill drilling and accordingly an 8,000 metre RC drilling programme was completed in 2013. The drill programme, within a subset of the existing resource, consisted of 560 mostly shallow (<15 metre deep) holes on a 50 by 50 metre spacing (Figure 5). Internal modelling indicated an encouraging improvement in grade from the previous 148ppm U3O8 and CSA Global Pty Ltd was thus appointed to provide the company with a new JORC 2012 compliant Mineral Resource Estimate (“MRE”) for the Project (see ASX announcement dated 24 March 2014). The new MRE focused on the most prospective one third of the area covered by the previous MRE and included results from infill drilling, mining studies and metallurgical test work. The MRE was based on Multi Indicator Kriging of sample (eU3O8) grades with the indicator bins being defined by sample probabilities, hard boundaries to mineralised domains were used in the estimation process. There is scope to increase mineral resources by extension drilling in the surrounding area. The new MRE has an average grade of 170ppm U3O8 reported at a cut-off of 100 ppm U3O8 compared to the previous 70 ppm U3O8 cut-off and is based on the economic parameters and likely mining method associated with the project which satisfied the JORC requirement of ‘reasonable prospects of eventual economic extraction’, validated by preliminary metallurgical test work and adequate estimation of the tonnage factor (dry in-situ bulk density). Other than the probability that the deposit will be processed using open pit mining techniques no additional modifying factors were considered. The classification of the MRE into Indicated and Inferred Mineral Resource categories was based on the global density of drilling in association with analysis of densely drilled select areas and is in accordance with guidelines specified in the JORC code (2012 Edition). As the deposit is not drilled on a regular grid it was not possible to specify a particular drill spacing associated with any particular resource category. The quality of geological logging and subsequent lithology boundary interpretation, and quality of uranium grade determination from drill hole sampling by both chemical and downhole gamma was considered adequate for the level of classification. Techno-Economic Trade-Off Study As a result of the previous year’s internal geological modelling that defined a higher grade resource DRA Mineral Projects (“DRA”) was engaged to complete a preliminary techno-economic trade-off study for the Tubas Sand Project. The study compared five processing options representing various levels of beneficiation, yielding products ranging from an upgraded sand concentrate through to uranium bearing precipitates. A physical beneficiation option consisting of ore scrubbing, classification and dewatering to produce an upgraded sand concentrate for sale to existing Namibian producers was selected as the preferred strategy. Within each of the processing options, subsets of opportunities were considered for overland transport (trucking or pumping) of concentrate, for obtaining process water by desalination and for integration with existing Namibian uranium producers. All options considered well established processing technologies and included ore scrubbing and size classification ahead of the main processing facility. The main processing plant comprised of beneficiation combinations of atmospheric acid tank leaching, resin in pulp, elution, solvent extraction and final product precipitation using either hydrogen peroxide or ammonia. The process design and subsequent capital and operating cost estimates derived for the various options were based on historic and current test work data, together with preliminary engineering, database estimating and by benchmarking with similar operations in Sub-Saharan Africa. Preliminary economic analysis indicated that increased levels of beneficiation will not improve the economic returns. As announced to the ASX on 8 May 2014 a physical beneficiation option consisting of ore scrubbing, classification by cyclones and dewatering to produce an upgraded sand concentrate for sale to existing Namibian producers was selected as the preferred processing strategy due to its economic, environmental, technical simplicity and capital intensity. In addition it does not preclude the inclusion of an upgraded product into an expanded Omahola Project which has long been considered to be attractive by Deep Yellow. Water, energy and product transportation costs were considered to be key for the future viability of the project. It was recommended that future study phases should aim to complete the necessary metallurgical characterisation test work which will include mineralogy, solid/liquid separation, rheology and diagnostic leaching to provide sufficient data for design and value optimisation.
Deep Ye l l ow L im i t ed 8 2014 Annual R ep or t
For
per
sona
l use
onl
y

Tubas Sand Project Competent Persons’ Statement
Mineral Resource Update – JORC 2012
Where the Company refers to the Tubas Sand Project resource upgrade in this report (referencing the release made to the ASX on 24 March 2014 entitled “Tubas Sand Project – Resource update”), it confirms that it is not aware of any new information or data that materially affects the information included in that announcement and all material assumptions and technical parameters underpinning the resource estimate with that announcement continue to apply and have not materially changed.
Trade-Off Study
Where the Company refers to the Tubas Sand Project preliminary techno-economic assessment and risk analysis study in this report it references an ASX release dated 8 May 2014 entitled “Tubas Sand Project Trade-Off Study” which was based on metallurgical information reviewed by Mr Val Coetzee (B.Eng (Chem), M.Eng, Pr.Eng, SAIMM). Mr Coetzee is a full time employee of DRA Global a Consulting Engineering Group. Mr Coetzee is a Professional Engineer registered with the Engineering Council of South Africa and has more than 13 years of relevant experience in this area of work. Mr Coetzee consents to the inclusion in this presentation of the matters based on information provided by him and in the form and context in which it appears.
Forward Looking Statements
Certain statements made in this report, including, without limitation, those concerning the preliminary economic analysis of the Omahola Project and the techno-economic assessment and risk analysis of the Tubas Sand Project, contain or comprise certain forward-looking statements regarding DYL’s exploration operations, economic performance and financial condition. Although DYL believes that the expectations reflected in such forward-looking statements are reasonable, no assurance can be given that such expectations will prove to have been correct. Accordingly, results could differ materially from those set out in the forward-looking statements as a result of, among other factors, changes in economic and market conditions, success of business and operating initiatives, changes in the regulatory environment and other government actions, fluctuations in metals prices and exchange rates and business and operational risk management. DYL undertakes no obligation to update publicly or release any revisions to these forward-looking statements to reflect events or circumstances after today's date or to reflect the occurrence of unanticipated events.
The Company notes that an inferred resource has a lower level of confidence than an indicated or measured resource. The Company believes that based on the geological nature of its deposit and the work done over several years by its geological team and its Competent Person that there is a high degree of probability that the inferred resources will upgrade to indicated resources with further exploration work.
Figure 5: Plan of drill holes used in resource update, also showing historical resource boundary
Deep Ye l l ow L im i t ed 9 2014 Annual R ep or t
For
per
sona
l use
onl
y

TARGET GENERATION
Prospectivity Analysis
A study to identify the next generation of high grade alaskite targets on the Company’s Exclusive Prospecting Licences(“EPLs”) was completed during the financial year with outstanding results. The predictive modelling analysis covered a substantial part of the Erongo uranium region and went beyond the area covered by the Company’s EPLs to test the targeting methodology against the location of known deposits. Several spatial datasets were used by presenting them in grid form and assigning prospectivity values to the majority of the 100m cells within each grid.
In the analysis three layers were used to score and then rank prospectivity: proximity to dome structures, proximity to marble and occurrence in remanently magnetised domains. It is believed that this is the first time that a prospectivity analysis has combined these specific layers in one map to identify alaskite targets in Namibia. The analysis generated fifteen conceptual alaskite-type targets with six assigned for high priority follow-up, based on degree of outcrop, radiometric response and extent of previous drilling (Figure 6).
Subsequent work focussed on visiting most of the high priority target areas and carrying out geological mapping, ground radiometric surveys and re-logging of key drill holes. Whilst the prospectivity of some of the fifteen targets was downgraded as a result of the follow-up work it was encouraging that at least five delivered results that will require further follow-up in the new financial year. This could involve a geophysical targeting technique such as IP and ultimately drilling as well.
Ground Induced Polarisation (“IP”) Survey
In addition to the Prospectivity Analysis an IP Survey was conducted on all three of the Omahola Project deposits. The pole-dipole IP data generated was interpreted and the results proved promising with sulphides at depth, which are considered as a pathfinder to alaskite-hosted uranium mineralisation, being detected using the IP method (Figure 7). It is therefore believed that the method can be used in the future as an exploration tool searching indirectly for uranium mineralisation hosted in alaskite.
Figure 6: Map showing some of the radiometric and conceptual targets identified on EPL3496
Deep Ye l l ow L im i t ed 10 2014 Annual R ep or t
For
per
sona
l use
onl
y

Figure 7: 3D Model of the MS7 deposit showing IP sections in relation to uranium mineralisation (grey) and sulphide occurrences (yellow). Marble wireframe is shown in blue.
Exploration Results
The information in this report that relates to Exploration Results for the Target Generation Study and related follow-up geological mapping and interpretation is based on information compiled by Dr Katrin Kärner who is a Member of the Australasian Institute of Mining and Metallurgy (MAusIMM CP(Geo)). Dr Kärner, who was the Exploration Manager for Reptile Uranium Namibia (Pty) Ltd, has sufficient experience which is relevant to the style of mineralisation and type of deposit under consideration and to the activity which she is undertaking, to qualify as a Competent Person in terms of the ‘Australasian Code for Reporting of Exploration Results, Mineral Resources and Ore Reserves’ (JORC Code 2004 Edition). Dr Kärner consents to the inclusion in the report of the matters based on her information in the form and context in which it appears.
Deep Ye l l ow L im i t ed 11 2014 Annual R ep or t
For
per
sona
l use
onl
y

NAMIBIA
Deposit Category Cut-off Tonnes U3O8 U3O8 U3O8
(ppm U3O8) (M) (ppm) (t) (Mlb)
Omahola Project - JORC 2004
INCA Deposit ◆ Indicated 250 7.0 470 3,300 7.2
INCA Deposit ◆ Inferred 250 5.4 520 2,800 6.2
Ongolo Deposit # Measured 250 7.7 395 3,000 6.7
Ongolo Deposit # Indicated 250 9.5 372 3,500 7.8
Ongolo Deposit # Inferred 250 12.4 387 4,800 10.6
MS7 Deposit # Measured 250 4.4 441 2,000 4.3
MS7 Deposit # Indicated 250 1.0 433 400 1.0
MS7 Deposit # Inferred 250 1.3 449 600 1.3
Omahola Project Total 48.7 420 20,400 45.1
Tubas Sand Project - JORC 2012
Tubas Sand Deposit # Indicated 100 10.0 187 1,900 4.1
Tubas Sand Deposit # Inferred 100 24.0 163 3,900 8.6
Tubas Sand Project Total 34.0 170 5,800 12.7
Tubas-Tumas Palaeochannel - JORC 2004
Tumas Deposit ◆ Indicated 200 14.4 366 5,300 11.6
Tumas Deposit ◆ Inferred 200 0.4 360 100 0.3
Tubas Calcrete Deposit Inferred 100 7.4 374 2,800 6.1
Tubas-Tumas Palaeochannel Total 22.2 369 8,200 18.0
Aussinanis Project - JORC 2004
Aussinanis Deposit ◆ Indicated 150 5.6 222 1,200 2.7
Aussinanis Deposit ◆ Inferred 150 29.0 240 7,000 15.3
Aussinanis Project Total 34.6 237 8,200 18.0
TOTAL RESOURCES 139.5 306 42,600 93.8
Deep Ye l l ow L im i t ed 12 2014 Annual R ep or t
Annual Mineral Resources Statements as at 30 June 2014
Namibia
Notes: Figures have been rounded and totals may reflect small rounding errors XRF chemical analysis unless annotated otherwise
eU3O8 - equivalent uranium grade as determined by downhole gamma logging # Combined XRF Fusion Chemical Assays and eU3O8 values Where eU3O8 values are reported it relates to values attained from radiometrically logging boreholes with Auslog equipment using an A675 slimline gamma ray tool. All probes are calibrated either at the Pelindaba Calibration facility in South Africa or at the Adelaide Calibration facility in South Australia.
Cut-off Tonnes U3O8 U3O8 U3O8
(ppm U3O8) (M) (ppm) (t) (Mlb)
Indicated 250 7.0 470 3,300 7.2
Inferred 250 5.4 520 2,800 6.2
Measured 250 7.7 395 3,040 6.7
Indicated 250 9.5 372 3,540 7.8
Inferred 250 12.4 387 4,810 10.6
Measured 250 4.4 441 1,955 4.3
Indicated 250 1.0 433 433 1.0
Inferred 250 1.3 449 584 1.3
48.7 420 20,462 45.1
Indicated 100 10.0 180 1,900 4.1
Inferred 100 24.0 163 3,900 8.6
34.0 170 5,800 12.7
Indicated 200 14.4 366 5,270 11.6
Inferred 200 0.4 357 143 0.3
Inferred 100 7.4 374 2,767 6.1
22.2 368 8,180 18.0
Indicated 150 5.6 222 1,243 2.7
Inferred 150 29.0 240 6,960 15.3
34.6 237 8,203 18.0
139.5 306 42,645 93.8
Deposit Category
Omahola Project - JORC 2004
INCA Deposit
Omahola Project Total
INCA Deposit
Ongolo Deposit #
Ongolo Deposit #
MS7 Deposit #
MS7 Deposit #
MS7 Deposit #
Ongolo Deposit #
Tubas Sand Deposit #
Tubas Sand Project Total
Tubas Sand Deposit #
Tubas Sand Project - JORC 2012
Tubas-Tumas Palaeochannel - JORC 2004
Tumas Deposit
Tumas Deposit
Tubas Calcrete Deposit
Tubas-Tumas Palaeochannel Total
Aussinanis Project - JORC 2004
Aussinanis Deposit
Aussinanis Deposit
Aussinanis Project Total
TOTAL RESOURCES
◆
For
per
sona
l use
onl
y

Deep Ye l l ow L im i t ed 13 2014 Annual R ep or t
Review of material changes
Omahola, Tubas-Tumas Palaeochannel and Aussinanis Projects – JORC 2004 There were no material changes to the respective resource bases of these Projects as shown in the Resource table above during the financial year. Tubas Sand Project – JORC 2012 As described in the Operations Section of this Annual Report, the results from additional drilling (completed in the previous financial year) within a subset of the previous resource, new resource modelling and changes to the resource estimate parameters were used to update the Tubas Sand Project’s mineral resource estimate. These were material changes that were fully disclosed in an ASX Announcement dated 24 March 2014. Where the Company refers to the current Tubas Sands Project Mineral Resource Estimate in this report it is referencing that announcement and it confirms that it is not aware of any new information or data that materially affects the information included in that announcement and all material assumptions and technical parameters underpinning the resource estimate in that announcement continue to apply and have not materially changed. A table comparing the Project’s previous mineral resource with the current mineral resource is presented below.
Tubas Sand Project – Comparison of Previous with Current MRE
Competent Person Statement The information in this Annual Mineral Resource Statement is based on and fairly represents information and supporting documentation prepared or reviewed by Dr Katrin Kärner, a Competent Person who is a Member of the Australasian Institute of Mining and Metallurgy (MAusIMM CP(Geo)). Dr Katrin Kärner, who was previously the Exploration Manager for Reptile Uranium Namibia (Pty) Ltd, has sufficient experience which is relevant to the style of mineralisation and type of deposit under consideration and to the activity which she is undertaking, to qualify as a Competent Person as defined in the 2004 Edition of the ‘Australasian Code for Reporting of Exploration Results, Mineral Resources and Ore Reserves’ and the 2012 Edition of the ‘Australasian Code for Reporting of Exploration Results, Mineral Resources and Ore Reserves’ . Dr Katrin Kärner consents to the inclusion in the report of the matters based on the information in the form and context in which it appears.
Tubas Sand Project - Comparison of Previous with Current MRE
Current
Category Cut-off Tonnes U3O8 U3O8 U3O8
(ppm U3O8) (M) (ppm) (t) (Mlb)
Indicated 100 10 187 1,900 4.1
Inferred 100 24 163 3,900 8.6
34 170 5,800 12.7
Previous
Category Cut-off Tonnes U3O8 U3O8 U3O8
(ppm U3O8) (M) (ppm) (t) (Mlb)
Inferred 70 87 148 12,876 28.4
87 148 12,876 28.4
Difference
Category Cut-off Tonnes U3O8 U3O8 U3O8
(ppm U3O8) (M) (ppm) (t) (Mlb)
Indicated 30 10 187 1,900 4.1
Inferred 30 -63 15 -8,976 -19.8
-53 22 -7,076 -15.7
Deep Ye l l ow L im i t ed 13 2014 Annual R ep or t
Review of material changes
Omahola, Tubas-Tumas Palaeochannel and Aussinanis Projects – JORC 2004 There were no material changes to the respective resource bases of these Projects as shown in the Resource table above during the financial year. Tubas Sand Project – JORC 2012 As described in the Operations Section of this Annual Report, the results from additional drilling (completed in the previous financial year) within a subset of the previous resource, new resource modelling and changes to the resource estimate parameters were used to update the Tubas Sand Project’s mineral resource estimate. These were material changes that were fully disclosed in an ASX Announcement dated 24 March 2014. Where the Company refers to the current Tubas Sands Project Mineral Resource Estimate in this report it is referencing that announcement and it confirms that it is not aware of any new information or data that materially affects the information included in that announcement and all material assumptions and technical parameters underpinning the resource estimate in that announcement continue to apply and have not materially changed. A table comparing the Project’s previous mineral resource with the current mineral resource is presented below.
Tubas Sand Project – Comparison of Previous with Current MRE
Competent Person Statement The information in this Annual Mineral Resource Statement is based on and fairly represents information and supporting documentation prepared or reviewed by Dr Katrin Kärner, a Competent Person who is a Member of the Australasian Institute of Mining and Metallurgy (MAusIMM CP(Geo)). Dr Katrin Kärner, who was previously the Exploration Manager for Reptile Uranium Namibia (Pty) Ltd, has sufficient experience which is relevant to the style of mineralisation and type of deposit under consideration and to the activity which she is undertaking, to qualify as a Competent Person as defined in the 2004 Edition of the ‘Australasian Code for Reporting of Exploration Results, Mineral Resources and Ore Reserves’ and the 2012 Edition of the ‘Australasian Code for Reporting of Exploration Results, Mineral Resources and Ore Reserves’ . Dr Katrin Kärner consents to the inclusion in the report of the matters based on the information in the form and context in which it appears.
For
per
sona
l use
onl
y

Deep Ye l l ow L im i t ed 14 2014 Annual R ep or t
Australia
Notes: Figures have been rounded and totals may reflect small rounding errors XRF chemical analysis unless annotated otherwise
Review of material changes There have been no material changes to the Company’s Australian resource base as shown in the Resource Table above during the past financial year. Competent Person Statement The information in this Annual Mineral Resource Statement is based on and fairly represents information and supporting documentation prepared or reviewed by Mr Geoffrey Gee, a Competent Person who is a Member of the Australasian Institute of Geoscientists. Mr Gee, who was previously employed as an Exploration Geologist with Deep Yellow, has sufficient experience which is relevant to the style of mineralisation and type of deposit under consideration and to the activity which he is undertaking, to qualify as a Competent Person as defined in the 2004 Edition of the ‘Australasian Code for Reporting of Exploration Results, Mineral Resources and Ore Reserves’. Mr Gee consents to the inclusion in the report of the matters based on the information in the form and context in which it appears.
Governance and Internal Controls – Namibia and Australia The Company maintains thorough QAQC protocols for conducting exploration, site practice, sampling, safety, monitoring and rehabilitation which are documented in the company’s various standard operating procedure manuals (SOPs). Drilling methods vary according to the nature of the prospect under evaluation. These can include auger, sonic, air core or reverse circulation drilling for unconsolidated formations; to reverse circulation (hammer) and diamond core drilling (HQ & NQ) for hard rock formations. Typically resource estimations are based on a mix of downhole radiometric sampling and chemical assaying. Assay samples are collected over one metre intervals. Radiometric data is acquired at 5 cm intervals and composited to one metre intervals. Where statistical validation confirms radiometric and chemical assay equivalence, the resource estimate is primarily based on the radiometric data. All radiometric data is acquired digitally by in-house personnel trained to operate the Company’s fleet of Auslog downhole probes. These probes are calibrated at the Pelindaba pits in South Africa. QAQC controls for radiometrically acquired data comprises daily calibration sleeve checks and periodic comparison at a Reptile Uranium Ltd test hole in Namibia. Assay samples are acquired by a three tier riffle splitter or cone splitter at the drill site. Duplicate samples are inserted at 1:20 frequency. Diamond core samples are assayed as quarter-core over one metre intervals. Anomalously radioactive samples are assayed at Reptile’s in-house laboratory in Swakopmund, by loose powder XRF. QAQC is maintained by incorporating industry standard blanks, duplicates and external reference materials, and are statistically validated. Referee assays are obtained from Scientific Services Laboratories, Cape Town or local Namibian external laboratories. External laboratories assay for uranium by either pressed powder XRF or fused bead XRF. Characterisation of radiometric equilibrium is periodically assessed by submission of samples to ANSTO Minerals Laboratory in Sydney, Australia. Drill hole collars are DGPS-surveyed by in-house operators, after an initial pick-up by hand-held GPS. Downhole directional surveys are outsourced to independent contractors. Drill hole sample logging captures a suite of lithologic, alteration, mineralogic and hand-held radiometric data, at one metre intervals. This data is captured as permanent hard copy prior to digital input onto an in-house GBIS database. The parallel collection of drill sample and wireline probe data enables error recognition in depth discrepancies and confirmation of sampling accuracy. Digital data validation is done in-house prior to confirmatory database validation by external resource consultants, commonly either Coffey Mining Pty Ltd, Perth or CSA Global, Johannesburg. Drill plans and sections generated from drilling and surface mapping are used to constrain wireframe mineralisation models; upon which resource estimations are made. Resource estimations for currently quoted prospects have been calculated by independent third party consultants; typically either Coffey Mining or CSA Global and have to date mostly been reported under JORC 2004 rules.
Cut-off Tonnes U3O8 U3O8 U3O8
(ppm U3O8) (M) (ppm) (t) (Mlb)
Inferred 200 9.3 359 3,351 7.4
9.3 359 3,351 7.4
Indicated 300 1.2 492 590 1.3
Inferred 300 0.6 500 300 0.7
1.8 494 890 2.0
11.1 382 4,241 9.4
Napperby Total
TOTAL RESOURCES
Mount Isa Project (Queensland) - JORC 2004
Mount Isa
Mount Isa
Mount Isa Total
Napperby Project (Northern Territory) - JORC 2004
Napperby
Deposit Category
AUSTRALIA
Deposit Category Cut-off Tonnes U3O8 U3O8 U3O8
(ppm U3O8) (M) (ppm) (t) (Mlb)
Napperby Project (Northern Territory) - JORC 2004
Napperby Inferred 200 9.3 359 3,351 7.4
Napperby Total 9.3 359 3,351 7.4
Mount Isa Project (Queensland) - JORC 2004
Mount Isa Indicated 300 1.2 492 590 1.3
Mount Isa Inferred 300 0.6 500 300 0.7
Mount Isa Total 1.8 494 890 2.0
TOTAL RESOURCES 11.1 382 4,241 9.4
Deep Ye l l ow L im i t ed 14 2014 Annual R ep or t
Australia
Notes: Figures have been rounded and totals may reflect small rounding errors XRF chemical analysis unless annotated otherwise
Review of material changes There have been no material changes to the Company’s Australian resource base as shown in the Resource Table above during the past financial year. Competent Person Statement The information in this Annual Mineral Resource Statement is based on and fairly represents information and supporting documentation prepared or reviewed by Mr Geoffrey Gee, a Competent Person who is a Member of the Australasian Institute of Geoscientists. Mr Gee, who was previously employed as an Exploration Geologist with Deep Yellow, has sufficient experience which is relevant to the style of mineralisation and type of deposit under consideration and to the activity which he is undertaking, to qualify as a Competent Person as defined in the 2004 Edition of the ‘Australasian Code for Reporting of Exploration Results, Mineral Resources and Ore Reserves’. Mr Gee consents to the inclusion in the report of the matters based on the information in the form and context in which it appears.
Governance and Internal Controls – Namibia and Australia The Company maintains thorough QAQC protocols for conducting exploration, site practice, sampling, safety, monitoring and rehabilitation which are documented in the company’s various standard operating procedure manuals (SOPs). Drilling methods vary according to the nature of the prospect under evaluation. These can include auger, sonic, air core or reverse circulation drilling for unconsolidated formations; to reverse circulation (hammer) and diamond core drilling (HQ & NQ) for hard rock formations. Typically resource estimations are based on a mix of downhole radiometric sampling and chemical assaying. Assay samples are collected over one metre intervals. Radiometric data is acquired at 5 cm intervals and composited to one metre intervals. Where statistical validation confirms radiometric and chemical assay equivalence, the resource estimate is primarily based on the radiometric data. All radiometric data is acquired digitally by in-house personnel trained to operate the Company’s fleet of Auslog downhole probes. These probes are calibrated at the Pelindaba pits in South Africa. QAQC controls for radiometrically acquired data comprises daily calibration sleeve checks and periodic comparison at a Reptile Uranium Ltd test hole in Namibia. Assay samples are acquired by a three tier riffle splitter or cone splitter at the drill site. Duplicate samples are inserted at 1:20 frequency. Diamond core samples are assayed as quarter-core over one metre intervals. Anomalously radioactive samples are assayed at Reptile’s in-house laboratory in Swakopmund, by loose powder XRF. QAQC is maintained by incorporating industry standard blanks, duplicates and external reference materials, and are statistically validated. Referee assays are obtained from Scientific Services Laboratories, Cape Town or local Namibian external laboratories. External laboratories assay for uranium by either pressed powder XRF or fused bead XRF. Characterisation of radiometric equilibrium is periodically assessed by submission of samples to ANSTO Minerals Laboratory in Sydney, Australia. Drill hole collars are DGPS-surveyed by in-house operators, after an initial pick-up by hand-held GPS. Downhole directional surveys are outsourced to independent contractors. Drill hole sample logging captures a suite of lithologic, alteration, mineralogic and hand-held radiometric data, at one metre intervals. This data is captured as permanent hard copy prior to digital input onto an in-house GBIS database. The parallel collection of drill sample and wireline probe data enables error recognition in depth discrepancies and confirmation of sampling accuracy. Digital data validation is done in-house prior to confirmatory database validation by external resource consultants, commonly either Coffey Mining Pty Ltd, Perth or CSA Global, Johannesburg. Drill plans and sections generated from drilling and surface mapping are used to constrain wireframe mineralisation models; upon which resource estimations are made. Resource estimations for currently quoted prospects have been calculated by independent third party consultants; typically either Coffey Mining or CSA Global and have to date mostly been reported under JORC 2004 rules.
Cut-off Tonnes U3O8 U3O8 U3O8
(ppm U3O8) (M) (ppm) (t) (Mlb)
Inferred 200 9.3 359 3,351 7.4
9.3 359 3,351 7.4
Indicated 300 1.2 492 590 1.3
Inferred 300 0.6 500 300 0.7
1.8 494 890 2.0
11.1 382 4,241 9.4
Napperby Total
TOTAL RESOURCES
Mount Isa Project (Queensland) - JORC 2004
Mount Isa
Mount Isa
Mount Isa Total
Napperby Project (Northern Territory) - JORC 2004
Napperby
Deposit CategoryF
or p
erso
nal u
se o
nly

CORPORATE GOVERNANCE STATEMENT GOVERNANCE FRAMEWORK The Board of Deep Yellow Limited (DYL) has responsibility for corporate governance for the Company and its subsidiaries (the Group) and has implemented policies, procedures and systems of control with the intent of providing a strong framework and practical means for ensuring good governance outcomes which meet the expectations of all stakeholders. The framework for corporate governance follows the 2nd Edition of the principles set out by the ASX Corporate Governance Council. The Directors have implemented policies and practices which they believe will focus their attention and that of their Executives on accountability, risk management and ethical conduct. This Statement sets out corporate governance practices adopted by the Board and which are in place during the financial year ending 30 June 2014. Where the Board considers the Group is not of sufficient size or complexity to warrant adoption of all the recommendations set out in the ASX Corporate Governance Council’s published guidelines, these instances have been highlighted. The Board has adopted the 3rd Edition of the ASX Corporate Governance Council’s Principals and Guidelines from 1 July 2014, the Board will continue to review its policies to ensure they reflect any changes within the Group, or to accepted principals and good practice. SHAREHOLDER COMMUNICATION The Board is committed to ensuring that there is open and timely communication with shareholders. Communications Policy The Board supports practices that provide effective and clear communications with security holders and allow security holder participation at general meetings. A formal Shareholder Communications Policy has been adopted, complying with Recommendation 6.1 of the Corporate Governance Council. In addition to electronic communication via the ASX website, all ASX announcements together with all quarterly reports are published. These documents are available on request and are posted on the Company website at www.deepyellow.com.au. In addition, the Company’s full Annual Reports are available on the website. The website provides shareholders and others the opportunity to receive additional information such as press releases and other materials electronically. Shareholders are able to pose questions on the audit process directly to the independent auditor who attends the Annual General Meeting for that purpose. Continuous Disclosure Policies The Board is committed to the promotion of investor confidence by providing full and timely information to all security holders and market participants about the Group’s activities and to comply with the continuous disclosure requirements contained in the Corporations Act 2001 and the Australian Securities Exchange Listing Rules. The Board has adopted a Continuous Disclosure Policy, complying with Recommendation 5.1 of the Corporate Governance Council and with the ASX Listing Rule Requirements. Continuous disclosure is discussed at all regular board meetings and on an ongoing basis the Board ensures that all activities are reviewed to assess the need for disclosure to the market. In accordance with ASX Listing Rules, the Company Secretary has been appointed as the Group’s disclosure officer. Directors’ Disclosure Obligations The Board is committed to complying with ASX Listing Rules and best practices particularly with respect to the level and nature of information provided by Directors. The Directors’ Disclosure Policy requires each of the Directors to provide continuous and timely disclosure of all dealings in Company securities in which the Director has a relevant interest. BOARD OF DIRECTORS Role of the Board of Directors The Board guides and monitors the business and management of the Group on behalf of shareholders by whom they are elected and to whom they are accountable. In order to fulfil this role, the Board is responsible for the overall corporate governance of the Group including formulating its strategic direction, setting remuneration and monitoring the performance of Directors and Executives. The Board relies on Executives to assist it in approving and monitoring expenditure, ensuring the integrity of internal controls and management information systems and monitoring financial and other reporting. The Board has adopted a Board Charter, complying with Recommendation 1.1 of the Corporate Governance Council, which clarifies the respective roles of the Board and Executives and assists in decision making processes. Board processes The Board agrees in advance a schedule of regular meetings for each calendar year, together with such other meetings as may be necessary. For the 2014 financial year, there were nine scheduled Board meetings and thirteen in total. A standardised agenda for the meetings has been adopted to ensure certain information is addressed consistently and other items which are relevant to reporting deadlines and or regular review are scheduled when and as appropriate. The agenda is reviewed and approved by the Chairman with the involvement of the Managing Director.
Deep Ye l l ow L im i t ed 15 2014 Annual R ep or t
For
per
sona
l use
onl
y
Evaluation of Senior Executive Performance The Executive Directors have undertaken a review of the performance of the Group’s executives during the year, complying with Recommendation 1.2 of the Corporate Governance Council. Board Composition The Constitution of the Company requires a minimum number of three Directors. There is no requirement for any shareholding qualification. The membership of the Board, its activities and composition is subject to periodic review. The criteria for determining the identification and appointment of a suitable candidate for the Board includes the quality of the individual, background of experience and achievement, compatibility with other Board members, credibility within the scope of activities of the Group, intellectual ability to contribute to Board duties and responsibilities and consideration of the objectives of the recently adopted Diversity Policy. In complying with Principles 2 and 3 of the Corporate Governance Council, the Board is mindful to ensure that it is comprised of individuals with skills to provide appropriate stewardship to the Group as it moves from an advanced stage explorer to a developer. The background of each Director is set out in the Directors Report section of the Annual Report. The Board is presently comprised of six members, five Non-executive and one Executive:
∗ Mr Tim Netscher - Chairman Non-executive Independent ∗ Mr Greg Cochran - Managing Director ∗ Mr Rudolf Brunovs - Non-executive Independent
∗ Ms Gillian Swaby - Non-executive ∗ Mr Mervyn Greene - Non-executive ∗ Mr Christophe Urtel - Non-executive
Independence of Directors In considering whether or not a Director is independent, the Board has regard to the independence criteria set out in the ASX Corporate Governance Council’s Principles and Recommendations. Directors are expected to bring independent views and judgement to the Board’s deliberations. Only two of the six Directors are considered by the Board to be independent, and as such the Company does not comply with Recommendation 2.1 of the Corporate Governance Council, which recommends that a majority of Board members should be independent. However, the Board considers that both its structure and composition are appropriate given the size of the Group and that the interests of shareholders are well met. As at the date of this report the Chairman is considered to be independent, and therefore the Group has complied with Recommendation 2.2 of the Corporate Governance Council. Roles of Chairman and Chief Executive Officer The roles of Chairman and Chief Executive Officer are exercised by separate individuals, and accordingly the Group complies with Recommendation 2.3 of the Corporate Governance Council. Nomination Committee The full Board carries out the functions of a Nomination Committee in respect of the selection and appointment process for Directors. While this does not comply with Recommendation 2.4 of the Corporate Governance Council which recommends having a separate Nomination Committee, the Board considers that given the size and maturity of the Group and the importance of Board composition it is appropriate that all members of the Board participate in such decision making. In carrying out this role, the Board is cognisant of the requirement to ensure that Board composition is appropriate for the Group’s stage of development. At this stage of the Groups development the Board believes that there is an appropriate mix of skills, experience, expertise and diversity on the Board. In the coming years as the Group assesses its development options for its various projects the Board believes that additional expertise is likely to be required and at that time further consideration will be given to ensuring the Board has an appropriate mix of skills and diversity. The current Board has a broad range of skill which are summarised in the table below:
Name Qualifications Length of service Mr Tim Netscher BSc(Eng) (Chemical), B Com., MBA, CEng, FIChemE, MAICD 1.5 years Mr Greg Cochran MSc Eng (Mining and Mineral Economics), MBA, FAusIMM, MAICD, MSAIMM 3.5 years Mr Mervyn Greene MA (Maths) BAI (Engineering), MBA 7.5 years Ms Gillian Swaby BBus FCIS FAICD 9 years Mr Rudolf Brunovs FCA FAICD MBA 7 years Mr Christopher Urtel MSc (Mining and Finance) BSc (First Class Honours – Geology with
Engineering Geology) 1.5 years
Retirement, re-election and appointment of new Directors The constitution of the Company notes that Directors cannot hold office for a period longer than three years without submitting themselves for re-election at the next AGM, one third of the Directors (other than the Managing Director) must retire by rotation at each AGM together with any new Directors appointed by the Board during the period since the last general meeting. Retiring Directors are eligible to stand for re-election. If the Board decides to appoint a new member either to complement the existing members or fill a vacancy, it goes through the process of identifying a wide base of potential candidates with appropriate skills and with a view to meeting the objectives of its Diversity Policy. This process would likely involve the appointment of an independent and experienced recruitment firm and would involve a rigorous process including Director interviews and discussions; site visits; and if necessary discussions with senior management. Evaluation of Board Performance The Group has a formal process for the evaluation of the effectiveness, processes and structure of the Board, and as such complies with Recommendation 2.5 of the Corporate Governance Council. The Board undertakes an annual formal review of its performance. The process includes the completion of individual questionnaires focused on Board process, effectiveness and structure as well as the effectiveness and contribution made by each Director. The responses are collated and discussed with a view to considering recommendations for improvement and/or appropriate changes.
Deep Ye l l ow L im i t ed 16 2014 Annual R ep or t
For
per
sona
l use
onl
y

Education All Executives and Directors are encouraged to attend professional education courses relevant to their roles. Independent professional advice and access to information Each Director has the right to access all relevant information in respect to the Group and to make appropriate enquiries of Executives. Structure of Non-executive and Executive Directors Remuneration The objective of Group remuneration policies, processes and practices is to:
∗ attract and retain appropriately qualified and experienced Directors who will add value;
∗ result in competitive remuneration bench marked against peer groups; and
∗ adopt reward programmes which are fair and responsible, in accordance with the principles of good corporate governance and which align Director entitlements with shareholder objectives.
The Remuneration Committee makes recommendations to the Board on the basis of individual performance, trends in comparative companies and the need for a balance between fixed remuneration and non-cash incentive remuneration. Remuneration packages for Executive Directors comprise fixed remuneration and may include short term incentives in the form of cash bonuses or long term incentives in the form of performance rights as per individual contractual agreements. Remuneration packages are reviewed by the Remuneration Committee. The process consists of a review of Group, individual performance and relevant comparative remuneration externally and internally. Non-executive Director remuneration is a fixed annual amount of Director fees, the total of which is within the amount approved by shareholders. Performance based cash bonuses or equity based remuneration has not been considered appropriate for Non-executive Directors in the past, however the Board has adopted and announced a practice in this financial year of seeking to reduce the cash drain on the Company and accordingly will seek shareholder approval for the issue of shares in lieu of the part payment of Non Executive Director fees at the upcoming Annual General Meeting. In spite of the change to the remuneration of Non-executive Directors in this financial year the Company believe it continues to distinguish between the remuneration practices for its Non-executive Directors and the remuneration practices applicable to Executive Directors, the Company therefore complies with Recommendation 8.3 of the Corporate Governance Council. A full outline of the remuneration policy is set out in the Remuneration Report of the Group’s Annual Report. BOARD COMMITTEES The Board has established several Committees with separate charters which it relies on to assist with the proper discharge of its duties. The Chairman of the Board has included the Committees in his evaluation of Board performance through the circulation and completion of specific questionnaires seeking comment on the effectiveness and structure of the Committees. Audit Committee The Audit Committee is comprised of three Non-executive Directors and complies with Recommendation 4.1 of the Corporate Governance Council. The Audit Committee consists of Non-executive Directors and is chaired by an Independent Director who is not the Chairman of the Board. However, the majority of members of the Audit Committee are not independent and the Group therefore does not comply with Recommendation 4.2 of the Corporate Governance Council. The members of the Audit Committee are Rudolf Brunovs (Chairman), Mervyn Greene and Gillian Swaby. The relevant qualifications and details of attendance at Audit Committee meetings are set out in the Directors’ Report. This complies with Recommendation 4.4 of the Corporate Governance Council. The Audit Committee operates under an Audit Committee Charter which complies with Recommendation 4.3 of the Corporate Governance Council. The responsibilities of the Audit Committee include the appointment, compensation and oversight of the independent auditor and the review of the published financial reports. Remuneration Committee The Remuneration Committee has been established to assist the Board by making recommendations on remuneration packages for Executive and Non-executive Directors, and where appropriate, senior managers. In addition, the Remuneration Committee reviews proposed long and short term incentive plans including the appropriate use of performance based hurdles. The Remuneration Committee consists of four Non-Executive Directors being Mervyn Greene (Chairperson)*, Gillian Swaby, Rudolf Brunovs and Christophe Urtel. The Remuneration Committee is not chaired by an Independent Director, nor does it have a majority of Independent Directors and accordingly does not comply with Recommendation 8.2 of the Corporate Governance Council. The Remuneration Committee operates under a Remuneration Committee Charter which complies with Recommendation 8.1 of the Corporate Governance Council. The Charter clearly sets out the role and responsibilities of the Remuneration Committee and the charter terms provide the Remuneration Committee with the ability to access internal and external resources as appropriate. *Composition has changed with effect from 1 August 2014 to three Non-executive Directors with Gillian Swaby as Chairperson. ETHICAL STANDARDS The Board actively promotes ethical and responsible decision making aiming to maintain the highest standard of ethical behaviour in business and in all its dealings with customers, clients, shareholders, governments, suppliers, employees and the community. As a minimum the Board and employees will:
∗ act within applicable laws; ∗ act with fairness and respect; ∗ encourage co-operation and rational debate with a view to
achieving shared goals;
∗ act with courtesy; ∗ foster an environment which encourages diversity in all its
forms across the Group.
Deep Ye l l ow L im i t ed 17 2014 Annual R ep or t
For
per
sona
l use
onl
y

Codes of Conduct To assist with these aims the Board has adopted a Code of Conduct that applies to Directors and key Executives of the Group and complies with Recommendation 3.1 of the Corporate Governance Council. This Code sets expectations for conduct in accordance with legal requirements and agreed ethical standards. In addition, the Board has adopted an Ethics and Conduct Policy which applies to all employees, consultants and Directors. The Ethics and Conduct Policy addresses the following:
∗ Responsibility to shareholders and the financial community ∗ Responsibility to third parties ∗ Employment practices
∗ Environment ∗ Community activities ∗ Privacy
∗ Confidential information ∗ Conflicts of interest
In addition to the legal requirements and accepted practices which are addressed in each of the policies adopted by the Company and across the Group, the Board is mindful of its broader stakeholders including the community at large in all the geographical regions in which it operates. Diversity Policy The Board has implemented a Diversity Policy in line with Corporate Governance guidelines. The Group believes that the promotion of diversity on its Boards, in senior management and within the organisation generally is good practice and adds to the strength of the Group. The Diversity Policy affirms existing employment arrangements which seek to attract and retain people by promoting an environment where employees are treated with fairness and respect and have equal access to opportunities as they arise. Diversity within the workforce includes such factors as religion, race, ethnicity, language, gender, disability and age. Gender Diversity The Corporate Governance recommendation 3.2 required the Board to set ‘measureable objectives’ for achieving gender diversity and to report against them on an annual basis. A number of objectives were put in place and the Board is continuing to review its practices with a focus on ensuring the selection process at all levels within the organisation is formal and transparent and that the workplace environment is open, fair and tolerant. Some of the measures to assess the success of the policy are set out below. The following table is a summary of the workforce within DYL and across the Group and provides a high level snap shot of the level of gender diversity as at 30 June 2014. Workforce Summary
Male Female Total Proportion female
DYL Board 5 1 6 16% Senior Management 3
2 5 40%
Balance of Employees 9 5 14 36% 17 8 25 32% Australia 6 3 9 33% Namibia 11 5 16 31% 17 8 25 32%
At 30 June 2014, DYL had a diverse workforce with operations in Australia and Africa, the majority (16 persons) are based in Namibia and are Namibian nationals. Measurable Objectives
Objective Outcome
Publish and promote a Diversity Policy that encompasses the principals and recommendations of the Corporate Governance Council.
The Board has adopted a Diversity Policy and has posted it on the Company’s website.
Review and amend where appropriate other Company policies to align with the Diversity policy.
The Board is in the process of reviewing Board, and Board Committee Charters to ensure they reflect the objectives of the Diversity Policy.
Undertake a gender audit and in addition a general assessment of the current diversity levels within the Company and across the Group.
The Group has undertaken an audit of its human resources to establish the gender mix and cultural backgrounds.
Establish procedures to track the gender mix of the Company and of the Group over time.
The Group has compiled a summary of staff including gender and cultural diversity for the past and will continue to do so.
Structure recruitment and selection processes to recognise value of diversity.
The Group is reviewing its practices.
Have clear and transparent governance process around reward and recognition.
The Group has a remuneration charter which encourages rewards to be transparent. It is however in a process of reviewing its charter in this area.
Develop succession plan for the Board with aim to increase representation of women on the Board, subject to identifying candidates with appropriate skills.
The Group has reviewed its current composition and is developing a succession plan.
FINANCIAL REPORTING Financial Reporting The Board relies on Executives to monitor the internal controls. Financial performance is monitored on a regular basis by the Managing Director who reports to the Board at the scheduled Board Meetings.
Deep Ye l l ow L im i t ed 18 2014 Annual R ep or t
For
per
sona
l use
onl
y

Chief Executive Officer and Financial Controller Confirmations In accordance with Recommendation 7.3 of the Corporate Governance Council, Australian Accounting Standards and the Corporations Act the Board requires that the Managing Director and Financial Controller provide a written statement in respect to the annual financial statements of the Group. In addition, the Board requires assurance from the Managing Director and Financial Controller that the declaration is founded upon a sound system of risk management and internal controls, and that the system operates effectively in all material aspects. SECURITIES DEALINGS There is no requirement for Directors to hold Company securities. In addition the Board and Remuneration Committee have formed the view that it is not appropriate for Non-executive Directors to be issued options or performance rights in respect of the Company’s securities. Securities Trading Policy The Board is committed to ensuring that all Directors and employees comply with their legal obligations as well as conducting their business in a transparent and ethical manner. All Directors and employees (including their immediate family or any entity for which they control investment decisions), must ensure that any trading in securities issued by the Company is undertaken within the framework set out in the Securities Trading Policy. The Securities Trading Policy does not prevent Directors or employees (including their immediate family or any entity for which they control investment decisions) from participating in any share plan or share offers established or made by the Company. However, Directors or employees are prevented from trading in the securities once acquired if the individual is in possession of price sensitive information not generally available to all security holders. Additional restrictions are placed on trading by Directors, Executives and other key management personnel as determined by the Chairman and Company Secretary from time to time (‘Restricted Employees’). In addition to the overriding prohibition against dealing in the Company's securities when a person is in possession of inside information, Restricted Employees and their associated parties are at all times prohibited from dealing in the Company's securities during prescribed ‘closed’ periods. The Company has nominated closed periods to run from the end of the financial quarter up to the day after the release date of the quarterly report. Restricted Employees must also obtain written consent from the Chairman or Managing Director prior to trading in the Company’s securities. The Securities Trading Policy also includes a clause prohibiting Directors and Executives from entering into transactions in associated products which operate to limit the economic risk of security holdings in the Company over unvested entitlements. RISK MANAGEMENT Adoption of Risk Management Policies The Board has implemented a Risk Management Policy including a number of specific policies to oversee and manage potential and actual material business risks, complying with Recommendation 7.1 of the Corporate Governance Council. The Board is responsible for supervising management’s framework of control and accountability systems to enable risk to be assessed and managed. The Board has delegated day-to-day management of risk to the Managing Director. Risk Management and Internal Control System The Managing Director, with the assistance of senior management as required, has responsibility for identifying, assessing, treating and monitoring risks and reporting to the Board on risk management. In order to implement the Risk Management Policy, it was considered important to establish a Risk Management Strategy and an internal control regime in order to:
∗ Assist the Group to achieve its strategic objectives; ∗ Ensure the accuracy and integrity of external reporting; and
∗ Safeguard the assets and interests of the Group and its stakeholders
Risk Management Strategy The Risk Management Strategy is designed to identify and assess possible sources of harm and to take steps to decrease or prevent that harm from occurring. The Risk Management Strategy incorporates procedures and processes which provide evidence of a commitment to the management of risk by avoiding, sharing, transferring, reducing (mitigation) or accepting/retaining the risk. To manage and assess risk, the Group has adopted and ‘tailored to fit’ a Risk Management Plan and a Risk Management Framework as outlined in the Australia/New Zealand Standard AS/NZS 4360:2004. Key risk traits are identified and managed using the flowing tools:
∗ Business Risk Management The Group manages its activities through financial budgets and operational and strategic plans.
∗ Internal Controls The Board has documented internal control processes appropriate for the Group’s size and stage of development. It requires Executives to ensure the proper functioning of internal controls.
∗ Financial Reporting Directors approve an annual financial budget and regularly review performance against budget.
∗ Operational Review Executive Directors regularly visit exploration project areas to review the geological practices including the environmental and safety aspects of the operations.
∗ Environment and Safety The Board has adopted an Occupational Health and Safety Policy, Environmental Policy and Ethics and Conduct Policy, through which all employees and contractors are inducted.
Deep Ye l l ow L im i t ed 19 2014 Annual R ep or t
For
per
sona
l use
onl
y

The Group is committed to ensuring that sound environmental management and safety practices are carried out in its exploration activities. Significant resources have been focussed on establishing and maintaining a culture of best practice through the implementation of an Occupational Health and Safety Plan and an Environmental Management Plan. As a uranium explorer, additional responsibilities require the implementation of a Radiation Management Plan as part of the management of Occupational Health and Safety policies. The Group uses external consultants to review its activities and to assist in maintaining a best practice approach to the issues surrounding Radiation Management. In accordance with Recommendation 7.2 of the Corporate Governance Council, the Risk Management Policy requires that senior management report to the Managing Director as to the effectiveness of the risk management and internal control systems and that regular reports thereon be provided to the Board. Continuous Improvement The Risk Management Plan continues to evolve and will develop with the growth of the Group’s activities in the following risk areas:
∗ Financial ∗ Legal ∗ Human Resources ∗ Environmental/Social ∗ Corporate ∗ Management ∗ Political
Deep Ye l l ow L im i t ed 20 2014 Annual R ep or t
For
per
sona
l use
onl
y

DIRECTORS’ REPORTDIRECTORS’ REPORTThe Directors present their report on Deep Yellow Limited (Company) and the entities it controlled at the end of, and during the year ended 30 June 2014 (the Group).
DIRECTORS
The names and details of the Directors of Deep Yellow Limited in office during the financial year and until the date of this report are as follows. Directors were in office for this entire period unless otherwise stated.
Names, qualifications, experience and special responsibilities
Tim Netscher BSc (Eng) (Chemical), B.Com., MBA, CEng, FIChemE, MAICDChairman
Mr Netscher has considerable broad-based experience working as a senior executive in the international mining industry for more than 40 years in roles spanning marketing, operations management, project management and business development. He has successfully operated in several different countries and has worked with joint venture partners from many different cultures.
Mr Netscher was, until recently, the Managing Director of Gindalbie Metals Limited, an ASX300 company and an emerging magnetite producer in the mid-west of Western Australia, a position he held since 2011. His previous experience includes periods as Regional Senior Vice President of Newmont Mining Corporation, Managing Director of Vale Australia, Senior Vice President and Chief Operating Officer of PT Inco, President and Chief Operating Officer of QNI Pty Ltd (part of BHP Billiton), General Manager, Corporate Development of Billiton's Nickel Division and Executive Director of Impala Platinum Holdings Limited.
Having served as Non-executive Director since 2 January 2013, Mr Netscher stepped up to become Chairman on 1 September 2013.
During the past three years Mr Netscher has also served as a Director of the following listed companies: St Barbara Limited * – appointed 17 February 2014;Western Areas Limited * – appointed 1 August 2014;Gold Road Resources Limited *– appointed 1 September 2014;Aquila Resources Limited – appointed 8 November 2013 **;Bullabulling Gold Limited – appointed 20 August 2012 and resigned 31 May 2013; andIndustrea Limited – appointed 19 February 2009 and resigned 30 November 2012
* Denotes current directorship** The Company delisted subsequent to the end of the financial year due to its acquisition by Aurizon Holdings Limited and Baosteel Co. Ltd
Mervyn Greene MA (Maths) BAI (Engineering) MBANon-executive Director
Mr Greene is an investment banker and serial entrepreneur based in Ireland who has worked in the US, Europe and Africa for more than 30 years. Between 1997 and 2005 Mr Greene was the London based partner of Irwin Jacobs Greene (IJG), one of Namibia's premier stockbroking, private equity and corporate finance advisory firms. In the early stages of his career, before doing an MBA at the London Business School in 1993, Mr Greene worked for Morgan Stanley in New York and London. His focus more recently has been at the helm of a number of property and other businesses by way of Private Equity Investment.
Mr Greene stepped down as Chairman of DYL on 1 September 2013 having served in that role since 2007 and remained a Non-executive Director. He serves on the Audit Committee of the Group.
Greg Cochran MSc Eng (Mining and Mineral Economics), MBA, FAusIMM, MAICD, MSAIMMManaging Director
Mr Cochran has almost 30 years’ experience in international mining in various commodities including gold, coal, base metals and uranium. He has held senior executive roles in projects, operations, finance and business development. Most recently he was CEO of Terramin Australia Limited and prior to that he was Executive Vice President: Australia & Asia for Uranium One. Mr Cochran also worked for Mitsubishi Development whilst the earlier part of his career was spent with BHP Billiton and its predecessor companies in the Billiton group.
Gillian Swaby BBus FCIS FAICDNon-executive Director
Ms Swaby has been involved in financial and corporate administration, as both Director and Company Secretary covering a broad range of industry sectors, for more than 30 years. Ms Swaby has extensive experience in the area of secretarial practice, corporate governance, management accounting and corporate and financial management. Ms Swaby is the principal of a corporate consulting company and past Chair of the Western Australian Council of Chartered Secretaries of Australia and a former Director on their National Board. She is currently the Company Secretary of Paladin Energy Limited and was a Director of that company for almost 10 years. She is also a director of the Australia-Africa Mining Industry Group (AAMIG).
Ms Swaby serves on the Audit Committee and is the Chair of the Remuneration Committee of the Group.
During the past three years Ms Swaby has also served as a Director of the following listed company: Comet Ridge Limited - appointed 9 January 2004. *
* Denotes current directorship
Rudolf Brunovs FCA FAICD MBANon-executive Director
Mr Brunovs is a former Partner of Ernst & Young, an international accounting firm. He practiced in a number of offices in Australia and overseas and for a period of 12 years he held the position of Managing Partner of the Parramatta NSW and subsequently the Perth office of the firm. He was a member of the Minerals and Energy Industry Group with Ernst & Young. He had no involvement with the audit of Deep Yellow Limited whilst a partner of the firm.
Mr Brunovs serves on the Remuneration Committee and is the Chair of the Audit Committee of the Group.
Deep Ye l l ow L im i t ed 21 2014 Annual R ep or t
For
per
sona
l use
onl
y

Christophe Urtel MSc BSc Non-executive Director Mr Urtel has more than 14 years’ industry experience and prior to joining Liberum Capital in 2011 he was an Executive Director in J.P.Morgan’s Principal Investment franchise in London responsible for natural resources investments. Previously he worked in J.P.Morgan and its predecessor organisations from 1999 to 2008, specialising in the mining and metals sector, providing M&A advice and raising capital on the equity and debt markets. Mr Urtel graduated with a MSc (Mining and Finance) and BSc (First Class Honours – Geology with Engineering Geology) from the Royal School of Mines, Imperial College, London. Mr Urtel serves on the Remuneration Committee of the Group. Directors’ Interests As at the date of this report, the Directors’ interests in securities of the Company are as follows:
Director Ordinary Shares Performance Rights
Tim Netscher - - Mervyn Greene 51,491,667 - Greg Cochran 1,968,750 11,700,000 Gillian Swaby 50,000,000 - Rudolf Brunovs 155,000 - Christophe Urtel - -
Company Secretary Mark Pitts BBus FCA Mr Pitts is a Chartered Accountant with more than 25 years' experience in statutory reporting and business administration. He has been directly involved with, and consulted to a number of public companies holding senior financial management positions. He is a Partner in the corporate advisory firm Endeavour Corporate providing company secretarial support; corporate and compliance advice to a number of ASX listed public companies. Dividends No dividend has been paid since the end of the previous financial year and no dividend is recommended for the current year. Principal Activities The principal activities of the Group during the financial year were:
∗ Uranium mineral exploration and pre-development activities in Namibia; and ∗ Activities associated with the divestment of its iron ore project in Namibia
Other than the decision to only focus on exploration and pre-development activities in Namibia and discontinue exploration activities in Australia, there were no significant changes in these activities during the financial year. Review of Operations A detailed review of the Group’s operations in each of the key regions is set out in the ‘Review of Operations’ on pages 4 to 14 in this Annual Report. Significant Changes in the State of Affairs Significant changes in the state of affairs of the Group during the financial year were as follows:
∗ On 1 July 2013 the Company announced that Mr Tim Netscher would step up as Chairman of the Board on 1 September 2013, succeeding Mr Greene.
∗ On 30 July 2013 the Company announced that the Ministry of Mines and Energy of the Republic of Namibia has renewed Exclusive Prospecting Licences (EPLs) 3496, 3497 and 3499 for a further two years.
∗ The Company has successfully raised $965,900 through a Share Purchase Plan that closed on Friday, 18 October 2013 with subscriptions for 48,295,000 ordinary shares at 2 cents per share.
∗ On 1 November 2013 the Company announced that the Ministry of Mines and Energy of the Republic of Namibia has renewed the Nova Joint Venture Exclusive Prospecting Licences (EPLs) 3668, 3669 and 3670 for a further two years.
Performance Indicators Management and the Board monitor the Group’s overall performance against strategic operating plans and financial forecasts. The Board, together with management, have identified key operational milestones that are used to monitor performance. Key management monitor the achievement of operational milestones on a regular basis and report back to the Board on a monthly basis during board meetings.
Deep Ye l l ow L im i t ed 22 2014 Annual R ep or t
For
per
sona
l use
onl
y
Dynamics of the Business Ongoing volatility in the world’s financial markets, uncertainty in the uranium sector and the continued decline in the uranium price during the past financial year meant that the recovery predicted, forecast to commence in 2014, did not materialise. However, management remains confident that there is still a looming uranium supply deficit, with the only question being when it will manifest in the form of more robust uranium prices. In this difficult environment the Group is nurturing its cash resources by minimising overheads and has continued to take significant steps to this effect. The Group also continues to protect its core assets in Namibia and keep them in good standing to position itself to take advantage of the inevitable price rebound. Negotiations on the divestment of the Shiyela Iron Ore Project continued throughout the financial year but were delayed by the preferred bidder. At the end of the financial year there was uncertainty that a transaction would be concluded in the short term. Operating Results for the Year The Group’s net loss after income tax for the financial year is $19,441,680 (2013: loss $8,667,777). The net loss also includes the following significant items before income tax:
∗ Exploration expenditure written off of $17,263,495 (2013: $6,448,277) relates to the full impairment of Australian and partial impairment of some Namibian assets’ exploration expenditure. The Group has in the last two years restricted its exploration expenditure in Australia. It has not budgeted or planned Australian exploration expenditure for the future given its intention to divest all its Australian assets.
Financial Position At the end of the financial year the Group had $1,235,654 (2013: $3,990,597) in cash and at call deposits. Capitalised mineral exploration and evaluation expenditure carried forward was $69,830,701 (2013: $87,934,508). The Group has net assets of $71,775,435 (2013: $93,082,043). Significant Events after Balance Date The Company has successfully raised a total of $4,563,612 during July and August 2014. $1,513,230 was raised through a Non-renounceable Rights Issue that closed on Friday, 18 July 2014 with subscriptions for 89,013,543 ordinary shares at 1.7 cents per share. A further placement consisting of two tranches raised a further $3,050,382 with subscriptions for 179,411,762 shares at 1.7 cents per share. The placement consisted of two tranches, the first being in satisfaction of the Non-renounceable Rights Issue shortfall of 113,118,169 shares equating to $1,923,009 and the second being an excluded placement made under the Company’s 15% placement capacity for approximately 66,316,059 shares equating to $1,127,373. Both tranches settled and resulting shares were issued on 27 August 2014. The Directors are not aware of any other matter or circumstance not otherwise dealt with in this report that has arisen since the end of the year that has significantly affected, or may significantly affect the operations of the Group, the results of those operations or the state of affairs of the Group in future financial years. Likely Developments and Expected Results of Operations Likely developments in the operations of the Group are set out in the ‘Review of Operations’ on pages 4 to 14 in this Annual Report. Environmental Regulation and Performance The Group holds various exploration licences that regulate its exploration activities in Australia and Namibia. These licences include conditions and regulations with respect to the rehabilitation of areas disturbed during the course of the Group’s exploration activities. There have been no significant known breaches of the Group’s licence conditions and at the date of this report no agency has notified the Group of any environmental breaches during the financial year or is the Directors aware of any environmental breaches. Directors’ Meetings The number of meetings of Directors (including meetings of committees of directors) held during the year ended 30 June 2014, whilst each Director was in office, and the number of meetings attended by each Director was:
Director’s meetings Meetings of Committees Audit Remuneration
Number of meetings held: 12 2 1 Number of meetings attended:
Rudolf Brunovs 11 2 1 Greg Cochran 12 - - Mervyn Greene 10 1 1 Tim Netscher 12 - - Gillian Swaby 12 2 1 Christophe Urtel 12 - 1
All Directors were eligible to attend all meetings.
Deep Ye l l ow L im i t ed 23 2014 Annual R ep or t
For
per
sona
l use
onl
y

Shares under Option As at the date of this report, there were no unissued ordinary shares under options and no shares have been issued during the financial year as a result of the exercise of options. As at the date of this report, there were 22,072,120 Performance Rights outstanding (24,983,100 at the reporting date). Performance Right holders do not have any right, by virtue of the Performance Right, to participate in any share issue of the Company or any related body corporate. The outstanding balance of Performance Rights at the date of this report is:
Number of Rights Vesting Performance Conditions Date rights granted Vesting Date
1,152,060 Time based 3-Oct-12 1-Jul-15 1,152,060 Market price 3-Oct-12 1-Jul-15
250,000 Time based 6-Dec-12 1-Dec-14 1,200,000 Market price 6-Dec-12 1-Dec-14
500,000 Performance Indicators 6-Dec-12 1-Dec-14 500,000 Time based 6-Dec-12 1-Dec-15
1,750,000 Market price 6-Dec-12 1-Dec-15 500,000 Performance Indicators 6-Dec-12 1-Dec-15 500,000 Time based 8-Jul-13 1-Feb-15 750,000 Time based 8-Jul-13 1-Feb-16 375,000 Market price 8-Jul-13 1-Feb-16 375,000 Market price 8-Jul-13 1-Feb-16
1,517,000 Time based 29-Oct-13 1-Jul-15 2,275,500 Time based 29-Oct-13 1-Jul-16 2,275,500 Market price 29-Oct-13 1-Jul-16
500,000 Time based 29-Oct-13 1-Dec-14 1,000,000 Market price 29-Oct-13 1-Dec-14
750,000 Time based 29-Oct-13 1-Dec-15 1,750,000 Market price 29-Oct-13 1-Dec-15 1,000,000 Time based 29-Oct-13 1-Dec-16 2,000,000 Market price 29-Oct-13 1-Dec-16
22,072,120 Officers’ Indemnities and Insurance During the financial year the Company paid an insurance premium to insure certain officers of the Company. The officers of the Company covered by the insurance policy include the Directors and the Company Secretary named in this report. The Directors and Officers Liability insurance provides cover against all costs and expenses that may be incurred in defending civil proceedings that fall within the scope of the indemnity and that may be brought against the officers in their capacity as officers of the Company. The insurance policy does not contain details of the premium paid in respect of individual officers of the Company. Disclosure of the nature of the liability cover and the amount of the premium is subject to a confidentiality clause under the insurance policy. The Company has not entered into any agreement to indemnify any auditor of the Group. Indemnification of Auditors To the extent permitted by law, the Company has agreed to indemnify its auditor, Ernst & Young, as part of the terms of its audit engagement agreement against claims by third parties arising from the audit (for an unspecified amount). No payment has been made to indemnify Ernst & Young during or since the financial year Proceedings on Behalf of the Company No person has applied to the Court under Section 237 of the Corporations Act 2001 for leave to bring proceedings on behalf of the Company, or to intervene in any proceedings to which the Company is a party, for the purpose of taking responsibility on behalf of the Company for all or part of those proceedings. No proceedings have been brought or intervened in on behalf of the Company with leave of the Court under Section 237 of the Corporations Act 2001. Corporate Governance The Directors recognise the need for the highest standards of corporate behaviour and accountability, and the Group’s corporate governance statement is contained in the annual report.
Deep Ye l l ow L im i t ed 24 2014 Annual R ep or t
For
per
sona
l use
onl
y

Non-audit Services and Auditor’s Independence Declaration During the 2014 financial year Ernst & Young, the Group’s auditor, has provided non-audit services in addition to their statutory duties. The directors are satisfied that the provision of non-audit services is compatible with the general standard of independence for auditors imposed by the Corporations Act 2001. The nature and scope of each type of non-audit service provided means that auditor independence was not compromised. Ernst & Young received or are due to receive the following amounts for the provision of non-audit services: Consolidated 2014 2013 $ $
Taxation and other services 11,000 10,000 11,000 10,000 A copy of the Auditor’s Independence Declaration as required under Section 307C of the Corporations Act is set out on page 37.
Deep Ye l l ow L im i t ed 25 2014 Annual R ep or t
For
per
sona
l use
onl
y

Remuneration Report (Audited) This Remuneration Report for the year ended 30 June 2014 outlines the Director and Executive remuneration arrangements of the Group in accordance with the requirements of the Corporations Act 2001 (the Act) and its regulations. This information has been audited as required by section 308(3C) of the Act. The remuneration report is presented under the following sections:
1. Introduction 2. Remuneration governance 3. Executive remuneration arrangements
(a) Remuneration principles and strategy (b) Approach to setting remuneration (c) Detail of incentive plans
4. Group performance and Executive remuneration outcomes for 2014 5. Executive contracts 6. Non-executive Director remuneration (including statutory remuneration disclosures) 7. Additional statutory disclosures
1. Introduction The remuneration report details the remuneration arrangements for key management personnel (KMP). For the purposes of this report, KMP of the Group are defined as those persons having authority and responsibility for planning, directing and controlling the major activities of the Group, directly or indirectly, including any director (whether executive or otherwise) of the Parent. For the purpose of this report, the term ‘Executive’ includes executive directors, senior executives, country managers and company secretaries of the Parent and the Group. (a) Executive Directors
Greg Cochran Managing Director
(b) Other Executives
Peter Christians Country Manager: Namibia Mark Pitts Company Secretary
(c) Non-executive Directors (NEDs)
Tim Netscher Chairman Rudolf Brunovs Non-executive Director Mervyn Greene Non-executive Director Gillian Swaby Non-executive Director Christophe Urtel Non-executive Director
There were no other persons having the authority and responsibility for planning, directing and controlling the major activities of the Group, directly or indirectly, during the financial year. There were no changes to KMP after the reporting date and before the date the financial report was authorised for issue. 2. Remuneration Governance Remuneration Committee The Board has appointed a Remuneration Committee to assist it in its determination of levels and components of remuneration packages. The Remuneration Committee consists only of NEDs. The Remuneration Committee is responsible for reviewing the overall remuneration philosophy, strategy, plans, policies and practices (including performance management methodology) to implement the remuneration objective. It reviews and makes recommendations as to the composition of the remuneration packages for the Executives (Directors and Other), ensuring that there is a clear link between performance and remuneration. This is achieved by a combination of fixed remuneration and short and long term incentives to reflect short and long term performance of the Executives and the Group. The Board approves the remuneration packages of the Executives following consideration of the recommendations by the Remuneration Committee. The Board also sets the aggregate remuneration for NEDs and individual NED fee levels based on recommendations made by the Remuneration Committee. Aggregate NED remuneration is subject to shareholder approval. In making recommendations to the Board, the Remuneration Committee assesses the appropriateness of the nature and amount of remuneration on a periodic basis by reference to the status of the Group and the stage of development of its assets, the skill sets required, trends in comparative ASX listed companies and the need for a balance between fixed remuneration and short and long term cash and non-cash incentives. The process includes a review of Group and individual performances, broad market remuneration data and relevant comparative remuneration externally and internally. The Remuneration Committee meets regularly through the year. The Managing Director attends certain Remuneration Committee meetings by invitation, where management input is required. The Managing Director is not present during any discussions related to his own remuneration arrangements. Use of Remuneration Consultants To ensure the Remuneration Committee is fully informed when making remuneration decisions, it from time to time obtains external advice from an independent consultant who provides no other services to the Group. During the financial year, the remuneration committee has not sought formal external advice due to its continued focus on cost reductions in ongoing volatile markets. The Managing Director, Non-executive Directors and Executives implemented a 5% reduction in base salaries and fees with effect from 1 July 2013. A further 10% cash reduction in Managing Director base salary and Non-executive Directors’ fees were deferred with effect from 1 March 2014 with shares to be issued in lieu, subject to shareholder approval. An overall review of Managing Director and Non-executive Directors’ fees were done after the reporting date resulting in a further 29% cash reduction with effect from 1 August 2014.
Deep Ye l l ow L im i t ed 26 2014 Annual R ep or t
For
per
sona
l use
onl
y

Remuneration Report Approval at 2013 Financial Year AGM The 2013 Financial Year Remuneration Report received positive shareholder support at the 2013 Financial Year AGM with a vote of 79% in favour. 3. Executive Remuneration Arrangements
a) Remuneration principles and strategy The Group’s remuneration objective is to adopt policies, processes and practices to adopt reward programs which are fair and responsible in accordance with principles of good corporate governance. The key objectives of the Group’s award framework are to ensure that remuneration practices:
∗ Aim to align Executive entitlements with shareholder objectives; ∗ Attract, motivate and retain Executives who will add value to the Group; ∗ Result in competitive remuneration, benchmarked against peer groups; and ∗ Reward Executives for performance with a strong linkage to Group performance.
Align the interests of Executives with shareholders
∗ The award framework incorporates substantial “at-risk” components within the short and long term incentives; and ∗ For Short term incentives, performance is assessed against non-financial measures linked to the strategic and operational plans and
for Long term incentives, performance is primarily linked to the market value of Company shares. Attract, motivate and retain high performing individuals
∗ The remuneration offered is competitive for companies of a similar size and complexity; and ∗ Long term incentives encourage retention.
b) Approach to setting remuneration The Group aims to reward Executives with a level and mix of remuneration commensurate with their position and responsibilities within the Group. The Group’s remuneration structure for Executives can include a mix of:
∗ Fixed remuneration ∗ Short term incentive ∗ Long term incentive
The fixed remuneration component is represented by total employment cost and comprises base salary, statutory superannuation contributions (where applicable) and other benefits. It is paid by the Group to compensate fully for all requirements of the Executives employment and is subject to annual review. Executive contracts of employment do not include any guaranteed base pay increases. Company and individual performance are considered during the annual remuneration review. The Group benchmarks the fixed component against appropriate market comparisons with the comparator group criteria being market capitalisation and sub-sector grouping. The Group also pays particular attention to protecting the Company’s cash resources. This has led to continuous reductions in Executive salaries for the 2013 and 2014 financial years despite the Executive’s skills, job requirements and experience specific to the Group’s needs. The short term incentive (STI) component is in the form of a cash bonus to the Managing Director of up to 20% of base salary. Payment of the cash bonus is entirely discretionary and rewards the executive for their contribution to achievement of business goals. The business goals are determined annually by the Board and are linked to the strategic and operational plans of the Group, including budgets agreed for each financial year. The long term incentive (LTI) component is in the form of Performance Rights. It rewards the Executives for their contribution to the creation of shareholder value over the longer term. Vesting of Performance Rights is dependent on certain time and market price conditions and/or business goals being met. c) Detail of incentive plans Short Term Incentive (STI) Actual STI payments awarded to the Managing Director depend on the achievement of a number of business goals covering financial and non-financial, corporate and individual measures. A summary of these measures and weightings in relation to the 2014 financial year are set out below.
Performance measures Proportion of STI award measure applies to
Financial measures: 30% ∗ Maximising value of strategic disposals ∗ Appropriate funding arrangements
Non-financial measures: 70% ∗ Strategic tenement retention and exploration
∗ Resource and development progressing ∗ Market and competitive positioning ∗ Risk management ∗ Leadership / Staff retention ∗ Stakeholder communication
These measures were chosen as they represent the key drivers for the short term success of the business and provide a framework for delivering long-term value. On an annual basis, after consideration of performance against the various business goals the Remuneration Committee recommends the amount, if any, to be paid. This process usually occurs within three months of the financial year. Cash bonus payments are made in the following reporting period. For the 2013 financial year, a maximum STI cash bonus of $83,700 (excluding statutory superannuation) was available to the Managing Director and nil was paid.
Deep Ye l l ow L im i t ed 27 2014 Annual R ep or t
For
per
sona
l use
onl
y

The maximum STI cash bonus available to the Managing Director for the 2014 financial year was $76,689 (excluding statutory superannuation) and the minimum nil. Due to current market conditions and in an effort to protect the Company’s cash resources the managing Director has for a third consecutive year agreed to forego any entitlements to a STI cash bonus for the 2014 financial year. Long Term Incentive (LTI) LTI awards are made to Executives in order to align remuneration with shareholder wealth over the long-term and delivered in the form of performance rights under The Deep Yellow Limited Awards Plan (“Awards Plan”). Each right upon vesting entitles the holder to one fully paid ordinary share in the Company. The rights vest over a period of up to 37 months so as to retain Executives and are subject to meeting various vesting and performance conditions:
∗ Time based – must remain in employ for a specified period of up to 3 years from date of grant; ∗ Market price performance measuring the increase in share price over the vesting period; and/or ∗ Executive performance measuring if pre-defined business goals were met.
These conditions were chosen as it reflects an appropriate balance between individual reward, market and individual based performance whilst. Financial based performance conditions such as Earnings per share and/or Return on assets are not chosen as a performance measure for the LTI plan as these are difficult to measure in the present operating environment. Rights were deliberately chosen because they provide an appropriate level of incentive in a competitive environment and are cost effective in that there is no cash outlay for the Group which is appropriate given the Group’s exploration status. The agreement entered into with the Managing Director includes an obligation to provide performance based components. Agreements entered into with other Executives do not include an obligation to provide performance based components but do provide for consideration of them in accordance with the Group policies and practices. Where a participant ceases employment prior to the vesting of their award, the rights are forfeited unless the Board exercises its discretion to allow vesting at or post cessation of employment. In the event of a change of control of the Group, the Board may determine, in its absolute discretion, that some or all of the unvested rights will become vested rights (disregarding any Performance Hurdle). Rights were granted under the Awards Plan to a number of Executives during October 2013. Details in respect of the awards are provided in Table 3(a). As part of the Group’s Securities Trading Policy, Directors and Employees are prohibited from engaging in hedging arrangements over unvested Securities to protect the value of their unvested LTI awards. This includes the use of put and call options or other derivative instruments to hedge their exposure to options or performance rights granted as part of their remuneration package. 4. Group Performance and Executive Remuneration Outcomes for 2014 Group Performance The table below shows the performance of the Group as measured by its earnings per share and its share price over the past five years. The movement in share price shown in the table is a reflection of the volatility in the price of U3O8 and world capital markets whereby historical U3O8 prices have decreased significantly from 2010 as indicated below.
30 June 2014
Cents 30 June 2013
Cents 30 June 2012
Cents 30 June 2011
Cents 30 June 2010
Cents
Share price 1.9 3.3 4.6 15.00 13.00 U3O8 spot price (US$/lb) 28.2 39.65 50.83 53.13 41.75 Earnings/(Loss) per share (0.46) (0.6) (4.31) (0.32) (0.40)
LTI vesting outcomes The table below outlines both vesting and expected outcomes for outstanding awards at 30 June 2014. Projected outcomes for awards still to be tested are based on assuming the current share price remains unchanged at the relevant testing date.
FY 2012 grant FY 2013 grant FY 2014 grant Market price test 27-54 cents 8-25 cents 8-15 cents
Implication for vesting 18% of awards vested during the
2013 financial year as time based vesting conditions were met
5% of awards vested during the 2014 financial year as time based vesting conditions were met
5% of awards vested during the 2014 financial year as time based vesting conditions were met
2% of awards vested during the 2014 financial year as time based vesting conditions were met
10% of awards was cancelled unexercised as market price test was not met
39% of awards will vest during the 2015, 2016 and 2016 financial years if time based vesting conditions are met
76% of awards was cancelled unexercised as market price test was not met
15% of awards will vest during the 2015 and 2016 financial year if time based vesting conditions are met
56% of awards will be cancelled unexercised during the 2015, 2016 and 2017 financial years if the market price test is not met
2% of awards will vest during the 2015 financial year if time based vesting conditions are met
53% of awards will be cancelled unexercised during the 2015 and 2016 financial years if the market price test is not met
2% of awards will be cancelled unexercised during the 2015 financial year if the market price test is not met
17% of awards will vest during the 2015 and 2016 financial years if Executive performance remains unchanged
Deep Ye l l ow L im i t ed 28 2014 Annual R ep or t
For
per
sona
l use
onl
y

Details of Remuneration for Directors and Executive Officers Details of the remuneration of each Executive of the Group for the years ended 30 June 2014 and 30 June 2013 are detailed in Table 1 below: Table 1: Executive remuneration for the years ended 30 June 2014 and 30 June 2013 Short Term Post
Employment Sub-total Share Based Payments Long Term Benefits
Total Performance
Related %
Financial year
Base Emolument
Other Benefits
Superannuation Contributions Performance
Rights (i)
Share Rights
(ii)
Long Service Leave
Termination payments
Executive Directors G Cochran 2014 383,443 - 35,468 418,911 92,624 11,113 5,732 - 528,380 4.13 2013 466,781 - 37,665 504,446 315,604 6,975 - 827,025 6.29
M Kavanagh (iii) 2014 - - - - - - - - - 2013 309,548 - 24,978 334,526 (53,810) - 82,628 363,344 - Other KMP
L Pretorius (iv) 2014 - - - - - - - - - 2013 - 224,208 - 224,208 - - - 224,208 - P Christians 2014 265,500 - - 265,500 53,968 - - 319,468 -
2013 131,932 - - 131,932 - - - 131,932 - M Pitts 2014 - 82,600 - 82,600 13,834 - - 96,434 -
2013 - 84,000 - 84,000 18,268 - - 102,268 - Total Executive KMP
2014 648,943 82,600 35,468 767,011 171,539 5,732 - 944,282 2013 908,261 308,208 62,643 1,279,112 280,062 6,975 82,628 1,648,777
(i) Value of performance rights expensed during the year is detailed in Table 3(a) (ii) Value of share rights expenses during the year in lieu of fees and subject to shareholder approval is detailed in Table 3(b) (iii) Resigned 27 May 2013 (iv) Consultancy agreement concluded 31 December 2012 5. Executive Contracts Remuneration arrangements for Key Management Personnel are formalised in service agreements. Details of these contracts are provided below: Mr G Cochran The terms of the employment contract are as follows:
∗ No fixed term ∗ Fixed remuneration for 2014 of $390,012 per annum (including statutory superannuation) ∗ Issue of shares to the value of $43,336 per annum in lieu of fixed remuneration, subject to shareholder approval ∗ Annual STI cash bonus of up to 20% of fixed base remuneration which was $357,000 in 2014 (Due to market conditions the
entitlement to a STI cash bonus was voluntarily waived in 2012, 2013 and 2014.) ∗ LTI of 7,000,000 performance rights (details provided in Table 3(a)).
The contract can at any time be terminated by either party providing the other party with 6 months’ notice. Termination of the contract by either party will result in a payment equivalent to the notice period remuneration. Mr P Christians The employment agreement with Mr P Christians has no fixed term. Remuneration under the contract is $256,500 per annum (including statutory superannuation). The contract can at any time be terminated by either party providing the other party with 3 months’ notice. Termination of the contract by either party will result in a payment equivalent to the notice period remuneration. 6. Non-executive Director Remuneration Remuneration Structure In accordance with best practice corporate governance, the structural component of Non-executive Director remuneration is separate and distinct from Executive remuneration. The remuneration of Non-executive Directors of the Group consists of directors’ fees only. Remuneration Policy The Board seeks to set aggregate remuneration at a level that provides the Company with the ability to attract and retain Directors of the highest calibre, whilst incurring a cost that is acceptable to shareholders. The amount of aggregate remuneration sought to be approved by shareholders and the fee structure is reviewed on a periodic basis against fees paid to NEDs of comparable companies. The Constitution and the ASX Listing Rules specify that the remuneration of Non-executive Directors shall be determined from time to time by a general meeting. The latest determination was at the Annual General Meeting held on 19 November 2009 when shareholders approved a maximum amount which could be paid as Non-executive Director fees of $450,000 per annum to be apportioned between the Non-executive Directors as determined by the Board. The Board will not seek any increase for the Non-executive Director pool at the 2014 AGM. Structure The remuneration of NEDs consists of directors’ fees and committee fees. The payment of additional fees for serving on a committee recognises the additional time commitment required by NEDs who serve on sub-committees. The Chairman of the board attends all committee meetings but does not receive any additional fees in addition to his board fee. In an effort to preserve cash, the cash component of NEDs fees has been reduced and shares are to be issued subject to shareholder approval.
Deep Ye l l ow L im i t ed 29 2014 Annual R ep or t
For
per
sona
l use
onl
y
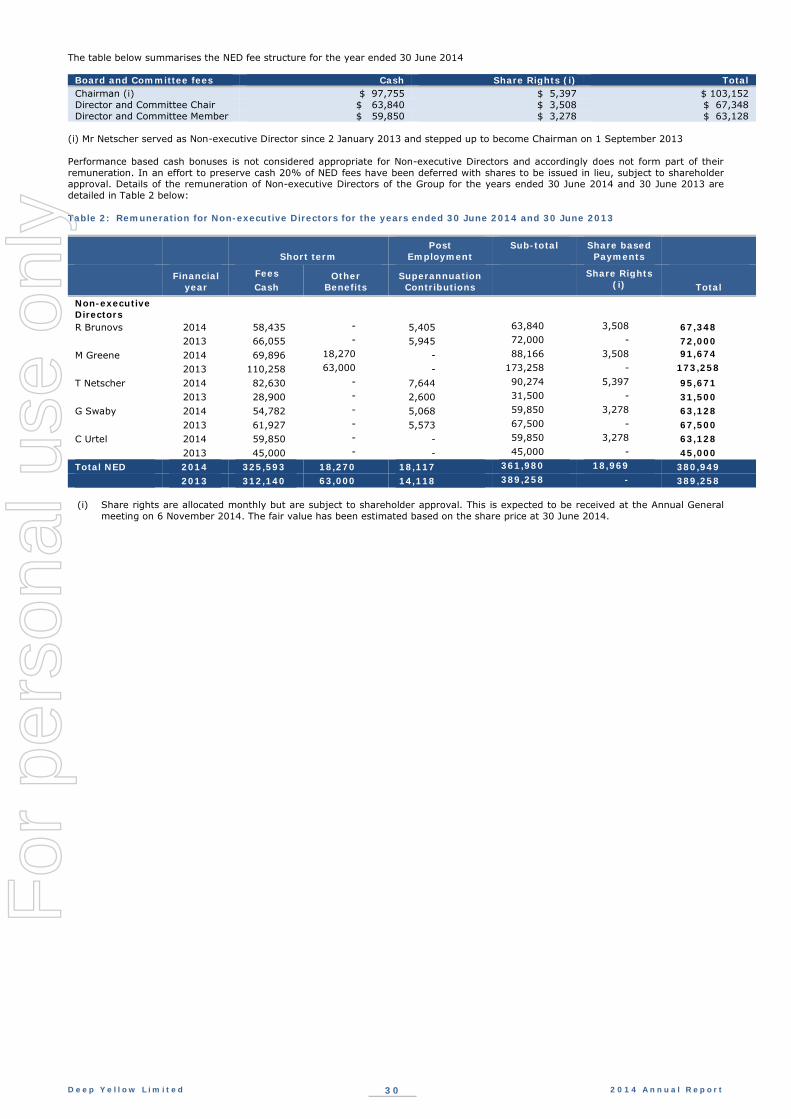
The table below summarises the NED fee structure for the year ended 30 June 2014
Board and Committee fees Cash Share Rights (i) Total Chairman (i) $ 97,755 $ 5,397 $ 103,152 Director and Committee Chair $ 63,840 $ 3,508 $ 67,348 Director and Committee Member $ 59,850 $ 3,278 $ 63,128
(i) Mr Netscher served as Non-executive Director since 2 January 2013 and stepped up to become Chairman on 1 September 2013 Performance based cash bonuses is not considered appropriate for Non-executive Directors and accordingly does not form part of their remuneration. In an effort to preserve cash 20% of NED fees have been deferred with shares to be issued in lieu, subject to shareholder approval. Details of the remuneration of Non-executive Directors of the Group for the years ended 30 June 2014 and 30 June 2013 are detailed in Table 2 below: Table 2: Remuneration for Non-executive Directors for the years ended 30 June 2014 and 30 June 2013
Short term Post
Employment Sub-total Share based
Payments
Financial
year Fees Cash
Other Benefits
Superannuation Contributions
Share Rights (i) Total
Non-executive Directors
R Brunovs 2014 58,435 - 5,405 63,840 3,508 67,348 2013 66,055 - 5,945 72,000 - 72,000 M Greene 2014 69,896 18,270 - 88,166 3,508 91,674 2013 110,258 63,000 - 173,258 - 173,258 T Netscher 2014 82,630 - 7,644 90,274 5,397 95,671 2013 28,900 - 2,600 31,500 - 31,500 G Swaby 2014 54,782 - 5,068 59,850 3,278 63,128 2013 61,927 - 5,573 67,500 - 67,500 C Urtel 2014 59,850 - - 59,850 3,278 63,128 2013 45,000 - - 45,000 - 45,000 Total NED 2014 325,593 18,270 18,117 361,980 18,969 380,949 2013 312,140 63,000 14,118 389,258 - 389,258
(i) Share rights are allocated monthly but are subject to shareholder approval. This is expected to be received at the Annual General
meeting on 6 November 2014. The fair value has been estimated based on the share price at 30 June 2014.
Deep Ye l l ow L im i t ed 30 2014 Annual R ep or t
For
per
sona
l use
onl
y

7. Additional Statutory Disclosures
This section sets out the additional disclosures required under the Corporations Act 2001. The tables below disclose the rights granted to Executives during the 2014 and 2013 financial years. They do not carry any voting or dividend rights and will automatically be exercised once the vesting conditions have been met. Table 3(a): Performance rights: Value of rights expensed during the year ended 30 June 2014
Terms and Conditions for each Grant during the year Value of rights expensed during the year
30 June 2014
Grant date
Number of rights
Fair Value per
right at grant date
(cents)
Total value of rights
granted ($)
Vesting date
Vesting and performance conditions
Value of expensed
rights during the
year
% of Total Remuneration consisting of performance
rights
Executive director G Cochran 6-Dec-12 250,000 5.2 13,000 1-Dec-13 Time based 5,525
17.53
G Cochran 6-Dec-12 250,000 1.9 4,750 1-Dec-13 Market price 2,019 G Cochran 6-Dec-12 300,000 1.1 3,300 1-Dec-13 Market price 1,403 G Cochran 6-Dec-12 250,000 5.2 13,000 1-Dec-14 Time based 6,545 G Cochran 6-Dec-12 400,000 2.1 8,400 1-Dec-14 Market price 4,229 G Cochran 6-Dec-12 800,000 1.7 13,600 1-Dec-14 Market price 6,847 G Cochran 6-Dec-12 500,000 5.2 26,000 1-Dec-14 Performance 13,090 G Cochran 6-Dec-12 500,000 5.2 26,000 1-Dec-15 Time based 8,706 G Cochran 6-Dec-12 500,000 2.3 11,500 1-Dec-15 Market price 3,851 G Cochran 6-Dec-12 1,250,000 2.0 25,000 1-Dec-15 Market price 8,372 G Cochran 6-Dec-12 500,000 5.2 26,000 1-Dec-15 Performance 8,706 G Cochran 29-Oct-13 500,000 2.0 10,000 1-Dec-14 Time based 6,156 G Cochran 29-Oct-13 500,000 0.5 2,500 1-Dec-14 Market price 1,539 G Cochran 29-Oct-13 500,000 0.3 1,500 1-Dec-14 Market price 923 G Cochran 29-Oct-13 750,000 2.0 15,000 1-Dec-15 Time based 4,817 G Cochran 29-Oct-13 750,000 0.6 4,500 1-Dec-15 Market price 1,445 G Cochran 29-Oct-13 1,000,000 0.4 4,000 1-Dec-15 Market price 1,284 G Cochran 29-Oct-13 1,000,000 2.0 20,000 1-Dec-16 Time based 4,344 G Cochran 29-Oct-13 1,000,000 0.7 7,000 1-Dec-16 Market price 1,520 G Cochran 29-Oct-13 1,000,000 0.6 6,000 1-Dec-16 Market price 1,303 92,624 Other KMP P Christians 8-Jul-13 500,000 4.3 21,500 1-Feb-14 Time based 21,500
16.89 P Christians 8-Jul-13 500,000 4.3 21,500 1-Feb-15 Time based 13,433 P Christians 8-Jul-13 750,000 4.3 32,250 1-Feb-16 Time based 12,309 P Christians 8-Jul-13 375,000 2.6 9,750 1-Feb-16 Market price 3,721 P Christians 8-Jul-13 375,000 2.1 7,875 1-Feb-16 Market price 3,005 53,968 M Pitts (iv) 27-Aug-12 44,640 1.31 585 1-Aug-13 Market price - M Pitts 9-Dec-11 24,000 15.5 3,720 1-Jul-14 Time based 1,452
14.35
M Pitts 9-Dec-11 24,000 9.6 2,304 1-Jul-14 Market price 899 M Pitts 3-Oct-12 52,420 4.4 2,306 1-Jul-13 Time based 2,306 M Pitts 3-Oct-12 52,420 4.4 2,306 1-Jul-14 Time based 1,324 M Pitts 3-Oct-12 78,630 4.4 3,460 1-Jul-15 Time based 1,262 M Pitts 3-Oct-12 78,630 2.8 2,202 1-Jul-15 Market price 803 M Pitts 29-Oct-13 150,000 2.0 3,000 1-Jul-14 Time based 3,000 M Pitts 29-Oct-13 150,000 2.0 3,000 1-Jul-15 Time based 1,205 M Pitts 29-Oct-13 225,000 2.0 4,500 1-Jul-16 Time based 1,131 M Pitts 29-Oct-13 225,000 0.8 1,800 1-Jul-16 Market price 452 13,834
(i) Performance Hurdles attaching to the Performance Rights with a 1 August 2012 vesting date were varied for the market price to be
retested on 1 August 2013. The value was fully expensed during the 2013 financial year.
Deep Ye l l ow L im i t ed 31 2014 Annual R ep or t
For
per
sona
l use
onl
y

Vesting and Performance conditions The Performance rights issued in July 2013 and October 2013 are subject to a range of vesting and performance conditions: G Cochran 1,500,000 rights vest subject to Mr Cochran being and remaining employed up to the 1 December 2014 test date of which:
• 500,000 will vest only by reason of Mr Cochran being and remaining employed by the Company as at the relevant Test Date; • 500,000 will vest subject to the 10 day VWAP of trading in the Shares up to the relevant Test Date being at least 6 cents per Share;
and • 500,000 will vest subject to the 10 day VWAP of trading in the Shares up to the relevant Test Date being at least 8 cents per Share.
2,500,000 rights vest subject to Mr Cochran being and remaining employed up to the 1 December 2015 test date of which:
• 750,000 will vest only by reason of Mr Cochran being and remaining employed by the Company as at the relevant Test Date; • 750,000 will vest subject to the 10 day VWAP of trading in the Shares up to the relevant Test Date being at least 8 cents per Share;
and • 1,000,000 will vest subject to the 10 day VWAP of trading in the Shares up to the relevant Test Date being at least 12 cents per
Share.
3,000,000 rights vest subject to Mr Cochran being and remaining employed up to the 1 December 2016 test date of which:
• 1,000,000 will vest only by reason of Mr Cochran being and remaining employed by the Company as at the relevant Test Date; • 1,000,000 will vest subject to the 10 day VWAP of trading in the Shares up to the relevant Test Date being at least 12 cents per
Share; and • 1,000,000 will vest subject to the 10 day VWAP of trading in the Shares up to the relevant Test Date being at least 15 cents per
Share. P Christians 500,000 rights vest on 1 February 2014 if Mr Christians remains employed by the Company up to the Vesting Date; 500,000 rights vest on 1 February 2015 if Mr Christians remains employed by the Company up to the Vesting Date; 1,500,000 rights vest subject to Mr Christians being and remaining employed up to the 1 February 2016 test date of which:
• 750,000 will vest only by reason of Mr Christians being and remaining employed by the Company as at the relevant Test Date; • 375,000 will vest subject to the 10 day VWAP of trading in the Shares up to the relevant Test Date being at least 8 cents per Share;
and • 375,000 will vest subject to the 10 day VWAP of trading in the Shares up to the relevant Test Date being at least 12 cents per Share.
M Pitts 150,000 rights vest on 1 July 2014 if Mr M Pitts remains employed by the Company up to the Vesting Date; 150,000 rights vest on 1 July 2015 if Mr M Pitts remains employed by the Company up to the Vesting Date; 450,000 rights vest on 1 July 2016 if Mr M Pitts remains employed by the Company up to the Vesting Date and 225,000 of the rights will be subject to an additional market based vesting condition, that the DYL share price equals or exceeds 8 cents. Table 3(b): Share rights: Value of rights expensed during the year ended 30 June 2014
Terms and Conditions for allocations during the year Value of rights expensed during the year
30 June 2014
Grant date (i)
Number of rights
Fair Value per
right at grant date
(cents) (i)
Total value of rights
allocated ($)
Vesting date
Vesting and performance conditions
Value of expensed
rights during the
year
% of Total Remuneration consisting of
rights
Executive Director G Cochran - 584,928 1.9 11,114 N/A N/A 11,114 2.1 Non-executive Directors R Brunovs - 184,647 1.9 3,508 N/A N/A 3,508 5.2 M Greene - 184,647 1.9 3,508 N/A N/A 3,508 3.8 T Netscher - 284,072 1.9 5,397 N/A N/A 5,397 5.6 G Swaby - 173,107 1.9 3,278 N/A N/A 3,278 5.2 C Urtel - 172,540 1.9 3,278 N/A N/A 3,278 5.2
(j) Share rights are allocated monthly but are subject to shareholder approval. This is expected to be received at the Annual General
meeting on 6 November 2014. The fair value has been estimated based on the share price at 30 June 2014.
Deep Ye l l ow L im i t ed 32 2014 Annual R ep or t
For
per
sona
l use
onl
y

Table 3(c): Performance rights: Value of rights expensed during the year ended 30 June 2013
Terms and Conditions for each Grant during the year Value of rights expensed during the year
30 June 2013 Grant date
Number of rights
Fair Value per
right at grant date
(cents)
Total value of rights
granted ($)
Vesting date
Vesting and performance
conditions (i)
Value of expensed
rights during the year
% of Total Remuneration consisting of
rights
Executive directors G Cochran 25-Feb-11 300,000 30.50 91,500 30-Jun-13 Time based 39,214
38.16
G Cochran 25-Feb-11 1,200,000 20.58 246,960 30-Jun-13 Market price 105,840 G Cochran 6-Dec-12 250,000 5.20 13,000 1-Dec-13 Time based 13,000 G Cochran 6-Dec-12 250,000 1.90 4,750 1-Dec-13 Market price 4,750 G Cochran 6-Dec-12 300,000 1.10 3,300 1-Dec-13 Market price 3,300 G Cochran 6-Dec-12 250,000 5.20 13,000 1-Dec-14 Time based 13,000 G Cochran 6-Dec-12 400,000 2.10 8,400 1-Dec-14 Market price 8,400 G Cochran 6-Dec-12 800,000 1.70 13,600 1-Dec-14 Market price 13,600 G Cochran 6-Dec-12 500,000 5.20 26,000 1-Dec-14 Performance 26,000 G Cochran 6-Dec-12 500,000 5.20 26,000 1-Dec-15 Time based 26,000 G Cochran 6-Dec-12 500,000 2.30 11,500 1-Dec-15 Market price 11,500 G Cochran 6-Dec-12 1,250,000 2.00 25,000 1-Dec-15 Market price 25,000 G Cochran 6-Dec-12 500,000 5.20 26,000 1-Dec-15 Performance 26,000 315,604 M Kavanagh (i) 16-Nov-11 320,000 8.20 26,240 30-Nov-12 Market price 10,537
(17.46) M Kavanagh (ii) 25-Feb-11 150,000 30.50 45,750 27-May-13 Time based 17,973 M Kavanagh (iii) 25-Feb-11 600,000 24.01 144,060 1-Jul-13 Market price (82,320) (53,810) Other KMP M Pitts 3-Feb-11 52,080 37.0 19,270 1-Aug-12 Time based 1,071
17.86
M Pitts 3-Feb-11 44,640 36.0 16,060 1-Aug-12 Market price 893 M Pitts (iv) 27-Aug-12 44,640 1.31 585 1-Aug-13 Market price 585 M Pitts 9-Dec-11 16,000 15.5 2,480 1-Jul-13 Time based 1,588 M Pitts 9-Dec-11 24,000 15.5 3,720 1-Jul-14 Time based 2,382 M Pitts 9-Dec-11 24,000 9.60 2,304 1-Jul-14 Market price 1,475 M Pitts 3-Oct-12 52,420 4.40 2,306 1-Jul-13 Time based 2,306 M Pitts 3-Oct-12 52,420 4.40 2,306 1-Jul-14 Time based 2,306 M Pitts 3-Oct-12 78,630 4.40 3,460 1-Jul-15 Time based 3,460 M Pitts 3-Oct-12 78,630 2.80 2,202 1-Jul-15 Market price 2,202 18,268 280,062
(ii) Performance Hurdles attaching to the Performance Rights with a 16 November 2011 grant date were varied for the market price to
be retested on 30 November 2012. (iii) 150,000 Performance Rights with a 1 July 2013 vesting date were retained on termination and immediately vested on 27 May 2013. (iv) 600,000 Performance Rights with a 1 July 2013 vesting date were forfeited and previously recognised expenses of $82,320 were
written back. (v) Performance Hurdles attaching to the Performance Rights with a 1 August 2012 vesting date were varied for the market price to be
retested on 1 August 2013. Equity instruments Unlisted Options During the financial year no options were granted as equity compensation benefits to key management personnel and none vested. Rights Rights granted, vested and lapsed during the year are set out in Table 4(a) and (b) below. Rights do not carry any voting or dividend rights and can be exercised once the vesting conditions have been met until their expiry date.
Deep Ye l l ow L im i t ed 33 2014 Annual R ep or t
For
per
sona
l use
onl
y

Table 4(a): Performance rights: Granted, vested and lapsed during the year ended 30 June 2014
30 June 2014 Number granted Grant Date Fair Value per right at grant date (cents)
Vesting date No. vested during year
No. lapsed during year
Executive directors G Cochran 300,000 25-Feb-11 30.50 30-Jun-13 300,000 - G Cochran 1,200,000 25-Feb-11 30.50 30-Jun-13 - 1,200,000 G Cochran 250,000 6-Dec-12 5.20 1-Dec-13 250,000 - G Cochran 250,000 6-Dec-12 1.90 1-Dec-13 - 250,000 G Cochran 300,000 6-Dec-12 1.10 1-Dec-13 - 300,000 G Cochran 250,000 6-Dec-12 5.20 1-Dec-14 - - G Cochran 400,000 6-Dec-12 2.10 1-Dec-14 - - G Cochran 800,000 6-Dec-12 1.70 1-Dec-14 - - G Cochran 500,000 6-Dec-12 5.20 1-Dec-14 - - G Cochran 500,000 6-Dec-12 5.20 1-Dec-15 - - G Cochran 500,000 6-Dec-12 2.30 1-Dec-15 - - G Cochran 1,250,000 6-Dec-12 2.00 1-Dec-15 - - G Cochran 500,000 6-Dec-12 5.20 1-Dec-15 - - G Cochran 500,000 29-Oct-13 2.00 1-Dec-14 - - G Cochran 500,000 29-Oct-13 0.50 1-Dec-14 - - G Cochran 500,000 29-Oct-13 0.30 1-Dec-14 - - G Cochran 750,000 29-Oct-13 2.00 1-Dec-15 - - G Cochran 750,000 29-Oct-13 0.60 1-Dec-15 - - G Cochran 1,000,000 29-Oct-13 0.40 1-Dec-15 - - G Cochran 1,000,000 29-Oct-13 2.00 1-Dec-16 - - G Cochran 1,000,000 29-Oct-13 0.70 1-Dec-16 - - G Cochran 1,000,000 29-Oct-13 0.60 1-Dec-16 - -
P Christians 500,000 8-Jul-13 4.30 1-Feb-14 500,000 - P Christians 500,000 8-Jul-13 4.30 1-Feb-15 - - P Christians 750,000 8-Jul-13 4.30 1-Feb-16 - - P Christians 375,000 8-Jul-13 2.60 1-Feb-16 - - P Christians 375,000 8-Jul-13 2.10 1-Feb-16 - -
Other KMP M Pitts 44,640 27-Aug-12 1.31 1-Aug-13 - 44,640 M Pitts 16,000 9-Dec-11 15.50 1-Jul-13 16,000 - M Pitts 24,000 9-Dec-11 15.50 1-Jul-14 - - M Pitts 24,000 9-Dec-11 9.60 1-Jul-14 - - M Pitts 52,420 3-Oct-12 4.40 1-Jul-13 52,420 - M Pitts 52,420 3-Oct-12 4.40 1-Jul-14 - - M Pitts 78,630 3-Oct-12 4.40 1-Jul-15 - - M Pitts 78,630 3-Oct-12 2.80 1-Jul-15 - - M Pitts 150,000 29-Oct-13 2.00 1-Jul-14 - - M Pitts 150,000 29-Oct-13 2.00 1-Jul-15 - - M Pitts 225,000 29-Oct-13 2.00 1-Jul-16 - - M Pitts 225,000 29-Oct-13 0.80 1-Jul-16 - -
For details on the valuation of the rights, including models and assumptions used, please refer to note 18. The rights were provided at no cost to the recipients. The terms and conditions for rights granted to M Pitts with a 1 August 2012 vesting date have been altered for the market price to be retested on 1 August 2013.
Deep Ye l l ow L im i t ed 34 2014 Annual R ep or t
For
per
sona
l use
onl
y

Table 4(b): Share rights: Allocated, vested and lapsed during the year ended 30 June 2014
30 June 2014 Number allocated Grant Date (i)
Fair Value per right at grant date (cents)
(i)
Vesting date No. vested during year
No. lapsed during year
Executive Directors G Cochran 584,928 - 1.90 N/A - -
Non-executive Directors
R Brunovs 184,647 - 1.90 N/A - - M Greene 184,647 - 1.90 N/A - - T Netscher 284,072 - 1.90 N/A - - G Swaby 173,107 - 1.90 N/A - - C Urtel 172,540 - 1.90 N/A - -
(i) Share rights are allocated monthly but are subject to shareholder approval. This is expected to be received at the Annual General meeting on 6 November 2014. The fair value has been estimated based on the share price at 30 June 2014.
For details on the valuation of the rights, including models and assumptions used, please refer to note 18. The rights were provided at no cost to the recipients. The tables below disclose the Performance and Share right holdings of Key Management Personnel of the Group. Table 5(a): Performance right holdings
2014 Name
Balance at start of the year
Granted as remuneration
during the year
Vested as shares during the year
Net other changes during
the year
Balance at the end of the year
Executive directors Greg Cochran 7,000,000 7,584,928 (550,000) (1,750,000) 12,284,928 Other KMP Peter Christians - 2,500,000 (500,000) - 2,000,000 Mark Pitts 370,740 750,000 (68,420) (44,640) 1,007,680
2013 Name
Balance at start of the year
Granted as remuneration
during the year
Vested as shares during the year
Net other changes during
the year
Balance at the end of the year
Executive directors Greg Cochran 1,500,000 5,500,000 - - 7,000,000 Martin Kavanagh (i) 1,070,000 - (150,000) (920,000) - Other KMP Leon Pretorius (ii) 600,000 - - (600,000) - Peter Christians (iii) - - - - - Mark Pitts 176,720 262,100 (68,080) - 370,740 (i) Ceased employment at conclusion of his employment agreement on 27 May 2014 (ii) Ceased employment at conclusion of his Consultancy Agreement on 31 December 2012 (iii) Joined 7 January 2013 Table 5(b): Share right holdings
2014 Name
Balance at start of the year
Allocated as remuneration
during the year (i)
Vested as shares during the year
Net other changes during
the year
Balance at the end of the year
Non-executive Directors M Greene - 184,647 - - 184,647 G Swaby - 173,107 - - 173,107 R Brunovs - 184,647 - - 184,647 T Netscher - 284,072 - - 284,072 C Urtel - 172,540 - - 172,540 (j) Share rights are allocated monthly but are subject to shareholder approval. This is expected to be received at the Annual General
meeting on 6 November 2014.
Deep Ye l l ow L im i t ed 35 2014 Annual R ep or t
For
per
sona
l use
onl
y

The table below disclose the Shareholdings of Key Management Personnel of the Group. Table 6: Shareholdings
2014 Name
Balance at start of the year
Received during the year on performance rights
vesting
Other changes during the year (iii)
Balance at the end of the year
Directors Mervyn Greene 51,491,667 - - 51,491,667 Greg Cochran 450,000 550,000 750,000 1,750,000 Gillian Swaby 50,000,000 - - 50,000,000 Rudolf Brunovs 155,000 - - 155,000 Tim Netscher - - - - Christophe Urtel - - - - Other Key Management Personnel Mark Pitts 239,208 68,420 500,000 807,628 Peter Christians - 500,000 - 500,000
2013 Name
Balance at start of the year
Received during the year on vesting of
performance rights
Other changes during the year (iii)
Balance at the end of the year
Directors Mervyn Greene 51,491,667 - - 51,491,667 Greg Cochran 100,000 - 350,000 450,000 Martin Kavanagh (i) 720,500 150,000 (870,500) - Gillian Swaby 50,000,000 - - 50,000,000 Rudolf Brunovs 125,000 - 30,000 155,000 Tim Netscher - - - - Christophe Urtel - - - - Other Key Management Personnel Leon Pretorius (ii) 70,750,681 - (70,750,681) - Mark Pitts 52,080 68,080 119,048 239,208 Peter Christians - - - - (i) Ceased employment at conclusion of his Employment Agreement on 27 May 2013 (ii) Ceased employment at conclusion of his Consultancy Agreement on 31 December 2012 (iii) Shares issued whilst participating in a pro-rata non-renounceable entitlement issue of the Company, Loans Made to Key Management Personnel No loans were made to any Director or Key Management Personnel or any of their related entities during the reporting period. Other Transactions with Key Management Personnel There were no other transactions with any Director or Key Management Personnel or any of their related entities during the reporting period. End of Remuneration Report (Audited) This report is made in accordance with a resolution of the Directors. DATED at Perth this 26th day of September 2014
Greg Cochran Managing Director
Deep Ye l l ow L im i t ed 36 2014 Annual R ep or t
For
per
sona
l use
onl
y

37
GHM:JT:DYL:010
Ernst & Young11 Mounts Bay RoadPerth WA 6000 AustraliaGPO Box M939 Perth WA 6843
Tel: +61 8 9429 2222Fax: +61 8 9429 2436ey.com/au
A member firm of Ernst & Young Global LimitedLiability limited by a scheme approved under Professional Standards Legislation
Auditor’s independence declaration to the Directors of Deep YellowLimited
In relation to our audit of the financial report of Deep Yellow Limited for the year ended30 June 2014, to the best of my knowledge and belief, there have been no contraventions of the auditorindependence requirements of the Corporations Act 2001 or any applicable code of professional conduct.
Ernst & Young
G H MeyerowitzPartner26 September 2014
For
per
sona
l use
onl
y
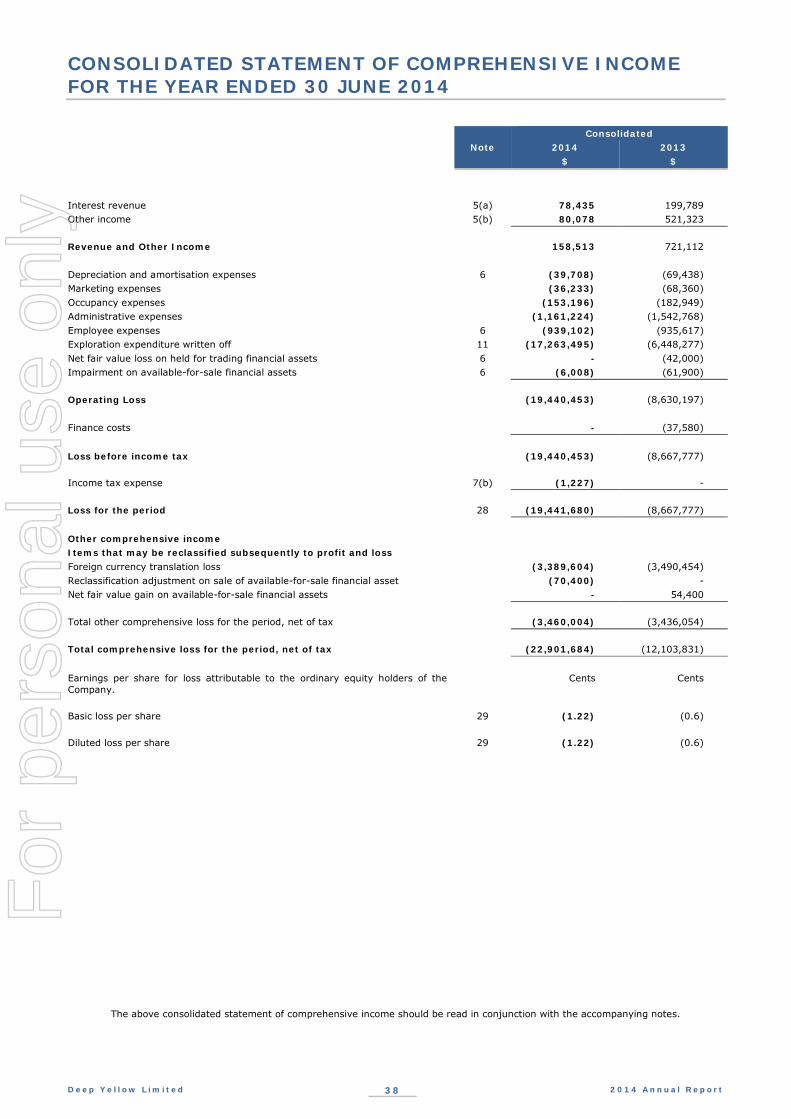
CONSOLIDATED STATEMENT OF COMPREHENSIVE INCOME FOR THE YEAR ENDED 30 JUNE 2014
Note
Consolidated 2014 2013 $ $
Interest revenue 5(a) 78,435 199,789 Other income 5(b) 80,078 521,323 Revenue and Other Income
158,513 721,112
Depreciation and amortisation expenses 6 (39,708) (69,438) Marketing expenses (36,233) (68,360) Occupancy expenses (153,196) (182,949) Administrative expenses (1,161,224) (1,542,768) Employee expenses 6 (939,102) (935,617) Exploration expenditure written off 11 (17,263,495) (6,448,277) Net fair value loss on held for trading financial assets 6 - (42,000) Impairment on available-for-sale financial assets 6 (6,008) (61,900) Operating Loss
(19,440,453) (8,630,197)
Finance costs - (37,580) Loss before income tax (19,440,453) (8,667,777) Income tax expense
7(b) (1,227) -
Loss for the period
28 (19,441,680) (8,667,777)
Other comprehensive income Items that may be reclassified subsequently to profit and loss Foreign currency translation loss (3,389,604) (3,490,454) Reclassification adjustment on sale of available-for-sale financial asset (70,400) - Net fair value gain on available-for-sale financial assets - 54,400 Total other comprehensive loss for the period, net of tax
(3,460,004)
(3,436,054)
Total comprehensive loss for the period, net of tax
(22,901,684)
(12,103,831)
Earnings per share for loss attributable to the ordinary equity holders of the Company.
Cents Cents
Basic loss per share
29
(1.22)
(0.6)
Diluted loss per share
29
(1.22)
(0.6)
The above consolidated statement of comprehensive income should be read in conjunction with the accompanying notes.
Deep Ye l l ow L im i t ed 38 2014 Annual R ep or t
For
per
sona
l use
onl
y

CONSOLIDATED STATEMENT OF FINANCIAL POSITION AS AT 30 JUNE 2014
Note
Consolidated 2014 2013 $ $
ASSETS Current assets Cash and cash equivalents 8 1,235,654 3,990,597 Trade and other receivables 9(a) 88,510 170,259 Other assets 9(b) 129,894 174,439 Total current assets
1,454,058
4,335,295
Non- current assets Available-for-sale investments 10 - 433,833 Capitalised mineral exploration and evaluation expenditure 11 69,830,701 87,934,508 Property, plant and equipment 12 777,214 925,560 Total non-current assets
70,607,915
89,293,901
Total assets
72,061,973
93,629,196
LIABILITIES Current liabilities Trade and other payables 13 286,538 547,153 Total current liabilities
286,538
547,153
Total liabilities
286,538
547,153
Net assets
71,775,435
93,082,043
EQUITY Issued equity 14 216,816,003 215,551,617 Accumulated losses 16 (139,155,792) (119,714,112) Employee equity benefits reserve 16 10,652,328 10,321,638 Asset fair value adjustment reserve 16 - 70,400 Foreign currency translation reserve 16 (16,537,104) (13,147,500) Total equity
71,775,435
93,082,043
The above consolidated statement of financial position should be read in conjunction with the accompanying notes.
Deep Ye l l ow L im i t ed 39 2014 Annual R ep or t
For
per
sona
l use
onl
y

STATEMENT OF CHANGES IN EQUITY FOR THE FINANCIAL YEAR ENDED 30 JUNE 2014
Issued Equity Asset fair value
adjustment reserve
Foreign currency
translation reserve
Employee equity
benefits reserve
Other reserves
Accumulated losses Total Equity
$ $ $ $ $ $
At 1 July 2013 215,551,617 70,400 (13,147,500) 10,321,638 - (119,714,112) 93,082,043 Loss for the period - - - - - (19,441,680) (19,441,680)
Other comprehensive loss
- (70,400) (3,389,604) - -
- (3,460,004)
Total comprehensive loss for the period
- (70,400) (3,389,604)
- -
(19,441,680) (22,901,684)
Issue of share capital 965,900 - - - - - 965,900 Transaction costs (104,041) - - - - - (104,041) Vesting of performance rights 402,527 - - (402,527) - - - Share based payments - - - 733,218 - - 733,218 At 30 June 2014 216,816,003 - (16,537,104) 10,652,329 (139,155,792) 71,775,436
Issued Equity Asset fair value
adjustment reserve
Foreign currency translation
reserve
Employee equity
benefits reserve
Other reserves
Accumulated losses Total Equity
$ $ $ $ $ $ $
At 1 July 2012 195,948,041 16,000 (9,657,046) 10,362,807 7,307,333 (111,046,335) 92,930,800 Loss for the period - - - - - (8,667,777) (8,667,777) Other comprehensive profit/(loss)
- 54,400 (3,490,454) - -
- (3,436,054)
Total comprehensive loss for the period
- 54,400 (3,490,454) - -
(8,667,777) (12,103,831)
Issue of share capital 19,946,885 - - - (7,307,333) - 12,639,552 Transaction costs (777,815) - - - - - (777,815) Vesting of performance rights 434,506 - - (434,506) - - - Share based payments - - - 393,337 - - 393,337 At 30 June 2013 215,551,617 70,400 (13,147,500) 10,321,638 - (119,714,112) 93,082,043
/
The above consolidated statement of changes in equity should be read in conjunction with the accompanying notes.
Deep Ye l l ow L im i t ed 40 2014 Annual R ep or t
For
per
sona
l use
onl
y

CASH FLOW STATEMENT FOR THE FINANCIAL YEAR ENDED 30 JUNE 2014
Note
Consolidated 2014 2013 $ $
Cash flows from operating activities Interest received 89,992 182,176 Payments to suppliers and employees (1,922,121) (2,446,752) Other payments - (100,000) Net cash used in operating activities
28
(1,832,129)
(2,364,576)
Cash flows from investing activities Exploration expenditure (2,392,439) (5,573,708) Proceeds from sale of investments 429,183 95,000 Payments for property, plant and equipment (11,547) (27,847) Proceeds on sale of property, plant and equipment 28,761 594,562 Refund of security deposits 2,500 20,500 Net cash used in investing activities
(1,943,542)
(4,891,493)
Cash flows from financing activities Proceeds from the issue of shares 865,859 9,824,157 Net cash from financing activities
865,859
9,824,157
Net increase/(decrease) in cash and cash equivalents
(2,909,812)
2,568,088
Effects on cash of foreign exchange 154,869 (789,439) Cash and cash equivalents at the beginning of the financial year 3,990,597 2,211,948 Cash and cash equivalents at the end of the financial year
8(a)
1,235,654
3,990,597
The above consolidated cash flow statement should be read in conjunction with the accompanying notes.
Deep Ye l l ow L im i t ed 41 2014 Annual R ep or t
For
per
sona
l use
onl
y

CONSOLIDATED NOTES TO THE FINANCIAL STATEMENTS FOR THE FINANCIAL YEAR ENDED 30 JUNE 2014
Note 1 Corporation information and summary of significant accounting policies
The consolidated financial statements of Deep Yellow Limited and its subsidiaries (‘the Group’) for the year ended 30 June 2014 were authorised for issue in accordance with a resolution of Directors on 11 September 2014, subject to minor changes.
Deep Yellow Limited is a for-profit company limited by shares incorporated and domiciled in Australia whose shares are publicly traded on the Australian Securities Exchange.
The nature of the operations and principal activities of the Group are described in the Directors’ Report.
The principal accounting policies adopted in the preparation of the financial report are set out below. These policies have been consistently applied to all the years presented, unless otherwise stated.
(a) Basis of preparation
This general purpose financial report has been prepared in accordance with the requirements of the Corporations Act 2001, AustralianAccounting Standards and other authoritative pronouncements of the Australian Accounting Standards Board.
The financial report is presented in Australian dollars and all values are rounded to the nearest dollar.
Statement of Compliance
The financial report also complies with International Financial Reporting Standards (IFRS) as issued by the International Accounting Standards Board.
New accounting standards and interpretations
The accounting policies adopted are consistent with those of the previous financial year except as follows:
From 1 July 2013, Deep Yellow Limited has adopted all Australian Accounting Standards and Interpretations effective from 1 July 2013,including:.
Reference Title SummaryAASB 10 Consolidated Financial
StatementsAASB 10 establishes a new control model that applies to all entities. It replaces parts of AASB 127 Consolidated and Separate Financial Statements dealing with the accounting for consolidated financial statements and UIG-112 Consolidation - Special Purpose Entities.
The new control model broadens the situations when an entity is considered to be controlled by another entity and includes new guidance for applying the model to specific situations, including when acting as a manager may give control, the impact of potential voting rights and when holding less than a majority voting rights may give control.
Consequential amendments were also made to this and other standards via AASB 2011-7 and AASB 2012-10.
AASB 11 Joint Arrangements AASB 11 replaces AASB 131 Interests in Joint Ventures and UIG-113 Jointly- controlled Entities - Non-monetary Contributions by Ventures.
AASB 11 uses the principle of control in AASB 10 to define joint control, and therefore the determination of whether joint control exists may change. In addition it removes the option to account for jointly controlled entities (JCEs) using proportionate consolidation. Instead, accounting for a joint arrangement is dependent on the nature of the rights and obligations arising from the arrangement. Joint operations that give the venturers a right to the underlying assets and obligations themselves is accounted for by recognising the share of those assets and obligations. Joint ventures that give the venturers a right to the net assets is accounted for using the equity method.
Consequential amendments were also made to this and other standards via AASB 2011-7, AASB 2010-10 and amendments to AASB 128.
AASB 12 Disclosure of Interests in Other Entities
AASB 12 includes all disclosures relating to an entity's interests in subsidiaries, joint arrangements, associates and structured entities. New disclosures have been introduced about the judgments made by management to determine whether control exists, and to require summarised information about joint arrangements, associates, structured entities and subsidiaries with non-controlling interests.
AASB 13 Fair Value Measurement AASB 13 establishes a single source of guidance for determining the fair value of assets and liabilities. AASB 13 does not change when an entity is required to use fair value, but rather, provides guidance on how to determine fair value when fair value is required or permitted. Application of this definition may result in different fair values being determined for the relevant assets.
AASB 13 also expands the disclosure requirements for all assets or liabilities carried at fair value. This includes information about the assumptions made and the qualitative impact of those assumptions on the fair value determined.
Consequential amendments were also made to other standards via AASB 2011-8.AASB 119(Revised 2011)
Employee Benefits The revised standard changes the definition of short-term employee benefits. The distinction between short-term and other long-term employee benefits is now based on whether the benefits are expected to be settled wholly within 12 months after the reporting date.
Consequential amendments were also made to other standards via AASB 2011-10.AASB 2011-4 Amendments to Australian
Accounting Standards to Remove Individual Key Management Personnel Disclosure Requirements [AASB 124]
This amendment deletes from AASB 124 individual key management personnel disclosure requirements for disclosing entities that are not companies. It also removes the individual KMP disclosure requirements for all disclosing entities in relation to equity holdings, loans and other related party transactions.
The adoption of the above amendmends resulted in changes to presentation and disclosures, but had no material impact on the financial position or financial performance of the Group.
New accounting standards and interpretations issued but not yet effective
The following standards, amendments to standards and interpretations have been identified as those which may impact the consolidated entity in the period of initial application. They have recently been issued or amended but are not yet effective and have not been applied in preparing this financial report.
Deep Ye l l ow L im i t ed 42 2014 Annual R ep or t
For
per
sona
l use
onl
y

Reference Title Summary
Application date of
standard *
Impact on Group
financial report
Application date for Group *
AASB 2012-3 Amendments to Australian Accounting Standards - Offsetting Financial Assets and Financial Liabilities
AASB 2012-3 adds application guidance to AASB 132 Financial Instruments: Presentation to address inconsistencies identified in applying some of the offsetting criteria of AASB 132, including clarifying the meaning of "currently has a legally enforceable right of set-off" and that some gross settlement systems may be considered equivalent to net settlement.
1 January 2014 The Group has not yet determined the impact of the amendments, if any
1 July 2014
Interpretation 21
Levies
This Interpretation confirms that a liability to pay a levy is only recognised when the activity that triggers the payment occurs. Applying the going concern assumption does not create a constructive obligation.
1 January 2014 The Group has not yet determined the impact of the amendments, if any
1 July 2014
AASB 9/IFRS 9 Financial Instruments On 24 July 2014 The IASB issued the final version of IFRS 9 which replaces IAS 39 and includes a logical model for classification and measurement, a single, forward-looking ‘expected loss’ impairment model and a substantially-reformed approach to hedge accounting. IFRS 9 is effective for annual periods beginning on or after 1 January 2018. However, the Standard is available for early application. The own credit changes can be early applied in isolation without otherwise changing the accounting for financial instruments. The final version of IFRS 9 introduces a new expected-loss impairment model that will require more timely recognition of expected credit losses. Specifically, the new Standard requires entities to account for expected credit losses from when financial instruments are first recognised and to recognise full lifetime expected losses on a more timely basis. The AASB is yet to issue the final version of AASB 9. A revised version of AASB 9 (AASB 2013-9) was issued in December 2013 which included the new hedge accounting requirements, including changes to hedge effectiveness testing, treatment of hedging costs, risk components that can be hedged and disclosures. AASB 9 includes requirements for a simplified approach for classification and measurement of financial assets compared with the requirements of AASB 139. The main changes are described below.
Financial assets that are debt instruments will be classified based on (1) the objective of the entity's business model for managing the financial assets; (2) the characteristics of the contractual cash flows.
Allows an irrevocable election on initial recognition to present gains and losses on investments in equity instruments that are not held for trading in other comprehensive income. Dividends in respect of these investments that are a return on investment can be recognised in profit or loss and there is no impairment or recycling on disposal of the instrument.
Financial assets can be designated and measured at fair value through profit or loss at initial recognition if doing so eliminates or significantly reduces a measurement or recognition inconsistency that would arise from measuring assets or liabilities, or recognising the gains and losses on them, on different bases.
Where the fair value option is used for financial liabilities the change in fair value is to be accounted for as follows:
The change attributable to changes in credit risk are presented in other comprehensive income (OCI)
The remaining change is presented in profit or loss AASB 9 also removes the volatility in profit or loss that was caused by changes in the credit risk of liabilities elected to be measured at fair value. This change in accounting means that gains caused by the deterioration of an entity’s own credit risk on such liabilities are no longer recognised in profit or loss. Consequential amendments were also made to other standards as a result of AASB 9, introduced by AASB 2009-11 and superseded by AASB 2010-7, AASB 2010-10 and AASB 2014-1 – Part E.
1 Jan 2018 The Group has not yet determined the impact of the amendments, if any
1 July 2018
AASB 2013-3 Amendments to AASB 136 – Recoverable Amount Disclosures for Non-Financial Assets
AASB 2013-3 amends the disclosure requirements in AASB 136 Impairment of Assets. The amendments include the requirement to disclose additional information about the fair value measurement when the recoverable amount of impaired assets is based on fair value less costs of disposal.
1 January 2014 The Group has not yet determined the impact of the amendments, if any
1 July 2014
AASB 2014-1 Part A -Annual Improvements 2010–2012 Cycle
Amendments to Australian Accounting Standards - Part A Annual Improvements to IFRSs 2010–2012 Cycle
AASB 2014-1 Part A: This standard sets out amendments to Australian Accounting Standards arising from the issuance by the International Accounting Standards Board (IASB) of International Financial Reporting Standards (IFRSs) Annual Improvements to IFRSs 2010–2012 Cycle and Annual Improvements to IFRSs 2011–2013 Cycle. Annual Improvements to IFRSs 2010–2012 Cycle addresses the following items:
► AASB 2 - Clarifies the definition of 'vesting conditions' and 'market condition' and introduces the definition of 'performance condition' and 'service condition'.
► AASB 3 - Clarifies the classification requirements for contingent consideration in a business combination by removing all references to AASB 137.
► AASB 8 - Requires entities to disclose factors used to identify the entity's reportable segments when operating segments have been aggregated. An entity is also required to provide a reconciliation of total reportable segments' asset to the entity's total assets.
► AASB 116 & AASB 138 - Clarifies that the determination of accumulated depreciation does not depend on the selection of the valuation technique and that it is calculated as the difference between the gross and net carrying amounts.
► AASB 124 - Defines a management entity providing KMP services as a related party of the reporting entity. The amendments added an exemption from the detailed disclosure requirements in paragraph 17 of AASB 124 for KMP services provided by a management entity. Payments made to a management entity in respect of KMP services should be separately disclosed.
1 July 2014 The Group has not yet determined the impact of the amendments, if any
1 July 2014
Deep Ye l l ow L im i t ed 43 2014 Annual R ep or t
For
per
sona
l use
onl
y

Reference Title Summary
Application date of
standard *
Impact on Group
financial report
Application date for Group *
AASB 2014-1 Part A -Annual Improvements 2011–2013 Cycle N/A
Amendments to Australian Accounting Standards - Part A Annual Improvements to IFRSs 2011–2013 Cycle
Annual Improvements to IFRSs 2011–2013 Cycle addresses the following items: ► AASB13 - Clarifies that the portfolio exception in paragraph
52 of AASB 13 applies to all contracts within the scope of AASB 139 or AASB 9, regardless of whether they meet the definitions of financial assets or financial liabilities as defined in AASB 132.
► AASB40 - Clarifies that judgment is needed to determine whether an acquisition of investment property is solely the acquisition of an investment property or whether it is the acquisition of a group of assets or a business combination in the scope of AASB 3 that includes an investment property. That judgment is based on guidance in AASB 3.
1 July 2014 The Group has not yet determined the impact of the amendments, if any
1 July 2014
AASB 1031 Materiality The revised AASB 1031 is an interim standard that cross-references to other Standards and the Framework (issued December 2013) that contain guidance on materiality. AASB 1031 will be withdrawn when references to AASB 1031 in all Standards and Interpretations have been removed. AASB 2014-1 Part C issued in June 2014 makes amendments to eight Australian Accounting Standards to delete their references to AASB 1031. The amendments are effective from 1 July 2014*.
1 January 2014 The Group has not yet determined the impact of the amendments, if any
1 July 2014
AASB 2013-9 Amendments to Australian Accounting Standards – Conceptual Framework, Materiality and Financial Instruments
The Standard contains three main parts and makes amendments to a number Standards and Interpretations.
Part A of AASB 2013-9 makes consequential amendments arising from the issuance of AASB CF 2013-1.
Part B makes amendments to particular Australian Accounting Standards to delete references to AASB 1031 and also makes minor editorial amendments to various other standards.
Part C makes amendments to a number of Australian Accounting Standards, including incorporating Chapter 6 Hedge Accounting into AASB 9 Financial Instruments.
^^ The Group has not yet determined the impact of the amendments, if any
^^
Amendments to IAS 16 and IAS 38**
Clarification of Acceptable Methods of Depreciation and Amortisation (Amendments to IAS 16 and IAS 38)
IAS 16 and IAS 38 both establish the principle for the basis of depreciation and amortisation as being the expected pattern of consumption of the future economic benefits of an asset. The IASB has clarified that the use of revenue-based methods to calculate the depreciation of an asset is not appropriate because revenue generated by an activity that includes the use of an asset generally reflects factors other than the consumption of the economic benefits embodied in the asset. The IASB also clarified that revenue is generally presumed to be an inappropriate basis for measuring the consumption of the economic benefits embodied in an intangible asset. This presumption, however, can be rebutted in certain limited circumstances.
1 January 2016 The Group has not yet determined the impact of the amendments, if any
1 July 2016
AASB 2014-1 Part B Amendments to AASB 119
Amendments to Australian Accounting Standards - Part B Defined Benefit Plans: Employee Contributions (Amendments to AASB 119)
AASB 2014-Part B makes amendments in relation to the requirements for contributions from employees or third parties that are set out in the formal terms of the benefit plan and linked to service. The amendments clarify that if the amount of the contributions is independent of the number of years of service, an entity is permitted to recognise such contributions as a reduction in the service cost in the period in which the related service is rendered, instead of attributing the contributions to the periods of service.
1 July 2014 The Group has not yet determined the impact of the amendments, if any
1 July 2014
IFRS 15 **
Revenue from Contracts with Customers
In May 2014, the IASB issued IFRS 15 Revenue from Contracts with Customers, which replaces IAS 11 Construction Contracts, IAS 18 Revenue and related Interpretations (IFRIC 13 Customer Loyalty Programmes, IFRIC 15 Agreements for the Construction of Real Estate, IFRIC 18 Transfers of Assets from Customers and SIC-31 Revenue—Barter Transactions Involving Advertising Services) The core principle of IFRS 15 is that an entity recognises revenue to depict the transfer of promised goods or services to customers in an amount that reflects the consideration to which the entity expects to be entitled in exchange for those goods or services. An entity recognises revenue in accordance with that core principle by applying the following steps: (a) Step 1: Identify the contract(s) with a customer (b) Step 2: Identify the performance obligations in the contract (c) Step 3: Determine the transaction price (d) Step 4: Allocate the transaction price to the performance obligations in the contract (e) Step 5: Recognise revenue when (or as) the entity satisfies a performance obligation Early application of this standard is permitted.
1 January 2017 The Group has not yet determined the impact of the amendments, if any
1 July 2017 Note A
* Designates the beginning of the applicable annual reporting period unless otherwise stated. ** These IFRS amendments have not yet been adopted by the AASB. In order to claim compliance with IFRS, these amendments should be noted in the financial statements ^^ The application dates of AASB 2013-9 are as follows: Part A –periods ending on or after 20 Dec 2013 Application date for the Group: period ending 30 June 2014 Part B - periods beginning on or after 1 January 2014 Application date for the Group: period beginning 1 July 2014 Part C - reporting periods beginning on or after 1 January 2015 Application date for the Group: period beginning 1 July 2015 Historical cost convention These financial statements have been prepared on a historical cost basis, except for the fair valuation of available-for-sale financial assets and of financial assets and liabilities (including derivative instruments) which have been measured at fair value. Critical accounting estimates The preparation of financial statements in conformity with Australian Accounting Standards requires the use of certain critical accounting estimates. It also requires management to exercise its judgement in the process of applying the Group’s accounting policies. The areas involving a higher degree of judgement or complexity, or areas where assumptions and estimates are significant to the financial statements, are disclosed in note 3.
Deep Ye l l ow L im i t ed 44 2014 Annual R ep or t
For
per
sona
l use
onl
y

(b) Principles of consolidation The consolidated financial statements comprise the financial statements of Deep Yellow Limited and its subsidiaries as at and for the period ended 30 June each year (the Group). Control is achieved when the Group is exposed, or has the rights, to variable returns from its involvement with the investee and has the ability to affect those returns through its power over the investee. Specifically, the Group controls an investee if and only if the Group has:
► Power over the investee (i.e. existing rights that give it the current ability to direct the relevant activities of the investee) ► Exposure, or rights, to variable returns from its involvement with the investee, and ► The ability to use its power over the investee to affect its returns
When the Group has less than a majority of the voting or similar rights of an investee, the Group considers all relevant facts and circumstances in assessing whether it has the power over an investee, including:
► The contractual arrangement with the other vote holders of the investee ► Rights arising from other contractual arrangements ► The Group’s voting rights and potential voting rights
The group re-assesses whether or not it controls an investee if facts and circumstances indicate that there are changes to one or more of the three elements of control. Consolidation of a subsidiary begins when the Group obtains control over the subisidiary and ceases when the Group loses control of the subsidiary. Profit or loss and each component of other comprehensive income (OCI) are attributed to the equity holders of the Group and to the non-controlling interests, even if this results in the non-controlling interests having a deficit balance. When necessary, adjustments are made to the financial statements of subsidiaries to bring their accounting policies into line with the Group’s accounting policies. All intr-agroup assets and liabilities, equity, income, expenses and cash flows relating to transactions between members of the Group are eliminated in full on consolidation. A change in ownership interest in a subsidiary, without a loss of control, is accounted for as an equity transaction. If the Group loses control over a subsidiary, it:
► De-recognises the assets (including goodwill) and liabilities of the subsidiary ► De-recognises the carrying amount of any controlling interests ► De-recognises the cumulative translation differences recorded in equity ► Recognises the fair value of the consideration received ► Recognises the fair value of any investment retained ► Recognises any surplus or deficit in profit or loss ► Reclassifies the parent’s share of components previously recognised in OCI to profit or loss or retained earnings, as appropriate, as
would be required if the Group had directly disposed of the related assets or liabilities (c) Operating segment An operating segment is a distinguishable component of an entity that engages in business activities from which it may earn revenue and incur expenses, whose operating results are regularly reviewed by the entity’s chief operating decision maker to make decisions about how resources should be allocated to the segment and assess its performance and for which discrete financial information is available. Operating segments have been identified based on the information provided to the chief operating decision maker – being the Group Managing Director and Executive management team. (d) Revenue recognition Revenue is recognised to the extent that it is probable that the economic benefits will flow to the Group and the revenue can be reliably measured, regardless of when the payment is being made. Revenue is measured at fair value of the consideration received or receivable, taking into account contractually defined terms of payment and excluding taxes or duty. The specific recognition criteria below must also be met before revenue is recognised. Interest income Interest income is recognised as it accrues using the effective interest method. This is a method of calculating the amortised cost of a financial asset and allocating the interest income over the relevant period using the effective interest rate, which is the rate that exactly discounts estimated future cash receipts through the expected life of the financial asset to the net carrying amount of the financial asset. (e) Income tax The current income tax expense or revenue for the period is the tax payable on the current period’s taxable income based on the notional income tax rate enacted or substantially enacted at balance date for each jurisdiction adjusted by changes in deferred tax assets and liabilities attributable to the temporary differences between the tax bases of assets and liabilities and their carrying amounts in the financial statements, and to unused tax losses. Deferred tax assets and liabilities are recognised for temporary differences at the tax rates expected to apply when the assets are recovered or liabilities are settled, based on those tax rates which are enacted or substantially enacted for each jurisdiction. The relevant tax rates are applied to the cumulative amounts of deductible and taxable temporary differences to measure the deferred tax asset or liability. An exception is made for certain temporary differences arising from the initial recognition of an asset or a liability. No deferred tax asset or liability is recognised in relation to those timing differences if they arose in a transaction, other than a business combination, that at the time of the transaction did not affect either accounting profit or taxable profit or loss. In addition, no deferred tax is recognised in respect of goodwill. Deferred tax assets are recognised for deductible temporary differences and unused tax losses only if it is probable that future taxable amounts will be available to utilise those temporary differences and losses. The carrying value of deferred tax assets is reviewed at each balance date and reduced to the extent that it is no longer probable that sufficient taxable profit will be available to allow all or part of the deferred tax asset to be realised. Unrecognised deferred tax assets are reassessed at each balance date and are recognised to the extent that it has become probable that future taxable profit will allow the deferred tax asset to be recovered. Deferred tax liabilities and assets are not recognised for temporary differences between the carrying amount and tax bases of investments in controlled entities where the parent is able to control the timing of the reversal of the temporary differences and it is probable that the differences will not reverse in the foreseeable future. Deferred tax assets and liabilities are offset when there is a legally enforceable right to offset current tax assets and liabilities and when the deferred tax balances relate to the same taxation authority. Current tax assets and liabilities are offset where the entity has a legally enforceable right to offset and intends either to settle on a net basis, or to realise the asset and settle the liability simultaneously.
Deep Ye l l ow L im i t ed 45 2014 Annual R ep or t
For
per
sona
l use
onl
y

Current and deferred tax amounts attributable to amounts recognised directly in equity are also recognised directly in equity. Tax consolidation (i) Members of the tax consolidated group and the tax sharing arrangement Deep Yellow Limited and its 100% owned Australian resident subsidiaries formed a tax consolidated group with effect from 2 February 2007. Deep Yellow Limited is the head entity of the tax consolidated group. Members of the group have entered into a tax sharing agreement that provides for the allocation of income tax liabilities between the entities should the head entity default on its tax payment obligations. No amounts have been recognised in the financial statements in respect of this agreement on the basis that the possibility of default is remote. The amounts receivable or payable under the tax funding agreement are due upon receipt of the funding advice from the head entity, which is issued as soon as practicable after the end of each financial year. The head entity may also require payment of interim funding amounts to assist with its obligations to pay tax instalments. (ii) Tax effect accounting by members of the tax consolidated group Measurement method adopted under UIG 1052 Tax Consolidated Accounting The head entity and the controlled entities in the tax consolidated group continue to account for their own current and deferred tax amounts. The Group has applied the group allocation approach in determining the appropriate amount of current taxes and deferred taxes to allocate to members of the tax consolidated group. The current and deferred tax amounts are measured in a systematic manner that is consistent with the broad principles in AASB 112 Income Taxes. (f) Leases The determination of whether an arrangement is or contains a lease is based on the substance of the arrangement at inception date, whether fulfilment of the arrangement is dependent on the use of a specific asset or assets or the arrangement conveys a right to use the asset, even if that right is not explicitly specified in an arrangement. Leases are classified as operating leases where substantially all the risks and benefits remain with the lessor. Payments in relation to operating leases are recognised as expenses in the income statement on a straight line basis over the lease term. Lease incentives under operating leases are recognised in the statement of comprehensive income as an integral part of the total lease expense. (g) Borrowing costs Borrowing costs directly attributable to the acquisition, construction or production of an asset that necessarily takes a substantial period of time to get ready for its intended use or sale are capitalised as part of the cost of the asset. All other borrowing costs are expensed in the period they occur. Borrowing costs consist of interest and other costs that the Group incurs in connection with the borrowing of funds. (h) Impairment of non-financial assets The Group assesses at each reporting date whether there is an indication that an asset may be impaired. If any such indication exists, or when annual impairment testing for an asset is required, the Group makes an estimate of the asset’s recoverable amount. An asset’s recoverable amount is the higher of its fair value less costs to sell and its value in use and is determined for an individual asset, unless the asset does not generate cash inflows that are largely independent of those from other assets or groups of assets and the asset’s value in use cannot be estimated to be close to its fair value. In such cases the asset is tested for impairment as part of the cash-generating unit to which it belongs. When the carrying amount of an asset or cash-generating unit exceeds its recoverable amount, the asset or cash-generating unit is considered impaired and is written down to its recoverable amount. In assessing value in use, the estimated future cash flows are discounted to their present value using a pre-tax discount rate that reflects current market assessments of the time value of money and the risks specific to the asset. Impairment losses relating to continuing operations are recognised in the expense categories consistent with the function of the impaired asset unless the asset is carried at revalued amount (in which case the impairment loss is treated as a revaluation decrease). An assessment is also made at each reporting date as to whether there is any indication that previously recognised impairment losses may no longer exist or may have decreased. If such indication exists, the recoverable amount is estimated. A previously recognised impairment loss is reversed only if there has been a change in the estimates used to determine the asset’s recoverable amount since the last impairment loss was recognised. If that is the case the carrying amount of the asset is increased to its recoverable amount. That increased amount cannot exceed the carrying amount that would have been determined, net of depreciation, had no impairment loss been recognised for the asset in prior years. Such reversal is recognised in profit or loss unless the asset is carried at revalued amount, in which case the reversal is treated as a revaluation increase. After such a reversal the depreciation charge is adjusted in future periods to allocate the asset’s revised carrying amount, less any residual value, on a systematic basis over its remaining useful life. (i) Cash and cash equivalents For cash flow statement presentation purposes, cash and cash equivalents includes cash on hand, deposits held at call with financial institutions, other short term, highly liquid investments with original maturities of three months or less that are readily convertible to known amounts of cash and which are subject to an insignificant risk of changes in value, and bank overdrafts. (j) Fair value estimation The fair value of investments that are actively traded in organised financial markets is determined by reference to quoted market bid prices at the close of business on balance date. For investments with no active market, fair value is determined using a binomial option valuation methodology. (k) Property, plant and equipment Property, plant and equipment is stated at historical cost less accumulated depreciation and impairment losses. Historical cost includes expenditure that is directly attributable to the acquisition of the assets. Subsequent costs are included in the asset’s carrying amount or recognised as a separate asset, as appropriate, only when it is probable that future economic benefits associated with the item will flow to the Group and the cost of the item can be measured reliably. All other repairs and maintenance are charged to the income statement during the financial period in which they are incurred. Depreciation of property, plant and equipment is calculated using the written down value method or straight line method to allocate their cost, net of residual values, over their estimated useful lives, as follows:
Office equipment and fittings 12.5% – 33% of cost Site equipment 25% of cost Motor vehicles 25% of cost Leasehold property and buildings 5% of cost
Deep Ye l l ow L im i t ed 46 2014 Annual R ep or t
For
per
sona
l use
onl
y

The asset’s residual values and useful lives are reviewed, and adjusted if appropriate, at each balance date. An asset’s carrying amount is written down immediately to its recoverable amount if the asset’s carrying amount is greater than its estimated recoverable amount (note 1(h)). An item of property, plant and equipment is derecognised on disposal or when no further future economic benefits are expected from its use. Any gain or loss arising on derecognition of an asset (calculated as the difference between net disposal proceeds and the carrying amount of the asset) is included in profit and loss in the year the asset is derecognised. (l) Mineral exploration and evaluation expenditure Exploration and evaluation expenditure incurred is accumulated in respect of each identifiable Area of Interest. An Area of Interest is generally defined by the Group as a number of geographically proximate exploration permits which could form the basis of a project. These costs are only carried forward to the extent that the Group’s rights of tenure to that Area of Interest are current and that the costs are expected to be recouped through the successful development of the area or where activities in the area have not yet reached a stage that permits reasonable assessment of the existence of economically recoverable reserves. Accumulated costs in relation to an abandoned area of interest are written off in full in the Statement of Comprehensive Income in the year in which the decision to abandon the area is made. A regular review is undertaken of each Area of Interest to determine the appropriateness of continuing to carry forward costs in relation to that Area of Interest. (m) Restoration and rehabilitation policy Site restoration costs include the dismantling and removal of mining plant, equipment and building structures, waste removal, and rehabilitation of the site in accordance with clauses of the mining permits and environmental legislation. Site rehabilitation is required to decommission and rehabilitate exploration sites to a condition acceptable to the relevant authority. Costs are included in mineral exploration and evaluation expenditure as and when incurred. No provision is made for cost that might be incurred in the future. (n) Joint arrangements The Group has interests in joint arrangements that are joint operations. A joint operation is a type of joint arrangement whereby the parties have a contractual agreement to undertake an economic activity that is subject to joint control. A joint operation involves use of assets and other resources of the ventures rather than the establishment of a separate entity. The Company recognises its interest in the joint operations by recognising its interest in the assets and liabilities of the joint operation, including its share of any assets held any liabilities incurred jointly. The Group also recognises the expenses that it incurs and its share of the income that it earns from the sale of goods and services by the joint operations, including any expenses incurred and revenue received jointly. Details relating to the joint operations, are set out in note 27. (o) Trade and other payables Trade payables and other payables are carried at amortised costs and represent liabilities for goods and services provided to the Group prior to the end of the financial year that are unpaid and arise when the Group becomes obliged to make future payments in respect of the purchase of these goods and services. The amounts are unsecured and usually paid within 30 days of recognition. (p) Employee benefits Wages, salaries and annual leave Liabilities for wages and salaries, including non-monetary benefits, and annual leave due to be settled within 12 months of the reporting date are recognised in other payables in respect of employees’ services up to the reporting date and are measured at the amounts due to be paid when the liabilities are settled. Long service leave The liability for long service leave is recognised in the provision for employee benefits and measured as the present value of expected future payments to be made in respect of services provided by employees up to the reporting date using the projected unit credit method. Consideration is given to expected future salaries, experience of employee departures and periods of service. Expected future payments are discounted using market yields at the reporting date on national government bonds with terms to maturity and currency that match, as closely as possible, the estimated future cash outflows. Share based payments Share based compensation payments are made available to Executive Directors and employees of the Group, whereby Executive Directors and employees render services in exchange for rights over shares. The fair value of these equity settled transactions is recognised as an employee benefit expense with a corresponding increase in equity. The fair value is measured at grant date and recognised over the period during which the employees become unconditionally entitled to the award. At each subsequent reporting date until vesting, the cumulative charge to the statement of comprehensive income is the product of: i. the grant date fair value of the award; ii. the current best estimate of the number of options or rights that will vest, taking into account such factors as the likelihood of
employee turnover during the vesting period and the likelihood of non-market performance conditions being met; and iii. the expired portion of the vesting period.
The charge to the statement of comprehensive income for the period is the cumulative amount as calculated above less the amounts already charged in previous periods. There is a corresponding entry to equity. Share based compensation payments are granted by the parent company to employees of the Group. The expense recognised by the Group is the total expense associated with all such awards. The fair value at grant date is independently determined using a binomial option pricing model or the Monte-Carlo simulation model, as appropriate, that takes into account the exercise price, the term of the option or right, the impact of dilution, the share price at grant date and expected price volatility of the underlying share, the expected dividend yield, the risk free rate for the term of the option and the probability of market based vesting conditions being realised.
Deep Ye l l ow L im i t ed 47 2014 Annual R ep or t
For
per
sona
l use
onl
y

The fair value of the award granted is adjusted to reflect market vesting conditions. Non-market vesting conditions are included in assumptions about the number of awards that are expected to become exercisable. At each balance date, the entity revises its estimate of the number of awards that are expected to become exercisable. The employee benefit expense recognised each period, takes into account the most recent estimate. Upon the exercise of awards, the balance of the share based payments reserve relating to those awards is transferred to share capital and the proceeds received, net of any directly attributable transaction costs, are credited to share capital. No expense is recognised for awards that do not ultimately vest, except for awards where vesting is only conditional upon a market condition. If the terms of an equity-settled award are modified, as a minimum an expense is recognised as if the terms had not been modified. In addition, an expense is recognised for any modification that increases the total fair value of the share-based payment arrangement, or is otherwise beneficial to the employee, as measured at the date of modification. If an equity-settled award is cancelled, it is treated as if it had vested on the date of cancellation, and any expense not yet recognised for the award is recognised immediately. However, if a new award is substituted for the cancelled award and designated as a replacement award on the date that is granted, the cancelled and new award are treated as if they were a modification of the original award, as described in the previous paragraph. The dilutive effect, if any, of outstanding options is reflected as additional share dilution in the computation of diluted earnings per share. (q) Issued equity Ordinary shares are classified as equity. Incremental costs directly attributable to the issue of new shares or options are shown in equity as a deduction, net of tax, from the proceeds. (r) Earnings per share (i) Basic earnings per share Basic earnings per share is calculated by dividing the net profit attributable to equity holders of the Company, excluding any costs of servicing equity other than dividends, by the weighted average number of ordinary shares outstanding during the financial year, adjusted for bonus elements in ordinary shares issued during the year. (ii) Diluted earnings per share Diluted earnings per share is calculated as net profit attributable to equity holders of the Company, adjusted for:
∗ Costs of servicing equity (other than dividends) and preference share dividends; ∗ The after tax effect of dividends and interest associated with dilutive potential ordinary shares that have been recognised as
expenses; and ∗ Other non-discretionary changes in revenues or expenses during the period that would result from the dilution of potential ordinary
shares, divided by the weighted average number of ordinary shares and dilutive potential ordinary shares, adjusted for any bonus element.
(s) Goods and service tax (GST) Revenues, expenses and assets are recognised net of the amount of associated GST, unless the GST incurred is not recoverable from the taxation authority. In this case it is recognised as part of the cost of acquisition of the asset or as a part of the expense. Receivables and payables are stated inclusive of the amount of GST receivable or payable. The net amount of GST recoverable from, or payable to, the taxation authority is included with other receivables or payables in the statement of financial position. Cash flows are presented on a gross basis. The GST components of cash flows arising from investing or financing activities which are recoverable from, or payable to, the taxation authority, are presented as operating cash flows. Commitments and contingencies are disclosed net of the amount of GST recoverable from, or payable to, the taxation authority. (t) Trade and other receivables Trade and other receivables are recognised and carried at original invoice amount less any allowance for any uncollectible amounts, and generally have 30 day terms. An allowance for a doubtful debt is made when there is objective evidence that the Group will not be able to collect the debt. Bad debts are written off when identified. (u) Investments and other financial assets Financial assets in the scope of AASB139 Financial Instruments: Recognition and Measurement are classified as either financial assets at fair value through profit or loss, loans and receivables, held-to-maturity investments, or available-for-sale investments, as appropriate. When financial assets are recognised initially, they are measured at fair value, plus in the case of investments not at fair value through profit or loss, directly attributable transaction costs. The Group determines the classification of its financial assets at initial recognition. All regular way purchases and sales of financial assets are recognised on the trade date, i.e. the date that the Group commits to purchase the asset. Regular way purchases or sales are purchases or sales of financial assets under contracts that require delivery of the assets within the period established generally by regulation or convention in the marketplace. (i) Financial assets at fair value through profit or loss Financial assets classified as held for trading are included in the category ‘financial assets at fair value through profit or loss’. Financial assets are classified as held for trading if they are acquired for the purpose of selling in the near term. Derivatives are also classified as held for trading. Gains or losses on investments held for trading are recognised in profit or loss. (ii) Held-to-maturity investments Non-derivative financial assets with fixed or determinable payments and fixed maturity are classified as held-to-maturity when the Group has the positive intention and ability to hold to maturity. After initial measurement, held to maturity investments are measured at amortised cost using the EIR, less impairment. Amortised cost is calculated by takin into account any discount or premium on acquisition and fees or costs that are an integral part of the EIR. The EIR amortisation is included as finance income in the statement of profit or loss. The losses arising from impairment are recognised in the statement of profit or loss as finance costs. The Group did not have any held-to-maturity investments during the years ended 30 June 2014 and 2013. (iii) Loans and receivables Loans and receivables are non-derivative financial assets with fixed or determinable payments that are not quoted in an active market. Such assets are carried at amortised cost using the effective interest method. Gains and losses are recognised in profit or loss when the loans and receivables are derecognised or impaired, as well as through the amortisation process.
Deep Ye l l ow L im i t ed 48 2014 Annual R ep or t
For
per
sona
l use
onl
y

(iv) Available-for-sale investments Available-for-sale investments are those non-derivative financial assets that are designated as available-for-sale or are not classified as any of the three preceding categories. After initial recognition available-for-sale investments are measured at fair value with gains or losses being recognised as a separate component of equity until the investment is derecognised or until the investment is determined to be impaired, at which time the cumulative gain or loss previously reported in equity is recognised in profit or loss. (v) Financial liabilities All financial liabilities are recognised initially at fair value plus, in the case of loans and borrowings, directly attributable transaction costs. The Group’s financial liabilities include trade and other payables, bank overdrafts, loans and borrowings, financial guarantee contracts, and derivative financial instruments. The subsequent measurement of financial liabilities depends on their classification, described as follows: (i) Loans and borrowings After initial recognition, interest bearing loans and borrowings are subsequently measured at amortised cost using the EIR method. Gains and losses are recognised in the income statement when the liabilities are derecognised as well as through the EIR amortisation process. Amortised cost is calculated by taking into account any discount or premium on acquisition and fees or costs that are an integral part of the EIR. The EIR amortisation is included in finance costs in the statement of comprehensive income. Financial liabilities are offset and the net amount reported in the consolidated statement of financial position if, and only if:
∗ There is a currently enforceable legal right to offset the recognised amounts ∗ There is an intention to settle on a net basis, or to realise the assets and settle the liabilities simultaneously
(a) Derecognition A financial liability is derecognised when the obligation under the liability is discharged or cancelled or expires. When an existing financial liability is replaced by another from the same lender on substantially different terms, or the terms of an existing liability are substantially modified, such an exchange or modification is treated as the derecognition of the original liability and the recognition of a new liability. The difference in the respective carrying amounts is recognised in the statement of comprehensive income. (w) Foreign currency translation The functional currencies of Deep Yellow Limited and its overseas controlled entities are Australian dollars, Namibian dollars and US dollars. These consolidated financial statements are presented in Australian dollars being the functional currency of the Parent entity. Transactions in foreign currencies are initially recorded in the functional currency by applying the exchange rates ruling at the date of the transaction. Monetary assets and liabilities denominated in foreign currencies are retranslated at the rate of exchange prevailing at balance date. Non-monetary items that are measured in terms of historical cost in a foreign currency are translated using the exchange rate as at the date of the initial transaction. Exchange differences arising from these procedures are recognised in profit and loss for the year. On consolidation, the assets and liabilities of foreign operations are translated into Australian dollars at the rate prevailing at the reporting date and their statements of profit or loss are translated at the average exchange rate for the year.. The exchange differences arising on translation for consolidation purposes are recognised in other comprehensive income. On disposal of a foreign operation, the component of other comprehensive income relating to that particular foreign operation is recognised in profit or loss. (x) Provisions Provisions are recognised when the Group has a legal or constructive obligation, as a result of past events, for which it is probable that an outflow of economic benefits will be required to settle the obligation and that a reliable estimate can be made of the amount of the obligation. If the effect of the time value of money is material, provisions are discounted using a current pre-tax rate that reflects the risks specific to the liability. When discounting is used, the increase in the provision due to the passage of time is recognised as an interest expense. (y) Impairment of financial assets (Available-for-sale investments If there is objective evidence that an available-for-sale investment is impaired, an amount comprising the difference between its cost (net of any principal repayment and amortisation) and its current fair-value, less any impairment loss previously recognised in profit or loss, is transferred from equity to the income statement. The prolonged or significant decline in the market value of the investments is taken as an impairment indicator. Reversals of impairment losses for equity instruments classified as available-for-sale are not recognised in profit. Reversals of impairment losses for debt instruments are reversed through profit or loss if the increase in an instrument’s fair value can be objectively related to an event occurring after the impairment loss was recognised in profit or loss. (z) Business combinations Business combinations are accounted for using the acquisition method. The consideration transferred in a business combination shall be measured at fair value, which shall be calculated as the sum of the acquisition date fair values of the assets transferred by the acquirer, the liabilities incurred by the acquirer to former owners of the acquiree and the equity issued by the acquirer, and the amount of any non-controlling interest in the acquiree. For each business combination, the acquirer measures the non-controlling interest in the acquiree either at fair value or at the proportionate share of the acquiree’s identifiable net assets. Acquisition-related costs are expensed as incurred. When the Group acquires a business, it assesses the financial assets and liabilities assumed for appropriate classification and designation in accordance with the contractual terms, economic conditions, the Group’s operating or accounting policies and other pertinent conditions as at the acquisition date. This includes the separation of embedded derivatives in host contracts by the acquiree. If the business combination is achieved in stages, the acquisition date fair value of the acquirer's previously held equity interest in the acquiree is remeasured at fair value as at the acquisition date through profit or loss. Any contingent consideration to be transferred by the acquirer will be recognised at fair value at the acquisition date. Subsequent changes to the fair value of the contingent consideration which is deemed to be an asset or liability will be recognised in accordance with AASB 139 either in profit or loss or in other comprehensive income. If the contingent consideration is classified as equity, it shall not be remeasured.
Deep Ye l l ow L im i t ed 49 2014 Annual R ep or t
For
per
sona
l use
onl
y

Note 3 Critical accounting estimates and judgements Estimates and judgements are continually evaluated and are based on historical experience and other factors, including expectations of future events that may have a financial impact on the Group and that are believed to be reasonable under the circumstances. Accounting for capitalised mineral exploration and evaluation expenditure The Group’s accounting policy is stated at note 1(l). A regular review is undertaken of each Area of Interest to determine the reasonableness of the continuing carrying forward of costs in relation to that Area of Interest. Share based payments The Group’s accounting policy is stated at note 1(p). The Group uses independent advisors to assist in valuing share based payments. Refer note 15 for details of estimates and assumptions used. Note 4 Operating segments The Group has identified its operating segments based on internal reports that are used by the executive management team in assessing performance and in determining the allocation of resources. The operating segments are identified based on country of operation as this is the area that has the most effect on allocation of resources. The Group conducts uranium exploration and pre-development activities in Australia and Namibia. The following items and associated assets and liabilities are not allocated to operating segments as the underlying instruments are managed on a Group basis and are not considered as part of the core operations of both segments:
∗ Interest Income ∗ Foreign currency gains and losses ∗ Fair value gains/losses on available-for-sale assets ∗ Fair value gains/losses on held for trading assets ∗ Settlement expenses ∗ Liabilities are not allocated to the segments as they are not monitored by the executive management team on a segment by
segment basis Australia
$ Namibia
$ Total
$
Year Ended 30 June 2014 Revenue - - - Unallocated
Interest income 78,435 Total revenue 78,435
Profit and Loss Pre-tax segment loss (2,045,670) (17,543,133) (19,588,803) Unallocated
Interest income 78,435 Gain on derecognition of available-for-sale-financial asset
75,923
Impairment on available-for-sale financial assets
(6,008)
Income tax expense (1,227) Loss from continuing operations after income tax (19,441,680)
Year Ended 30 June 2014 Segment Assets Segment operating assets 117,013 70,620,796 70,737,809 Unallocated assets
Cash 1,235,654 Receivables 88,510
Total assets 72,061,973 Australia
$ Namibia
$ Total
$ Year Ended 30 June 2013 Revenue - - - Unallocated
Interest income 199,789 Total revenue 199,789
Profit and Loss Pre-tax segment loss (8,506,694) (336,972) (8,843,666) Unallocated
Interest income 199,789 Gain on sale of investment 80,000 Fair value loss on held-for-trading assets (42,000) Impairment on available-for-sale financial assets
(61,900)
Income tax benefit - Loss after income tax (8,667,777)
Deep Ye l l ow L im i t ed 50 2014 Annual R ep or t
For
per
sona
l use
onl
y
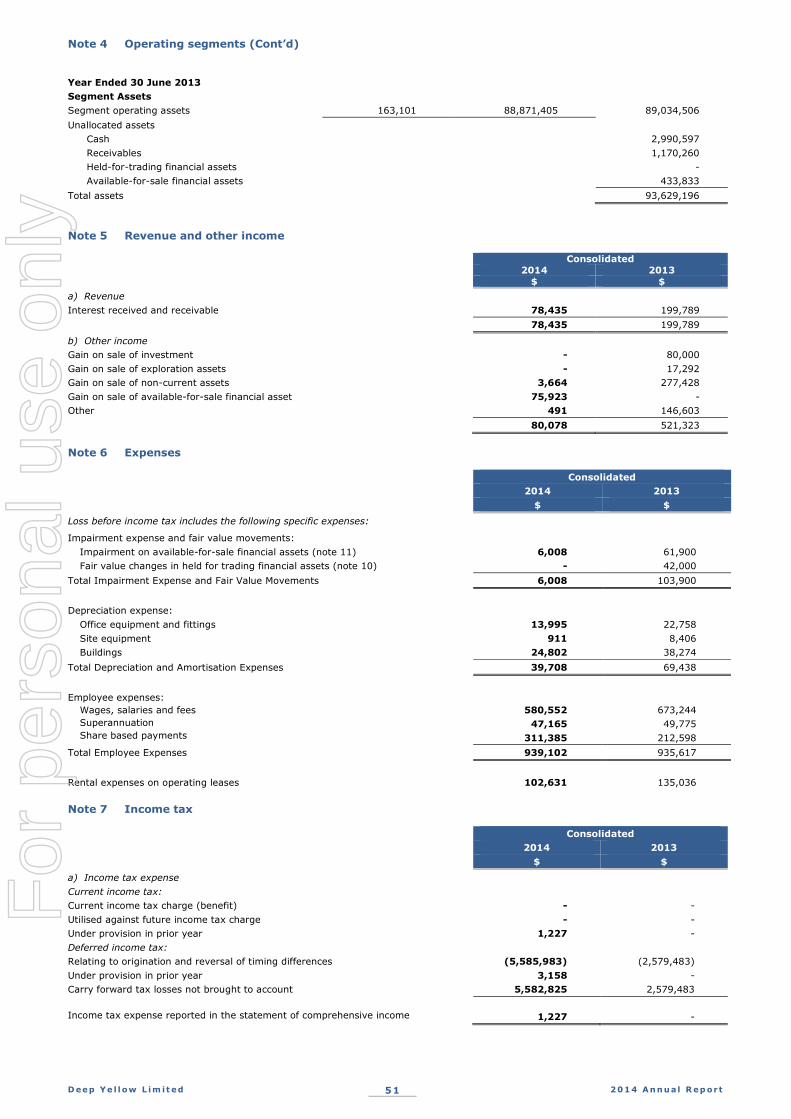
Note 4 Operating segments (Cont’d)
Year Ended 30 June 2013Segment AssetsSegment operating assets 163,101 88,871,405 89,034,506Unallocated assets
Cash 2,990,597Receivables 1,170,260Held-for-trading financial assets -Available-for-sale financial assets 433,833
Total assets 93,629,196
Note 5 Revenue and other income
Consolidated2014 2013
$ $a) RevenueInterest received and receivable 78,435 199,789
78,435 199,789
b) Other incomeGain on sale of investment - 80,000Gain on sale of exploration assets - 17,292Gain on sale of non-current assets 3,664 277,428Gain on sale of available-for-sale financial asset 75,923 -Other 491 146,603
80,078 521,323
Note 6 Expenses
Consolidated2014 2013
$ $
Loss before income tax includes the following specific expenses:
Impairment expense and fair value movements:Impairment on available-for-sale financial assets (note 11) 6,008 61,900Fair value changes in held for trading financial assets (note 10) - 42,000
Total Impairment Expense and Fair Value Movements 6,008 103,900
Depreciation expense:Office equipment and fittings 13,995 22,758Site equipment 911 8,406Buildings 24,802 38,274
Total Depreciation and Amortisation Expenses 39,708 69,438
Employee expenses:Wages, salaries and feesSuperannuationShare based payments
580,552 673,24447,165 49,775
311,385 212,598Total Employee Expenses 939,102 935,617
Rental expenses on operating leases 102,631 135,036
Note 7 Income tax
Consolidated2014 2013
$ $
a) Income tax expenseCurrent income tax:Current income tax charge (benefit) - -Utilised against future income tax charge - -Under provision in prior year 1,227 -Deferred income tax:Relating to origination and reversal of timing differences (5,585,983) (2,579,483)Under provision in prior year 3,158 -Carry forward tax losses not brought to account 5,582,825 2,579,483
Income tax expense reported in the statement of comprehensive income 1,227 -
Deep Ye l l ow L im i t ed 51 2014 Annual R ep or t
For
per
sona
l use
onl
y

Note 7 Income tax (Cont’d)
b) Reconciliation of income tax expense to prima facie tax payableLoss before income tax expense (19,440,453) (8,667,777)
Tax at the Australian rate of 30% (2013– 30%) (5,832,136) (2,600,333)Effect of tax rates in foreign jurisdictions* - 69,898Tax effect:Non-deductible share based payment 210,937 118,002Other expenditure not deductible 10,637 6,541Tax expense on fair value of available-for-sale financial asset 24,579 -Tax expense on fair value of trading financial assets - 31,170Under provision in prior year 4,385 -Rights issue costs - (204,760)Carry forward tax losses not brought to account 5,582,825 2,579,482
Tax expense 1,227 -
c) Deferred tax – Statement of financial positionLiabilities
Prepayments 731 1,946Accrued Income 609 4,076Capitalised exploration and evaluation expenditure - -
1,340 6,022
AssetsRevenue losses available to offset against future taxable income 11,629,982 11,112,537Income recognised in advance for tax 75,000 75,000Accrued expenses 45,113 67,558Deductible equity raising costs 134,614 182,553Capitalised exploration and evaluation expenditure 5,131,081 -Deferred tax assets not brought to account (17,014,450) (11,431,626)
1,340 6,022Net deferred tax asset / (liability) - -
d) Deferred tax – Statement of Comprehensive IncomeLiabilities
Prepayments 1,215 791Accrued Income 3,467 4,069Capitalised exploration expenses - (1,835,413)
AssetsDecrease in tax losses carried forward 517,445 1,945,679Accruals (22,445) 42,301Deductible equity raising costs (47,939) (157,427)Capitalised exploration expenses 5,131,081 -Carry forward tax losses not brought to account (5,582,824) -
Deferred tax expense / (benefit) - -
e) Unrecognised temporary differencesAt 30 June 2014, there are temporary differences to the value of $5,131,081 in relation to capitalised exploration and evaluation expenditure associated with the Group’s investment in subsidiaries. It represents a deferred tax asset which would be realised once the subsidiary is in a tax paying position. (2013: Nil).
Note 8 Current assets - Cash and cash equivalents
Consolidated2014 2013
$ $
Cash at bank and in hand 1,235,654 2,990,5971,235,654 2,990,597
The carrying amounts of cash and cash equivalents represent fair value. See note 17 for the Group’s fair value disclosures. Cash at bank and in hand and deposits at call earn interest at fixed and floating rates based on variable bank deposit rates.
Deep Ye l l ow L im i t ed 52 2014 Annual R ep or t
For
per
sona
l use
onl
y

Note 9 Current assets – Trade, other receivables and other assets Consolidated 2014 2013 $ $
a) Receivables GST recoverable 76,245 141,617 Other receivables 12,265 28,642 88,510 170,259
b) Other assets Environmental, tenement and vehicle bonds 47,751 50,419 Prepayments 82,143 124,020 129,894 174,439 GST recoverable relates to Australia and Namibia. Interest is not normally charged and collateral is not normally obtained. Note 10 Non-current assets – Available-for-sale investments Consolidated 2014 2013 $ $
Available-for-sale investments at market value: Toro Energy Limited - 226,933 Rum Jungle Uranium Limited - 62,500 Krucible Metals Limited - 68,400 Rox Resources Limited - 76,000
- 433,833 The above investments are stated at the closing market price at balance date. A reconciliation of movements in available-for-sale investments, is as follows: Consolidated 2014 2013 $ $
Value of investments at the start of the reporting period 433,833 358,533 Investments acquired during the reporting period
Krucible Metals Limited - 82,800 Investments disposed during the reporting period (427,825) - Net impairment expense recognised during the reporting period (Note 6) (6,008) (61,900) Fair value gain for the year - 54,400 - 433,833 Note 11 Non-current assets – Capitalised mineral exploration and evaluation expenditure Consolidated 2014 2013 $ $
In the exploration and evaluation phase Cost brought forward 87,934,508 91,169,926 Exploration expenditure incurred during the year at cost 2,553,342 6,343,991 Exchange adjustment (3,393,654) (3,065,624) Exploration expenditure on tenements disposed of during the year - (65,508) Exploration expenditure written off (17,263,495) (6,448,277) Cost carried forward 69,830,701 87,934,508 The Group has restricted its Exploration expenditure in Australia and had the majority of its tenements lapse. It has not budgeted or planned significant expenditure for the future given its intention to divest its remaining Australian assets. Exploration expenditure written off relates to assets for which the expenditure are not expected to be recouped through successful development and exploitation of the area of interest, or alternatively, by its sale. A summary of capitalised mineral exploration and evaluation expenditure by country of operation is as follows: Consolidated 2014 2013 $ $
Australia - - Namibia 69,830,701 87,934,508 Cost carried forward 69,830,701 87,934,508
Deep Ye l l ow L im i t ed 53 2014 Annual R ep or t
For
per
sona
l use
onl
y

Note 12 Non-current assets – Property, plant and equipment Consolidated 2014 2013 $ $ Buildings At cost 734,417 799,784 Accumulated depreciation (174,885) (163,855) 559,532 635,929 Office equipment and fittings At cost 191,173 385,850 Accumulated depreciation (169,809) (357,622) 21,364 28,228 Motor vehicles At cost 455,710 561,041 Accumulated depreciation (425,277) (490,962) 30,433 70,079 Site equipment At cost 694,458 735,748 Accumulated depreciation (528,573) (544,424) 165,885 191,324 777,214 925,560 Reconciliation Buildings Net book value at start of the year 635,929 1,024,896 Exchange adjustment (51,595) (57,494) Additions - - Disposals - (293,199) Depreciation (24,802) (38,274) Net book value at end of the year 559,532 635,929 Office equipment and fittings Net book value at start of the year 28,228 48,659 Exchange adjustment (1,371) (1,605) Additions 11,489 7,254 Disposals (2,987) (3,322) Depreciation (13,995) (22,758) Net book value at end of the year 21,364 28,228 Motor vehicles Net book value at start of the year 70,079 100,679 Exchange adjustment (5,550) (8,564) Additions - - Disposals (22,508) (3,266) Depreciation (11,588) (18,770) Net book value at end of the year 30,433 70,079 Site equipment Net book value at start of the year 191,324 224,669 Exchange adjustment (15,373) (16,215) Additions - 21,479 Disposals (226) (17,542) Depreciation (9,840) (21,067) Net book value at end of the year 165,885 191,324 No items of property, plant and equipment have been pledged as security by the Group. Note 13 Current liabilities – Trade and other payables Consolidated 2014 2013 $ $
Trade payables and accruals 118,730 271,728 Other payables 48,092 62,028 Employee leave liabilities 119,716 213,397 286,538 547,153 Trade payables and accruals are non-interest bearing and normally settled on 30 day terms. Details of the Group’s exposure to interest rate risk and fair value in respect of its liabilities are set out in note 17. There are no secured liabilities as at 30 June 2014.
Deep Ye l l ow L im i t ed 54 2014 Annual R ep or t
For
per
sona
l use
onl
y
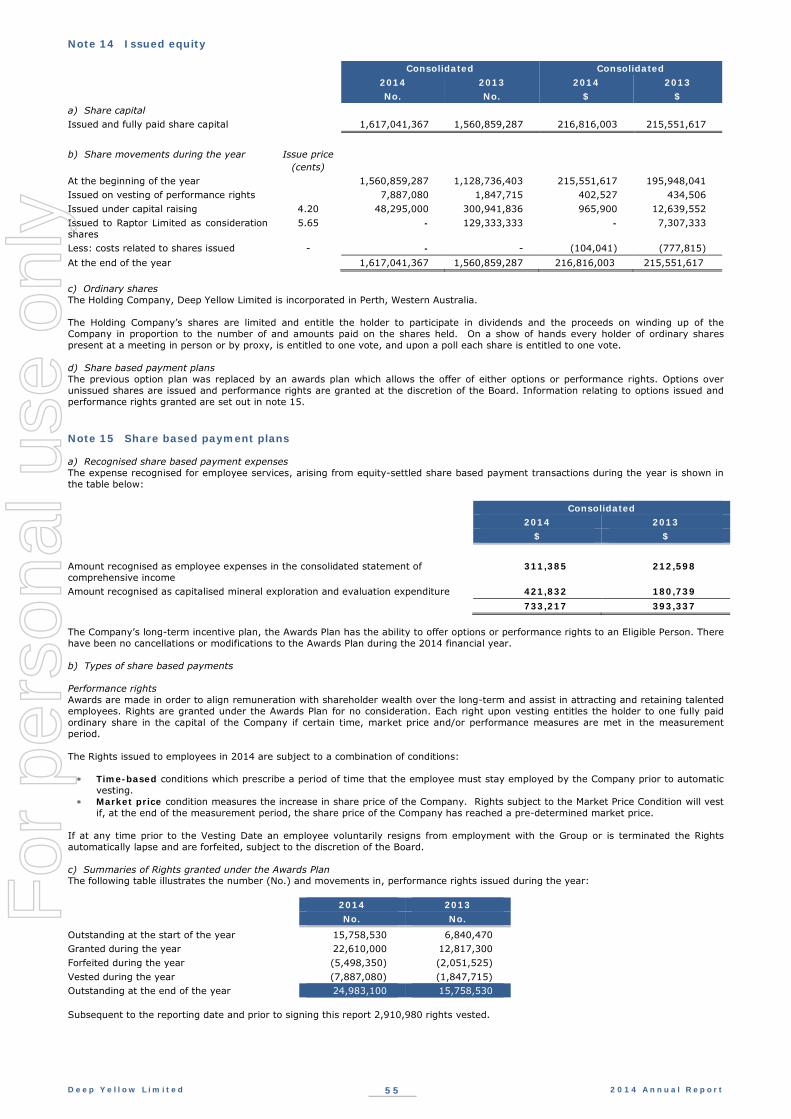
Note 14 Issued equity Consolidated Consolidated 2014 2013 2014 2013 No. No. $ $ a) Share capital Issued and fully paid share capital 1,617,041,367 1,560,859,287 216,816,003 215,551,617
b) Share movements during the year Issue price
(cents)
At the beginning of the year 1,560,859,287 1,128,736,403 215,551,617 195,948,041 Issued on vesting of performance rights 7,887,080 1,847,715 402,527 434,506 Issued under capital raising 4.20 48,295,000 300,941,836 965,900 12,639,552 Issued to Raptor Limited as consideration shares
5.65 - 129,333,333 - 7,307,333
Less: costs related to shares issued - - - (104,041) (777,815) At the end of the year 1,617,041,367 1,560,859,287 216,816,003 215,551,617 c) Ordinary shares The Holding Company, Deep Yellow Limited is incorporated in Perth, Western Australia. The Holding Company’s shares are limited and entitle the holder to participate in dividends and the proceeds on winding up of the Company in proportion to the number of and amounts paid on the shares held. On a show of hands every holder of ordinary shares present at a meeting in person or by proxy, is entitled to one vote, and upon a poll each share is entitled to one vote. d) Share based payment plans The previous option plan was replaced by an awards plan which allows the offer of either options or performance rights. Options over unissued shares are issued and performance rights are granted at the discretion of the Board. Information relating to options issued and performance rights granted are set out in note 15. Note 15 Share based payment plans a) Recognised share based payment expenses The expense recognised for employee services, arising from equity-settled share based payment transactions during the year is shown in the table below:
Consolidated 2014 2013 $ $
Amount recognised as employee expenses in the consolidated statement of comprehensive income
311,385 212,598
Amount recognised as capitalised mineral exploration and evaluation expenditure 421,832 180,739 733,217 393,337
The Company’s long-term incentive plan, the Awards Plan has the ability to offer options or performance rights to an Eligible Person. There have been no cancellations or modifications to the Awards Plan during the 2014 financial year.
b) Types of share based payments Performance rights Awards are made in order to align remuneration with shareholder wealth over the long-term and assist in attracting and retaining talented employees. Rights are granted under the Awards Plan for no consideration. Each right upon vesting entitles the holder to one fully paid ordinary share in the capital of the Company if certain time, market price and/or performance measures are met in the measurement period. The Rights issued to employees in 2014 are subject to a combination of conditions:
∗ Time-based conditions which prescribe a period of time that the employee must stay employed by the Company prior to automatic vesting.
∗ Market price condition measures the increase in share price of the Company. Rights subject to the Market Price Condition will vest if, at the end of the measurement period, the share price of the Company has reached a pre-determined market price.
If at any time prior to the Vesting Date an employee voluntarily resigns from employment with the Group or is terminated the Rights automatically lapse and are forfeited, subject to the discretion of the Board. c) Summaries of Rights granted under the Awards Plan The following table illustrates the number (No.) and movements in, performance rights issued during the year:
2014 2013 No. No.
Outstanding at the start of the year 15,758,530 6,840,470 Granted during the year 22,610,000 12,817,300 Forfeited during the year (5,498,350) (2,051,525) Vested during the year (7,887,080) (1,847,715) Outstanding at the end of the year 24,983,100 15,758,530
Subsequent to the reporting date and prior to signing this report 2,910,980 rights vested.
Deep Ye l l ow L im i t ed 55 2014 Annual R ep or t
For
per
sona
l use
onl
y

Note 15 Share based payment plans (Cont’d) i) Outstanding rights balance at 30 June 2014
Number Date rights granted Vesting date Vesting Condition
275,940 9-Dec-11 1-Jul-14 Time based 768,040 3-Oct-12 1-Jul-14 Time based
1,152,060 3-Oct-12 1-Jul-15 Time based 1,152,060 3-Oct-12 1-Jul-15 Market price
250,000 6-Dec-12 1-Dec-14 Time based 1,200,000 6-Dec-12 1-Dec-14 Market price
500,000 6-Dec-12 1-Dec-14 Performance 500,000 6-Dec-12 1-Dec-15 Time based
1,750,000 6-Dec-12 1-Dec-15 Market price 500,000 6-Dec-12 1-Dec-15 Performance 500,000 8-Jul-13 1-Feb-15 Time based 750,000 8-Jul-13 1-Feb-16 Time based 750,000 8-Jul-13 1-Feb-16 Market price
1,867,000 29-Oct-13 1-Jul-14 Time based 1,517,000 29-Oct-13 1-Jul-15 Time based 2,275,500 29-Oct-13 1-Jul-16 Time based 2,275,500 29-Oct-13 1-Jul-16 Market price
500,000 29-Oct-13 1-Dec-14 Time based 1,000,000 29-Oct-13 1-Dec-14 Market price
750,000 29-Oct-13 1-Dec-15 Time based 1,750,000 29-Oct-13 1-Dec-15 Market price 1,000,000 29-Oct-13 1-Dec-16 Time based 2,000,000 29-Oct-13 1-Dec-16 Market price
24,983,100 j) Outstanding rights balance at 30 June 2013
Number Date rights granted Vesting date Vesting Condition
275,310 3-Feb-11 1-Aug-13 Market price 300,000 25-Feb-11 30-Jun-13 Time based
1,200,000 25-Feb-11 30-Jun-13 Market price 291,480 9-Dec-11 1-Jul-13 Time based 437,220 9-Dec-11 1-Jul-14 Time based 437,220 9-Dec-11 1-Jul-14 Market price
1,463,460 3-Oct-12 1-Jul-13 Time based 1,463,460 3-Oct-12 1-Jul-14 Time based 2,195,190 3-Oct-12 1-Jul-15 Time based 2,195,190 3-Oct-12 1-Jul-15 Market price
250,000 6-Dec-12 1-Dec-13 Time based 550,000 6-Dec-12 1-Dec-13 Market price 250,000 6-Dec-12 1-Dec-14 Time based
1,200,000 6-Dec-12 1-Dec-14 Market price 500,000 6-Dec-12 1-Dec-14 Performance 500,000 6-Dec-12 1-Dec-15 Time based
1,750,000 6-Dec-12 1-Dec-15 Market price 500,000 6-Dec-12 1-Dec-15 Performance
15,758,530
k) Weighted average remaining contractual life The weighted average remaining contractual life for the rights outstanding as at 30 June 2014 is 14.51 months (2013: 27.1 months).
l) Weighted average fair value Weighted average fair value of rights granted during the year was 2.33 cents (2013: 3.57 cents). m) Rights pricing model The fair value of the rights granted under the plan is estimated as at the grant date. The following table lists the inputs to the model used for the years ended 30 June 2014 and 30 June 2013 Grants 29 October 2013 8 July 2013 6 December 2012 3 October 2012
Rights pricing model Monte-Carlo simulation using
hybrid pricing model
Monte-Carlo simulation using
hybrid pricing model
Monte-Carlo simulation using
hybrid pricing model
Monte-Carlo simulation using hybrid pricing
model Dividend yield (%) Zero Zero Zero Zero Expected volatility (%) 85 85 85 85 Risk-free interest rate (%) 3.29 3.24 2.73 2.46 Expected life of rights (years) 7 7 7 7 Closing share price at grant date (cents) 2.0 4.3 5.2 4.4 Fair value per right at grant date (cents)
∗ Time based vesting conditions 2.0 4.3 5.2 4.4 ∗ Time and market price vesting conditions 0.3-0.8 2.1-2.6 1.1-2.3 2.8 ∗ Time and performance vesting conditions - - 5.2 -
Deep Ye l l ow L im i t ed 56 2014 Annual R ep or t
For
per
sona
l use
onl
y
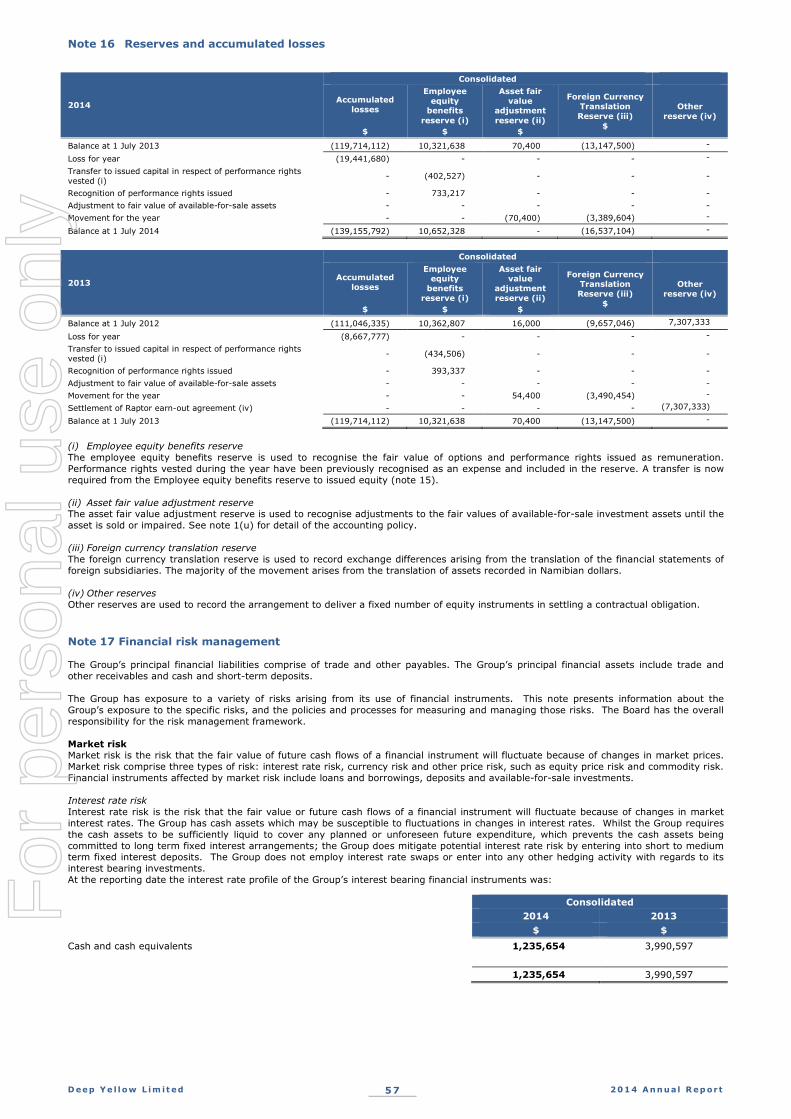
Note 16 Reserves and accumulated losses
2014
Consolidated
Accumulated losses
$
Employee equity
benefits reserve (i)
$
Asset fair value
adjustment reserve (ii)
$
Foreign Currency Translation Reserve (iii)
$
Other reserve (iv)
Balance at 1 July 2013 (119,714,112) 10,321,638 70,400 (13,147,500) -
Loss for year (19,441,680) - - - -
Transfer to issued capital in respect of performance rights vested (i) - (402,527) - - -
Recognition of performance rights issued - 733,217 - - -Adjustment to fair value of available-for-sale assets - - - - -Movement for the year - - (70,400) (3,389,604) -
Balance at 1 July 2014 (139,155,792) 10,652,328 - (16,537,104) -
2013
Consolidated
Accumulated losses
$
Employee equity
benefits reserve (i)
$
Asset fair value
adjustment reserve (ii)
$
Foreign Currency Translation Reserve (iii)
$
Other reserve (iv)
Balance at 1 July 2012 (111,046,335) 10,362,807 16,000 (9,657,046) 7,307,333
Loss for year (8,667,777) - - - -
Transfer to issued capital in respect of performance rights vested (i) - (434,506) - - -
Recognition of performance rights issued - 393,337 - - -Adjustment to fair value of available-for-sale assets - - - - -Movement for the year - - 54,400 (3,490,454) -
Settlement of Raptor earn-out agreement (iv) - - - - (7,307,333)
Balance at 1 July 2013 (119,714,112) 10,321,638 70,400 (13,147,500) -
(i) Employee equity benefits reserve The employee equity benefits reserve is used to recognise the fair value of options and performance rights issued as remuneration. Performance rights vested during the year have been previously recognised as an expense and included in the reserve. A transfer is now required from the Employee equity benefits reserve to issued equity (note 15).
(ii) Asset fair value adjustment reserveThe asset fair value adjustment reserve is used to recognise adjustments to the fair values of available-for-sale investment assets until the asset is sold or impaired. See note 1(u) for detail of the accounting policy.
(iii) Foreign currency translation reserveThe foreign currency translation reserve is used to record exchange differences arising from the translation of the financial statements of foreign subsidiaries. The majority of the movement arises from the translation of assets recorded in Namibian dollars.
(iv) Other reservesOther reserves are used to record the arrangement to deliver a fixed number of equity instruments in settling a contractual obligation.
Note 17 Financial risk management
The Group’s principal financial liabilities comprise of trade and other payables. The Group’s principal financial assets include trade and other receivables and cash and short-term deposits.
The Group has exposure to a variety of risks arising from its use of financial instruments. This note presents information about the Group’s exposure to the specific risks, and the policies and processes for measuring and managing those risks. The Board has the overall responsibility for the risk management framework.
Market riskMarket risk is the risk that the fair value of future cash flows of a financial instrument will fluctuate because of changes in market prices. Market risk comprise three types of risk: interest rate risk, currency risk and other price risk, such as equity price risk and commodity risk. Financial instruments affected by market risk include loans and borrowings, deposits and available-for-sale investments.
Interest rate riskInterest rate risk is the risk that the fair value or future cash flows of a financial instrument will fluctuate because of changes in market interest rates. The Group has cash assets which may be susceptible to fluctuations in changes in interest rates. Whilst the Group requires the cash assets to be sufficiently liquid to cover any planned or unforeseen future expenditure, which prevents the cash assets being committed to long term fixed interest arrangements; the Group does mitigate potential interest rate risk by entering into short to medium term fixed interest deposits. The Group does not employ interest rate swaps or enter into any other hedging activity with regards to its interest bearing investments.At the reporting date the interest rate profile of the Group’s interest bearing financial instruments was:
Consolidated2014 2013
$ $
Cash and cash equivalents 1,235,654 3,990,597
1,235,654 3,990,597
Deep Ye l l ow L im i t ed 57 2014 Annual R ep or t
For
per
sona
l use
onl
y

Note 17 Financial risk management (Cont’d) Interest rate sensitivity A change of 1% in interest rates at the reporting date as per management’s best estimate would have increased/(decreased) other comprehensive income and profit and loss by the amounts shown below. This analysis assumes all other variables remain constant. The same sensitivity analysis has been performed for the comparative reporting date. Profit and Loss Other Comprehensive Income 1% 1% 1% 1% Increase Decrease increase Decrease
30 June 2014 Cash and cash equivalents
12,356
(12,356)
-
-
30 June 2013 Cash and cash equivalents 39,906 (39,906) - - Foreign currency risk Foreign currency risk is the risk that the fair value or future cash flows of a financial instrument will fluctuate because of changes in foreign exchange rates. Financial assets in overseas Group companies are not generally material in the context of financial instruments entered into by the Group as a whole, as they generally relate to funds advanced to fund short term exploration and administration activities of the overseas operations. Once the funds are expended they are no longer classified as financial assets. Advancing of funds to overseas operations on a needs basis, is an effective method for the management of currency risk. The Group’s investments in overseas subsidiary companies are not hedged as they are considered to be long term in nature. As a result of significant investment in Namibia, the Group’s statement of financial position can be affected by movements in the Namibian dollar/Australian dollar/US dollar exchange rates. The Group does not consider there to be a significant exposure to the Namibian dollar or US dollar as they represent the functional currencies of controlled entities. Equity price risk The Group is no longer exposed to equity price risk as they do not hold any investments in the ordinary share capital of entities listed on the Australian Securities Exchange or options to acquire ordinary shares. Credit risk Credit risk is the risk of financial loss to the Group if a customer or counterparty to a financial instrument fails to meet its contractual obligations, and arises principally from transactions with customers and investments. The Group is exposed to credit risk from its operating activities and from its financing activities, including deposits with banks and foreign exchange transactions. Trade and other receivables The receivables that the Group does experience through its normal course of business are short term in nature and the risk of non-recovery of receivables is considered to be negligible. The Board does not consider there to be a significant exposure to credit risk in relation to trade and other receivables. Cash at bank Credit risk from balances with banks and financial institutions is managed by the Group’s Financial Controller and reviewed by the Board. Investments of surplus funds are made only with approved counterparties. The Group’s primary banker is Westpac Banking Corporation. At reporting date all operating accounts are with this bank, other than funds transferred to Namibia to meet the working capital needs of the controlled entity, Reptile Uranium Namibia (Pty) Ltd. The cash needs of the controlled entity’s operations are monitored by the parent company and funds are advanced to the Namibian operations as required. The Directors believe this is the most efficient method of combining the monitoring and mitigation of potential credit risks arising out of holding cash assets in overseas jurisdictions, and the funding mechanisms required by the Group. Deposits at call In addition the Group has cash assets on deposit with Westpac Banking Corporation Limited. The Board considers these financial institutions, which have ratings of at least A1 from Standard & Poor’s, to be appropriate for the management of credit risk with regards to funds on deposit. Except for the matters above, the Group currently has no significant concentrations of credit risk. The carrying amount of the Group’s financial assets represents the maximum credit exposure. The Group’s maximum exposure to credit risk at the reporting date was: Consolidated 2014 2013 $ $
Cash and cash equivalents 1,235,654 3,990,597 Other receivables 88,510 170,259 1,324,164 4,160,856 The Group has no trade receivables at the reporting date. Liquidity risk Liquidity risk is the risk that the Group will not be able to meet its financial obligations as they fall due. The Group’s only liabilities are short term trade and other payables. The Group’s approach to managing liquidity is to ensure, as far as possible, that it will always have sufficient liquidity to meet its liabilities when due, under both normal and stressed conditions, without incurring unacceptable losses or risking damage to the Group’s reputation. Management manages its liquidity risk by monitoring its cash reserves and forecast spending, and is cognisant of the future demands for liquid financial resources to finance the Group’s current and future operations, and consideration is given to the liquid assets available to the Group before commitment is made to future expenditure or investment. The Group’s expenditure commitments are taken into account before entering into fixed term investments and short and medium term exploration programmes are tailored within current cash resources. The Group’s trade payables of $88,510 (2013:170.259) are settled on 30 day trading terms.
Deep Ye l l ow L im i t ed 58 2014 Annual R ep or t
For
per
sona
l use
onl
y

Note 17 Financial risk management (Cont’d) Capital management The Board’s policy is to maintain an adequate capital base so as to maintain investor and creditor confidence, and to sustain future development of the business. The Group does not actively issue dividends; repurchase its own shares or any other form of capital return to shareholders at the current exploration stage of the Group’s activities. The Group does not monitor returns on capital or any other financial performance measure as the indicators of success are quantifiable by physical results from operations. The Group manages its funding by way of issue of shares. The Group does not have capital requirements imposed on it by any external party. It is however exposed to Namibian tax law which has an influence on debt to equity ratios at the Namibian subsidiary level, which are monitored by management and the treatment of investments or other advances for the funding of operations are executed within these guidelines. The Group’s approach to capital management has not changed during the financial year. Capital is comprised of shareholders’ equity as disclosed in the statement of financial position. Fair values Fair values versus carrying amounts The fair values of financial assets and liabilities, together with the carrying amounts shown in the statement of financial position are as follows:
Consolidated
2014 2013 Carrying amount Fair value Carrying
amount Fair value
$ $ $ $
Cash and cash equivalents 1,235,654 1,235,654 3,990,597 3,990,597 Trade and other receivables 88,510 88,510 170,259 170,259 Available-for-sale investments - - 433,833 433,833 Trade and other payables (286,538) (286,538) (547,153) (547,153) 1,037,626 1,037,626 4,047,536 4,047,536 Determination of fair values The determination of fair values for the above financial assets and liabilities have been performed on the following basis: Cash and cash equivalents, trade and other receivables and trade and other payables approximate their carrying amounts largely due to the short term maturities of these instruments. Investments in equity and debt securities The fair value of financial assets at fair value through profit and loss, available-for-sale investments and held for trading financial assets is determined by reference to their quoted bid price at the reporting date. AASB 7 Financial Instruments require disclosure of fair value measurements by level of the following fair value measurement hierarchy: (a) Quoted prices in active markets (Level 1); (b) Inputs other than quoted prices included within level 1 that are observable for the asset or liability, either directly or indirectly
(Level 2); and (c) Inputs that are not based on observable market data (Level 3). The following table presents the Group’s assets measured and recognised at fair value. Consolidated
30 June 2014 Quoted market price
(Level 1)
Valuation technique – non-market observable inputs
(Level 3) Total
Financial Assets Available-for-sale - - - Total - - -
30 June 2013 Quoted market price (Level 1)
Valuation technique – non-market observable inputs
(Level 3) Total
Financial Assets Available-for-sale 433,833 - 433,833 Total 433,833 - 433,833 Note 18 Dividends No dividends were paid or proposed during the financial year (2013: Nil). The Company has no franking credits available as at 30 June 2014 (2013: Nil).
Deep Ye l l ow L im i t ed 59 2014 Annual R ep or t
For
per
sona
l use
onl
y

Note 19 Key Management Personnel disclosures
Compensation of key management personnel
Consolidated2014 2013
$ $
Short-term employee benefits 1,093,523 1,605,727Post employment benefits 35,468 145,271Long-term employee benefits 5,732 6,975Share based payment 190,519 280,062Total compensation 1,325,242 2,038,035
Interest in Securities
Option holdingsThere were no options granted during the years ended 30 June 2014 and 30 June 2013
There were no options over ordinary shares in the Company held during the current or prior financial years.
Loans made to Key Management Personnel
No loans were made to any Director or Key Management Personnel or any of their related entities during the reporting period.
Other transactions with Key Management Personnel
There were no other transactions with any Director or Key Management Personnel or any of their related entities during the reporting period.
Note 20 Remuneration of auditors
The auditor of the Deep Yellow Limited Group is Ernst & Young
Consolidated
2014 2013$
Amounts received or due and receivable by Ernst & Young for:Audit or review of the financial report of the entity and any other entity in the Consolidated Group
84,250 98,323
Taxation and other services in relation to the entity and any other entity in the Consolidated Group 11,000 10,000
95,250 108,323
Note 21 Contingencies
(i) Contingent liabilitiesThere were no material contingent liabilities as at 30 June 2014 other than:
Native Title and Aboriginal Heritage Native title claims have been made with respect to areas within Australia which include tenements in which the Group has an interest. The Group is unable to determine the prospects for success or otherwise of the claims and, in any event, whether or not and to what extent the claims may significantly affect the Group or its projects. Agreement is being or has been reached with various native title claimants in relation to Aboriginal Heritage issues regarding certain areas in which the Group has an interest.
(ii) Contingent assetsThere were no material contingent assets as at 30 June 2014.
Note 22 Commitments
(a) Exploration
The Group has certain obligations to perform minimum exploration work on mineral leases held. These obligations may vary over time, depending on the Group’s exploration programmes and priorities and may be reduced by the surrendering of tenements. As at balance markdate, total exploration expenditure commitments on tenements held by the Group have not been provided for in the financial statements and which cover the following twelve month period amount to $50,000 (2013: $1,027,050). These obligations are also subject to variations by farm-out arrangements or sale of the relevant tenements. This commitment does not include the expenditure commitments which are the responsibility of the joint venture partners. Refer note 26 for details.
The Group acquired tenements EL24246 and EL9890 and in consideration for the transfer of the tenements, the Group has agreed to pay the Vendor a royalty. The Vendor is entitled to the royalty from the commencement of commercial production on the tenements in accordance with a set formula equal to 2% of the Total Sales Return generated from the sale of any product. The Royalty shall be calculated by the Group each calendar year and paid within 30 days of the end of the Royalty Period. Since the date of acquisition and up to the date of this report, there has been no commercial production on EL24246 which would give rise to a liability and EL9890 has been surrendered.
Deep Ye l l ow L im i t ed 60 2014 Annual R ep or t
For
per
sona
l use
onl
y

Note 22 Commitments (Cont’d)
(b) Operating lease commitments
Commitments for minimum lease payments in relation to non-cancellable operating leases are as follows:
Consolidated2014 2013
$
Within one year 79,030 90,515Later than one year but not later than five years 33,334 163,903
112,364 254,418
(c) Contractual commitments
There are no contracted commitments other than those disclosed above.
Note 23 Related party transactions
There were no related party transactions during the year other than those disclosed in Note 19 on Key Management Personnel. There were no related party transactions during the year other than those disclosed in Note
Note 24 Controlled entities
Controlled Entity Country of Incorporation
2014 2013Proportion of share capital
owned%
Carrying value of investment
$
Proportion of share capital
owned%
Carrying value of
investment$
Deep Yellow Namibia (Pty) Ltd Mauritius 100 61,775,587 100 60,575,587Superior Uranium Pty Ltd Australia 100 102,595 100 102,595Reptile Mineral Resources and Exploration(Pty) Ltd Namibia 100 - 100 -Reptile Uranium Namibia (Pty) Ltd Namibia 100 - 100 -Omahola Uranium (Pty) Ltd Namibia 100 - 100 -Shiyela Iron (Pty) Ltd Namibia 95 - 95 -Sand and Sea Property Number Twenty Four (Pty) Ltd
Namibia 100 - 100 -
Tarquin Investments (Pty) Ltd Namibia 100 - 100 -QE Investments (Pty) Ltd Namibia 100 - 100 -Inca Mining (Pty) Ltd Namibia 95 - 95 -TRS Mining Namibia (Pty) Ltd Namibia 95 - 95 -Yellow Dune Uranium (Pty) Ltd Namibia 85 - 85 -
61,878,182 60,678,182
Note 25 Parent Entity Information
2014 2013Information relating to Deep Yellow Limited: $ $
Current assets 1,110,956 3,620,528Total assets 77,842,043 117,783,132Current liabilities 248,922 366,507Total liabilities 248,922 366,507Issued capital 216,816,003 215,551,617Accumulated losses (149,845,116) (108,527,031)Equity compensation reserve 10,622,234 10,321,639Asset fair value adjustment reserve - 70,400Total shareholders’ equity 77,593,121 117,416,625Loss of the parent entity (41,318,085) (7,237,031)Total comprehensive loss of the parent entity (43,460,004) (7,182,631)
Contingent liabilities of the parent entityNative title claims have been made with respect to areas which include tenements in which the parent entity has an interest. The parent entity is unable to determine the prospects for success or otherwise of the claims and, in any event, whether or not and to what extent the claims may significantly affect the parent entity or its projects. Agreement is being or has been reached with various native title claimants in relation to Aboriginal Heritage issues regarding certain areas in which the parent entity has an interest.
Deep Ye l l ow L im i t ed 61 2014 Annual R ep or t
For
per
sona
l use
onl
y

Note 26 Interests in joint operations Joint arrangements have been entered into with third parties, whereby the Group or the third parties can earn an interest in exploration areas by expending specified amounts in the exploration areas. There are no assets employed by these joint operations and the Group’s expenditure in respect of them is brought to account initially as capitalised exploration and evaluation expenditure. The Group is currently in the earn-in phase of its joint operations. The Group’s interest in joint operations is as follows:
∗ On 13 July 2011 the Company announced that it has signed a joint arrangement with Syndicated Metals Limited over four tenements in the Mount Isa District in Northwest Queensland. Syndicated Metals Limited has the rights to earn 100% of all minerals, excluding uranium on EPM 14281 (Yamamilla), EPM 14916 (Ewen) and EPM 15070 (Prospector). Syndicated Metals Limited has earned 80% equity in the non-uranium mineral rights through expenditure of $800,000. They have the option to purchase the remaining 20% at fair market value after sole funding the joint operation until delivery of a Mining Study.
∗ On 22 January 2013 the Company announced the execution of a Heads of Agreement with Epangelo Mining Company (Pty) Ltd (“Epangelo”) to progress the Aussinanis project (“Aussinanis”) in Namibia. Epangelo, a private company owned by the Government of the Republic of Namibia has acquired 5% of a new entity holding Aussinanis by funding testwork. Epangelo can earn up to 50% of the project by funding the Project through to a bankable feasibility study.
Note 27 Events occurring after balance date The Company has successfully raised $1,513,230 through a Non-renounceable Rights Issue that closed on Friday, 18 July 2014 with subscriptions for 89,013,543 ordinary shares at 1.7 cents per share. A further placement consisting of two tranches raised a further $3,050,382 with subscriptions for 179,411,762 shares at 1.7 cents per share. The placement consisted of two tranches, the first being in satisfaction of the Non-renounceable Rights Issue shortfall of 113,118,169 shares equating to $1,923,009 and the second being an excluded placement made under the Company’s 15% placement capacity for approximately 66,316,059 shares equating to $1,127,373. Both tranches settled and resulting shares were issued on 27 August 2014. Note 28 Reconciliation of loss after tax to net cash outflow from operating activities Consolidated 2014 2013 $ $
Loss after income tax (19,441,680) (8,667,777) Depreciation and amortisation 39,708 69,438 Profit on disposal of fixed assets (77,653) (294,721) Exploration costs written off 17,263,495 6,448,277 Impairment expense - 61,900 Net fair value loss on held for trading financial assets 6,008 42,000 Share based payments expense 281,290 212,598
Change in operating assets and liabilities: Decrease in receivables 153,480 27,393 Decrease) in payables (56,777) (183,684)
Net cash used in operating activities (1,832,129) (2,364,576) Non-cash financing and investing activities The Group has not entered into any transaction during the current or prior financial year which had material non cash components. Note 29 Earnings per share Consolidated 2014 2013
a) Basic earnings per share Loss attributable to ordinary equity holders of the Company (1.22) cents (0.60) cents
b) Diluted earnings per share Loss attributable to ordinary equity holders of the Company (1.22) cents (0.60) cents
c) Loss used in calculation of basic and diluted loss per share Loss from continuing operations after income tax (19,441,680) (8,667,777) d) Weighted average number of shares used as the denominator Weighted average number of shares used as the denominator in calculating basic and diluted earnings per share
1,598,401,163
1,434,800,211
e) Information concerning the classification of securities Rights Performance rights granted and Share rights allocated by the Company that are subject to market price and other performance vesting conditions that had not vested at the reporting date are considered to be contingently issuable shares. There are 14,461,501 instruments excluded from the calculation of diluted earnings per share that could potentially dilute basic earnings per share in the future because they are anti-dilutive for either of the periods presented. These shares have not been included in the determination of basic earnings per share. 2,910,980 shares were issued on 1 July 2014 following the vesting of Performance Rights. This would not have a significant impact on the number of ordinary shares outstanding between the reporting date and the date of completion of these financial statements. Diluted earnings per share is the same as basic earnings per share in 2014 and 2013 as the Group is in a loss position.
Deep Ye l l ow L im i t ed 62 2014 Annual R ep or t
For
per
sona
l use
onl
y

DIRECTORS’ DECLARATION In accordance with a resolution of the Directors of Deep Yellow Limited (‘the Company’), I state that: 1. In the opinion of the Directors: (a) the financial statements and notes of the consolidated entity are in accordance with the Corporations Act 2001, including:
(i) complying with Australian Accounting Standards (including the Australian Accounting Interpretations) and the Corporations Regulations 2001; and
(ii) giving a true and fair view of the consolidated entity’s financial position as at 30 June 2014 and of its performance for the year
ended on that date; (b) the financial statements and notes also comply with International Financial Reporting Standards as disclosed in note 1; and (c) there are reasonable grounds to believe that the Company will be able to pay its debts as and when they become due and payable. 2. This declaration has been made after receiving the declarations to be made to the Directors in accordance with Section 295A of the
Corporations Act 2001 for the financial year ended 30 June 2014 On behalf of the Board
Greg Cochran Managing Director 26st day of September 2014
Deep Ye l l ow L im i t ed 63 2014 Annual R ep or t
For
per
sona
l use
onl
y

64
GHM:JT:DYL:009
Ernst & Young11 Mounts Bay RoadPerth WA 6000 AustraliaGPO Box M939 Perth WA 6843
Tel: +61 8 9429 2222Fax: +61 8 9429 2436ey.com/au
A member firm of Ernst & Young Global LimitedLiability limited by a scheme approved under Professional Standards Legislation
Independent auditor's report to the members of Deep Yellow Limited
Report on the financial report
We have audited the accompanying financial report of Deep Yellow Limited, which comprises theconsolidated statement of financial position as at 30 June 2014, the consolidated statement ofcomprehensive income, the consolidated statement of changes in equity and the consolidated cash flowstatement for the year then ended, notes comprising a summary of significant accounting policies andother explanatory information, and the directors' declaration of the consolidated entity comprising thecompany and the entities it controlled at the year's end or from time to time during the financial year.
Directors' responsibility for the financial report
The directors of the company are responsible for the preparation of the financial report that gives a trueand fair view in accordance with Australian Accounting Standards and the Corporations Act 2001 and forsuch internal controls as the directors determine are necessary to enable the preparation of the financialreport that is free from material misstatement, whether due to fraud or error. In Note 1, the directorsalso state, in accordance with Accounting Standard AASB 101 Presentation of Financial Statements, thatthe financial statements comply with International Financial Reporting Standards.
Auditor's responsibility
Our responsibility is to express an opinion on the financial report based on our audit. We conducted ouraudit in accordance with Australian Auditing Standards. Those standards require that we comply withrelevant ethical requirements relating to audit engagements and plan and perform the audit to obtainreasonable assurance about whether the financial report is free from material misstatement.
An audit involves performing procedures to obtain audit evidence about the amounts and disclosures inthe financial report. The procedures selected depend on the auditor's judgment, including the assessmentof the risks of material misstatement of the financial report, whether due to fraud or error. In makingthose risk assessments, the auditor considers internal controls relevant to the entity's preparation andfair presentation of the financial report in order to design audit procedures that are appropriate in thecircumstances, but not for the purpose of expressing an opinion on the effectiveness of the entity'sinternal controls. An audit also includes evaluating the appropriateness of accounting policies used andthe reasonableness of accounting estimates made by the directors, as well as evaluating the overallpresentation of the financial report.
We believe that the audit evidence we have obtained is sufficient and appropriate to provide a basis forour audit opinion.
Independence
In conducting our audit we have complied with the independence requirements of the Corporations Act2001. We have given to the directors of the company a written Auditor’s Independence Declaration, acopy of which is included in the directors’ report.F
or p
erso
nal u
se o
nly
65
GHM:JT:DYL:009A member firm of Ernst & Young Global LimitedLiability limited by a scheme approved under Professional Standards Legislation
Opinion
In our opinion:
a. the financial report of Deep Yellow Limited is in accordance with the Corporations Act 2001,including:
i giving a true and fair view of the consolidated entity's financial position as at 30 June 2014 andof its performance for the year ended on that date
ii complying with Australian Accounting Standards and the Corporations Regulations 2001
b. the financial report also complies with International Financial Reporting Standards as disclosed inNote 1.
Report on the remuneration report
We have audited the Remuneration Report included in pages 26 to 36 of the directors' report for the yearended 30 June 2014. The directors of the company are responsible for the preparation and presentationof the Remuneration Report in accordance with section 300A of the Corporations Act 2001. Ourresponsibility is to express an opinion on the Remuneration Report, based on our audit conducted inaccordance with Australian Auditing Standards.
Opinion
In our opinion, the Remuneration Report of Deep Yellow Limited for the year ended 30 June 2014complies with section 300A of the Corporations Act 2001.
Ernst & Young
G H MeyerowitzPartnerPerth26 September 2014
For
per
sona
l use
onl
y

ASX ADDITIONAL INFORMATION Additional information required by the Australian Stock Exchange Ltd and not shown elsewhere in this report is as follows. The information is current as at 24 September 2014. A. Distribution of Equity Securities 1,891,196,227 fully paid ordinary shares are held by 7,492 individual shareholders. In accordance with the Company’s Constitution, voting rights in respect of ordinary shares are on a show of hands whereby each member present in person or by proxy shall have one vote and upon a poll, each share will have one vote. All issued ordinary shares carry the rights to dividends. The number of shareholders by size of holding are: Distribution Number of Shareholders Number of Shares Percent of Issued Capital
1 – 1,000 294 85,749 0.00 1,001 – 5,000 1,230 4,260,802 0.23 5,001 – 10,000 1,284 10,173,846 0.54 10,001- 100,000 3,471 126,081,350 6.67 More than 100,000 1,213 1,750,594,480 92.57 Totals 7,492 1,891,196,227 100.00 There were 4,649 shareholders holding less than a marketable parcel of ordinary shares. B. Substantial Shareholders An extract of the Company’s Register of Substantial Shareholders (who hold 5% or more of the issued capital) is set out below:
Shareholder Name Issued Ordinary Shares
Number Percentage Quoted Paladin Energy Ltd 319,106,156 16.87 HSBC Custody Nominees (Australia) Limited 256,538,159 13.56 National Nominees Limited 175,925,811 9.30 C. Twenty Largest Shareholders The names of the twenty largest holders of quoted shares are listed below:
Shareholder Name Listed Ordinary Shares
Number Percentage Quoted Paladin Energy Ltd 319,106,156 16.87 HSBC Custody Nominees (Australia) Limited 256,538,159 13.56 National Nominees Limited 175,925,811 9.30 Gillian Swaby 46,318,476 2.45 Robert Anthony Healy 43,563,589 2.30 UBS Nominees Pty Ltd 42,117,647 2.23 Mr Zac Rossi + Mrs Thelma Rossi 32,760,000 1.73 Dr Leon Eugene Pretorius 29,000,000 1.53 Mr Robert Anthony Healy 27,010,312 1.43 Citicorp Nominees Pty Limited 24,710,636 1.31 JP Morgan Nominees Australia Limited 24,328,844 1.29 Mr Mervyn Patrick Greene 21,945,000 1.16 Mr Robert Anthony Healy + Mrs Helen Maree Healy 18,137,500 0.96 IJG Securities Pty Ltd 17,088,604 0.90 Elegant World Pty Ltd <M I T Partners A/C> 15,531,250 0.82 Walkabout Superannuation Fund Pty Limited <Walkabout Super Fund A/C> 15,125,001 0.80 Ms Mei-Ling Fu 12,660,000 0.67 Motte & Bailey Pty Ltd <Bailey Super Fund A/C> 10,825,071 0.57 Mrs Heather Joy Buchanan 10,016,750 0.53 Mr Brendon Tony Dunstan 7,694,388 0.41 Totals 1,150,403,194 60.83 D. Restricted Securities As at 30 June 2014 there were 29,333,333 ordinary shares subject to voluntary escrow. The escrow period expires 30 June 2015.
Deep Ye l l ow L im i t ed 66 2014 Annual R ep or t
For
per
sona
l use
onl
y

SCHEDULE OF MINERAL TENURE – JULY 2014 NAMIBIA
Number Name Interest Expiry Date JV Parties Approx. Area (km2)
EPL 3496 Tubas 100% 05.06.2015 - 709 EPL 3497 Tumas 100% 05.06.2015 - 637 EPL 3498 Aussinanis 85% 07.05.2014 5% Epangelo #2 253 EPL 3499 Ripnes 85% 05.06.2015 10% Oponona#3 522 EPL 3668 Gawib West 65% 20.11.2015 25% Nova (Africa) #4
10% Sixzone #5
185 EPL 3669 Tumas North 65% 20.11.2015 163 EPL 3670 Chungochoab 65% 20.11.2015 640 ML 173 #1 Tubas Sand 95% Application
5% Oponona #3 -
ML 174 #1 Inca 95% Application - ML 176 #1 Shiyela 95% 05.12.2027 - #1 Located entirely within EPL3496 #2 Epangelo Mining (Pty) Ltd #3 Oponona Investments (Pty) Ltd #4 Nova (Africa) (Pty) Ltd #5 Sixzone Investments (Pty) Ltd Sub-Total 3,109
NORTHERN TERRITORY
Number. Name Interest Expiry Date JV Parties Approx. Area (km2)
EL 24246 Napperby 100% 10.10.14 - 477 EL 25146 Mt Morris West 100% Vetoed Application - - EL 25147 Mt Morris 100% Vetoed Application - - EL 29385 Highland Rocks 1 100% Application - - EL 29386 Highland Rocks 2 100% Application - - EL 29387 Highland Rocks 3 100% Application - - EL 29388 Highland Rocks 4 100% Application - - Sub-Total 477
QUEENSLAND
Number Name Interest Expiry Date JV Parties Approx. Area (km2)
EPM 14281 Yamamilla 100% 06.07.15 SML#1 118 EPM 14916 Ewen 100% 14.04.16 SML#1 115 EPM 15070 Prospector 100% 27.03.16 SML#1 77 #1 SML – Syndicated Metals Ltd has an 80% interest in the Other Mineral Rights Sub-Total 310 DYL Total 3,896
Deep Ye l l ow L im i t ed 67 2014 Annual R ep or t
For
per
sona
l use
onl
y

2014 Annual Report
Level 4, 502 Hay Street, Subiaco, Western Australia 6008Tel: 61 8 9286 6999 Fax: 61 8 9286 6969
www: deepyellow.com.au
DEEP YELLO
W LIM
ITED
2014 AN
UA
L REPORT
For
per
sona
l use
onl
y