,502:833 846,1998august1 1998 ...isi.ssl.berkeley.edu/papers/monnier1998apj502.pdf · gone a...
TRANSCRIPT

THE ASTROPHYSICAL JOURNAL, 502 :833È846, 1998 August 11998. The American Astronomical Society. All rights reserved. Printed in U.S.A.(
TEMPORAL VARIATIONS OF MIDINFRARED SPECTRA IN LATE-TYPE STARS
J. D. T. R. AND W. C.MONNIER,1 GEBALLE,2 DANCHI1Received 1997 December 10 ; accepted 1998 March 6
ABSTRACTNew multiepoch, midinfrared (8È13 km) spectrophotometric observations are presented for 30 late-
type stars. The observations were collected over a 4 yr period (1994È1997), permitting an investigation ofthe midinfrared spectral shape as a function of the pulsation cycle (typically 1È2 yr). The spectra of starswith little excess infrared emission and those with carbon-rich dust show the least spectral variability,while stars with evidence for dusty, oxygen-rich envelopes are most likely to show discernible variationsin their spectral proÐle. Most signiÐcantly, a large fraction of variable stars with strong 9.7 km emissionfeatures shows clear spectral proÐle changes, which repeat from one cycle to the next. The signiÐcantsharpening of the silicate feature near maximum light cannot be fully explained by heating and coolingof the circumstellar dust shell during the pulsational cycle, suggesting that the dust optical propertiesthemselves must also be varying. In addition, the appearance of a narrow emission feature near the sili-cate peak for a few stars may require the production of especially ““ pure ÏÏ silicate dust near maximumlight. The general narrowing of the silicate feature observed may reÑect the evolution of the preexistingdirty grains whose surface impurities have been evaporated o† when the grain temperature rises preced-ing maximum light. An improved theory of dust formation that can explain the observed changes in thegrain properties around a single, pulsating star may lead to a deÐnitive explanation for the diversity ofsilicate emission proÐles observed among oxygen-rich, late-type stars.Subject headings : circumstellar matter È dust, extinction È infrared : stars È
stars : AGB and post-AGB È stars : mass loss
1. INTRODUCTION
The midinfrared (8È13 km) spectra of late-type stars havebeen measured by many observers since the development ofinfrared detectors. These red giants and supergiants areoften surrounded by dusty envelopes that absorb stellarradiation and reradiate the energy in the near- and midinfrared. The infrared spectra can be classiÐed based on thechemical content of the circumstellar environment (oxygen-or carbon-rich) and on the optical thickness of the dustyenvelope (e.g., Merrill & Stein Oxygen-rich1976a, 1976b).circumstellar environments often produce spectra evincinga feature near 9.7 km resulting from the presence of silicatedust & Ney This feature appears in emission(Woolf 1969).for optically thin envelopes or in absorption when largeenough optical depths are encountered. The emissionspectra of dust surrounding carbon stars are nearly feature-less, although they often contain an 11.3 km feature attrib-uted to SiC. In addition, many of these red giants andsupergiants are classiÐed as long-period variables, pulsatingwith a typical period of 1È2 yr.
The homogeneous set of survey measurements by theInfrared Astronomical Satellite (IRAS) in the mid-1980sallowed observers to classify silicate emission features basedon various schemes Science Team Little-(IRAS 1986 ;Marenin & Little et al. &1988, 1990 ; Goebel 1989 ; SloanPrice The di†erent shapes of the feature have been1995).interpreted as largely due to di†erences in the chemicalmakeup of oxygen-rich dust. Unfortunately, the IRASprogram did not conscientiously include observations of themidinfrared spectra of long-period variable stars at di†erentphases of their luminosity cycles, and there are only a few
1 Space Sciences Laboratory, University of California, Berkeley, Berke-ley, CA 94720-7450.
2 Joint Astronomy Centre, 600 North AÏohoku Place, University Park,Hilo, HI 96720.
cases where such data have been retrieved from the IRASLow Resolution Spectrometer (LRS) database. Theseobservations have suggested silicate feature strength varia-tions as a function of pulsational cycle but have been ham-pered by limited temporal coverage (Little-Marenin,Stencel, & Staley More recent results by1996). Creech-
et al. point toward evidence for variations inEakman (1997)the silicate feature as a function of pulsational phase, butthe comparison spectra were taken nearly a decade apart.Hence, the simple observational question of whether themidinfrared spectra of LPVs change shape through the pul-sational cycle has been left without a decisive answer.
A campaign of observations taken from 1994 to 1997 wasdesigned to monitor the midinfrared spectrum of nearly 30late-type stars. The observations, sampling the spectrum ofmost stars multiple times within a pulsational cycle, usedthe same instrument and observing technique. The homo-geneity of this data set is important for allowing reliablespectral comparisons and avoiding complicating issues suchas di†erent apertures and calibration methods. This paperpresents the full data set collected thus far and discusses thespectral variability (or lack of variability) of our samplestars.
2. OBSERVATIONS
Midinfrared spectrophotometry was carried out with theUnited Kingdom Infrared Telescope (UKIRT) from 1994 to1997. These observations employed the 32 element, lineararray spectrometer CGS3 and were obtained with a 5Adiameter aperture and standard chopping and noddingtechniques. Wavelength calibrations were derived fromobservations of a krypton arc lamp in fourth, Ðfth, and sixthorder and are accurate to ^0.02 km. The wavelengthresolution of the observations was D0.2 km, sampled 3times per resolution element. Flux calibrations were derivedfrom observations of a Lyr, a Aur, a CMa, and other bright
833

834 MONNIER, GEBALLE, & DANCHI
standard stars. All standard stars used for calibration wereof spectral type K0 or earlier, so that absorption in thefundamental band of SiO, which is very prominent in late Kand M giants and supergiants, is minimal in the spectraratioed and does not a†ect the shapes of the reducedspectra.
The uncertainty in the absolute Ñux level was determinedfrom the internal consistency of an intercomparison ofphotometric standards observed on a given night. SpeciÐcdeterminations of the uncertainty for individual nights,along with other observing information, can be found in
Note that for spectra taken on 1994 November 20,Table 1.which were not photometric, the uncertainty is probably^20%.
Intracomparison of spectra from stars with little dustemission taken on di†erent nights (a Boo, d Oph, etc.) indi-cates the relative Ñux calibration within a single spectrum tobe accurate to about 1%. Details of the spectral shape areleast reliable near 9.7 km because of strong telluric absorp-tion by ozone. Inspection of the entire data set reveals therelative calibration for 1997 March 17 to be less accuratethan the others, occasionally showing a 5%È15% mis-calibration longward of 12 km presumably due to changingtelluric absorption. It is important to refer toH2O Table 1when judging the quality of an individual spectrum.
3. RESULTS
The observed stars were divided into three categoriesafter inspecting the full set of spectra. showsFigure 1spectra from 18 stars whose midinfrared spectral shapesshowed no apparent changes during our observing cam-paign ; this includes stars that were observed only a singletime (b Peg, Egg Nebula, and U Her). containsFigure 2spectra from eight stars whose 9.7 km silicate feature showsclear enhancement over the stellar/dust continuum duringmaximum light. Lastly, there are four stars that belong toneither of the above groups, and these spectra can be foundin These stars show either a change in the mid-Figure 3.infrared spectral slope or increased rms Ñuctuations in thespectral shape.
Figures all share the same format. The upper panels1È3show the full set of calibrated data, while the lower panelsdisplay the relative spectra for each source as determined bythe following method. First, normalized spectra are produc-ed by dividing each spectrum by its mean Ñux between 8and 13 km and then are smoothed (*j\ 0.2 km). Then,after removing spectra with known calibration problems
(1997 March 17 observations and the cloudy data from1994 August 26 ; see the set of normalized spectraTable 1),for each star is averaged together to form a mean spectralshape. Finally, this mean spectrum is divided into each ofthe normalized spectra to produce plots of the deviationfrom the cycle-averaged spectral shape, which are displayedin the lower panels. The rms Ñuctuation about the meanspectral shape is calculated for each star and is denoted by pin each lower panel. Spectra deemed unreliable are notincluded here, and thus the bottom panel is absent if ourobservations lacked a sufficient number of ““ clean ÏÏ spectra(at least two).
In addition, each panel contains a legend that tabulatesthe mean 8È13 km Ñuxes in Janskys, the dates of obser-vation, and the pulsation cycle phases, where applicable.
contains the pulsational characteristics, mostlyTable 2drawn from the recently released Hipparcos Catalog (ESA
along with the spectral type and the number of1997),spectra presented in this work. A few stars that are classiÐedas semiregular have their pulsational phases included only ifa very recent phase determination is available (e.g., VX Sgrand W Hya). Each date of observation is assigned its ownline style for all Ðgures to facilitate intercomparisonsbetween di†erent stars and di†erent nights. The verticalscale of the bottom panels is Ðxed so the relative magnitudeof the spectral shape variations within this sample can beeasily accessed. Although the data presented here do nothave adequate temporal coverage to justify a detailedanalysis of the light curves, inspection conÐrms the earlierÐnding that the infrared maximum is generally about*/B 0.1 after the optical maximum for Mira variables
& Wing(Lockwood 1971).
3.1. ““Constant ÏÏ Starscontains the observations of stars whose spectraFigure 1
showed no discernible shape changes during this campaign.Some of these stars are both spectrally constant and showlittle excess infrared radiation, justifying their traditionalrole as calibrators for spectral observations. In particular, aBoo, a Her, a Tau, and d Oph are among the most spec-trally constant of all objects observed and were used to inferthe true calibration uncertainty in this survey. Only starshaving spectral shape variations less than 2.0% rms and nooverall slope changes were selected to be included as““ constant ÏÏ stars. Note again that the 1994 August 26absolute photometry for a Boo, a Sco, and d Oph is notreliable because of clouds (see Table 1).
TABLE 1
JOURNAL OF UKIRT SPECTROPHOTOMETRY
Absolute FluxDate Number of Calibration(UT) Spectra (%) Comments
1994 Aug 26 . . . . . . 20 ^5 Cloudy for a Boo, RX Boo, a Sco, VX Sgr, d Oph1994 Nov 20 . . . . . . 10 ^20 Not photometric1995 Jan 14 . . . . . . . 19 ^51995 Mar 17 . . . . . . 24 ^5 Poor calibration for 9.7 km ozone line and band edges1995 Aug 20 . . . . . . 18 ^101995 Dec 2 . . . . . . . 15 ^101996 Jun 22 . . . . . . 6 ^15 Patchy cirrus1996 Sep 26 . . . . . . 4 ^51997 Jun 9 . . . . . . . . 3 ^101997 Aug 28 . . . . . . 1 ^101997 Aug 29 . . . . . . 5 ^5 VX Sgr absolute calibration is uncertain

FIG. 1.ÈMidinfrared spectra of late-type stars that showed no apparent changes in shape (see The top panels show the calibrated spectra along with° 3.1).the dates of observation, mean (8È13 km) Ñuxes in Janskys, and the pulsational phases, if applicable. All spectra taken on a given date share a common linestyle to facilitate intercomparison. The bottom panels show each spectrumÏs deviation from the cycle-averaged spectral shape, with the rms spectral shapedeviation denoted by p (see ° 3).
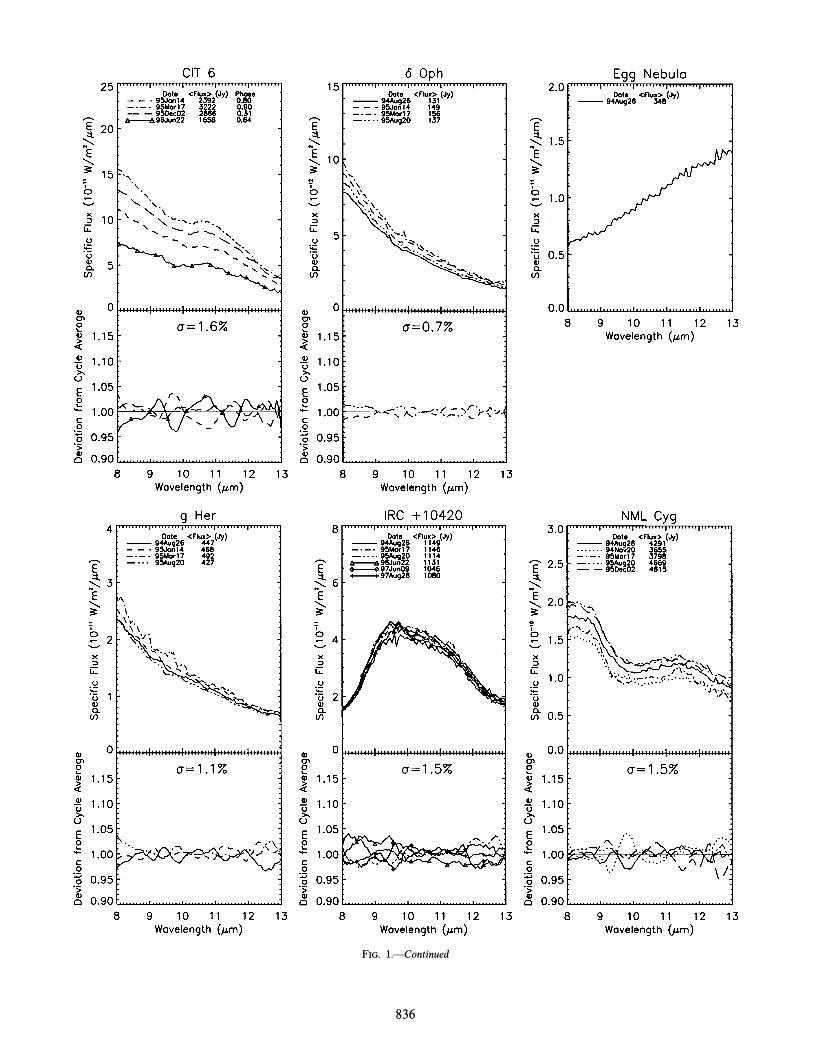
FIG. 1.ÈContinued
836

FIG. 1.ÈContinued
837

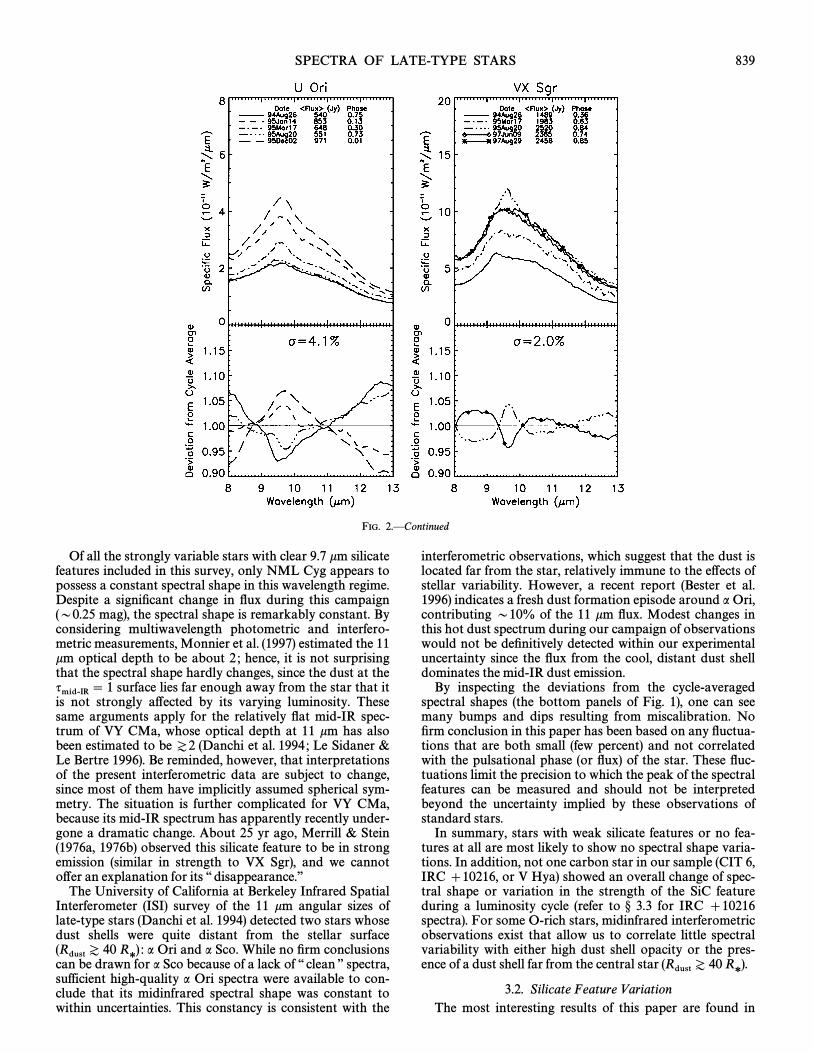
FIG. 2.ÈMidinfrared spectra of late-type stars whose silicate feature showed signiÐcant enhancement during maximum light (see The top panels° 3.2).show the calibrated spectra along with the dates of observation, mean (8È13 km) Ñuxes in Janskys, and the pulsational phases. All spectra taken on a givendate share a common line style to facilitate intercomparison. The bottom panels show each spectrumÏs deviation from the cycle-averaged spectral shape, withthe rms spectral shape deviation denoted by p (see ° 3).
SPECTRA OF LATE-TYPE STARS 839
FIG. 2.ÈContinued
Of all the strongly variable stars with clear 9.7 km silicatefeatures included in this survey, only NML Cyg appears topossess a constant spectral shape in this wavelength regime.Despite a signiÐcant change in Ñux during this campaign(D0.25 mag), the spectral shape is remarkably constant. Byconsidering multiwavelength photometric and interfero-metric measurements, et al. estimated the 11Monnier (1997)km optical depth to be about 2 ; hence, it is not surprisingthat the spectral shape hardly changes, since the dust at the
surface lies far enough away from the star that itqmidvIR\ 1is not strongly a†ected by its varying luminosity. Thesesame arguments apply for the relatively Ñat mid-IR spec-trum of VY CMa, whose optical depth at 11 km has alsobeen estimated to be et al. Sidaner &Z2 (Danchi 1994 ; LeLe Bertre Be reminded, however, that interpretations1996).of the present interferometric data are subject to change,since most of them have implicitly assumed spherical sym-metry. The situation is further complicated for VY CMa,because its mid-IR spectrum has apparently recently under-gone a dramatic change. About 25 yr ago, Merrill & Stein
observed this silicate feature to be in strong(1976a, 1976b)emission (similar in strength to VX Sgr), and we cannoto†er an explanation for its ““ disappearance.ÏÏ
The University of California at Berkeley Infrared SpatialInterferometer (ISI) survey of the 11 km angular sizes oflate-type stars et al. detected two stars whose(Danchi 1994)dust shells were quite distant from the stellar surface
a Ori and a Sco. While no Ðrm conclusions(RdustZ 40 R*) :
can be drawn for a Sco because of a lack of ““ clean ÏÏ spectra,sufficient high-quality a Ori spectra were available to con-clude that its midinfrared spectral shape was constant towithin uncertainties. This constancy is consistent with the
interferometric observations, which suggest that the dust islocated far from the star, relatively immune to the e†ects ofstellar variability. However, a recent report et al.(Bester
indicates a fresh dust formation episode around a Ori,1996)contributing D10% of the 11 km Ñux. Modest changes inthis hot dust spectrum during our campaign of observationswould not be deÐnitively detected within our experimentaluncertainty since the Ñux from the cool, distant dust shelldominates the mid-IR dust emission.
By inspecting the deviations from the cycle-averagedspectral shapes (the bottom panels of one can seeFig. 1),many bumps and dips resulting from miscalibration. NoÐrm conclusion in this paper has been based on any Ñuctua-tions that are both small (few percent) and not correlatedwith the pulsational phase (or Ñux) of the star. These Ñuc-tuations limit the precision to which the peak of the spectralfeatures can be measured and should not be interpretedbeyond the uncertainty implied by these observations ofstandard stars.
In summary, stars with weak silicate features or no fea-tures at all are most likely to show no spectral shape varia-tions. In addition, not one carbon star in our sample (CIT 6,IRC ]10216, or V Hya) showed an overall change of spec-tral shape or variation in the strength of the SiC featureduring a luminosity cycle (refer to for IRC ]10216° 3.3spectra). For some O-rich stars, midinfrared interferometricobservations exist that allow us to correlate little spectralvariability with either high dust shell opacity or the pres-ence of a dust shell far from the central star (RdustZ 40 R
*).
3.2. Silicate Feature VariationThe most interesting results of this paper are found in

FIG. 3.ÈMidinfrared spectra of late-type stars that showed either signiÐcant changes in slope or an rms variability larger than that expected fromobservations of standard stars (see The top panels show the calibrated spectra along with the dates of observation, mean (8È13 km) Ñuxes in Janskys,° 3.3).and the pulsational phases. All spectra taken on a given date share a common line style to facilitate intercomparison. The bottom panels show eachspectrumÏs deviation from the cycle-averaged spectral shape, with the rms spectral shape deviation denoted by p (see ° 3).

SPECTRA OF LATE-TYPE STARS 841
TABLE 2
STELLAR CHARACTERISTICS
Period Number ofNames Spectral Typea Variable Typea Date of Maximum (days) Spectra References
a Boo . . . . . . . . . . . . . . . . . . . . . . . . . . . . . . . . . . . . . . . K1.5 III . . . . . . . . . 4a Her . . . . . . . . . . . . . . . . . . . . . . . . . . . . . . . . . . . . . . . M5 . . . . . . . . . 3a Ori . . . . . . . . . . . . . . . . . . . . . . . . . . . . . . . . . . . . . . . . M1.5 Iab SRc . . . D2070 7 1a Sco . . . . . . . . . . . . . . . . . . . . . . . . . . . . . . . . . . . . . . . M1.5 Ib SRa . . . D1733 3 1a Tau . . . . . . . . . . . . . . . . . . . . . . . . . . . . . . . . . . . . . . . K5 III . . . . . . . . . 6b Peg . . . . . . . . . . . . . . . . . . . . . . . . . . . . . . . . . . . . . . . M2.5 IIÈIII . . . . . . . . . 1s Cyg . . . . . . . . . . . . . . . . . . . . . . . . . . . . . . . . . . . . . . . S8, K0 III Mira 2448688.5 402.3 4 2CIT 3 \ WX Psc\ IRC ]10011 . . . . . . . M9 Mira 2446985 660 7 5CIT 6 \ RW LMi\ IRC ]30219 . . . . . . C Mira 2449857 628 4 6Egg Nebula\ AFGL 2688 . . . . . . . . . . . . . . F5 Iae . . . . . . . . . 1d Oph . . . . . . . . . . . . . . . . . . . . . . . . . . . . . . . . . . . . . . M0.5 III . . . . . . . . . 4g Her . . . . . . . . . . . . . . . . . . . . . . . . . . . . . . . . . . . . . . . M6 III SRb D70 4 1IK Tau \ IRC ]10050 . . . . . . . . . . . . . . . . . . M6me Mira 2447412 462 8 5IRC ]10216 \ CW Leo . . . . . . . . . . . . . . . . . C Mira 2446825.0 638 5 3, 4IRC ]10420 \ V1302 Aql . . . . . . . . . . . . . . . F8 Ia . . . . . . . . . 6NML Cyg\ IRC ]40448 . . . . . . . . . . . . . . . M Ib SR . . . D940 5 7o Cet\ Mira . . . . . . . . . . . . . . . . . . . . . . . . . . . . . . M7 IIIe Mira 2448826.3 333.8 7 2R Aqr . . . . . . . . . . . . . . . . . . . . . . . . . . . . . . . . . . . . . . M7 IIIpe Mira 2448619.9 383.9 3 2R Cnc . . . . . . . . . . . . . . . . . . . . . . . . . . . . . . . . . . . . . . M7 IIIe Mira 2448587.6 356.0 4 2R Hya . . . . . . . . . . . . . . . . . . . . . . . . . . . . . . . . . . . . . . M7 IIIe Mira 2448605.2 384 3 2R Leo . . . . . . . . . . . . . . . . . . . . . . . . . . . . . . . . . . . . . . M8 IIIe Mira 2448565.6 311.0 5 2RX Boo . . . . . . . . . . . . . . . . . . . . . . . . . . . . . . . . . . . . M7.5 III SRb 2449438 340 4 9SW Vir \ IRC ]00230 . . . . . . . . . . . . . . . . . . M7 III SRb 2448637.12 153.6 2 2U Her . . . . . . . . . . . . . . . . . . . . . . . . . . . . . . . . . . . . . . M7 III Mira 2448652.8 418 1 2U Ori . . . . . . . . . . . . . . . . . . . . . . . . . . . . . . . . . . . . . . . M8 III Mira 2448582.0 367 5 2V Hya . . . . . . . . . . . . . . . . . . . . . . . . . . . . . . . . . . . . . . C9 SRa 2447950 D529.2 4 1, 9VX Sgr . . . . . . . . . . . . . . . . . . . . . . . . . . . . . . . . . . . . . M4 Iae SRb 2448591 737 5 2VY CMa . . . . . . . . . . . . . . . . . . . . . . . . . . . . . . . . . . . M5 Iae SR . . . D2000 4 8W Aql . . . . . . . . . . . . . . . . . . . . . . . . . . . . . . . . . . . . . . S4.9 Mira 2450762 490 3 10, 11W Hya . . . . . . . . . . . . . . . . . . . . . . . . . . . . . . . . . . . . . M8e SRa 2448790.0 369 3 2
a From SIMBAD database.b Supergiant classiÐcation based on & JuraMorris 1983.REFERENCES.È(1) et al. (2) (Hipparcos Catalog) ; (3) Bertre (4) et al. (5) Bertre (6)Kukarkin 1971 ; ESA 1997 Le 1992 ; Dyck 1991 ; Le 1993 ; Alksnis
(7) et al. (8) (9) J. Mattei 1995, private communication ; (10) (11)1995 ; Monnier 1997 ; Marvel 1996 ; Vardya 1988 ; Mattei 1997.
in which data are presented for eight stars thatFigure 2,exhibit systematic spectral changes directly related to thepulsational phase. It is worth noting that a large fraction ofthe surveyed stars with a distinct 9.7 km feature are in thiscategory. Two di†erent types of spectral shape variabilityare observed : an overall narrowing of the silicate featurenear maximum light seen in most of the stars and a morenarrow emission feature near the peak of the silicate featureseen only for a few sources. Even CIT 3, whose spectrumreveals a dusty envelope with an optical depth only slightlysmaller than that of NML Cyg (as judged by the partialself-absorption of the silicate feature), shows the same sys-tematic shape changes as stars with optically thin envelopes(e.g., o Cet and U Ori).
The certain identiÐcation of the spectral changes asrelated to the pulsational phase is conÐrmed in two di†erentways. First, the reality of this e†ect is attested to by the largenumber of stars that show the sharpening of the 9.7 kmsilicate feature near maximum. There is no case where thesilicate peak is seen to grow relative to the dust emission inthe wings (near 12 km, for example) at the minimum of theluminosity cycle. A second way to positively correlate thespectral changes with the Ñux output of the star is to obtainspectra at the same phase or Ñux level but one pulsationalperiod apart. In cases where this proved possible (s Cyg,CIT 3, IK Tau, o Cet, and U Ori), the spectral shapesshowed convincing agreement. For example, U Ori showed
a relatively Ñat silicate feature after one luminosityminimum, developing a peakier feature at maximum.Further data collected after the following minimum againshowed a Ñattened dust spectrum, while a Ðnal observationtaken at /\ 0.01 revealed a peaked spectrum similar tothat observed one cycle earlier.
This e†ect appears to have been Ðrst observed by Forrest,Gillett, & Stein hereafter but was not con-(1975, FGS75)nected to the pulsational phase. While a total of six o Cetmid-IR spectra spanning a 6 yr period were presented, onlythe Ðrst observation occurred sufficiently near maximum toshow silicate enhancement. The other observations allshowed signiÐcantly less silicate emission, leading toFGS75speculate that the infrared excess around this star wasslowly decreasing over time. The data presented here clearlyfavor an interpretation that links the amount and characterof the silicate emission to the phase of o Cet.
The evolution of the silicate enhancement from lumi-nosity minimum to maximum could not be continuouslyfollowed for a few sources (R Aqr and VX Sgr) because ofinadequate temporal coverage. In these cases it is possiblethat the silicate enhancement may have occurred suddenlyand/or may not repeat from one cycle to the next. This isespecially pronounced for VX Sgr, which shows a strong,narrow enhancement near maximum (/\ 0.84). The mostrecent measurement, /\ 0.85 on 1997 August 29, may bestarting to show a 9.7 km enhancement, but further data

842 MONNIER, GEBALLE, & DANCHI Vol. 502
collected at the end of 1997 are necessary to determine ifthis feature reappears and can indeed be associated with thepulsational cycle.
In order to investigate the physical mechanismsresponsible for the spectral changes, further analysis of thespectral shapes was performed on a subset of the stars withthe most complete temporal coverage. On this basis, thespectra of IK Tau, U Ori, and o Cet were chosen to rep-resent the entire data set in subsequent analysis. CIT 3 wasexcluded because its mid-IR spectrum suggests that the dustshell is optically thick. These stars show the silicate featureenhancement quite strongly, and it is expected that thephysical mechanism or mechanisms responsible for thespectral changes in these sources should apply to the others.
Subtracting the ““ stellar component ÏÏ from the spectrumallows the changes in the dust spectrum to be seen moreclearly. In each case the stellar spectrum is approximated asa 2500 K black body and is Ðtted to the 8 km datum in themid-IR spectrum & Little The(Little-Marenin 1990).““ stellar-subtracted ÏÏ spectra for IK Tau, U Ori, and o Cetare found in All three sources show a relativeFigure 4.increase in the 9.7 km feature relative to the dust emission inthe wings (near 12 km, for example), which appears near themaximum. This is clear just by visual inspection, since thedust emission at 12 km changes usually by less than a factorof 2, while the peak Ñux varies by more than a factor of 2. Inaddition, U Ori shows a spectrally narrow (D0.5 km)feature near the silicate peak arising near maximum light.While this feature is only apparent for U Ori in theFigure 4,narrow character of the s Cyg and R Aqr silicate emissionnear maximum (seen in may be of a similar nature.Fig. 2)
3.2.1. Appearance of ““Pure ÏÏ Silicates near Maximum L uminosity
While the relatively large increase in 8È11 km Ñux ascompared with 11È13 km Ñux can be partially attributed tothe dust shell temperature increase during maximum light,we will show that the large magnitude of the observedchanges implies that the dust optical constants themselvesare changing. Furthermore, the narrow emission feature ofU Ori is clearly of nonthermal origin ; the Planck functionhas no such narrow features. This is strong evidence that
much of the mid-IR emission near maximum light comesfrom relatively pure silicate dust particles, as judged by thegeneral narrowing of the silicate peak and, in the case of UOri, by the extreme sharpness of the 9.7 km resonance. Suchpure silicates may be formed from preexisting, ““ dirty ÏÏgrains that are ““ puriÐed ÏÏ via grain surface evaporation ofmetal impurities or recrystallization of amorphous grainsduring the temperature rise toward maximum light (Tielens
et al. Sedlmayr, & Gail1990 ; Stencel 1990 ; Dominik, 1993).Alternatively, the dirty silicates formed at minimum lightmay be destroyed leaving only small dust grains to emittheir distinctive spectrum et al. The(Little-Marenin 1996).lack of the narrow U Ori feature in the IK Tau and o Cetspectra could be due to di†erent shell geometries, di†erentchemical abundances, or peculiarities of recent pulsationalcycles.
3.2.2. Constructing the Color-Color Diagram
Although the qualitative changes in the spectral shapesare plain to see, it is useful to compare them with previousstudies of the silicate emission feature. A recent classi-Ðcation scheme, which is easy to implement yet reproducesmany of the important features of earlier work, is given by
& Price hereafter construct aSloan (1995, SP95). SP95color-color diagram to deÐne a one-parameter family of themid-IR spectral shapes. Following et al.Creech-Eakman
the procedure was further simpliÐed by using a(1997), SP952500 K Planck function as an approximate stellar spectrumand Ðtting it to the Ñux at 8 km (as described above). Figure
was produced from the data found in5 Figure 4.deÐne the ““ spectral emission index,ÏÏ which variesSP95
from SE1 to SE8, to parameterize the solid curve, beginningat and ending with (see Fig. 5 ofF10/F11 \ .5 F10/F11\ 1.4
the dividing lines are located on TheSP95) ; Figure 5.optical constants of & Lee andDraine (1984) Ossenkopf,Henning, & Mathis two dust optical property(1992),models commonly used in radiative transfer calculations,describe the 9.7 km spectral signature of amorphous silicatedust, a signature that places these spectra with the spectralemission indices SE5ÈSE8. further identify spectraSP95classiÐed as SE4ÈSE6 with spectra containing 10 and 11 km
FIG. 4.ÈStellar-subtracted, midinfrared spectra of IK Tau, o Cet, and U Ori. By subtracting an estimate of the underlying stellar spectrum, changes in thedust spectrum itself can be more easily seen. Each panel includes a table containing the dates of observation, mean (8È13 km) Ñuxes of the extracted dustspectra (in Janskys), and the pulsational phases. Note the prominent, narrow spectral feature near the silicate peak of U Ori, which accompanies the starÏs risetoward maximum light (see ° 3.2).

No. 2, 1998 SPECTRA OF LATE-TYPE STARS 843
FIG. 5.ÈColor-color diagram for the evolution of the dust spectra of IK Tau, o Cet, and U Ori. Data points in the lower left portion of the diagramrepresent stars near minimum light. The solid line is the power-law Ðt to the entire IRAS-LRS atlas performed by The plot is divided into regions ofSP95.similar spectral emission index (SE4ÈSE7) as deÐned by which parameterizes the narrowness of the silicate feature. The dashed line shows the e†ect ofSP95,dust shell temperature changes on a given spectrumÏs location on this diagram. See for more details.° 3.2
emission components, thought to be produced by warmcrystalline olivine & Little &(Little-Marenin 1990 ; SloanPrice Although not relevant to the spectra in this1995).paper, the lower left portion of the color-colorSP95diagram is reserved for midinfrared spectra that are verybroad (SE1ÈSE3) and are thought to originate fromalumina grains de Jong, & Willems &(Onaka, 1989 ; SloanPrice Because of the difficulty in matching the data in1995).
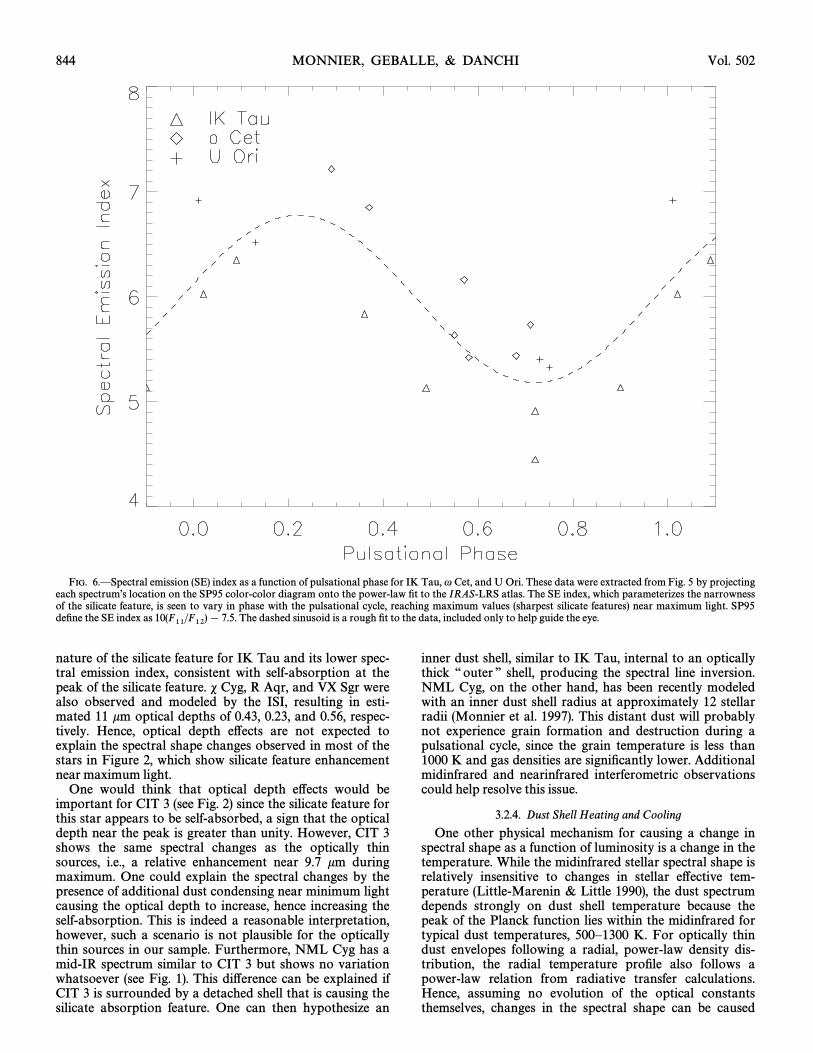
with the corresponding pulsational phases, weFigure 5have plotted the spectral emission index as a function ofpulsational phase in Figure 6.
The data from IK Tau, U Ori, and o Cet can be seen tospan a continuous range on the color-color diagramSP95(see starting at SE4 and ending with SE7. WhileFig. 5),useful for classifying the general shapes of silicate features,one cannot expect the color-color diagram to fullySP95describe the midinfrared spectral shape since only three dis-crete wavelengths are sampled, i.e., the narrow U Ori emis-sion feature observed in this study would not have a strongsignature in makes it clear that the sili-Figure 5. Figure 6cate feature variations are in phase with the pulsationalcycle, showing high spectral emission index values nearmaximum light and signiÐcantly lower values just afterminimum.
A variety of e†ects can cause changes in the spectral emis-sion index as a function of stellar luminosity. Variations inthe optical depth or temperature of the dust could causeeach starÏs location on the color-color diagram toSP95shift, especially if self-absorption is occurring at the peak ofthe silicate feature. The phase-dependent evolution of thedust optical constants responsible for changes in the SP95spectral emission index in Figures and may be related to5 6the narrow emission feature seen for U Ori. The followingsections explore these possibilities in more detail.
3.2.3. Dust Self-Absorption
If the temperature proÐle and optical properties of thedust shell remain unchanged, then overall changes in theoptical depth will not cause a shift in the spectralSP95emission index if the dust envelope remains optically thin.The ISI has obtained mid-IR visibility data for IK Tau,o Cet, and U Ori, and they were Ðtted, along with IRAS-LRS spectra, by circumstellar dust shell models assuming aspherically symmetric outÑow et al. These(Danchi 1994).models indicate 11 km optical depths of D1.7, D0.1, andD0.1 for IK Tau, o Cet, and U Ori, respectively. Hence, theoptically thin condition is expected to hold for o Cet and UOri, but not for IK Tau. This explains the more rounded
844 MONNIER, GEBALLE, & DANCHI Vol. 502
FIG. 6.ÈSpectral emission (SE) index as a function of pulsational phase for IK Tau, u Cet, and U Ori. These data were extracted from by projectingFig. 5each spectrumÏs location on the color-color diagram onto the power-law Ðt to the IRAS-LRS atlas. The SE index, which parameterizes the narrownessSP95of the silicate feature, is seen to vary in phase with the pulsational cycle, reaching maximum values (sharpest silicate features) near maximum light. SP95deÐne the SE index as The dashed sinusoid is a rough Ðt to the data, included only to help guide the eye.10(F11/F12) [ 7.5.
nature of the silicate feature for IK Tau and its lower spec-tral emission index, consistent with self-absorption at thepeak of the silicate feature. s Cyg, R Aqr, and VX Sgr werealso observed and modeled by the ISI, resulting in esti-mated 11 km optical depths of 0.43, 0.23, and 0.56, respec-tively. Hence, optical depth e†ects are not expected toexplain the spectral shape changes observed in most of thestars in which show silicate feature enhancementFigure 2,near maximum light.
One would think that optical depth e†ects would beimportant for CIT 3 (see since the silicate feature forFig. 2)this star appears to be self-absorbed, a sign that the opticaldepth near the peak is greater than unity. However, CIT 3shows the same spectral changes as the optically thinsources, i.e., a relative enhancement near 9.7 km duringmaximum. One could explain the spectral changes by thepresence of additional dust condensing near minimum lightcausing the optical depth to increase, hence increasing theself-absorption. This is indeed a reasonable interpretation,however, such a scenario is not plausible for the opticallythin sources in our sample. Furthermore, NML Cyg has amid-IR spectrum similar to CIT 3 but shows no variationwhatsoever (see This di†erence can be explained ifFig. 1).CIT 3 is surrounded by a detached shell that is causing thesilicate absorption feature. One can then hypothesize an
inner dust shell, similar to IK Tau, internal to an opticallythick ““ outer ÏÏ shell, producing the spectral line inversion.NML Cyg, on the other hand, has been recently modeledwith an inner dust shell radius at approximately 12 stellarradii et al. This distant dust will probably(Monnier 1997).not experience grain formation and destruction during apulsational cycle, since the grain temperature is less than1000 K and gas densities are signiÐcantly lower. Additionalmidinfrared and nearinfrared interferometric observationscould help resolve this issue.
3.2.4. Dust Shell Heating and Cooling
One other physical mechanism for causing a change inspectral shape as a function of luminosity is a change in thetemperature. While the midinfrared stellar spectral shape isrelatively insensitive to changes in stellar e†ective tem-perature & Little the dust spectrum(Little-Marenin 1990),depends strongly on dust shell temperature because thepeak of the Planck function lies within the midinfrared fortypical dust temperatures, 500È1300 K. For optically thindust envelopes following a radial, power-law density dis-tribution, the radial temperature proÐle also follows apower-law relation from radiative transfer calculations.Hence, assuming no evolution of the optical constantsthemselves, changes in the spectral shape can be caused

No. 2, 1998 SPECTRA OF LATE-TYPE STARS 845
only by changes in the dust temperature at the dust shellÏsinner radius, not by changes in the optical depth or locationof dust condensation from self-similarity arguments (for arecent discussion see & Elitzur Since the dustIvezic 1997).density distributions may be shell-like (from episodic massejection), consideration is also given to isothermal dust shellmodels. The e†ect of dust shell temperature variations onthe spectral shape, as parameterized by the color-SP95color diagram, can be signiÐcant. contains a curveFigure 5that shows the e†ect on the spectral emission index for anisothermal shell at various temperatures (calculations foruniform outÑow models show roughly the same magnitudeof variation and are not included on the Ðgure). Although ashell that evolves from 500 K at minimum to 1300 K atmaximum almost matches the observed variations, suchlarge changes are implausible from radiative transfer calcu-lations and observations (typically K; et*T [ 150 Danchial. 1994).
It is quite plausible then that half of the spectral changesobserved could be due to changes in the dust temperature,especially for cooler dust shells where the emission spec-trum is more sensitive to temperature. However, reasonablephysical constraints on the e†ective dust temperature andthe plausible temperature variation exclude dust heatingand cooling from being the sole explanation for theobserved changes. This is especially true for U Ori, wherethe variations of the spectral shape of U Ori, especially nearthe peak, can be seen to be too narrow to be caused(Fig. 4)by changes in the temperature alone.
3.2.5. Changing Dust Properties
Finally, the observed variability in the spectral emissionindex could be caused by changes in the dust optical con-stants themselves. This explanation has already beeninvoked to understand the narrow 9.7 km emission featureof U Ori but may explain the overall shape changes as well.Dust grain absorption characteristics may be stronglydependent on the density and temperature of the ambientgas during grain formation. The adsorption of metal impu-rities onto the surface of grains as well as the developmentof amorphous dust grains during grain growth can havesigniÐcant e†ects on the spectrum (cf. Tielens 1990 ; Stencelet al. et al. It is also known that grain1990 ; Dominik 1993).size can a†ect the mid-IR emission spectra of warm dustgrains, but this requires grains with radii larger than amicron & Pegourie Such large grain sizes(Papoular 1983).are typically not considered in preparing radiative transfermodels, where conventionally the dust grain size distribu-tion (a \ 0.25 km) observed in the interstellar medium isutilized Rumpl, & Nordsieck(Mathis, 1977).
Theoretical studies of the nucleation of carbon grainsGauger, & Sedlmayr indicate that dust(Fleischer, 1992)
formation is sensitively dependent on density and tem-perature, thus luminosity Ñuctuations or shock wave propa-gation can have unexpectedly large e†ects. Silicate grainformation theory is less well understood, but e†orts arepresently underway to create a self-consistent, sphericallysymmetric model of the circumstellar environment ofoxygen-rich Mira variables, incorporating full radiativetransfer, pulsation, and dust formation et al.(Jeong 1997).
3.2.6. Summary
In summary, a combination of dust shell temperaturechange and pulsational phase-dependent evolution of the
dust grain characteristics can explain the observed spectralshape changes seen in while the production ofFigure 2,especially ““ pure ÏÏ silicate grains is likely required to explainthe narrow (*j B 0.5 km) emission feature near the silicatepeak during maximum light of a few stars. The generalnarrowing of the silicate peak, common to most of the starsin may be due to the evaporation of impuritiesFigure 2,from the grain surfaces or restructuring of the crystal latticeduring reheating preceding maximum light. Followingmaximum light, impurities adsorb onto the grains, broaden-ing the solid state resonance. More detailed laboratorymeasurements of astrophysically realistic dust grains undervarying physical conditions would be necessary to place theabove scenario on Ðrm physical footing. While the opticaldepth is expected to increase near minimum light as addi-tional condensation occurs in the cooler circumstellarenvironment, this by itself should not strongly a†ect theshape of the dust spectrum if the dust optical propertiesremain Ðxed and the envelope remains optically thin, condi-tions met by most of the observed sources according tointerferometric and spectral measurements.
3.3. Spectral Slope Changes or Enhanced Variabilitypresents the spectral monitoring of stars whoseFigure 3
spectral shape showed either signiÐcant changes in slope oran rms shape variability larger than that expected fromobservations of standard stars. R Cnc and W Aql showedevidence of a shallower spectral slope during minimumluminosity than during maximum luminosity. Such achange in slope would be expected from heating andcooling of the dust shell. Indeed, simple calculationsdemonstrate that the observed changes are consistent with
K during the luminosity cycle and*TdustB 100È200K. A more detailed analysis can be doneTdustB 500È800
but would require information regarding the geometry ofthe dust shell, e.g., the location of dust shell inner radius anddust density distribution.
IRC ]10216 and R Leo are included in becauseFigure 3of their large rms spectral shape Ñuctuations (IRC ]10216also shows weak evidence for a spectral slope change nearmaximum light). Such Ñuctuations may be indicative of adynamic dust condensation zone, a zone permeated withatmospheric shocks and subject to chaotic dust formation/destruction processes. Alternatively, these Ñuctuations maysimply be due to a relatively poorer calibration for thesesources than for the rest of the data sample. CIT 6 and VHya (both carbon stars) also showed rms Ñuctuations some-what above the average of SpT \ 1.3%, but these were notincluded here because they did not pass the p [ 2% cut.Continued monitoring will be required to determine thetrue source of the observed changes.
4. CONCLUSIONS
The midinfrared spectra of 30 late-type stars have beenmonitored in order to detect changes occurring on the pul-sational timescale (typically 1È2 yr) of long-period variables(LPVs). Stars that exhibited little or no bolometric variabil-ity (i.e., non-LPVs) generally showed no change in theirspectral shape in the range 8È13 km. Furthermore, moststars with no strong 9.7 km silicate feature, includingcarbon stars and oxygen-rich Mira variables with broad,weak silicate features, showed no spectral shape change.However, a few such stars in this category displayed eitherenhanced variability as a function of wavelength (IRC

846 MONNIER, GEBALLE, & DANCHI
]10216 and R Leo) or a detectable change in the spectralslope correlated with pulsational phase (R Cnc and W Aql).The former e†ect has no clear explanation, while the lattere†ect can be explained by changes in the dust shell tem-perature K).(*Tdust [ 200
The most signiÐcant result presented here is that nearlyall of the observed sources with clear 9.7 km silicate featuresand deÐnite bolometric variability showed strong evidencefor changes in the silicate emission strength and spectralproÐle that are correlated with pulsational phase. We con-clude that silicate emission variation is a general property oflong-period variables with optically thin silicate features.The sharpening of the silicate feature near maximum lightand its subsequent broadening can be explained by theheating and cooling of the dust envelope coupled withchanging optical constants for the dust grains. The appear-ance of a spectrally narrow emission feature near the silicatepeak of a few stars strongly indicates the existence of““ pure ÏÏ silicate dust grains near maximum light. Wehypothesize that the general narrowing of the dust emissionspectra may arise from preexisting dirty grains whosesurface impurities have been evaporated o† or whoseamorphous molecular conÐguration has partially crys-tallized during the dust reheating following minimum lumi-nosity. The solid state resonance would naturally broadenafter maximum light as impurities readsorb onto the cooledgrain surface. Such speculation awaits more detailed labor-atory measurements of astrophysically relevant grain types.
The observations presented here remind us that the dustformation process is still only partially understood. Indeed,
uncertainties in the optical constants for circumstellar dustare a primary obstacle in creating self-consistent multi-wavelength radiative transfer models incorporating inter-ferometric observations of dusty objects (e.g., et al.Monnier
The changes observed in silicate optical properties as1997).a function of pulsational phase are not predicted by anypresent dust formation theories, and more careful consider-ation is required of the e†ects of photospheric shocks pro-pagating into the dust formation zone and of the changingtemperature and density structure due to the pulsation.Such models may then not only explain the changingoptical properties of the dust around a single, pulsatingobject, but may also explain why di†erent stars possesssilicate emission with distinctly di†erent spectral proÐles.
The authors would like to thank Charles Townes, PeterTuthill, Chris Matzner, and Irene Little-Marenin for valu-able comments. This research has made extensive use of theSIMBAD database, operated at CDS, Strasbourg, France.These observations were made as part of a long-term infra-red stellar interferometry program at U.C. Berkeley, sup-ported by the National Science Foundation (grantsAST-9315485, AST-9321289, and AST-9500525) and by theOffice of Naval Research (OCNR N00014-89-J-1583 andFDN0014-96-1-0737). Some of these spectra were obtainedas part of the UKIRT Service Programme. The UnitedKingdom Infrared Telescope is operated by the JointAstronomy Centre on behalf of the U.K. Particle Physicsand Research Council.
REFERENCESA. 1995, Baltic Astronomy, 4,Alksnis, 79M., Danchi, W. C., Hale, D., Townes, C. H., Degiacomi, C. G.,Bester,
Mekarnia, D., & Geballe, T. R. 1996, ApJ, 463, 336M. J., Stencel, R. E., Williams, W. J., & Klebe, D. I. 1997,Creech-Eakman,
ApJ, 477, 825W. C., Bester, M., Degiacomi, C. G., Greenhill, L. J., & Townes,Danchi,
C. H. 1994, AJ, 107, 1469C., Sedlmayr, E., & Gail., H.-P. 1993, A&A, 277,Dominik, 578
B. T., & Lee, H. M. 1984, ApJ, 285,Draine, 89H. M., Benson, J. A., Howell, R. R., Joyce, R. R., & Leinert, C. 1991,Dyck,
AJ, 102, 2001997, The Hipparcos Catalog (ESA SP-1200) (Paris :ESA. ESA)
A. J., Gauger, A., & Sedlmayr, E. 1992, A&A, 266,Fleischer, 321W. J., Gillett, F. C., & Stein, W. A. 1975, ApJ, 195, 423Forrest, (FGS75)J., Volk, K., Walker, H., Gerbault, F., Cheeseman, P., Self, M.,Goebel,
Stutz, J., & Taylor, W. 1989, A&A, 222, L5Science Team. 1986, A&AS, 65,IRAS 607Z., & Elitzur, M. 1997, MNRAS, 287,Ivezic, 799K. S., Winters, J. M., Fleischer, A. J., & Sedlmayr, E. 1997, in AJeong,
Half-Century of Stellar Pulsation Interpretations, ed. P. A. Bradley &J. A. Guzik (San Francisco : ASP), in press
B. V., Kholopov, P. N., Pskovsky, Y. P., Efremov, Y. N., Kukar-Kukarkin,kina, N. P., Kurochkin, N. E., & Medvedeva, G. I. 1971, GeneralCatalog of Variable Stars (3d ed. ; Moscow: Academia)
Bertre, T. 1992, A&AS, 94,Le 3771993, A&AS, 97,ÈÈÈ. 729
Sidaner, P., & Le Bertre, T. 1996, A&A, 314,Le 896I. R., & Little, S. J. 1988, ApJ, 333,Little-Marenin, 305
1990, AJ, 99,ÈÈÈ. 1173I. R., Stencel, R. E., & Staley, S. B. 1996, ApJ, 467,Little-Marenin, 806
G. W. & Wing, R. F. 1971, ApJ, 169,Lockwood, 63K. B. 1996, Ph.D. thesis, New Mexico StateMarvel, Univ.J. S., Rumpl, W., & Nordsieck, K. H. 1977, ApJ, 217,Mathis, 425J. A. 1997, AAVSOMattei, BulletinK. M. & Stein, W. A. 1976a, PASP, 88,Merrill, 2851976b, PASP, 88,ÈÈÈ. 294
J. D., et al. 1997, ApJ, 481,Monnier, 420M., & Jura, M. 1983, ApJ, 267,Morris, 179
V., Henning, T., & Mathis, J. S. 1992, A&A, 261,Ossenkopf, 567T., de Jong, T., & Willems, F. J. 1989, A&AS, 81,Onaka, 261
R., & Pegourie, B. 1983, A&A, 128,Papoular, 335G. C., & Price, S. D. 1995, ApJ, 451, 758Sloan, (SP95)
R. E., Nuth, J. A., Little-Marenin, I. R., & Little, S. J. 1990, ApJ,Stencel,350, L45
A. G. G. M. 1990, in From Miras to PN: Which Path for StellarTielens,Evolution? ed. M. -O. Mennessier (Paris : Editions Frontieres), 186
M. S. 1988, A&AS, 73,Vardya, 181N. J., & Ney, E. P. 1969, ApJ, 155,Woolf, 181