505093 / january 24, 2012 - british columbia · 5.2.7. geology 19 5.2.8. hydrogeology 20 6. a...
TRANSCRIPT
i 505093 / January 24, 2012Printed on Recycled Paper
TABLE OF CONTENTSPage
1. INTRODUCTION 1
1.1. Limitations 1
2. BACKGROUND 2
2.1. The Issues 4 2.1.1. Administrative 4 2.1.2. Technical 5 2.1.3. Approach to Regulatory Issues 7 2.1.4. Approach to Technical Issues 7
3. CONCEPTUAL SITE MODEL (CSM) 9
4. STREAMLINING SITE ASSESSMENT FOR UPSTREAM OIL AND GAS SITES IN NORTHEAST BC 11
5. DEVELOPING THE STANDARD CSM SITE CONDITIONS 14
5.1. Upstream Oil and Gas Activities 14 5.2. Physiography of Northeast BC 15
5.2.1. Topography 15 5.2.2. Site drainage 15 5.2.3. Weather 16 5.2.4. Vegetation 17 5.2.5. Muskeg / Organic Soils 18 5.2.6. Land use 19 5.2.7. Geology 19 5.2.8. Hydrogeology 20
6. A SUMMARY OF THE SITE ASSESSMENT PROCESS 22
6.1. Stage 1 PSI 22 6.2. Stage 2 PSI 23 6.3. DSI 23
7. STAGE 1 PSI IMPLEMENTATION 24
7.1. Sources of Background and Historical Information 24 7.2. Typical APEC and PCOC at Upstream Oil and Gas Well Sites 25 7.3. Revisiting the CSMs 26
8. SOIL INVESTIGATION 27
8.1. Applicable standards 27 8.1.1. Applicable Land Use and Associated Soil Standards 27 8.1.2. Organic Soils and Muskeg 28 8.1.3. Soil Assessment Design 29 8.1.4. Electromagnetic (EM) Surveys 30 8.1.5. Inspection During Well Abandonment 31
ii 505093 / January 24, 2012Printed on Recycled Paper
TABLE OF CONTENTS (Cont'd)Page
8.2. Subsurface Soil Assessment 32 8.2.1. Organic Soils and Muskeg 34
8.3. Recommended Soil Assessment Approach and Recommended Minimum Assessment Levels 34 8.3.1. Wellhead 35 8.3.2. Flaring Facilities 35 8.3.3. Drilling Waste Disposal Areas 36 8.3.4. Pipelines / Flowlines 37 8.3.5. Temporary USTs/ASTs 37 8.3.6. Other soil assessment 38
8.4. Detailed Site Investigation (Soil) 38 8.5. Recommended Techniques 38
8.5.1. Field Screening Techniques 38 8.6. Specific Issues Associated with Soil Assessment 40
8.6.1. Background Soils 40 8.6.2. Organic soil and Muskeg Sampling 40
9. HYDROGEOLOGIC INVESTIGATION 42
9.1. Background 42 9.2. Clay-rich Aquitards Conceptual Site Model – Aquitard Integrity 44 9.3. Designing the Hydrogeologic Investigation Program 47
9.3.1. Objectives 47 9.3.2. Defining the Conceptual Site Model - Scenario Testing 47 9.3.3. Scale 48 9.3.4. Phased Approach, Triggers and Weight of Evidence 48
9.4. Stage 1 PSI 48 9.5. Field Investigation (Stage 2 PSI and DSI) 49
9.5.1. Determining Potential Pathways and Receptors – Groundwater Uses 49 9.5.2. Determining the Lateral and Vertical Extent of the Clay-rich Aquitard 50 9.5.3. Determining Aquitard Integrity 51 9.5.4. Determining Hydrogeologic Properties 52 9.5.5. Determining Contaminant Concentrations 54
9.6. Further Investigation 54 9.6.1. Surface Water 56 9.6.2. Sediment 56 9.6.3. Vapour 57
10. SUMMARY AND CONCLUSIONS 58
10.1. Technical 58
11. REFERENCES 62

iii 505093 / January 24, 2012Printed on Recycled Paper
TABLE OF CONTENTS (Cont'd)Page
IN-TEXT TABLEA: Applicable Site-Specific Standards for Upstream Oil and Gas Sites - NE BC 28
DRAWINGS
� Map 1 - Regional Map Northeast BC – Western Sedimentary Basin Oil and Gas Activity� Map 2 - Regional Map Northeast BC – Existing Water Supply Wells� Map 3 - Regional Map Northeast BC – Agricultural Land Reserve� Map 4 - Regional Map Northeast BC – Wetlands / Muskeg
CSM #1
� 505093-001 – CSM#1 (fine grained soil) Site Plan with APECs� 505093-001B – CSM#1 (fine grained soil) Cross Section� Air Photograph 1A Conceptual Model (fine grained soil)� Photograph 1B: Ground Level Photograph Fine Grained Soils
CSM #2
� 505093-002 – CSM#2 (Organic Soils) Site Plan with APECs� 505093-002B – CSM#2 (Organic Soils) Cross Section� Air Photograph 2A Conceptual Site Model (organic soil)� Photograph 2B: Ground Level Photograph Organic Soils� 505093-003 – Post Abandonment Wellhead Assessment
APPENDICESI Stage 1 PSI Background Data SourcesII List of Potential Contaminants of Concern (SNC in-house reference)III Depth Dependant Standards
P:\CP\OTHER\505093\WP\R124CHDA_ MOE UOG.DOCX

1 505093 / January 24, 2012Printed on Recycled Paper
1. INTRODUCTION
The British Columbia Ministry of Environment (MoE) has contracted SNC-Lavalin Inc., Environment Division (SLE) to develop advice regarding technical guidance for the characterization of contamination at upstream oil and gas sites in Northeast British Columbia.
This document will serve to advise MoE in developing guidance for the upstream oil and gas sector. This draft guidance will be subjected to the normal process of development and public
consultation prior to finalizing and issue by the MoE.
This document, while designed to be as free-standing as possible, should be used in the context
of existing regulatory guidance documents.
The technical guidance draws on our project team’s first hand experience in the characterization of contamination at upstream oil and gas sites in northeast BC; on our experience with Alberta’s regulatory process for these activities and on our strong knowledge and experience of existing policies and guidance for other types of contaminated sites in BC. SLE collaborated with Sue Gordon, Ph.D. P.Geol. of Gordon Groundwater Consultancy for this project. Dr. Gordon provided input on report organization and content focused primarily on other jurisdictions’ approaches for upstream oil and gas sites and advice on contaminant hydrogeology investigative techniques for use in assessing aquitards.
The primary purpose of this project is to catalogue and compare regulatory approaches used by MoE, British Columbia Oil and Gas Commission (OGC) and other jurisdictions to accomplish the same goal; to adequately and efficiently assess contamination at upstream oil and gas sites.This project has necessarily identified a number of issues that, until addressed, limit our ability to accomplish this. These issues are, however, outside our scope. As such, we have identified a
number of issues that need to be addressed.
1.1. Limitations
It is necessary that those using this document possess an appropriate combination of formal education, practical knowledge, skills and experience in conducting a technically sound and rational site assessment; are familiar with applicable federal, provincial and municipal legislation and published guidelines used to evaluate the presence of contamination as well as being familiar with upstream oil and gas operations. It is the use of adequately informed professional judgement based on a weight of evidence approach that will allow for streamlining of the
assessment of these sites.

2 505093 / January 24, 2012Printed on Recycled Paper
2. BACKGROUND
The northeast region of British Columbia is experiencing increased activity in the oil and gas
exploration and production industry, collectively known as the “upstream oil and gas sector”.
This sector drills and develops oil and gas production wells and collects, transports and
processes the oil and gas through an array of different types of facilities. The sector currently
includes about 20,000 active and abandoned well sites accompanied by a network of oil and
gas distribution, processing, and storage infrastructure. A plan showing the areas of activity and
well locations is included as Map 1 in the Drawings Section. The regulation of any
contamination at these sites as well as the approximately 100 to 200 of these sites that are
permanently abandoned per year, is jointly undertaken by the OGC and the MoE. The sharing
of responsibilities is defined by the 2008 Memorandum of Understanding (MoU) between MoE
and OGC. The MoU outlines the roles and responsibilities and processes respecting the
assessment and cleanup of oil and gas sites in general as follows:
� The OGC is responsible for regulating remediation and reclamation of upstream oil and gas
sites through the Certificate of Restoration (CoR) process. This includes review of site profiles
to determine if site investigation is required under the Environmental Management Act1
(EMA) and the Contaminated Sites Regulation2
� The MoE will be responsible for the management of assessment and remediation of sites
deemed to be high risk according to the MoE risk classification system. MoE may remove the
high risk classification allowing further assessment under the OGC process and subsequent
CoR application.
(CSR). OGC also administers the priority site
classification process which determines whether a site is considered high priority. If a site is
not classified as high priority, OGC reviews assessment and remediation reports to determine
adequacy for granting of a CoR Part 1. OGC then reviews reclamation reports to determine
that the site has been adequately reclaimed before granting a CoR Part 2.
� CoR’s issued by OGC will have satisfied provincial requirements for site closure and the MoE
will consult the OGC before issuing remediation orders on any oil and gas site.
1 Environmental Management Act (EMA), S.B.C. 2003, c. 53, as am. by S.B.C. 2004, c. 18.2 Contaminated Sites Regulation (CSR), B.C. Reg. 375/96, including amendments up to B.C. Reg. 97/2011.

3 505093 / January 24, 2012Printed on Recycled Paper
While OGC has primary responsibility for managing assessment, remediation and reclamation
of these sites, the applicable standards are those established by MoE under the EMA, the
Hazardous Waste Regulation3
OGC guidance is provided to industry to manage potentially contaminating activities during
construction, operation and abandonment of oil and gas sites. These regulations often guide
“activities” rather than regulating the resulting environmental quality (e.g., “Assessing Drilling
Waste Disposal Area” (ADWDA) document (OGC undated). Complying with OGC regulation
does not necessarily satisfy the assessment requirements of MoE regulations and guidance.
In assessing the level and adequacy of assessment and remediation completed on a site the
OGC accepts a higher level of professional judgement in characterizing contaminant sources,
pathways and resulting impact to potential receptors.
(HWR) and the CSR. Currently, the requirements for
contaminant characterization are prescriptive and are provided through a large number of MoE
protocols, procedures and guidance documents. MoE guidance has been developed to be
applicable to all areas of BC; all land uses, topography and weather conditions; all soil and
groundwater conditions; and all industries, associated contaminants, and to all levels of
contamination and sensitivities of receptors. As such, the guidance documents are extensive
and complex in order to cover a broad range of conditions. All parties recognize that application
of existing guidance in the upstream oil and gas sector may in many cases be resulting in over-
assessment (defined as requiring a higher level of assessment than is warranted by the
potential risks to human and ecological receptors).
OGC regulations, however, also use a second line of evidence in a weight of evidence or lines
of evidence approach by regulating site reclamation through the CoR Part 2 application. A CoR
is not granted until a CoR Part 1 is obtained demonstrating that contamination has been
appropriately addressed and a CoR Part 2 is obtained demonstrating that the site has been
appropriately restored to surrounding conditions and vegetation has been satisfactorily
re-established. As at most upstream oil and gas sites, vegetation is the primary receptor in
agricultural and wildlands settings, OGC has a second line of evidence in identifying
contaminant conditions that would impact site ecology.
3 Hazardous Waste Regulation (HWR), B.C. Reg. 63/88, including amendments up to B.C. Reg. 63/2009.
4 505093 / January 24, 2012Printed on Recycled Paper
2.1. The Issues
As the guidance document that will ultimately result from this project is to be used by industry to
meet the requirements of OGC and MoE our approach has been to obtain input from these
stakeholder groups. Activities undertaken for this project include:
� review of existing guidance and development of a questionnaire to identify issues that
stakeholders want addressed;
� review guidance used in other relevant jurisdictions (Alberta, Saskatchewan);
� conduct first stakeholder’s meeting December 1, 2010;
� meet with Treaty 8 Tribal Association in Fort St. John on January 20, 2011;
� through these first meetings, identify key issues with existing regulatory guidance and
reconcile with upstream oil and gas activities and conditions in northeast BC;
� prepare draft outline for technical guidance as reading material for preparation of additional
stakeholder input;
� conduct second workshop February 23, 2011 to obtain comments on the technical guidance;
� incorporate feedback from the stakeholders into a draft report; and
� obtain review comments on draft report and finalize report.
Through our work in the upstream oil and gas sector and through our process of stakeholder
meetings we have identified a number of key issues. The issues can be divided into
“administrative” and “technical”.
2.1.1. Administrative
The objective of this report is to identify administrative differences between the OGC and the
MoE processes and provide approaches to unify the processes. Some of the differences reside
in the underlying acts and protocols which are not the subject of this project. As such, we have
identified a number of issues that could be addressed outside of this guidance document.
These issues are identified in the “Parking Lot” section.

5 505093 / January 24, 2012Printed on Recycled Paper
2.1.2. Technical
A wide variety of site conditions and land uses are present in areas of northeast BC. The majority
of the area, however, can be characterized by a common set of conditions present over a large
portion of northeast BC. Many (but certainly not all) upstream oil and gas sites demonstrate low
levels of contamination. OGC and industry are seeking streamlined guidance, not to address all
sites, but to address those sites where it can be demonstrated that contamination is limited and
contaminant sources, pathways and receptors meet the defined common site conditions.
By understanding the contaminants and their distribution, the site conditions that control
contaminant migration and the potential receptors, source and pathway assessment can be
streamlined. This will be accomplished by developing several standardized Conceptual Site
Models (CSM). The concept of a CSM is presented in (Golder Associates, 2010) and is prominent
in Technical Guidance 8, Groundwater Investigation and Characterization4
Once the assumed site conditions of the CSM are demonstrated at a site by a qualified
professional the guidance will provide minimum levels of historical review, soil and groundwater
assessment considered adequate to assess the exposure risks. Comment is also provided on
surface water assessment and soil vapour assessment.
.
While the objective of the guidance is to address only sites that conform with the defined CSMs,
some aspects of the guidance may be usable on other sites where not all CSM conditions
are met.
Through the input received from MoE, OGC, Integrated Land Management Branch,
Contaminated Sites Approved Professionals (CSAP), and the upstream oil and gas industry
through the questionnaire and the first meeting, the key regulatory and technical issues
identified are as follows:
Regulatory Issue #1
The CoR instrument obtained through the OGC, which is enabled under the EMA, is not
perceived as having the same legal standing as a Certificate of Compliance (CoC) from MoE as
enabled under the EMA and CSR. While the liability of the responsible party is not extinguished
under either instrument, it is perceived that the potential for ongoing liability is lower with a CoC
than with a CoR; as such, guidance will address perceived differences towards developing a
common standard. 4 Technical Guidance Document 8: Groundwater Investigation and Characterization, BC MoE, July 2010.

6 505093 / January 24, 2012Printed on Recycled Paper
Regulatory Issue #2
OGC and MoE guidance are different in a number of respects. Industry may meet OGC
guidance (i.e., Assessing Drilling Waste Disposal Areas, depth dependant standards, site
priority classification), but still have to do additional work to meet CoR Part 1 or CoC
requirements. The need for assessment of the waste disposal area to meet regulatory
standards is still required.
Technical Issue #1
Required information sources and resulting checklists used in completing an historical review
(CSR guidance 10 checklist) include information sources that are not relevant to the upstream
oil and gas sector and do not include other sources that are relevant and necessary to fully
understand areas of potential environmental concern (APECs) and potential contaminants of
concern (PCOCs).
Guidance needs to include information sources relevant to upstream oil and gas activities and
remove information sources that are not applicable to upstream oil and gas sites.
Technical issue #2
Activities on upstream oil and gas sites differ substantially from other industries but are
consistent between oil and gas sites; as such, it is reasonable to provide a standard list of
APECs and PCOCs to be investigated and standard analytical parameters for analysis.
Technical Issue #3
Applicability of land use and soil, groundwater, surface water, sediment, and soil vapour
standards are not clear for upstream oil and gas sites. Applicability of site-specific factors for
typical upstream oil and gas sites is also not well defined. Classification of organic soils and
muskeg and determination of appropriate standards is of particular interest.

7 505093 / January 24, 2012Printed on Recycled Paper
Technical Issue #4
As stated above MoE guidance covers all types of industry, site conditions and land uses
throughout BC. Application of MoE guidance can result in perceived over-assessment of many
oil and gas sites where low levels of contamination as well as limited transport pathways and
low potential for exposure of human or ecological receptors lead to low potential for
environmental impact. The intensity of assessment should be commensurate with the level of
contamination and the resulting potential for significant environmental impact.
Technical Issue #5
Highly organic soils are present on or around many upstream oil and gas sites.
Current accepted analytical methodology developed for primarily mineral soils appears to be
overly conservative for soils high in organic material and moisture content. This results in
elevated reported contaminant concentrations which may not be representative of actual
environmental risk.
2.1.3. Approach to Regulatory Issues
The roots of the regulatory issues lie in the underlying regulations and their approaches to
meeting the same objectives. OGC manages activities while MoE regulates ultimate site
conditions. The two approaches cannot be merged. We can, however, make recommendations
for attempting to develop an equivalency between the results of managing activities with the
ultimate site conditions. An example would be to review and modify the ADWDA document to
more closely meet regulatory standards such that meeting ADWDA would be considered
equivalent to an assessment meeting MoE standards. These “review and modify” activities are
beyond the scope of this document and have been identified as “parking lot” items.
2.1.4. Approach to Technical Issues
Activities and conditions present on sites in the upstream oil and gas sector in northeast BC
have a number of commonalities that influence the potential environmental impacts.
These conditions can be demonstrated on a sector wide and area-wide basis and, with limited
on-site proof-of-concept, can be used in assessing compliance with applicable regulations.
We have developed CSM that represent several common sets of conditions that describe a
large proportion of sites. If the proponent can demonstrate that their site meets the set of
conditions (proof-of-concept), the defined assessment program can be applied.

8 505093 / January 24, 2012Printed on Recycled Paper
The CSMs rely on the qualified professional having a good understanding of the contaminants,
the site conditions that control migration and the potential receptors. Our approach relies on
being able to apply regional understandings (e.g., type of site soils) to site-specific conditions
(e.g., hydraulic conductivity of soil). The better the understanding of these relationships on a
regional basis, the higher the confidence in applying them on a site-specific basis; as such,
regional studies of a number of these relationships are recommended. We have identified a
number of studies that can be completed to further the regional understanding of some site
conditions. These are identified in the “parking lot”. In the absence of these studies, a higher
level of site-specific assessment will be necessary to adequately assess a specific site and a
high level of professional judgement will also be required in order to ensure that the
relationships made and the resulting streamlining is technically supportable and is consistent
with the risks of unacceptable receptor exposure under the site-specific conditions.
This requires that those responsible for site assessment can demonstrate the appropriate level
of education and experience. A weight-of-evidence approach should be taken in evaluating
whether the level of assessment is appropriate for the identified level of contamination and the
potential exposure scenarios.
In this report we have provided “interim” approaches that may be modified or expanded through
further research. These include determination of hydraulic conductivity of the regional fine
grained soils, classification of “muskeg” (organic soil media or aquatic environment) and the
analysis of organic soils.
What sites aren’t covered
Sites within northeast BC will exhibit conditions that are not consistent with those defined for the
CSMs. Examples would be mountainous settings in the southwest and settings with granular
soils consisting of recent channel deposits or glacial outwash deposits. These sites do not fit the
assumed conditions and cannot be assessed under this standardized approach. These sites
would be assessed utilizing existing MoE guidance.

9 505093 / January 24, 2012Printed on Recycled Paper
3. CONCEPTUAL SITE MODEL (CSM)
“A conceptual site model is a three-dimensional picture of site conditions that conveys what is
known or suspected about the sources, releases and release mechanisms, contaminant fate
and transport, exposure pathways, potential receptors, and risks. The conceptual site model is
based on the information available at any given point in time and will evolve as more information
becomes available.” – US EPA.
The risk to receptors is dependent on the nature of the source (contaminants, media and
concentrations), the potential concentrations at the receptor (based on contaminant fate and
transport through exposure pathways) and the nature of the receptor itself (sensitivity, media and
duration of exposure). The purpose of site assessment is to identify and quantify each of these.
The overall process for developing a CSM through site assessment is as follows:
1) evaluate site history and general setting Stage 1 (Preliminary Site Investigation [PSI] to
identify APECs and PCOCs and site topography and proximity to potential receptors);
2) develop CSM;
3) complete “coarse” assessment of the site;
a) first stage of field investigation (Stage 2 PSI) to determine if contamination is present at
APECs and to provide information on soils and groundwater conditions);
4) determine if CSM is applicable to the site and adjust CSM based on results;
5) address data gaps;
a) additional detailed investigations (Detailed Site Investigation [DSI] to delineate
contamination and fully evaluate pathways and receptors); and
6) CSM now complete with characterization and delineation of contamination, identification of
receptors and characterization of pathways.

10 505093 / January 24, 2012Printed on Recycled Paper
CSMs consist, at a minimum, of a site plan and a cross section, generally aligned in the
direction of anticipated or measured groundwater flow. The CSM, when fully developed, defines
the contamination present at the site in all relevant environmental media, the potential human
and ecological receptors at and in the vicinity of the site and provides an evaluation of the
pathways between the two. If there is no contamination or no pathway between contamination
and receptor, there is no unacceptable environmental impact.
Once assessment is complete (i.e., all gaps in the CSM are addressed), then identified
unacceptable risks can be mitigated through remediation to numerical standards or to risk
based standards. Remediation and risk assessment are beyond the scope of this report but
comments are provided in the “parking lot” section.
11 505093 / January 24, 2012Printed on Recycled Paper
4. STREAMLINING SITE ASSESSMENT FOR UPSTREAM OIL AND GAS SITES IN NORTHEAST BC
The purpose of streamlining site assessment is to minimize the extent of site-specific
assessment activity by identifying common conditions of sources, pathways and receptors
based on commonalities in site activities at upstream oil and gas sites, commonalities in site
settings and site conditions and commonalities in site usage and ecology. Site assessment can
be further streamlined if certain relationships can be drawn between easily measured site
parameters and conditions affecting risk to receptors (i.e., relating soil grain-size and thickness
to contaminant transport parameters). On the basis of the CSMs developed for the industry
specific and region-specific conditions, it is our intent that the process of eliminating potential
land and groundwater uses and eliminating certain site-specific factors can be standardized
based on professional judgement applied to regional data, as well as site inspection and limited
soil and groundwater data collected from the site itself.
As stated above, MoE guidance is based on the presence of a broad range of land uses and
site conditions. The majority of sites in the oil and gas sector in northeast BC, however, can be
characterized as follows:
� Sector-wide similarities in site configurations, contaminant sources and waste handling
practices;
� common APECs and PCOCs between sites.
� Western Canadian Sedimentary Basin physiography, geology and related ecosystems;
� primarily poorly drained relatively flat plateau lands with or without significant thickness
of surficial organic soils or muskeg;
� primarily substantial thickness of fine grained soils;
� sites frozen approximately half the year; and
� limited groundwater drinking water resource currently in use.

12 505093 / January 24, 2012Printed on Recycled Paper
� Land Use.
� sparse human habitation;
� predominantly wild lands or agricultural land uses;
� majority of lands under Crown ownership, and First Nations traditional land use; and
� many remote locations with only limited and seasonal access.
Our approach assumes that:
� characterization of common conditions can be demonstrated on an area-wide basis;
� the presence of these common conditions can be incorporated into the CSM on a site-by-site
basis with limited site-specific assessment; and
� based on the assumptions in the CSMs, standardized assessment approaches can be
utilized that provide an adequate minimum level of assessment of the contamination,
pathways and receptor exposure.
For the purpose of this document we have defined two CSMs:
� CSM #1: assumes:
� fine grained soils to surface;
� common APECS and PCOCs associated with typical well drilling site;
� relatively flat poorly drained lands;
� sparse human habitation and wildlands or agricultural land use (no nearby buildings, no
livestock watering); and
� may be remote with limited access.

13 505093 / January 24, 2012Printed on Recycled Paper
� CSM #2: assumes:
� a thickness of orgainic soils overlying fine grained soils;
� common APECS and PCOCs associated with typical well drilling site;
� relatively flat poorly drained lands with surficial organic soils that are seasonally
saturated and muskeg in area;
� sparse human habitation and wildlands land use (no nearby buildings, no livestock
watering); and
� likely remote with limited access (vehicular access in winter only if at all).
Plans and cross-sections depicting the two CSMs are included in the Drawings Section, along
with aerial photographs and site photographs of typical sites.
14 505093 / January 24, 2012Printed on Recycled Paper
5. DEVELOPING THE STANDARD CSM SITE CONDITIONS
The following sections summarize the conditions present on many upstream oil and gas sites in
northeast BC.
These are the conditions that will be reviewed in order to justify aspects of this guidance.
5.1. Upstream Oil and Gas Activities
Upstream oil and gas refers to sites where oil and gas is being produced from the ground, and
the associated facilities to conduct the oil or gas to collection facilities. These sites include the
following (AENV, 2010).
� Prepared wellsite (not drilled) – This is a wellsite where soil salvage and preparation for
drilling is complete; but drilling at the site did not occur (no CSR Schedule 2 activities).
� Drilled and Abandoned (D&A) wellsite – Site which was drilled and abandoned (never put into
production). (Wellhead, sump/ Drilling Waste Disposal Area [DWDA], flare pit).
� Producing oil wellsite – Well which produces primarily liquid hydrocarbons from a pool or
portion of a pool (wellhead, sump/DWDA, pileline, flare facility, on-site tankage, leaks, spills).
� Producing gas wellsite – well producing natural gas (wellhead, sump/DWDA, flowline, flare
facility, leaks, spills).
� Battery site – system or arrangement of tanks or other surface equipment, together with
associated infrastructure, for receiving or holding the effluent of one or more wells
(pipeline, on-site tankage, leaks, spills).
Associated off-site disturbances (when present) may include:
� off-site drilling waste disposal areas (DWDA);
� temporary camp sites; and
� off-site spills/leaks associated with lease activity.
15 505093 / January 24, 2012Printed on Recycled Paper
As pipelines which sometimes cross a well site in a right-of-way are administered under different regulations, they are not being considered on this project except to be considered as potential
off-site APECs.
These common site activities have common APECs and associated PCOCs which can be
assumed based on site activity.
5.2. Physiography of Northeast BC
The physiographic conditions of a region include topography, site drainage, weather, vegetation,and land use. The defined CSMs are based on the presence of typical topography and geology present northeast of the Rocky Mountains in the Western Canadian Sedimentary Basin. This guidance will not generally cover the mountainous areas to the southwest or other areas of the Province where upstream oil and gas activities occur. Some aspects of the guidance (common APECs and PCOCs) will be applicable to other areas of the Province. A map
indicating the general area of oil and gas activity in BC is included as Map 1.
5.2.1. Topography
Topography in the Western Sedimentary Basin is relatively flat except where drainage courses have incised relatively steep, narrow drainage channels. To the southwest the basin meets the Rocky Mountains. This is the southern extent of our study area. In the northern part of the
region, organic soils and wetlands / muskeg are prevalent as shown on Map 4.
5.2.2. Site drainage
Drainage on the topographically flat area of the Western Canadian Sedimentary Basin is generally poor with significant seasonal variation. Through late fall, winter and early spring (approximately six months) when temperatures are below freezing, no runoff occurs. During late spring when snow melts but the ground is still frozen, drainage is dominated by surface retention of meltwater in depressions and overland flow to localized seasonal water courses.These localized seasonal water courses ultimately lead to larger permanent streams and rivers.During summer, once the ground has thawed, some infiltration of surface water occurs.During late summer and early fall there is little runoff and the land dries through evapotranspiration; as such, it is unlikely that the seasonal water courses would be considered aquatic environment due to the seasonality of flow. Professional judgement will be required in assessing the presence of aquatic environment where it is not clear that water courses
are seasonal.

16 505093 / January 24, 2012Printed on Recycled Paper
In the northern areas, many sites have organic soils or muskeg present on or near the site.
Muskeg is defined by MoE to mean:
� “boreal wetland bog, fen or permanent marsh as classified by the Canadian Wetland
Classification System and is characterized, without limitation, by a surface or near-surface
water table and a preponderant presence of peat, Sphagnum mosses and sedges.”
(MoE Procedure 8)
Under certain circumstances, organic soils could be considered terrestrial soils in that they are
only seasonally saturated and hence don’t fit the definition of muskeg . In these areas, surface
water flow during summer and early fall is through the organic soils or seasonal water courses.
For the purpose of this report, muskeg will not be considered an aquatic receiving environment
unless surface water is present for more than half of the frost-free season. Where surface water
on muskeg is present for more than half of the frost-free season, compare surface water and
peat chemistry to ambient Water Quality Guidelines (WQGs) and CSR sediment criteria,
respectively. Where surface water on muskeg is present for less than half of the frost-free
season, compare surface water and peat chemistry to CSR numerical groundwater standards
and soil standards, respectively.
A detailed study of when and whether a particular muskeg site is considered an aquatic vs. a
terrestrial receiving environment is beyond the scope of this report. Recommendations for
further assessment have been included in the “parking lot” section of this report. We understand
that MoE will ultimately develop muskeg and wetland use standards. In the interim, professional
judgment will be required in determining if a site or the surrounding area should be considered
terrestrial or aquatic environment.
5.2.3. Weather
As stated above, this region has average monthly temperatures below freezing for five months
to six months of the year. The area receives about 450 mm of precipitation through the year with
about 150 mm during months when the ground would be frozen. Winter precipitation (snow)
accumulates on site and melts in spring prior to the ground thawing. As such, snow melt is
drained through seasonal drainage courses resulting in limited infiltration to the subsurface.
In many areas vehicular access is not possible during breakup (when the ground is thawing in
spring/early summer). In muskeg areas vehicular access may only be possible in winter months
when the ground is frozen.
17 505093 / January 24, 2012Printed on Recycled Paper
5.2.4. Vegetation
The northeast region of BC known commonly as the Peace River Region is part of an extensive
belt of boreal coniferous forest occurring across Canada. In BC, this zone is known as the
Boreal White and Black Spruce (BWBS) biogeoclimatic zone and it displays some unique
ecotypes which are not found anywhere else in BC.
We can generalize and describe the BWBS zone as an area where winters are long and cold
and the growing season short; the ground remains frozen for much of the year. Numerous past
fires have created extensive successional forests of aspen and lodgepole pine and where flat,
the landscape is typically a mosaic of black spruce bogs (muskeg) and white spruce and
trembling aspen stands.
We can further generalize when describing the dominant ecotypes in the Peace River Region.
The first ecotype can be described as an upland mesic ecotype dominated by heavy clay soil
with several tree species and an abundance of shrubs, herbs and mosses. The second
dominant ecotype can be described as a lowland one with very wet organic soils (muskeg) and
a substantially different vegetation complex commonly populated by one or two tree species,
mosses, herbs, and a very limited number of shrubs.
Upland Sites
Generally speaking, upland well-drained sites contain 40% to 70% tree cover made up of white
spruce, trembling aspen, lodgepole pine, and black cottonwood depending on aspect, slope
position, and soil composition.
This vegetation description is for silt and clay rich soils, generally formed on morainal,
glaciofluvial or lacustrine deposits.
Lowland Sites
Again, generally speaking, lowland sites are considered to be muskeg and generally contain
20% to 25% ground cover largely made up of black spruce with a minor component of
tamarack.

18 505093 / January 24, 2012Printed on Recycled Paper
This vegetation description is for slope position ranges from level to depressional with very little
variation. Soils in these settings (muskeg) are generally classified as organic as they are
developed on organic parent materials.
Rooting
The typical tree species found in both upland and lowland settings in northeast BC are generally
characterized by shallow rooting systems (http://www.for.gov.bc.ca/hfp/silviculture/Compendium/).
However, there is a lack of scientific literature on the distribution of roots for these species in
northeastern BC. Many important limiting factors surrounding root system development are
present. These can include cool temperatures (especially in subsoils), soil physical condition
(elevated bulk density and soil strength in B and C horizons) and also wet or water logged
conditions. Based on our observations, these conditions together typically result in root
development in the upper 1 m of soil, and usually it is concentrated within the upper 30 cm in
association with LFH, A, or upper B horizons, or with organic soil horizons in peatland
environments.
However, very few fine and very fine roots may occasionally be observed in subsoil horizons
(B, BC or C horizons) and may extend to below a depth of 1 m. Little is known on the
distribution of these roots; however, they may play a role in accessing water during drought
conditions. Caution should be exercised in applying generalizations in areas that are not
underlain by clay and silt rich parent materials where root development may extend deeper in
the soil profile (i.e., well drained medium to coarse grained fluvial or glacio-fluvial deposits).
5.2.5. Muskeg / Organic Soils
As stated above for the purpose of this report, true muskeg will be treated as an “aquatic
receiving environments”. Muskeg where surface water is not present for half the frost-free
season will be treated as terrestrial habitat, and CSR soil and groundwater standards will be
applied.

19 505093 / January 24, 2012Printed on Recycled Paper
5.2.6. Land use
Land use in the region is predominantly wildlands or agricultural land use. In some areas, sites
are in the agricultural land reserve (ALR). A map showing ALR areas in northeast BC is included
as Map 3 in the Drawings section. Habitation is sparse. For the purpose of the CSMs it is
assumed that there are no residential or commercial buildings proximate to the site and
groundwater is not used for drinking water supply. Irrigation of agricultural land from groundwater
sources is not common due to low groundwater yields. Livestock watering may occur in some
agricultural areas through excavation of dugouts; however, these largely collect surface runoff
rather than groundwater.
The majority of lands are Crown owned and subject to First Nations traditional land uses.
Many sites are remote with only limited seasonal access. This implies that for the majority of
sites, frequency and duration of human exposure to the site will be, at most, very limited.
5.2.7. Geology
The main surficial deposits in much of northeast BC consist of fine grained soils including tills
and glaciolacustrine deposits that overlie the Western Canadian Sedimentary Basin bedrock
(shale, siltstone, sandstone), with thicknesses of 0 m and up to 100 m or more. Typically silts
will have a hydraulic conductivity of 10-5 m/s to 10-8 m/s and clays will have a hydraulic
conductivity of 10-8 m/s to 10-12 m/s.
Near-surface fracturing of the fine grained soils may occur as a result of frost action and
seasonal soil desiccation. At some locations, localized sand layers are observed within the fine
grained soils.
Where incised drainage channels are present there can be fluvial deposits of sand and gravel.
The proposed CSMs in this report would not be applicable to sites in these soil conditions.
In the northern areas, many sites have organic soils or muskeg present on or near the site.
At many locations, low level metals exceedences have been identified in soil including, arsenic,
barium, boron, cadmium, selenium, sodium, and molybdenum. These may represent
background concentrations.

20 505093 / January 24, 2012Printed on Recycled Paper
5.2.8. Hydrogeology
A highly generalized regional hydrogeologic setting in northeast BC consists of deep saline
aquifers in the Cretaceous Western Canadian Sedimentary Basin (WCSB), overlain by much
shallower potable aquifers in younger bedrock and glacial-fluvial overburden, which themselves
are covered by clay rich tills and glaciolucustrine deposits over a significant portion of the area.
The WCSB is a massive wedge of sedimentary rock that can reach up to six kilometres in
thickness, is approximately 1.4 million square kilometres in area and represents a time span of
over 600 million years. Subsurface geology in northeast BC can be quite complex; but
generally, there is a layer of recent unconsolidated glacially derived material (Quaternary
< 2.5 million years) lying on top of bedrock (> 60 million years). In some areas, the Pleistocene
clay-rich tills and glaciolacustrine sediments completely cover the glaciofluvial sands and
gravels. Oil and gas producing zones in the WCSB are typically found at depths of
approximately 800 m to 3,000 m. Depth to bedrock varies considerably over the region from
surface outcrop to greater than 500 m. However, it commonly ranges from 50 m to 150 m in
depth below the ground surface. Most potable groundwater sources are found in the shallowest
unconsolidated horizons lying at depths ranging from 0 m to 150 m (BC OGC, 2010; Levson et
al., 2005).
Groundwater is generally present at shallow depth (at least seasonally) at sites represented by
the CSMs. The groundwater is present in the thin organic or muskeg soils and sometimes in thin
sand lenses or in secondary permeability (fractures) in the fine grained soils. The ability of the
subsurface to act as an aquifer will be determined as defined in Technical Guidance 65
5 Technical Guidance Document 6: Water Use Determination, BC MoE, Version 2, July 2010 (effective
February 1, 2011).
(BC MoE, 2010a), based on hydraulic conductivity and yield. It is anticipated the limited shallow
groundwater flow is through the sand layers, fractures in fine grained soils or the shallow soils
including the organic soils. Where deeper groundwater is considered a resource that requires
protection, it will generally be below the fine grained soil in deeper unconsolidated material or
within the bedrock. The thickness of the protective layer (aquitard) will need to be determined if
a subsurface investigation is required.

21 505093 / January 24, 2012Printed on Recycled Paper
For the purpose of this report the CSM has assumed minimal shallow groundwater flow.
Future work towards refinement of upstream oil and gas guidance should include compilation of
soil and groundwater data from existing sources in order to identify areas where groundwater is
considered a resource (parking lot). Discussed in Section 9.1, there is also a need to have a
regional geological understanding related to depositional environments and stratigraphy in order
to provide more certainty on the ability of the fine grained material to protect the groundwater
resources that may be under or adjacent to an upstream oil and gas site.
In groundwater, low level metals concentration exceedences are sometimes identified, including
iron, manganese, magnesium, cadmium, sulphate, and cobalt in groundwater.

22 505093 / January 24, 2012Printed on Recycled Paper
6. A SUMMARY OF THE SITE ASSESSMENT PROCESS
The same principles for investigating contamination at other industrial sites apply to upstream oil
and gas sites; however, as described previously, the conditions in northeast BC can result in
some differences. Under the CSR, site investigation is required under several conditions,
including orders, spills, etc.; however, for the most part, site investigation will be triggered by
completion of a site profile. Under the OGC process the site profile is submitted with the CoR
Part 1 application.
This section describes the key elements in the investigation program with reference to existing
regulatory guidance and policy. These documents include investigation checklists
(Technical Guidance TG10 and TG116) as well as guidance for the characterization of site soil
(e.g., TG1, 2, 5, and 16 and Protocol 47), sediment (TG198), groundwater (TG6, 8, 13, and 15
and Protocol 99), and vapour (TG410
6.1. Stage 1 PSI
).
Based on the Site Profile checklist, it is probable that commercial or industrial activities as
described in CSR Schedule 2 have taken place at an upstream oil and gas site; therefore, a
Stage 1 PSI will likely be required.
6 Technical Guidance Document 10: Checklist for Reviewing a Preliminary Site Investigation (PSI), BC MoE,
revised October 2005.Technical Guidance Document 11: Checklist For Reviewing a Detailed Site Investigation, MoE, June 2005.
7 Technical Guidance Document 1: Site Characterization and Confirmation Testing, BC MoE, July 2009.Technical Guidance Document 2: Statistical Criteria for Characterizing a Volume of Contaminated Soil, BC MoE, January 2009.Technical Guidance Document 5: Sampling and Determining Soil pH at Soil Relocation Receiving Sites, BC MoE, October 2005.Technical Guidance Document 16: Soil Sampling Guide for Local Background Reference Sites, BC MoE, June 2005.Protocol 4; Protocol for Contaminated Sites - Determining Background Soil Quality, MoE, October 15, 1999.
8 Technical Guidance Document 19: Assessing and Managing Contaminated Sediments, MoE, August 2005.9 Technical Guidance Document 6: Water Use Determination, BC MoE, Version 2, July 2010 (effective
February 1, 2011).Technical Guidance Document 8: Groundwater Investigation and Characterization, BC MoE, July 2010.Technical Guidance: Groundwater Model (Version 2009), updated June 2009.Technical Guidance Document 15: Compliance Points for the Protection of Aquatic Receiving Environments(Version 1, Draft 5), BC MoE, August 2009.Protocol 9; Protocol for Contaminated Sites - Determining Background Groundwater Quality, MoE.
10 Technical Guidance Document 4: Vapour Investigation and Remediation, BC MoE, September 2010.

23 505093 / January 24, 2012Printed on Recycled Paper
The objectives of a Stage 1 PSI are to identify the potential areas of contamination and the
potential contaminants of concern at a given site. Information is also collected to help determine
the likelihood of contamination and its distribution and fate in the environment. These objectives
can be achieved by:
� developing an understanding of current and historical land uses at the site and on
neighbouring properties; and
� forming a preliminary interpretation of the physical environment of the site.
A complete and adequate Stage 1 PSI should either provide assurance the CoR application is
complete without a Stage 2 PSI because contamination is unlikely, or provide information that
can direct a Stage 2 PSI at the site.
6.2. Stage 2 PSI
A Stage 2 PSI is intended to assess the presence / absence of contamination (PCOC) within
each APEC identified during the Stage 1 PSI, and compare the results to standards contained in
the HWR and the CSR (Schedules 4, 5, 6, 9 10 etc.). A Stage 2 PSI consists of sampling
relevant environmental media by intrusive or non-intrusive methods (i.e., drilling, water
sampling, electromagnetic conductivity surveys, etc.).
6.3. DSI
If the scope of the Stage 2 PSI is sufficient and no contamination is identified then a CoR Part 1
application can be made and a DSI is not required. If contamination of any media is identified
above applicable standards, a DSI is required to further characterize and delineate
contamination as well as identify potential receptors and assess potential pathways.

24 505093 / January 24, 2012Printed on Recycled Paper
7. STAGE 1 PSI IMPLEMENTATION
7.1. Sources of Background and Historical Information
The sources of relevant background information for upstream oil and gas sites are different from
those listed in TG10 for urban industrial sites. Given that oil and gas sites are predominantly
located outside of urban centres, fire insurance maps and city (or reverse) directories are
generally not available.
A list summarizing the typical historical information sources that are considered applicable for
conducting the historical review portion of a Stage 1 PSI on an upstream oil and gas site is
included in Appendix I.
Background physiological data is key in forming an understanding of environmental risks at a
site and is the basis for developing a preliminary interpretation of site conditions for a CSM
identifying potential contaminant sources, pathways and receptors. A variety of data sources
related to site physiography exist. A list summarizing the typical sources of physiological data is
also included in Appendix I.
It is recognized that on older sites, where legislation was not in place for recording site activities,
the location of drilling waste disposal areas or flaring facilities may be unknown. The Stage 1
PSI is expected to exhaust all reasonable avenues to locate these APECs. It is the responsibility
of the assessor to determine if the historical information is adequate to determine the presence
of all APECs on the site.
The Stage 1 PSI should include:
� Review of client and relevant government files relating to the site;
� Aerial and Satellite Imagery Review;
� Site Reconnaissance; and
� Interviews.
Details on what these should include are included in Appendix I.
25 505093 / January 24, 2012Printed on Recycled Paper
7.2. Typical APEC and PCOC at Upstream Oil and Gas Well Sites
Typical historical site APECs at upstream oil and gas sites include the well head, leakage from
the well casing, drilling waste disposal areas, flaring facilities, spills and ongoing leaks during
operation of the well, and leaks from storage facilities or piping.
An understanding of site operations and production status is key in determining the applicable
APEC at a given site. A summary of common APEC and their associated PCOC and regulated
analytical parameters at upstream oil and gas wellsites is provided in Appendix II.
Other possible APECs are described in subsequent sections.
Over the life of a producing well, various production related facilities (e.g., wellhead,
pipelines/flowlines, flare pit, buildings, etc.) may be abandoned or decommissioned.
These facilities typically constitute consideration as APECs in a Stage 1 PSI. However, if the
resource company is able to provide supporting documentation, a rationale may be formulated
to discount the location of a given former facility as an AEC after the Stage 1 PSI investigation.
Environmental observations and/or data collected during abandonment are examples of
supporting documentation that may be used to evaluate the risk associated with a particular
APEC. If a pipeline/flowline (related to site activity) is known to be present, it should be
considered an APEC, but may be discounted based on observations indicating no
environmental stresses and well head assessment, indicating no significant contamination
relating to the pipeline/flowline.
Often temporary camps were established on or near a well site during drilling. Due to the
temporary nature of these camps and the limited potential for contamination, they would not
normally be considered APECs. The camp site should be inspected during the site
reconnaissance but unless signs of contamination are identified no further assessment
is warranted.
Pipelines crossing the site in a right-of-way are managed separately and should be considered an
off-site APEC. As such, potential impacts should only be assessed as they could affect the site.
The result of a Stage 1 PSI is to define physiography, site activities, site use, and surrounding
land/water use, geology/hydrogeology and have determined soil, groundwater, surface water,
sediment, and soil vapour standards applicable to the site.

26 505093 / January 24, 2012Printed on Recycled Paper
In relation to this guidance we have also determined that the site meets the defined conditions
of the CSM.
7.3. Revisiting the CSMs
Based on insertion of the observed site conditions into the CSM we have now defined APECs and
PCOCs and potential human and ecological receptors. We now design the intrusive investigation
to confirm these and to evaluate the potential pathways.
27 505093 / January 24, 2012Printed on Recycled Paper
8. SOIL INVESTIGATION
8.1. Applicable standards
A list of applicable land uses is provided in Section 1 (Definitions) of the CSR and corresponding
soil standards are listed in Schedules 4 and 5. Based on Section 11 of the CSR, numeric
standards for urban park land use are considered to be applicable in wildlands settings.
Additional relevant information is found in Part 5 and 6 of the CSR and TG6.
8.1.1. Applicable Land Use and Associated Soil Standards
Applicable land use is determined by comparing uses of the site to the definitions in Section 1
(Definitions) of the CSR. Initially, the land use determination will be based on historical
information and expected future use of the site. This determination would be confirmed by direct
observation during the site inspection. Zoning and land use restrictions (i.e., Agricultural Land
Reserve or Range Tenure) should also be researched through the appropriate municipal and
provincial government agencies. On active well sites the applicable land use is typically
industrial. Where the site is to be abandoned and the lease terminated, typically the CSR
wildland (WL) or agricultural (AL) standards will apply. The land uses have corresponding
standards in schedules 4, 5 and 10 of the CSR.
In all cases, soil quality below a depth of 3 m is compared to commercial standards independent
of the land use at surface. MoE has depth dependant standards that can be applied in the
immediate vicinity of the well head. OGC has depth dependent standards that can be applied at
any distance from the well head.
These depth dependant standards differ somewhat between OGC and MoE and are illustrated
in Appendix III. The MoE depth dependent standards are defined in Part 6 Section 17 of the
CSR.
Matrix Numerical Site-Specific Factors
Once the applicable land use standards are determined, the appropriate site-specific factors
based on presence and proximity of local receptors (Schedule 5 CSR). Site-specific factors and
associated comments are listed in Table A.
28 505093 / January 24, 2012Printed on Recycled Paper
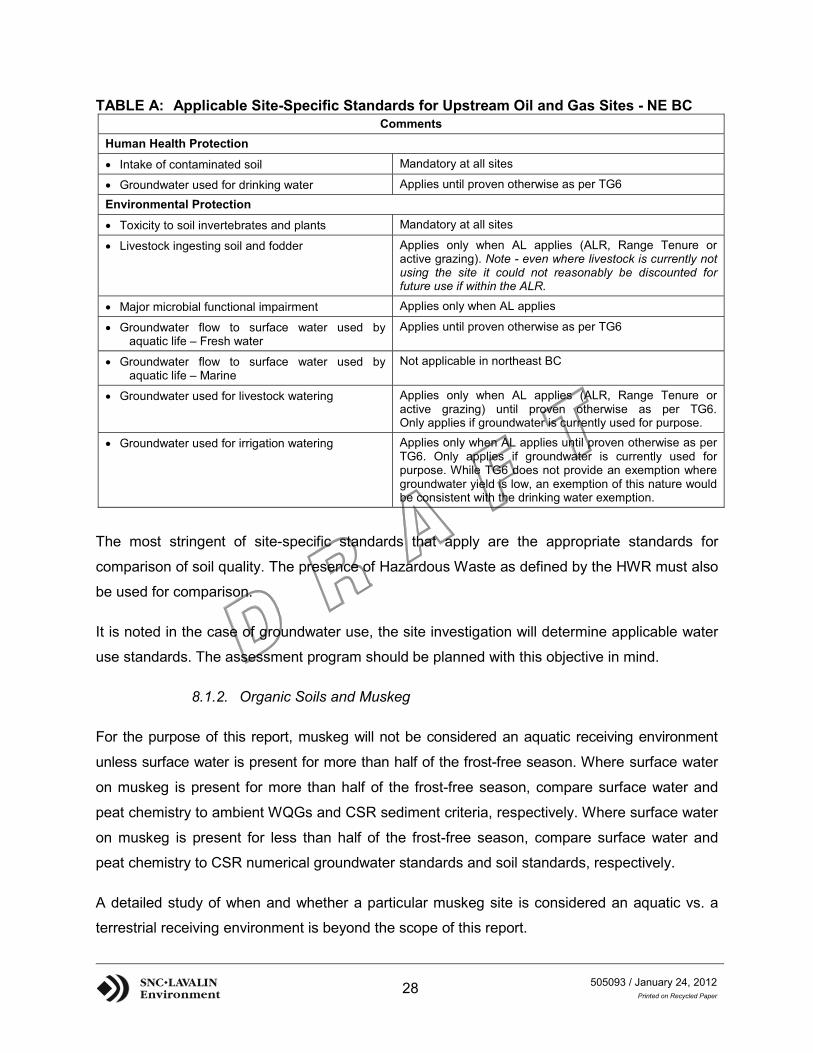
TABLE A: Applicable Site-Specific Standards for Upstream Oil and Gas Sites - NE BCComments
Human Health Protection
� Intake of contaminated soil Mandatory at all sites
� Groundwater used for drinking water Applies until proven otherwise as per TG6
Environmental Protection
� Toxicity to soil invertebrates and plants Mandatory at all sites
� Livestock ingesting soil and fodder Applies only when AL applies (ALR, Range Tenure or active grazing). Note - even where livestock is currently not using the site it could not reasonably be discounted for future use if within the ALR.
� Major microbial functional impairment Applies only when AL applies
� Groundwater flow to surface water used by aquatic life – Fresh water
Applies until proven otherwise as per TG6
� Groundwater flow to surface water used by aquatic life – Marine
Not applicable in northeast BC
� Groundwater used for livestock watering Applies only when AL applies (ALR, Range Tenure or active grazing) until proven otherwise as per TG6. Only applies if groundwater is currently used for purpose.
� Groundwater used for irrigation watering Applies only when AL applies until proven otherwise as per TG6. Only applies if groundwater is currently used for purpose. While TG6 does not provide an exemption where groundwater yield is low, an exemption of this nature would be consistent with the drinking water exemption.
The most stringent of site-specific standards that apply are the appropriate standards for
comparison of soil quality. The presence of Hazardous Waste as defined by the HWR must also
be used for comparison.
It is noted in the case of groundwater use, the site investigation will determine applicable water
use standards. The assessment program should be planned with this objective in mind.
8.1.2. Organic Soils and Muskeg
For the purpose of this report, muskeg will not be considered an aquatic receiving environment
unless surface water is present for more than half of the frost-free season. Where surface water
on muskeg is present for more than half of the frost-free season, compare surface water and
peat chemistry to ambient WQGs and CSR sediment criteria, respectively. Where surface water
on muskeg is present for less than half of the frost-free season, compare surface water and
peat chemistry to CSR numerical groundwater standards and soil standards, respectively.
A detailed study of when and whether a particular muskeg site is considered an aquatic vs. a
terrestrial receiving environment is beyond the scope of this report.

29 505093 / January 24, 2012Printed on Recycled Paper
Clearly with the present state of knowledge, professional judgement will be important in
assessing the presence of muskeg.
8.1.3. Soil Assessment Design
At this stage the CSM is based only on published regional data, file review and observations
from the site inspection and is used to develop the assessment strategy for the Stage 2 PSI.
The CSM will illustrate:
� Site setting:
� topography and drainage based on airphotograph review and site inspection.
� Geology and hydrogeology:
� based on published data.
� APECs and PCOCs:
� based on file review, site inspection and interviews.
Potential receptors
This provides a preliminary understanding of potentially contaminated areas and contaminants,
potential migration pathways and potential receptors. Where technical decisions are required in
evaluating whether the site meets the conditions of the CSM, specialist input is recommended
from a qualified professional. This may include biologists to evaluate the presence of aquatic
environments or hydrogeologists to assess applicable groundwater use standards.
If no APECs were identified in the Stage 1 PSI (e.g., a site where the pad was built but a well
was not drilled and no indications of contamination were observed during the site inspection),
no further work is required and a CoR Part 1 application can proceed. This is consistent with
Alberta regulation.

30 505093 / January 24, 2012Printed on Recycled Paper
Specific APEC may be discounted provided the documentation reviewed in the Stage 1 PSI is
sufficient to demonstrate that there is limited potential for contamination or that contamination
was adequately addressed prior to or during well abandonment. For instance, over the life of a
well, various on-site facilities (e.g., sump, wellhead, pipelines/flowlines, flare pit, buildings, etc.)
may have been abandoned or decommissioned. These facilities typically would be considered
as APECs in a Stage 1 PSI. However, if the historical review provides supporting
documentation, a rationale may be formulated to discount the APEC without further
assessment. Environmental observations and/or data collected during abandonment are
examples of supporting documentation that may be used to evaluate the potential risk
associated with a particular APEC.
The next step is to design an intrusive soil assessment. As a minimum the soil investigation will
identify or confirm the following:
� site geology and stratigraphy including any stratification that could affect bulk soil properties;
� characterization of soil for level of contamination at identified APECs for identified PCOCs;
� characterization of physical properties of soils with respect to assessing potential pathways;
and
� characterization of properties of secondary features such as rootlets and fractures with
respect to assessing potential pathways.
Depending on the completeness of the site data in the Stage 1 PSI, the location of APECs on a
site may not yet be known.
8.1.4. Electromagnetic (EM) Surveys
If the location of drilling waste disposal areas or flare pits are not known an electromagnetic
survey (EM) may be a useful tool to help identify APEC locations. EM surveys measure the
conductivity of the subsurface and results are typically mapped using GPS technology.
The resulting image presents a spatial conductivity distribution of the surveyed area and can
identify areas of potentially elevated conductivity. Areas of elevated conductivity may indicate
ionic contamination, such as salt, changes in stratigraphy or soil moisture, and/or buried metallic
or conductive debris.
31 505093 / January 24, 2012Printed on Recycled Paper
Results can provide valuable information at the screening level to assist in identifying APECs
(i.e., flare pit or DWDAs). The EM survey is commonly used as a screening tool to identify
possible APEC through a lateral soil conductivity distribution. These APEC typically include
buried steel structures (pipelines, etc.) or soil conductivity anomalies caused by exposure to
chemicals or produced water. The survey also helps in identifying areas of the site which have
normal or background conductivity, and aid in the identification or confirmation of APEC
identified through other components of the Stage 1 PSI. Typically EM surveys are done
comparing variations in average conductivity at lesser and greater depths (EM38 – 0 m to
1.5 m, EM31 – 0 m to 8 m).
The CSM site plans in the Drawing section of this report show overlayed EM survey results.
An important limitation, particularly where sites are accessed in winter, is that snow cover will
reduce the effective depth of the survey, potentially muting the response. Depending on the
level of interpretation required for site assessment purposes, a registered professional
geophysicist may need to be consulted.
Results from EM surveys should be verified by laboratory analyses of soil samples collected in
the field at a frequency that is commensurate with the level of confidence required at the
particular phase of investigation (initial site screening versus closure sampling).
8.1.5. Inspection During Well Abandonment
During well abandonment activities, the abandonment crew cuts and caps the well head,
removes any associated pipelines or flow lines within the lease and removes other facilities that
may be on site. Valuable data can be obtained if environmental inspections and sampling can
be completed during abandonment. As a minimum, this could include inspection of soils around
the well head and inspection of removed pipelines and/or pipeline trenches. Sufficient data may
be collected to rule out APECs from further assessment.
On the basis of the results of the Stage 1 PSI, the EM survey (if completed) and any inspection
work completed prior to or during abandonment, a robust sampling plan is designed for the soil
assessment.

32 505093 / January 24, 2012Printed on Recycled Paper
8.2. Subsurface Soil Assessment
Investigative techniques for the assessment of soil conditions are based on standard techniques
that are defined in a number of existing technical guidance documents (TG1, TG10).
Generally, the investigative techniques include collection of representative shallow and deeper
soil samples for field screening and subsequent laboratory analysis. Analysis of soil samples
provides information on the physical properties of the soil and the soil quality relative to the
applicable standards. There is a range of techniques from collection of shallow soil samples with
hand tools to collection of samples with excavators or drill rigs. While drilling has the advantage
of allowing assessment to greater depths, the depth that can be reached by an excavator is
often sufficient where soils are fine grained and vertical migration is expected to be limited.
While drilling produces minimal surface disruption and provides good quality discrete samples,
test pitting allows the assessor to observe the bulk characteristics of the soils in the test pit and
allows better interpretation of the nature and depth of soil fracturing and oxidation and other
potential secondary permeability features. At upstream oil and gas sites access may be
restricted, long and seasonal. It is often desirable to complete assessment with a single piece of
equipment in one site visit. Where assessment has to extend below about 5 m and only one
piece of equipment can be mobilized to the site, a drill rig is recommended.
There are also a number of in situ soil testing techniques including direct push technologies.
There are a number of references which address the pros and cons of these various
techniques, so we will only provide comment here as to specific advantages and disadvantages
with respect to assessment of upstream oil and gas sites. These more advanced techniques
would likely only be employed on complex sites where contamination is significant and migration
is significant.
A wealth of information exists on the design and execution of environmental site assessments.
In BC, TG1, TG10 and TG1211 provide guidance on the principles of contaminated site
characterization including important “how to” elements for carrying out site investigations and
related statistical calculations in the context of the CSR.
11 Technical Guidance Document 12: Statistics for Contaminated Sites, MoE, October 2005.

33 505093 / January 24, 2012Printed on Recycled Paper
Selection of assessment locations is based on the results of the Stage 1 PSI and should take
into consideration identified gaps in the CSM with respect to contaminant source, horizontal and
vertical extent, migration pathway, and known or suspect receptors. The intensity of the
sampling program should be commensurate with the extent and complexity of the contaminant
distribution and the significance of the potential receptors based on available information.
The following table summarizes the various sampling approaches that are often used in
contaminated sites assessment.
Sampling Approach Description CommentsPreferential / Judgement
Investigator targets known APEC or evidence of contamination.
� Suitable for initial screening and characterization of hotspots.
� Can bias population estimates high, especially where field screening is used to select samples for analysis.
� Results not ideal for statistical purposes.Systematic Grid Typically used when investigator lacks
information on location of APEC or distribution of contamination is not well understood (not from a point source).
� Suitable for initial screening. � Spacing ranges from 5 m to 50 m
depending on type and mechanism of contamination.
� Frequency should also reflect certainty in location and inferred risk associated with APEC.
Random Sampling Used to characterize a single suspect or known population.
� Can be useful for obtaining statistical information on a known or suspect single population (i.e., DWDA).
The highest quality soil samples are generally obtained through hollow stem auger drilling or
geoprobe drilling techniques where discrete soil samples can be collected from specific depths.
Solid stem augering produces good quality samples at shallow depths. Discrete soil samples
are recommended. The collection of composite samples may be inappropriate for various
classes of contaminants (i.e., volatile) and can result in uncertainties regarding contaminant
distribution. There may be instances where composite sampling is appropriate and relevant
technical guidance can be found in TG1 and TG12.
As with fine grained soils anywhere, contaminant migration through the soil matrix is restricted due to the fine grained nature of the soil. Contamination can be present in thin permeable layers
or in secondary permeability features such as rootlets and fractures, if present.
Assessment techniques should therefore not only assess matrix soil quality but be designed to
identify the presence, extent and continuity of these features.
34 505093 / January 24, 2012Printed on Recycled Paper
8.2.1. Organic Soils and Muskeg
As stated previously, organic and muskeg soils are soils with a high organic content and high
moisture content. As such, laboratory analysis of these soils using similar methodologies to
mineral soils results in several effects as follows:
� Naturally occurring organics in the soil tend to mask analytical results for petroleum
hydrocarbons. Some research recommends using silica gel cleanup on samples with high
organic content to remove naturally occurring polar organics. Other references recommend
collection of a background soil sample from an unaffected area for analysis. The naturally
occurring organics would then be subtracted to provide a more accurate hydrocarbon
concentration. This approach would require additional research prior to recommendation.
� Laboratory analysis of mineral soils is reported on a dry weight basis. In soils with high
moisture content (as high as 80%), this results in an exaggerated reported concentration
when weight of contaminant is compared to the dry weight of the “solid” portion of the sample.
Accepted laboratory methods report results on a dry weight basis consistent with MoE
accepted methodologies. An alternate approach would be for analytical results in organic
soils to be reported on a wet weight basis to provide a concentration more representative of
the concentration to which soil invertebrates would be exposed. This may not be an approach
that can be accepted as “standards based” assessment but can be considered on a
weight-of-evidence basis in Screening Level Risk Assessment. This proposed methodology
will require some further research to ensure it is scientifically supportable.
8.3. Recommended Soil Assessment Approach and Recommended Minimum Assessment Levels
The following provides guidance on the level of assessment considered adequate at the Stage 2
PSI assessment level to characterize soil quality at some common APEC on upstream oil and
gas sites. The proposed minimum assessment levels are consistent with current MoE guidance.
The APEC that are present on the majority of sites include the wellhead, flaring facilities, drilling
waste disposal area, pipelines or flowlines, and temporary tankage during well drilling.
The level of effort required to find the drilling waste disposal area, as well as environmental site
assessment requirements for other areas of the site will be site-specific.
35 505093 / January 24, 2012Printed on Recycled Paper
Existing guidance is considered adequate for the other common oilfield APEC (i.e., tanks,
buildings, etc.), when present.
8.3.1. Wellhead
Characterizing the environmental quality of soil in the vicinity of the wellhead at the time of
abandonment is desirable. This allows inspection of soil conditions and sampling of soils and
backfill in the immediate area of the wellhead. If the wellhead has not been cut and capped at
the time of assessment or a post-abandonment assessment is to be completed, the objectives
should include the following:
� Characterization of shallow soil from the immediate vicinity of the wellhead (1 or 2 samples).
If characterizing backfill, the recommended sampling frequency is 1 sample per 30 m3
consistent with TG2. These samples should be collected manually consistent with ground
disturbance protocols.
� Completion of three investigative locations (borehole or test pit) to a minimum depth of 3 m
(depth of cut and cap) centred on, and at an approximate distance of 5 m from the wellhead.
The distance from the wellhead may vary depending on ground disturbance protocols.
� Collection of a sufficient number of samples from each investigative location to characterize
each stratigraphic unit encountered including backfill and underlying undisturbed soils.
A schematic showing recommended assessment locations is provided on Drawing 505093-003.
8.3.2. Flaring Facilities
Flare pits and stacks are always considered APEC unless sufficient documentation is available
to confirm they were never used. If a flare pit was built but not used, confirmatory sampling from
the flare pit area is not required. If flare tanks were used, confirmatory sampling is not required,
unless spillage was determined from the historical review.
Where the locations of these facilities remain unknown, professional judgement based on
conventions of site configuration and Stage 1 PSI information (e.g., interviews, site
reconnaissance observations) should be used in deciding on the frequency and location of
assessment and sampling locations. An increased level of effort should be made to locate
former flare pit locations given they often present significant risk to the environment. If the flare
36 505093 / January 24, 2012Printed on Recycled Paper
location cannot be determined, an increased level of grid sampling should be undertaken with
any anomalous results further delineated.
Representative samples should be collected from the base of the flare pit on a 5 m to 7 m grid
consistent with TG1 with a minimum of two sample locations (test pit or borehole) to ensure
adequate characterization. Any sludge and underlying soils should be characterized at each
sampling location. A minimum of three samples should be collected to characterize perimeter
berms.
8.3.3. Drilling Waste Disposal Areas
The most common form of drilling waste disposal is mix-bury-cover and this guidance focuses
on it. OGC, Alberta and Saskatchewan have checklists for assessing drilling waste disposal
areas to determine compliance. Compliance is determined by completion of one of several
checklists. The checklist used is dependent on the type of drilling fluid and activities used during
drilling. In BC, even if the DWDA is compliant with the appropriate OGC checklist, direct
sampling to demonstrate compliance with the CSR is required. With further research, comparing
field screening results to laboratory analytical results, the checklist compliance approach may
be demonstrated to be consistent with CSR requirements. This is a “parking lot” issue.
Unless post-disposal confirmatory sampling demonstrates suitable environmental quality of the
drilling waste / soil mixture, the DWDA (mix-bury-cover or landspread wastes) will be considered
as an APEC. Drilling wastes disposed at surface can be characterized by employing a
systematic sampling grid over the DWDA.
The minimum sampling requirements below are for characterization of the drilling waste
disposal area after its location has been identified.
The following table provides the recommended minimum number of investigative locations to be
completed within a DWDA, and is based on the OGC’s ADWDA document.
Depth of Well or Combined Depth of Contributing Wells Minimum Number of Investigative Locations
<1,500 m 31,500 m to 2,500 m 4
>2,500 m 5
37 505093 / January 24, 2012Printed on Recycled Paper
The investigative locations should be selected to provide representative coverage of the full
areal extent of the disposal area. Discrete representative samples should be collected from
each investigative location at approximate 1 m depth intervals and/or to characterize distinct
stratigraphic units. Collection of samples from overlying cap material and from underlying soils
may be desirable to evaluate the potential for contaminant migration.
TG2 may be useful in the interpretation of environmental quality data from DWDAs, particularly
where based on professional judgement, the material is determined to be homogeneous and
representative of a single population.
8.3.4. Pipelines / Flowlines
Pipelines within legally surveyed right-of-ways should be treated and assessed as off-site
APEC. In order to evaluate if subsurface impacts have resulted on the subject site as a result of
the operation of off-site pipelines, soil quality should be assessed (on site) at a depth similar to
that of the buried line or near surface, where valves or pigging stations are known to exist near
the site. Pipeline trenches may also act as preferential pathways and should be assessed if
these have the potential to affect conditions on site.
For producing well sites, on-site pipelines or flowlines should be assessed at a sampling
frequency of one sample per 10 m to 30 m of the on-site length. Assessment locations should
be biased towards the terminus and any joints along the pipe. If the pipeline/flowline has been
cut at the lease boundary a sample should be taken in this area. If pipeline inspections and
integrity testing were completed during operation and environmental observations and sampling
was completed during abandonment, an argument may be made for reduced sample density.
8.3.5. Temporary USTs/ASTs
Above ground storage tanks (ASTs) that contained hydrocarbons are considered APEC.
If surficial staining is present Stage 2 PSI assessment should be completed. If the tank stored
produced water a Stage 2 PSI is required.
If a consultant was present during the removal of an underground storage tank (UST) that
contained only hydrocarbons and there was no evidence of staining, this information should be
submitted in the CoR application as the basis for not requiring further assessment. If staining or
other indicators of a release were observed, a Stage 2 PSI is required in the tank area.

38 505093 / January 24, 2012Printed on Recycled Paper
If the underground storage tank contained produced water, a Stage 2 PSI is required, even if a
consultant was present during the tank removal.
If an environmental consultant was not present when the underground storage tank was
removed, a Stage 2 PSI is required to determine if spills or releases occurred.
8.3.6. Other soil assessment
Systematic grid sampling of areas of a site should only be necessary when the locations of
APEC cannot be identified through historical records. Judgement sampling should be used to
assess any anomalies identified (from EM survey, depressions identified through site inspection
or areas of stressed vegetation or staining).
8.4. Detailed Site Investigation (Soil)
Following the Stage 2 PSI assessment the CSM is further populated with data and, if
contaminated areas, pathways and receptors require further assessment then a DSI is designed.
If a Stage 2 PSI identifies contaminant concentrations in excess of the applicable HWR or CSR
standards, a DSI is typically completed to further characterize the contamination, the vertical
and horizontal extent of the soil contamination, and to evaluate the potential migration of the
contamination to adjoining properties. For remote upstream oil and gas sites or where access is
particularly difficult, the DSI may be completed concurrently with the Stage 2 PSI, based on field
observations. This approach depends a great deal on observations and field screening without
supporting analytical data. This can result in the risk of assessing more than required or not
enough.
8.5. Recommended Techniques
8.5.1. Field Screening Techniques
A variety of technologies is available for field screening of soil samples for typical oilfield
contaminants. These technologies can be useful for decision making during field assessments
or remediation to support decisions for selection of samples for laboratory analysis.
Field screening will aid in identifying the most likely areas to analyze but each analysis plan will
depend on the standards to which you are comparing and the screening results achieved
(i.e., more stringent standards and low screening results will likely result in higher frequency of
sampling because correlations will be difficult to achieve).

39 505093 / January 24, 2012Printed on Recycled Paper
The most common PCOC for which we screen are hydrocarbon based (crude oil, diesel and
condensate) and salt based (produced water, mud additives). The following are typical
screening approaches for each:
Hydrocarbons
Vapour measurements using PID’s, combustible gas meters etc., can measure relative
differences in vapours between one sample and another; but they are not typically effective with
heavy end hydrocarbons; have varied success with diesel (depending on how degraded it is);
and are relatively effective with condensate. In all these cases observations combined with
professional judgment (i.e., where will the contamination most likely be, at surface or at depth, is
the material disturbed, obvious odours, sandy material vs. fine grained, etc) are typically the
most effective method of screening samples for analysis.
We note there are other field screening techniques or field tests that can be used to detect mid
to heavy end hydrocarbons including turbidimetric test kits (i.e., Dexsil Corporation’s
PetroFLAG®), portable infrared detector test kits, UV fluorescence detection kits, and portable
colorimetric test kits. All of these have limitations that typically include interference from organic
matter, use of solvents to prepare tests and reliability in clay soils.
Produced Water
Saturated Paste, direct read soil salinity meters and Quantabs® are also methods that can be
effective ways to determine relative salt concentrations. The following is a brief description of
each:
Saturated Paste – an electrical conductivity meter is used to screen a sample of paste that is
prepared with a 1:1 ratio of soil and distilled water, shaken, left for approximately 10 minutes to
20 minutes (time must be consistent between samples to compare), and shaken prior to
measuring electrical conductivity from the paste.
Direct reading soil salinity meters – Typically a meter with a probe consisting of one to four tines
inserted into the soil a minimum of 1 cm depth, which is then recorded into the meters data
logger to compute soil conductivity in Siemens/meter or other comparable units. The meters
sometimes have different settings for soil types for more uniform results between samples.
Readings are usually near instantaneous. We note based on experience this method is quick
but is extremely sensitive to different soil types and moisture content and not effective in organic
soils or coarse grained soil.

40 505093 / January 24, 2012Printed on Recycled Paper
Quantabs® – Are similar to pH strips and are used widely in the industry to test chloride
concentrations in water and waste water. They can be used with the saturated paste technique
as well. For water this method is effective but making a paste first presents challenges with time
and costs as compared to laboratory analysis.
All these methods can produce data that correlates well with concentrations of gross and
moderate salt contamination but are not typically useful for low levels of salt contamination that
still may be greater than standard (i.e., with low responses, the highest readings may not
correlate with the actual highest concentrations that could still exceed standards).
Regardless of screening technique used it is important to be as consistent as possible on how
the screening is done from one sample to the next in order to appropriately identify where the
anomalies are noted. Again visual observations (i.e., is the soil type the same, is the moisture
content affecting the results etc.) are also important in the screening process and it is imperative
to know the limitations of your screening techniques.
8.6. Specific Issues Associated with Soil Assessment
8.6.1. Background Soils
At many locations, low level metals exceedences have been identified in soil which may
represent background concentrations including, arsenic, barium, boron (regulated for AL only),
cadmium, selenium, sodium, and molybdenum
8.6.2. Organic soil and Muskeg Sampling
Under certain circumstances, organic soils could be considered terrestrial soils in that they are
only seasonally saturated and hence don’t fit the definition of muskeg . In these areas, surface
water flow during summer and early fall is through the organic soils or seasonal water courses.
For the purpose of this report, muskeg will not be considered an aquatic receiving environment
unless surface water is present for more than half of the frost-free season. Where surface water
on muskeg is present for more than half of the frost-free season, compare surface water and
peat chemistry to ambient WQGs and CSR sediment criteria, respectively. Where surface water
on muskeg is present for less than half of the frost-free season, compare surface water and
peat chemistry to CSR numerical groundwater standards and soil standards, respectively.

41 505093 / January 24, 2012Printed on Recycled Paper
A detailed study of when and whether a particular muskeg site is considered an aquatic vs. a
terrestrial receiving environment is beyond the scope of this report. Recommendations for
further assessment have been included in the “parking lot” section of this report. We understand
that MoE will ultimately develop muskeg and wetland use standards. In the interim, professional
judgement will be required in determining if a site or the surrounding area should be considered
terrestrial or aquatic environment.
Further investigation is required into analytical methods and reporting of analytical results of
organic soil samples. The issues to be resolved relate to masking of hydrocarbon results due to
the presence of naturally occurring organic material and the reporting of soil concentrations on a
dry weight basis. For the purpose of this document, we are proposing that silica gel cleanup be
used on organic soil samples to remove polar organics, and suggest that background organic
soil samples be collected from unaffected locations in the immediate area of the site and
analyzed using the same methodology as the site organic soil samples. In this way, the
influence of naturally occurring organics can be understood. It may be suitable to simply
subtract the “background” concentration from the site organic soil sample results.
With high moisture content soils, reporting of analytical results on a dry weight basis inflates the
results. While this is the approved analytical reporting format, reporting on a wet weight basis
may be more representative of actual concentrations to which receptors are exposed.
Seasonality
As stated previously, many sites are remote and may only be accessible on a seasonal basis.
This makes repeat sampling and sampling under specific seasonal conditions very difficult. It is
our opinion that the proponent should be able to provide an argument for limited seasonal
sampling based on professional judgement. This argument should take into consideration the
overall risk to potential receptors and should also take into consideration that the CoR Part 2
process provides a second line of evidence in a weight-of-evidence approach. If it cannot be
demonstrated that suitable vegetation can be re-established then a CoR will not be granted.

42 505093 / January 24, 2012Printed on Recycled Paper
9. HYDROGEOLOGIC INVESTIGATION
9.1. Background
This section provides technical guidance on hydrogeologic investigations at upstream oil and gas
sites situated in the tills and glaciolacustrine deposits of northeast BC. Both stakeholder
workshops selected these settings as priorities because they are the most common sites and also
present the greatest investigative challenges for upstream oil and gas sites in northeast BC.
The key challenges identified are:
� appropriate level of investigative detail; primarily with uncertainties or inconsistencies in the
number of boreholes and monitoring wells and the appropriate techniques related to
adequate borehole seals, water level recovery times, representative groundwater elevations,
and samples;
� lack of information:
� on the fracture network in tills and glaciolacustrine deposits and as a corollary a lack of
knowledge and understanding of key contaminant transport and attenuation processes
in these tills and glaciolacustrine deposits;
� on the distribution, particularly the depth below the tills and glaciolacustrine deposits, of
any potable underlying aquifers;
� lack of publically available regional studies of the:
� hydrogeology of shallow aquitard/aquifer systems (e.g., less than 150 m) in northeast
BC; and
� background quality of shallow groundwater (e.g., less than 150 m) in northeast BC.
These challenges create uncertainties in the required level of subsurface investigation at
upstream oil and gas sites situated in these fine grained unconsolidated deposits.
More specifically, it is often difficult to determine a reasonable level of effort that can be
scientifically defended using professional judgement.

43 505093 / January 24, 2012Printed on Recycled Paper
The tills and glaciolacustrine deposits in this conceptual model are assumed to be clay-rich
aquitards; the terminology used in this section instead of the more generic terms used in earlier
sections. Aquitards are considered here to be geologic deposits of sufficiently low hydraulic
conductivity, and sufficient areal extent, thickness and geometry, to impede groundwater flow
between or to aquifers. Aquitards with more than 10% to 15% by weight clay-sized particles
behave hydrogeologically as clayey units (e.g., extremely low matrix hydraulic conductivity that
does not increase appreciably with larger percentage of clay size particles). A subsurface
investigation in clay-rich aquitards focuses on the porous media properties and groundwater;
hence, this component encompasses the broader approach of a hydrogeologic investigation.
The hydrogeologic investigation will address the aquitard integrity which refers to the capability of
an aquitard to provide protection to an underlying aquifer (discussed further in Section 9.2).
The numerous references on conducting hydrogeological investigations (e.g., BC MoE, 2003;
BC MoE, 2010; BC MoE, 2010; CCME, 1994; EPA, 1993; Golders Associates Ltd., 2010) are
more applicable for the characterization of contamination at downstream sites and in particular, for
more permeable deposits. They do not provide the level of guidance needed to adequately
characterize contamination of tills and glaciolacustrine aquitards at upstream oil and gas sites in
northeast BC. Guidance provided here relies heavily on Cherry et al. (2006) and Bradbury et al.
(2006), who provide comprehensive and scientifically defensible information on the state of the
science and technical guidance on contaminant transport through aquitards, respectively.
USEPA Ohio (2009) provides high level regulatory guidance for the evaluation of aquitard integrity
which is a useful comparison for the range in scope compared to the level of detail in the two
previously mentioned references.
This information presented here is a guide not a manual. This technical guidance is written for
hydrogeological studies specific to aquitard integrity. The existing guidance on other assessments
and techniques not related to aquitard integrity (e.g., sampling protocols, field and laboratory
analytical procedures) should still be applicable. The guidance provided here reflects the balance
between the need to provide reliable interpretations of site conditions with that of funding
limitations and/or unquantifiable complexities in aquitard hydrogeologic systems. Therefore, this
guidance uses an information framework with a combination of quantitative results from minimum
standards which are supported by qualitative data. Acceptable gaps in knowledge should be
based on professional judgement. Depending on the certainty required, additional technique may
be required using the information provided here or more extensively in Cherry et al. (2006) and
Bradbury et al. (2006).

44 505093 / January 24, 2012Printed on Recycled Paper
The assumption for the minimum requirements is a reliance of on-site information. When the
regional studies noted above become available, the level of uncertainty will be reduced and thus
more opportunity to be flexible with requirements beyond the minimum standard. The guidance
focuses on:
� technical challenges to investigate aquitard integrity;
� alignment with existing regulatory guidance; and
� reasonable phased investigation to provide the certainty required based on the consideration
of the risks.
9.2. Clay-rich Aquitards Conceptual Site Model – Aquitard Integrity
This section draws from the key aquitard references noted in Section 9.1. The additional
references quoted are from within these reports.
The role of aquitards in groundwater protection depends on the interrelationship of geology,
groundwater flow and contaminant type. Aquitards can decrease the susceptibility of underlying
ground water to contamination by increasing both time of travel and the flow path distance from
contamination. Three main factors that affect aquitard integrity are: geologic framework,
hydrogeologic characteristics and contaminant properties.
Geologic Framework
The geologic origin of the aquitard and the post-depositional history are more important indicators
of aquitard integrity than the thickness. The integrity of many clay-rich aquitards that were
exposed at ground surface during their geologic history, including deposition from glaciers in
northeast BC, can be affected by the resulting contraction fractures formed from wetting/drying or
freeze/thaw effects. The dominant fractures are vertical, but horizontal fractures can also be
present. The density of fractures and preferential pathways typically decreases with depth below
the oxidized zone, but can extend to 10 m to 15 m below the top of the oxidized zone and perhaps
deeper. If the aquitard is composed of different sedimentary units, fractures in deeper units may
have formed when these units were exposed at surface and then remained open after burial.
Evidence indicates the presence of deep, active fractures for many clay-rich aquitards.
The integrity of an aquitard generally increases with increasing thickness; however, even large
aquitard thickness (>50 m) should not be used without other lines of evidence to conclude that
there is absence of open, fully penetrating fractures.
45 505093 / January 24, 2012Printed on Recycled Paper
Extensive diffusion-controlled aquitards tend to have a particular geologic origin such as lake or
marine deposition with minimal weathering or structural disturbance after deposition.
This suggests that the glaciolacustrine deposits may have a lower potential to be fractured than
the tills. Regional studies would be needed to confirm this. However, site studies cannot assume
that fractures do not exist without evaluating the aquitard integrity.
A laterally extensive aquitard can provide more or less protection of an underlying aquifer
depending on the part of the aquitard under consideration. Near the edge of an aquitard, for
example, an underlying aquifer may be semi-confined or unconfined because flow paths can
easily bypass the aquitard. As the aquitard thickens or deepens away from its periphery, an
underlying aquifer may be increasingly protected.
Hydrogeologic Characterization
Although geologic designation of an aquitard can be a useful starting point in an aquitard integrity
investigation, hydraulic profiles are needed to identify the zone contributing most strongly to the
integrity. Clay-rich aquitards are commonly designated as such based on geologic features, such
as grain size (e.g., clayey strata); however, field studies using vertical hydraulic head profiles
commonly show that only a small part of the geologically designated aquitard thickness provides
nearly all of the resistance to groundwater flow.
Hydrogeologic properties of aquitards often vary over a much larger range than for aquifers
because of fractures and preferential flow paths. Aquitards can be more anisotropic than aquifers;
hydraulic conductivity can be much higher in the horizontal than vertical direction due to
stratification, which has important implications to interpretation of slug test data from monitoring
wells. Conversely, vertical fractures may cause the vertical hydraulic conductivity component to
greatly exceed the horizontal component (Cherry et al., 2006). As well, the hydraulic conductivity
of the upper weathered and often fractured layers can result in significantly higher hydraulic
conductivities than the deeper unweathered zone. For example, tills in SW Ontario can be visibly
weathered to depths of 4 m to 6 m with hydraulic conductivities 2 to 3 orders of magnitude greater
in the weathered zone than in unweathered zone ((McKay et al., 1993).

46 505093 / January 24, 2012Printed on Recycled Paper
Contaminant Properties
Diffusion dominated contaminant transport in clay-rich aquitards that have no preferential
pathways such as fractures, root holes or other discontinuities for groundwater flow and
contaminant migration results in travel time scales of hundreds or thousands of years.
Preferential pathways greatly diminish the integrity of many aquitards because the velocity of
contaminant migration in these pathways can be many orders of magnitude greater than in the
matrix material. Vertical fractures are the most common type of preferential pathway, and even
fractures with commo������������ ��������������������������������������������
The propensity for a contaminant to migrate through an aquitard, particularly if the aquitard is
fractured, depends strongly on the contaminant type. Transport of dissolved contaminants in a
fractured clay-rich aquitards is expected to be controlled by (1) advection through the fractures;
(2) diffusion into the porous matrix; and (3) retardation processes such as sorption, precipitation
and degradation in both the fractures and the porous matrix. The migration front for dissolved
contaminants transported by groundwater flow in fractures will be slower due to diffusion-driven
chemical mass transfer from the fractures into the low permeability matrix. If the fractures are
not large, the matrix-driven retardation effect can be strong enough to allow fractured aquitards
to have considerable integrity with respect to dissolved contaminants. Hence, if the fractures are
very small (��������� ������������������������������� ����������������� ��!�� �������� nants.
If compounds are strongly sorbing, the combined effects of matrix diffusion and sorption, even
transport in larger fractures is insignificant.
Dense non-aqueous liquids (DNAPLs) have the strongest propensity to penetrate through
fractured aquitards. The driving force due to large density and the minimal viscosity of many
"#$%&� �!!��� ����� ��� ������ �� � �!��� ��� ����� ��!!� �������� ��� �� ���. Because of the
buoyancy effect, light non-aqueous phase liquids (LNAPLs) have much less tendency than
DNAPLs to migrate downward through aquitards. However, in some circumstances, continued
release of LNAPL to the subsurface can cause sufficient thicknesses to exceed fracture entry
pressures and drive the free phase product downward into fractures below the water table.
Cherry et al. (2006) report on a study by Oliveira and Sitar (1985), where LNAPL was found far
below the water table in a clay-rich aquitard in California. It should be determined if any of the
waste with the salty produced water may be denser than water. If non-aqueous phase liquid
(NAPL) is present, diffusion into the porous matrix will act as a long term source of contamination.
47 505093 / January 24, 2012Printed on Recycled Paper
9.3. Designing the Hydrogeologic Investigation Program
9.3.1. Objectives
This investigative component will use scientifically defensible techniques and professional
judgement to develop a CSM, assess its applicability to the Clay-rich Aquitard CSM, identify
APEC, PCOCs, relevant receptors triggers, and ensuing investigative requirements for a
particular upstream oil and gas site.
9.3.2. Defining the Conceptual Site Model - Scenario Testing
The CSM frames the decisions to acquire information and develop interpretations. The testing of
the applicability of the appropriate scenario requires knowledge of the clay-rich aquitard
(geologic framework, hydrogeology properties, and contaminant characteristics and distribution)
and on the identification of on-site and relevant off-site receptors. The CSM is adapted and
revised until the study objectives are met.
Two main CSM scenarios are expected to apply at upstream oil and gas sites situated in the
clay-rich aquitards in northeast BC. At a site where there is a relatively thick sequence of clay
rich glacial deposits (e.g., 20 m to 40 m or more), the primary concern may be the lateral
migration of groundwater and contaminants towards nearby wetlands and ditches. In this
situation, the focus will be on sand lenses at any depth and fractures in the shallower weathered
and oxidized zone. At a site, where the clay-rich deposits are relatively thin (<10 m), the main
concern will be downward flow and contaminant migration. In this case, the focus will be on
identifying the presence of deep, possibly widely spaced, fractures. A shallow flow system will
still need to be investigated at this type of site.
Ideally, testing of these CSM scenarios would benefit from regional geologic and hydrogeology
studies of aquitard/aquifer systems in the area. As discussed at the February 23, 2011
workshop, this is an important study to initiate because it would allow for an improved
representation of the CSM, and thus, a more efficient and productive field verification process
for both industry and regulators.

48 505093 / January 24, 2012Printed on Recycled Paper
9.3.3. Scale
Scale issues address both temporal and spatial aspects of the hydrogeologic investigation in
order to ensure that adequate data is collected over time and across the site and off site, if
necessary. The well lease is typically approximately 120 m x 120 m. For investigation in
clay-rich aquitards, the appropriate number of samples and locations will be dependent on the
fracture network and the ability to reasonably monitor it and is discussed further in Section 9.5.
9.3.4. Phased Approach, Triggers and Weight of Evidence
The phased investigation approach and triggers for moving onto the next stage are the same as
other contaminated site investigation (TG8). Access constraints requiring winter field programs
may result in a condensed field program. Any limitations in using this approach must be
presented and justified that the results are representative and the investigation provides
adequate spatial and temporal coverage.
The weight of evidence approach is the recommended approach. Justification for the techniques
used and the level of effort will need to be provided by a qualified professional based on the
level of certainty required.
9.4. Stage 1 PSI
The Stage 1 PSI discussed in previous sections should include a preliminary determination of
the hydrogeologic setting based on existing information that would include the following:
� topography� geology and stratigraphy� thickness and distribution of
geological and fill materials
� distribution of potential aquifers� structural make-up of the
subsurface � precipitation and general climatic
records� surface drainage features
� drainage characteristics of soils� land use, surface vegetative cover
and surface water bodies � groundwater and surface use in the
area
This stage of the investigation is similar to that at other contaminated sites, although the
information gathered on APECs and PCOCs will be specific to upstream oil and gas sites as
discussed in earlier sections. If APECs are identified, the assembled information should be
evaluated to assess the potential for contamination of the environmental media, including the
aquitard. The preliminary CSM should be refined for a hydrogeologic focus on aquitard integrity.
It will also serve as a basis for planning the next phase of the field investigation, the Stage 2 PSI.
49 505093 / January 24, 2012Printed on Recycled Paper
9.5. Field Investigation (Stage 2 PSI and DSI)
A subsurface field investigation program should be initiated if APECs have been identified from
the Stage 1. It is recommended that the intrusive field program focus on examining the integrity
of the aquitard and a preliminary evaluation of whether it may be contaminated.
Groundwater samples may not need to be collected if the aquifer integrity investigation confirms
that rate of groundwater flow is minimal such that contaminant concentrations will not exceed
the applicable criteria for any groundwater uses identified in the field investigation. The level of
effort is similar to a Stage 2 PSI described in TG8. However, there is a reduced emphasis on
flow through porous media in the vertical direction and more on fracture flow. In the shallow
zones, if the fracture network is extensive enough to be considered, it may need to be treated
as an equivalent porous media. If any further field investigation is required it will focus on the
characterization of groundwater contamination and will follow the regulatory guidance provided
in TG8 for a DSI, particularly if contamination along the shallow groundwater pathway is shown
to be of concern. If vertical migration is also an issue then aquifer integrity must be investigated
further using greater resolution and likely additional techniques.
9.5.1. Determining Potential Pathways and Receptors – Groundwater Uses
The CSM scenarios discussed in Section 1.5 provide the basis for determining pathways and
potential receptors as required in TG6, which requires that “groundwater at a site is suitable for
current and future uses and is of adequate quality to protect adjacent water uses”. Two main
potential migration pathways should be considered. The first is whether the integrity of the
clay-rich aquitard is such that vertical migration of any potential contaminant will not adversely
affect a groundwater use in an underlying aquifer. The other main potential pathway is lateral
migration of contamination through any shallow weathered zones to reach an aquatic receptor.
Consideration must also be given to whether a contaminated aquitard could serve as a long
term source of contamination even if there is minimal groundwater flow.
Evaluation of the existence of any vertical pathways is in consideration of three potential
groundwater uses: drinking water (DW), livestock water (LW) and irrigation water (IW).
Evaluation of any potential migration in a shallow flow system will need to address groundwater
concentrations related to aquatic life use (AW). TG6 and Schedules 6 and 10 of the CSR
provide the specific criteria (concentrations, distances, and properties of the media) to
determine whether any of these uses apply at the site. For the vertical pathways, the TG6
50 505093 / January 24, 2012Printed on Recycled Paper
evaluation addresses aquitard thickness, bulk hydraulic conductivity, uniformity, presence of
fractures, continuity across the extent, and predicted migration pathway and contaminant
concentration with depth. There is good overlap with the previous discussion Section 9.2 on
critical factors affecting aquitard integrity. Hence, the evaluation of aquitard integrity will provide
answers to the questions required in TG6. However, the guidance provided here, based on the
references and practical experiences, recommends a deeper depth to investigate and outlines
the practical challenges in estimating vertical hydraulic conductivity, the presence of fractures
and distribution of the aquitard, and the contaminants within it. Finally, it is noted that not all
aquitards hydraulically confine aquifers beneath them, i.e., in those cases, the hydraulic head in
the underlying aquifer is not above the elevation of the base of the aquitard. Of particular
relevance to this guidance, is that a large confining head (i.e., a hydraulic head in the underlying
aquifer is significantly above the base of the aquitard indicating upward vertical flow) does not
imply strong aquitard integrity (Cherry et al., 2006).
9.5.2. Determining the Lateral and Vertical Extent of the Clay-rich Aquitard
Given that clay-rich aquitards can have variable laterally continuity and thickness, the following
should be undertaken as a minimum requirement.
1) Building on the background regional geology information collected in Stage 1, and any other
existing geological and geophysical interpretation, mapping, determine as best as possible,
how the depositional environment is likely to have created the potential for the formation of
fractures and review the stratigraphy for indications of thickness, grain size, and
discontinuities. Bradbury et al. (2006) provide an overview of the applicability of various
regional techniques.
2) An intrusive program with test pits and boreholes is recommended. Intrusive drilling programs
in clay-rich aquitards typically use hollow or solid stem augers, direct push, and sonic and
rotary drilling techniques. Bradbury et al. (2006) provide detailed comparison of these drilling
methods that would be applicable to clay-rich aquitards. Cross-contamination techniques and
cautionary drilling in sources zones particularly for NAPL, as noted in standard manuals, apply
here. At the site level, a minimum of three boreholes should be installed if significant soil
contamination is identified. The literature suggests that at least one borehole should be
installed to depths greater than 10 m to prove a minimum thickness for aquitard integrity.
This should be installed outside any APEC. The locations of the other boreholes will need to
51 505093 / January 24, 2012Printed on Recycled Paper
be based on site conditions and should supplement the existing information. Both these
techniques will also need to address the homogeneity of the aquitards properties and
uniformity of thickness.
9.5.3. Determining Aquitard Integrity
Determining the degree of protection that aquitards provide to underlying aquifers is a
challenging task. Characterizations based on primary porosity will often provide erroneous
conclusions if the secondary porosity is controlling groundwater flow due to fractures, joints and
other macropores. Therefore, site investigations should use methods that are designed to
determine the local stratigraphy and to check for the presence and extent of fracturing on a
site-specific basis. Knowledge of the stratigraphy including depositional and post-depositional
history can also greatly aid in predicting the hydraulic properties of a site, as demonstrated by
Melvin and others (1992) and Simpkins and Bradbury (1992 [Christy et. al., 2000]) (From Cherry
et al., 2006).
Geologic information on its own is rarely, if ever, adequate, and should always be supplemented
with other types of data. The literature describes many methods for investigating aquitards.
Information on hydrogeologic setting (Belitz and Bredehoeft, 1990, Neuman and Neretnieks,
1990, Simpkins et al., 1996), hydraulic head (Eaton, 2002, Eaton and Bradbury, 2003, Rophe et
al., 1992), aquifer pumping tests with piezometers in the aquitard (Grisak and Cherry, 1975,
Neuman and Witherspoon, 1972, Rowe and Nadarajah, 1993), hydraulic conductivity
(Shaw and Hendry, 1998, Williams and Farvolden, 1967, van der Kamp, 2001), and
hydrochemistry and isotopes (Hendry, 1988; Hendry, Wassenaar, and Kotzer, 2000; Nativ et al.,
1995; Nativ and Nissim, 1992; Pucci, 1998; Pucci, 1999; Remenda, van der Kamp, and Cherry,
1996; Stimson et al., 2001), is typically necessary to establish a high degree of certainty about
aquitard integrity (from Cherry et al., 2006).
Of the approaches outlined above the following is recommended as the minimum level for site
investigation:
1) Mapping of any nearby natural exposures such as stream cuts or pre-existing excavations
such as road cuts and quarries.

52 505093 / January 24, 2012Printed on Recycled Paper
2) A test pit program to investigate fractures. However, specific techniques related to removal of
smeared surfaces from the earthmoving equipment are required to allow the fractures to be
uncovered and measured. Christy et al. (2000) provide the background and a method that
can be followed. They note that the number of pits and the extensiveness of the mapping
effort will be dependent upon the overall goals of the investigation and available resources.
3) Coring and logging of the boreholes (previous section) is required to provide useful data for
interpreting stratigraphy and visual observation of fractures. Bradbury et al. (2006) provide
examples of other more sophisticated down-hole techniques if greater certainty is required.
4) If the site is particularly sensitive to vertical hydraulic conductivity, piezometers could be
installed in these boreholes to evaluate pressure (water level) changes, e.g., to monitor
response to rainfall or snowmelt, which can indicate presence or absence of fractures and for
use in measuring hydraulic conductivity (next section). Pressure transducers could be utilized
depending on the certainty required.
It is noted that the proximity of the piezometers in the aquitard to the fractures will influence the
ability to detect vertical pathways. A professional opinion must be provided on how the design of
the investigation will provide favourable probability for discerning the presence of fractures that
may be widely spaced and visually indistinct in cores and excavations.
9.5.4. Determining Hydrogeologic Properties
Measurements of aquitard hydraulic conductivity along with hydraulic head measurements
provide the basis for calculating groundwater flux through aquitards. However, obtaining a
representative and accurate measurement of K in clay-rich aquitards, and the ability to confirm
secondary permeability from fractures, are often both very difficult procedures. For example,
hydraulic conductivity of an aquitard (KV – vertical component) is a fundamental parameter to
determine; however, it can be extremely difficult to measure. Basic hydrogeologic techniques
designed for aquifers, such as pumping and slug tests, commonly need modification to be
appropriate for assessment of clay-rich aquitards (Novakowski and Bickerton, 1997,
Shapiro and Greene, 1995, van der Kamp, 2001) (from Cherry et al., 2006).
Conventional hydraulic conductivity tests (e.g., rising-, falling- and constant-head tests;
Hvorslev, 1951; and many others) primarily provide information concerning horizontal hydraulic
conductivity (KH - horizontal component) instead of KV. In addition, as most monitoring wells are
installed vertical, they only sample a small section of horizontally deposited aquitards. As well,

53 505093 / January 24, 2012Printed on Recycled Paper
the response time for water levels to equilibrate is very long (days to weeks or longer) and often
measurements are taken before hand. Small heterogeneities (such as fractures) can greatly
influence the bulk K measurement, but are difficult to determine with a monitoring well. As a
consequence, where feasible, the bulk vertical hydraulic conductivity of the aquitard is often
assessed using results obtained from a pumping test on an adjacent aquifer (e.g., Grisak and
Cherry, 1975; Rodrigues, 1983; Keller et al., 1986).(McKay et al., 1993).
Both Cherry et al. (2006) and Bradbury et al. (2006) each devote a chapter to the estimation of
hydraulic conductivity. Recommendations include the use of multiple approaches starting with
regional estimates based on pumping tests of aquifers that are confined by the aquitard of
interest. Regional groundwater flow models are also recommended for estimating KV. Slug test
results can be compared with results from laboratory tests on core samples for estimates of KH.
Slug test results that are significantly higher than those from analysis of cores suggest that there
may be fractures present.
Bradbury et al. (2006) provides recommendations of four types of borehole instrumentation:
traditional piezometers (or nests), horizontal nests, multi-level monitoring systems, and buried
transducers. The degree of sophistication in the system selected would need to be determined
by the level of certainty required. For the “Stage 2 PSI” investigations, the minimum requirement
is for three piezometers to be installed (devices that enable the measurement of hydraulic
head). The minimum recommendation for hydraulic conductivity estimates is difficult to
determine given the discussion presented in Cherry et al., 2006 and Bradbury et al., (2006).
Professional judgement and justification will need to be relied upon in this matter. It is noted that
estimates based on water levels may not yield representative results because of the long times
to equilibrate. However, if pressure transducers are installed this should improve estimates of
hydraulic conductivity (KH).
Multilevel monitoring systems which consist of isolated “depth-discrete” ports should be
considered for sites needing greater certainty to obtain profile of water levels and groundwater
chemistry. TG8 lists examples of these systems. Hydraulic gradient profiles can be estimated
from these types of piezometer installations. They can also be approximated from the borehole
installations noting from above, the challenges about recovery times and adequate borehole
seals. For a surficial aquitard, the steady state hydraulic gradient across the aquitard is
determined by a comparison of the water-table elevation and the head in the aquifer below
the aquitard.

54 505093 / January 24, 2012Printed on Recycled Paper
Surface geophysical (Crattie 1991; EddyDilek et al., 1997; Oatfield and Czarnecki, 1991;
Owen, Park, and Lee 1991; Young and Sun, 1995) and geostatistical methods (Desbarats et al.,
2001; James and Freeze, 1993; Ritzi, Dominic, and Kausch, 1996), have been applied to field
data to assess the extent and continuity of aquitards, particularly in the case of shallow
unlithified clay aquitards (from Cherry et al., 2006).
9.5.5. Determining Contaminant Concentrations
The results of the previous evaluations will determine the level of effort required in the
evaluation of contaminants in clay-rich aquitards at upstream oil and gas sites for the “Stage 2
PSI”. In particular, the level of effort required will be tied to the results of the soil sampling, the
confidence in the interpretation of aquitard integrity and in the determination of groundwater
fluxes and the identified groundwater uses.
Data on contaminant concentration in the subsurface will need to be determined. Professional
judgement must be relied upon to determine the number of samples and the frequency.
Initially, only indicators of the PCOCs should be measured. Environmental isotope tracers
Tritium, Oxygen-18/Deuterium and Carbon-14 could also be analyzed to provide information on
recharge rates and travel times. Field screening techniques described in TG8 are also
applicable here. Porewater samples could be obtained from the cores collected during the
drilling of the boreholes (Cherry et al., 2006). The piezometers installed in the boreholes should
be constructed in such a manner that they can also serve as monitoring wells. Monitoring well
construction details can be taken from TG8 as well as Cherry et al., 2006 and Bradbury et al.,
2006. Extra effort must be taken to ensure an adequate seal in the clay-rich aquitards to ensure
that surface runoff does not enter the annulus from ground surface.
9.6. Further Investigation
As noted in Section 9.5, the previous component of the field investigation will have focused on
the evaluation of aquitard integrity and a preliminary assessment of the extent of any
contaminant migration to deeper zones through a fracture network and/or more laterally through
a shallower groundwater flow system. If required, groundwater will have been sampled,
analyzed and concentrations compared against the relevant CSR standards. Depending on the
results of both types of evaluations, additional field investigation may be required. If that is the
case, Cherry et al. (2006) and Bradbury et al. (2006) should be consulted for further details on
appropriate additional techniques that have been mentioned in previous subsections.

55 505093 / January 24, 2012Printed on Recycled Paper
The level of effort for any further investigation will be similar to a DSI described in TG8,
i.e., typically completed to delineate the degree of contamination (vertical and horizontal) and to
evaluate the migration of the contamination to adjoining properties. TG8 requirements related to
temporal sampling should be applied here: A sufficient number of samples are collected to
establish the magnitude of temporal concentration variations including seasonal variations or to
allow predictions to be made with reasonable certainty. If the detailed field investigation follows
immediately after the previous one (i.e., “Stage 2 – PSI”), without supporting analytical data and
possibly before adequately recovery of the piezometers/monitoring wells, this detailed
investigation will run the risk of assessing more than required or not enough. For the later
scenario, additional field investigation would likely be needed at a later date.
Issues
The hydrogeologic assessment program presented identifies that a number of regional studies
could result in a better understanding of a number of the hydrogeologic factors that influence the
risks associated with groundwater contamination at a particular site. In the absence of these
studies, assessment carried out on each individual site takes on a higher level of complexity in
an effort to assess hydrogeologic conditions on a site-specific basis. The level of assumed risk
is inversely related to the level of site-specific assessment completed. It is our opinion that a
reasonable level of site-specific assessment combined with professional judgement based on
training and experience, in working in the upstream sector in northeast BC, will result in an
acceptable level of risk.
Under certain circumstances, organic soils could be considered terrestrial soils in that they are
only seasonally saturated and hence don’t fit the definition of muskeg . In these areas, surface
water flow during summer and early fall is through the organic soils or seasonal water courses.
For the purpose of this report, muskeg will not be considered an aquatic receiving environment
unless surface water is present for more than half of the frost-free season. Where surface water
on muskeg is present for more than half of the frost-free season, compare surface water and
peat chemistry to ambient WQGs and CSR sediment criteria, respectively. Where surface water
on muskeg is present for less than half of the frost-free season, compare surface water and
peat chemistry to CSR numerical groundwater standards and soil standards, respectively.
A detailed study of when and whether a particular muskeg site is considered an aquatic vs. a
terrestrial receiving environment is beyond the scope of this report.

56 505093 / January 24, 2012Printed on Recycled Paper
9.6.1. Surface Water
On active sites, runoff is managed under the Oil and Gas Activities Act. Following abandonment, if
surface water is present on a site in a natural water body (which could be considered an aquatic
environment), water quality should be compared to BC Approved Water Quality Guidelines12
If the surface water is in a borrow pit or maintained ditch which is solely for conducting storm
water from the site then the water body should not be considered an aquatic environment unless
an aquatic environment has been allowed to develop. The services of an aquatic biologist may be
required to determine if the water body constitutes an aquatic environment. If surface water
discharges through a ditch drainage system which ultimately reaches an aquatic environment,
quality should be compared to CSR AW which assumes a 10 fold dilution prior to reaching the
aquatic environment. We would propose that overland flow resulting from snowmelt and runoff
from a site should also be compared to AW as the surface water should not be considered an
aquatic environment due to the seasonal nature of the flow.
(BCAWQG) for aquatic environments.
9.6.2. Sediment
Typically sediment has not been considered during assessment of oil and gas sites unless there is
a stream, river or lake within the lease boundaries or within the plume of off-site contaminant
migration. Where surface water on muskeg is present for more than half of the frost-free season,
compare surface water and peat chemistry to ambient WQGs and CSR sediment criteria,
respectively.
While there may be issues with regards to cumulative effects on streams and rivers across BC
this issue is not discussed in this guidance. Where assessment of sediment is required,
Technical Guidance 19 “Assessing and Managing Contaminated Sediments” would be
considered the most appropriate at this time and there are standards for sediment included in
CSR Schedule 9. Sediment assessment will not be discussed further in this guidance.
12 Water, Air and Climate Change Branch, MoE, British Columbia Approved Water Quality Guidelines (Criteria),
2006 Edition (BCAWQG).

57 505093 / January 24, 2012Printed on Recycled Paper
9.6.3. Vapour
Based on Technical Guidance 4, if an upstream oil and gas site is classified as wildlands,
characterization of soil vapour is not required.
If an upstream oil and gas site is not classified as wildlands and there are no buildings nearby
(i.e., within 30 m of the plume), then only the outdoor vapour pathway has to be assessed.
Vapour concentrations can be determined through modelling based on soil and groundwater
concentration data (i.e., it will not likely be necessary to collect vapour samples at the majority of
upstream oil and gas sites); as such, this guidance does not address soil vapour sampling.
If soil vapour sampling is required please refer to TG4.

58 505093 / January 24, 2012Printed on Recycled Paper
10. SUMMARY AND CONCLUSIONS
SLE thanks the MoE for the opportunity to work on this project. The issues we have addressed
are issues that we have been dealing with in our work in the upstream oil and gas sector.
This report primarily defines these issues and proposes some solutions and some approaches
to coming to solutions.
Administratively there are fundamental differences between MoE and OGC approaches to
attaining the same end point. Some differences are seated in the fundamental approach and
underlying regulations and some are seated in process.
By addressing the technical differences it is our opinion that the perceived differences between
the CoC and the CoR can be reduced, resulting in the acceptance of the equivalency of the
processes.
10.1. Technical
A number of technical issues associated with applying provincial standards specifically to the
upstream oil and gas sector in northeast BC have been identified and solutions/approaches
proposed.
The key issue is that we are dealing with a large number of remote sites, many of which have a
low level of impact from short duration, low intensity, site activities. The challenge is to provide a
level of assessment that provides a level of risk that is acceptable to all stakeholders while still
respecting the challenges of completing assessment work under the prevailing conditions.
The proposed solution is to gain an understanding of the regional conditions that can be applied
to individual sites such that the “big picture” risk associated with a site can be understood in
order to inform the design of site-specific assessment. If specific pathways and receptors can be
shown to not be at risk, assessment is focused on the remaining at-risk pathways.
The approach requires qualified professionals and the latitude for those professionals to use
their judgment based on an overall understanding of regional conditions and a limited data set
of site-specific assessment data.
The following comments address the original issues identified through the stakeholder’s
questionnaire and workshops.

59 505093 / January 24, 2012Printed on Recycled Paper
Regulatory Issue #1
The proposed guidance will serve to bring the OGC and MoE processes closer together.
As such, the guidance moves toward a common standard and the instruments should be
perceived as equivalent.
Regulatory Issue #2
OGC and MoE guidance are different in a number of respects. By making some changes to the
sampling aspects of OGC guidance the two approaches can be brought closer together.
While results may not be directly applicable to the standards-based MoE approach, they can be
brought in at the screening level risk assessment (SLRA) stage. It is our opinion that the best
opportunity for incorporating a number of the streamlining steps is in the SLRA. The process will
need some changes to be applicable to the upstream oil and gas sector in northeast BC. SLRA
(risk assessment in general) is considered remediation and is beyond the scope of this project.
Technical Issue #1
Information sources appropriate to upstream oil and gas sector have been presented. Checklists
10 and 11 will require modification to reflect addition and deletion of information sources.
Technical issue #2
In the upstream oil and gas sector, APECs are quite standard based on the site activities that
have occurred. A list of APECs linked to site activities is provided. A list of PCOCs associated
with standard APECs is provided.
Technical Issue #3
Arguments for the applicability of standards in the sector have been provided.
� argument for discounting DW (aquitard of 5 m of fine grained soil is protective of potential
deeper aquifers provided no significant secondary permeability features are observed);
� argument that, under some site conditions, organic soils and associated groundwater at many
sites should not be assessed as aquatic environment;
� guidance for applicability of IW and LW; and
� guidance for applicability of soil vapour standards.
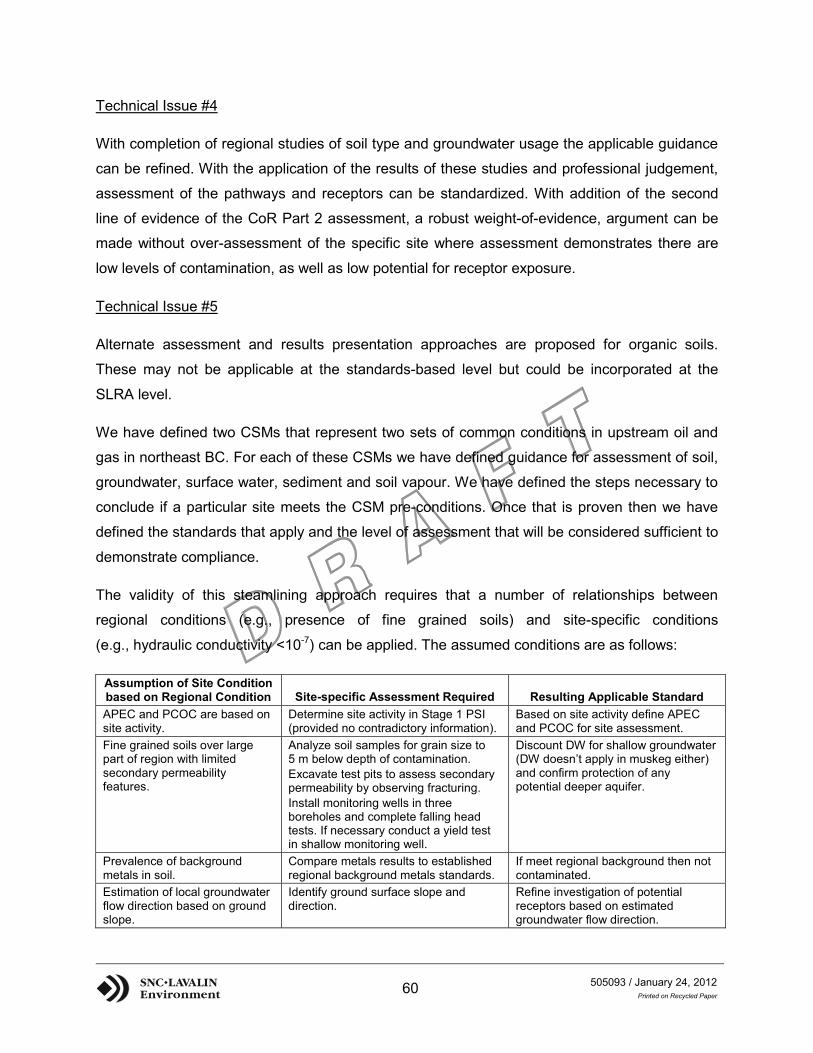
60 505093 / January 24, 2012Printed on Recycled Paper
Technical Issue #4
With completion of regional studies of soil type and groundwater usage the applicable guidance
can be refined. With the application of the results of these studies and professional judgement,
assessment of the pathways and receptors can be standardized. With addition of the second
line of evidence of the CoR Part 2 assessment, a robust weight-of-evidence, argument can be
made without over-assessment of the specific site where assessment demonstrates there are
low levels of contamination, as well as low potential for receptor exposure.
Technical Issue #5
Alternate assessment and results presentation approaches are proposed for organic soils.
These may not be applicable at the standards-based level but could be incorporated at the
SLRA level.
We have defined two CSMs that represent two sets of common conditions in upstream oil and
gas in northeast BC. For each of these CSMs we have defined guidance for assessment of soil,
groundwater, surface water, sediment and soil vapour. We have defined the steps necessary to
conclude if a particular site meets the CSM pre-conditions. Once that is proven then we have
defined the standards that apply and the level of assessment that will be considered sufficient to
demonstrate compliance.
The validity of this steamlining approach requires that a number of relationships between
regional conditions (e.g., presence of fine grained soils) and site-specific conditions
(e.g., hydraulic conductivity <10-7) can be applied. The assumed conditions are as follows:
Assumption of Site Condition based on Regional Condition Site-specific Assessment Required Resulting Applicable StandardAPEC and PCOC are based on site activity.
Determine site activity in Stage 1 PSI (provided no contradictory information).
Based on site activity define APEC and PCOC for site assessment.
Fine grained soils over large part of region with limited secondary permeability features.
Analyze soil samples for grain size to 5 m below depth of contamination.Excavate test pits to assess secondary permeability by observing fracturing.Install monitoring wells in three boreholes and complete falling head tests. If necessary conduct a yield test in shallow monitoring well.
Discount DW for shallow groundwater (DW doesn’t apply in muskeg either) and confirm protection of any potential deeper aquifer.
Prevalence of background metals in soil.
Compare metals results to established regional background metals standards.
If meet regional background then not contaminated.
Estimation of local groundwater flow direction based on ground slope.
Identify ground surface slope and direction.
Refine investigation of potential receptors based on estimatedgroundwater flow direction.

61 505093 / January 24, 2012Printed on Recycled Paper
Assumption of Site Condition based on Regional Condition Site-specific Assessment Required Resulting Applicable StandardOrganic soil is compared to soil standards.
Determine that muskeg is only seasonally saturated (rather than a bog or fen). If in doubt then assessment by biologist.
Compare analytical results to soil standards and groundwater samples to applicable groundwater use standard.
Nature of organic soils affects analytical results.
Analyze background organic soilsamples for naturally occurring organicsReport organic soil results on a wet weight basis.
Subtract background concentrations when comparing to standards.Compare wet weight basis results to standards.
Seasonal surface water does not constitute an aquatic environment.
Determine surface water is seasonal through inspection. If in doubt then assessment by biologist.Sample surface water.
Compare analytical results to AW rather than BCAWQG.
Soil vapour standards are not applicable at wildlands sites.On non-WL sites only outdoor air has to be assessed if no buildings within 30 m.
Through Stage 1 PSI determine if site is WL or AL land use. Confirm through site inspection that there are no buildings within 30 m.
For wildland no vapour assessment is required.For agricultural land with no buildings within 30 m only assessment for outdoor air is required. Should be able to complete by modeling from soil and groundwater results if havefull list of parameters.
On Agricultural land IW/LW would only apply if there is currently irrigation or livestock watering occurring.
Through Stage 1 PSI and site inspection determine if there is current irrigation or livestock watering near the site.If you can’t discount then assess travel time argument to be used in an SLRA.
If no current use then IW/LW don’t apply.If you can’t discount then make travel time argument to discount.
Limited occupancy. Determine potential for occupancy from Stage 1 PSI and site inspection.
If little potential for human habitation then you can discount human health in a SLRA.
Parking Lot Issues
Parking Lot issue Suggestions for Who could conduct studyComparing results currently obtained during OGC DWDA activities(EC, SRA, salinity) to laboratory analytical methodologies for CSR parameters (chloride, sodium). Either determine equivalency or propose analytical changes to bring closer to CSR.
CAPP and OGC
Evaluate effect of naturally occurring organics and moisture content on analytical results in organic soils.
CAPP members provide data to be assessed by consulting laboratory.
Investigate background metals concentrations in soil and groundwater on a regional basis (compile data from recent and future site assessments).
CAPP members provide data to be compiled and assessed by consultant.
Compile data on locations of existing wells and hydrogeology conducive to water supply development from existing sources.
Consulting hydrogeologist
Investigate relationship of grain size and secondary permeability (fracturing and rootlets) to hydraulic conductivity in fine grained soils in northeast BC.
Consulting hydrogeologist
Investigate parameters of the falling head test to determine the minimum duration of the test to determine that hydraulic conductivity meets CSR TG6 requirement for an aquitard.
Consulting hydrogeologist
While a number of the streamlining items may not be applicable to standards based assessment, they may be valuable in a Screening Level Risk Assessment. Review SLRA and modify with respect to upstream oil and gas in northeast BC.
CSAP
62 505093 / January 24, 2012Printed on Recycled Paper
11. REFERENCES
BC Ministry of Environment, 2003. British Columbia Field Sampling Manual, Part E Water and
Wastewater Sampling, Groundwater Pollution Monitoring.
http://www.elp.gov.bc.ca/epd/wamr/labsys/field_man_pdfs/grnd_poll_mon.pdf . .
BC Ministry of Environment, 2010a. Technical Guidance 6. Water Use Determination. Version 2
(July 2010). 8 pg.
BC Ministry of Environment, 2010b. Technical Guidance 8. Groundwater Investigation and
Characterization. Version 1 (July 2010). 16 pg.
BC MoE, 2010. Technical Guidance 8. Groundwater Investigation and Characterization.
BC Oil and Gas Commission, 2010. Oil and Gas Water Use in British Columbia. 30 p.
Bradbury, K.R. et al., 2006. Contaminant Transport Through Aquitards: Technical Guidance for
Aquitard Assessment. Sponsored by Awwa Research Fund. 176 p.
CCME, 1994. Subsurface Assessment Handbook for Contaminated Sites. CCME EPC-NCSRP-
48E. 293 p.
Cherry, J.A. et al., 2006. Role of Aquitards in the Protection of Aquifers from Contamination: A
State of the Science Review. Sponsored by the Awwa Research Foundation. 152 p. .
Christy, A.D., McFarland, L.A. and Carey, D., 2000. The Use of Test Pits to Investigate
Subsurface Fracturing and Glacial Stratigraphy in Tills and Other Unconsolidated
Materials. OHIO J SCI 100 (3/4):100-106.
EPA, 1993. Subsurface Characterization and Monitoring Techniques (EPA 625-R-93-003).
Golders Associates Ltd., 2010. Groundwater Investigation In Site Assessment. 2nd Edition. 63 p.
Levson, V., Ferbey, T. and Hickin, A. 2005. Surficial Geology and Aggregate Studies in the
Boreal Plains of Northeast British Columbia in Summary of Activities 2005, BC Ministry
of Energy and Mines, pages 42-50.
http://www.empr.gov.bc.ca/OG/oilandgas/aggregates/Documents/Levson_et_al.pdf
63 505093 / January 24, 2012Printed on Recycled Paper
McKay, L., Cherry, J.A. and Gillham, R.W., 1993. Field Experiments in a Fractured Clay Till 1.
Hydraulic Conductivity and Fracture Aperture. Water Resources Research
29(4):1149-1162.
US EPA (Ohio), 2009. Assessment of an Aquitard during a Ground Water Contamination
Investigation. 9 p. http://www.epa.ohio.gov/portals/28/documents/TGM-Supp1.pdf.

DRAWINGS
� Map 1 - Regional Map Northeast BC – Western Sedimentary Basin Oil and Gas Activity� Map 2 - Regional Map Northeast BC – Existing Water Supply Wells� Map 3 - Regional Map Northeast BC – Agricultural Land Reserve� Map 4 - Regional Map Northeast BC – Wetlands / Muskeg

#
##
#
#
#
#
#
#
#
##
#
##
#
#
#
#
#
#
#
#
#
#
#
#
#
#
#
#
#
#
#
# #
#
#
#
#
#
##
#
#
#
###
#
##
#
#
#
#
#
#
#
#
#
#
#
#
#
#
#
# #
###
############
##
##
#
#
#
#
#
#
#
#
#
#
#
#
#
#
#
#
#
#
#
#
#
#
#
#
#
##
#
##
#
#
#
#
#
#
#
##
#
#
#
#
#
#
####
#
#
#
#
#
#
#
#
#
#
#
#
#
#
#
#
#
###
#
###
#
#
#
#
#
#
#
#
#
##
#
#
#
##
#
#
###
#
#
##
#
#
#
####
#
#
#
#
#
#
#
#
#
#
#
##
#
#
#
###
#
##
##
#
#
#
##
#
#
#
#
#
#
###
#
#
#
#
#
#
#
#
#
#
#
#
#
##
#
#
#
##
#
#
#
#
#
#
#
#
#
#
#
#
#
#
###
#
#
##
#
#
#
#
###
#
#
#
#
#
#
#
#
#
###
#
##
#
#
#
#
#
#
#
#
##
#
##
#
#
##
#
#
#
#
#
#
#
#
#
#
#
#
#
##
#
#
#
###
#
#
#
#
#
##
##
#
#
#
#
#
#
#
#
#
#
#
#
#
#
#
#
#
#
#
#
##
#
###
#
#
#
#
#
#
##
##
##
#
#
###
#
#
#
#
#
#
#
#
#
#
#
#
#
#
#
#
##
#
#
#
#
#
#
#
#
#
#
#
#
#
##
#
#
#
#
#
#
###
#
#
#
#
#
#
#
#
##
#
##
#
#
#
#
#
#
#
#
#
#
#
#
#
#
##
#
#
#
#
#
#
#
#
#
#
#
#
#
#
##
##
#
#
#
#
#
#
#
#
#
#
#
#
##
#
##
#
#
#
#
#
#
##
##
#
#
#
#
#
#
#
##
#
#
#
#
##
#
#
#
#
#
#
#
###
#
#
#
#
#
#
#
##
#
#
###
##
#
#
#
##
#
#
#
#
#
#
##
#
#
#
#
#
#
##
##
#
#
#
#
#
#
#
#
#
#
#
#
#
#
#
#
#
#
#
##
#
###
#
#
#
#
##
##
#
#
#
#
#
#
#
#
##
#
#
#
#
#
#
#
#
##
#
#
#
#
#
#
#
##
#
#
#
#
##
#
#
#
#
#
#
#
#
##
#
#
#
#
#
#
#
#
#
#
#
#
####
#
#
#
#
#
#
#
#
#
#
#
#
#
#
#
#
##
#
#
#
#
##
#
#
#
#
#
#
#
#
#
#
#
#
#
#
#
#
###
#
#
###
#
#
#
#
#
#
#
#
##
#
#
##
#
##
#
#
#
#
#
#
#
#
##
####
#
##
#
#
###
#
###
#
#
#
####
##
#
####
#
#
#
#
#
#
##
#
#
##
#
#
#
#
###
##
#
#
#
#
##
##
#
########
#
#
#
#
##
#
#
#
#
#
#
#
#
###
#
##
##
#
#
##
#
#
#
#
#
##
#
######
#
#
#
#
##
#
#
#
#
##
#
#
#
#
##
###
##
#
#
#
#
#
#
#
#
#
#
#
#
######
#
#
#
#
###
#
#
#
##
#
#
#
#
#
#
##
##
#
#
#
####
#
##
#
#
#
#
#
#
#
##
#
#
##
#
#
#
#
#
#
#
#
##
#
# #
#
# # #### #
#
#
#
##
#
#
#
##
#
###
#
##
##
#
#
##
#
#
#
#
#
##
#
#
####
##
###
##
####
#
#
#
#
#
#
#
#
#####
#
####
##
##
#
#
#
#
#
#
#
#
#
#
#
#########
#
#
#
##
##
##
#
###
#
##
#
#
#
#
#
#
#
#
###
## #
#
#
##
#
#
## #
#
#
# #
#
#
##
#
#
#
#
#
###
###
##
#
#
###
#
#
#####
###
######
####
#
#
#
#
#
# #
#
#
###
## #
#
#
#
##
##
#
##
##
#
#
##
#
#
#
###
#
#
###
#
#
##
#
#
#
#
#
#
#
#
#
#
#
#
#
#
#
#
#
#
#
##
#
#
#
#
#
#
#
#
#
#
###
#
#
#
#
###
#
#
#
#
#
#####
#
#
#
#
#
#
#
#
#
#
#
#
#
#
#
#
##
#
0 8,100 16,200 24,300 32,4004,050Meters
REGIONAL MAP NORTHEAST BCEXISTING WATER SUPPLY WELLS
MINISTRY OF ENVIRONMENT
505093-004B01:500,000
NORTHEAST BC
MGM
CHD
2011-06-13
NAD 1983 UTM Zone 10N
Bing Maps and MapPoint Web Service - Copyright (c) 2010 Microsoft Corporation.BCGOV ILMB Crown Registry and Geographic Base Branch (CRGB) - data accessed through www.GeoBC.gov.bc.ca
1. Original in colour.2. Numerical scale reflects full-size print. Print scaling will distort this scale, however scale bar will remain accurate.3. Intended for illustration purposes, accuracy has not been verified for construction or navigation purposes.
P:\Current Projects\Other Projects\5050xx\505093\Cartography\505093-004B_WaterWells.pdf
P:\C
urre
nt P
roje
cts\
Oth
er P
roje
cts\
5050
xx\5
0509
3\G
IS\5
0509
3-00
4B_W
ater
Wel
ls.m
xd
# Surface Water Points of Diversion
Groundwater Well
Groundwater Aquifers
REFERENCES
NOTES
LEGEND
CLIENT NAME: PROJECT LOCATION:
BY:
CHK'D:
SCALE: DATE: REF No: REV:
PROJ COORD SYS:

0 8,100 16,200 24,300 32,4004,050Meters
REGIONAL MAP NORTHEAST BCAGRICULTURAL LAND RESERVE
MINISTRY OF ENVIRONMENT
505093-004C01:500,000
NORTHEAST BC
MGM
CHD
2011-06-13
NAD 1983 UTM Zone 10N
Bing Maps and MapPoint Web Service - Copyright (c) 2010 Microsoft Corporation.BCGOV ILMB Crown Registry and Geographic Base Branch (CRGB) - data accessed through www.GeoBC.gov.bc.ca
1. Original in colour.2. Numerical scale reflects full-size print. Print scaling will distort this scale, however scale bar will remain accurate.3. Intended for illustration purposes, accuracy has not been verified for construction or navigation purposes.
P:\Current Projects\Other Projects\5050xx\505093\Cartography\505093-004C_ALR.pdf
P:\C
urre
nt P
roje
cts\
Oth
er P
roje
cts\
5050
xx\5
0509
3\G
IS\5
0509
3-00
4C_A
LR.m
xd
BC Groundwater Aquifers
Agricultural Land Reserve
REFERENCES
NOTES
LEGEND
CLIENT NAME: PROJECT LOCATION:
BY:
CHK'D:
SCALE: DATE: REF No: REV:
PROJ COORD SYS:

093I/11
093I/08093I/07
093I/06093I/05
093I/09093I/10
093I/12
093I/16093I/15
093I/14093I/13
093J/11
093J/08093J/05 093J/06 093J/07
093J/09093J/12 093J/10
093J/16093J/13 093J/14 093J/15
094I/11
094I/01094I/02094I/03094I/04
094I/08094I/07094I/06094I/05
093K/08
094I/09094I/10
094I/12
093K/09
094I/16094I/15094I/14094I/13
093P/11
093K/16
093P/01093P/02
093P/03093P/04
093P/08093P/07093P/06093P/05
093P/09093P/10
093P/12
093N/01
094A/11
093P/16
094B/11
093P/15093P/14093P/13
093N/08
093O/11
094A/01094A/02094A/03094A/04094B/01094B/04 094B/03 094B/02
094J/11
093N/09
093O/01093O/04 093O/03 093O/02
094A/08094A/07094A/06094A/05094B/08094B/05 094B/06 094B/07
094J/04 094J/01094J/03 094J/02
093N/16
093O/08093O/05 093O/06 093O/07
094F/01
094A/09094A/10
094A/12094B/09094B/12 094B/10
094C/01
094J/08094J/05 094J/06 094J/07
093O/12 093O/09093O/10
094F/08
094A/16094A/15094A/14094A/13094B/13 094B/16094B/14 094B/15
094C/08
094J/09094J/12 094J/10
093O/13 093O/16093O/14 093O/15
094F/09
094C/09
094J/13 094J/16094J/14 094J/15
094F/16
094C/16
094H/11
094H/01094H/02094H/03094H/04
094H/08094H/07094H/06094H/05
094G/11
094K/01
094H/09094H/10
094H/12
094G/04 094G/01094G/02094G/06
094K/08
094H/16094H/15094H/14094H/13
094G/08094G/05 094G/06 094G/07
094K/09
094G/09094G/12 094G/10
094K/16
094G/13 094G/16094G/15094G/14
094P/11
094P/01094P/02094P/03094P/04
094P/08094P/07094P/06094P/05
094P/09094P/10
094P/12
094N/01
094P/16094P/15094P/14
094N/08
094P/13
094O/11094N/09
094O/01094O/04 094O/03 094O/02
094O/08094O/05 094O/06 094O/07
094N/16
094O/12 094O/09094O/10
094O/13 094O/16094O/15094O/14094N/15
094N/10
094N/07
094N/02
094K/15
094K/10
094K/07
094K/02
093I/01
094F/15
094F/10
093I/02
094F/07
094F/02
093I/03
094C/15
094C/10
093I/04
094C/07
093K/01 093J/04 093J/01
094C/02
093J/03 093J/02
093N/15
093N/10
093N/07
093N/02
093K/15
093K/10
093K/07
093K/02
0 8,100 16,200 24,300 32,4004,050Meters
REGIONAL MAP NORTHEAST BCMUSKEG
MINISTRY OF ENVIRONMENT
505093-004D01:500,000
NORTHEAST BC
MGM
CHD
2011-06-13
NAD 1983 UTM Zone 10N
Bing Maps and MapPoint Web Service - Copyright (c) 2010 Microsoft Corporation.BCGOV ILMB Crown Registry and Geographic Base Branch (CRGB) - data accessed through www.GeoBC.gov.bc.ca
1. Original in colour.2. Numerical scale reflects full-size print. Print scaling will distort this scale, however scale bar will remain accurate.3. Intended for illustration purposes, accuracy has not been verified for construction or navigation purposes.
P:\Current Projects\Other Projects\5050xx\505093\Cartography\505093-004D_Muskeg.pdf
P:\C
urre
nt P
roje
cts\
Oth
er P
roje
cts\
5050
xx\5
0509
3\G
IS\5
0509
3-00
4D_M
uske
g.m
xd
Freshwater Atlas - Wetlands
NTS 50k Grid
REFERENCES
NOTES
LEGEND
CLIENT NAME: PROJECT LOCATION:
BY:
CHK'D:
SCALE: DATE: REF No: REV:
PROJ COORD SYS:

"
"
"
"
"
"
"
"
"
"
"
"
"
Trutch
Chetwynd
Mackenzie
Bear Lake
Fort Nelson
Dawson Creek
Nelson Forks
Manson Creek
Tumbler Ridge
Hudson's Hope
Fort St. John
Pink Mountain
Fort St. James
093I/11
093I/08093I/07
093I/06093I/05
093I/09093I/10
093I/12
093I/16093I/15
093I/14093I/13
093J/11
093J/08093J/05 093J/06 093J/07
093J/09093J/12 093J/10
093J/16093J/13 093J/14 093J/15
094I/11
094I/01094I/02094I/03094I/04
094I/08094I/07094I/06094I/05
093K/08
094I/09094I/10
094I/12
093K/09
094I/16094I/15094I/14094I/13
093P/11
093K/16
093P/01093P/02
093P/03093P/04
093P/08093P/07093P/06093P/05
093P/09093P/10
093P/12
093N/01
094A/11
093P/16
094B/11
093P/15093P/14093P/13
093N/08
093O/11
094A/01094A/02094A/03094A/04094B/01094B/04 094B/03 094B/02
094J/11
093N/09
093O/01093O/04 093O/03 093O/02
094A/08094A/07094A/06094A/05094B/08094B/05 094B/06 094B/07
094J/04 094J/01094J/03 094J/02
093N/16
093O/08093O/05 093O/06 093O/07
094F/01
094A/09094A/10
094A/12094B/09094B/12 094B/10
094C/01
094J/08094J/05 094J/06 094J/07
093O/12 093O/09093O/10
094F/08
094A/16094A/15094A/14094A/13094B/13 094B/16094B/14 094B/15
094C/08
094J/09094J/12 094J/10
093O/13 093O/16093O/14 093O/15
094F/09
094C/09
094J/13 094J/16094J/14 094J/15
094F/16
094C/16
094H/11
094H/01094H/02094H/03094H/04
094H/08094H/07094H/06094H/05
094G/11
094K/01
094H/09094H/10
094H/12
094G/04 094G/01094G/02094G/06
094K/08
094H/16094H/15094H/14094H/13
094G/08094G/05 094G/06 094G/07
094K/09
094G/09094G/12 094G/10
094K/16
094G/13 094G/16094G/15094G/14
094P/11
094P/01094P/02094P/03094P/04
094P/08094P/07094P/06094P/05
094P/09094P/10
094P/12
094N/01
094P/16094P/15094P/14
094N/08
094P/13
094O/11094N/09
094O/01094O/04 094O/03 094O/02
094O/08094O/05 094O/06 094O/07
094N/16
094O/12 094O/09094O/10
094O/13 094O/16094O/15094O/14094N/15
094N/10
094N/07
094N/02
094K/15
094K/10
094K/07
094K/02
093I/01
094F/15
094F/10
093I/02
094F/07
094F/02
093I/03
094C/15
094C/10
093I/04
094C/07
093K/01 093J/04 093J/01
094C/02
093J/03 093J/02
093N/15
093N/10
093N/07
093N/02
093K/15
093K/10
093K/07
093K/02
HELMET
RING
DAHL
OJAY
EKWAN
NOEL
DRAKE
RIGEL
KELLY
INGA
SHEKILIE
GUNNELL CREEK
BUICK CREEK
PICKELL
SIERRA
TOMMY LAKES
SILVER
ALTARES
BEG
ELLEH
SUKUNKA
MAXHAMISH LAKE
GROUNDBIRCH
MONIAS
SUNDOWN
KLUA
DOE
GUTAH
MARTIN
TOWN
KAHNTAH RIVER
OAK
VELMA
DESAN
GRAHAM
NIG CREEK
BIVOUAC
PEEJAY
MILO
HIDING CREEK
ADSETT
BULLMOOSE
KOBES
JEDNEY
LADYFERN
MURRAY
CLARKE LAKE
FIREWEED
BOUNDARY LAKE
CUTBANK
WARGEN
ESKAI
GWILLIM
SUNRISE
LAPRISE CREEK
SIKANNI
ELM
THETLAANDOA
YOYO
TSEA
EAGLE
CHINCHAGA RIVER
BIRCH
ZAREMBA
JUNIOR
BOUGIE
BRASSEY
OSPREY
STODDART WEST
CYPRESS
STODDART
BLACK CREEK
CABIN
WEASEL
BLUEBERRY
CONROY CREEK
KOTCHO LAKE
BUBBLES NORTH
HOSSITL
WILDER
SWAN LAKE
MICA
CARIBOU
SIPHON
FORT ST JOHN
SAHTANEH
COMMOTION
PARKLAND
CACHE CREEK
PRESPATOU
BRAZION
BEAVERTAIL
DOIG RAPIDS
JACKPINE
BUICK CREEK NORTH
GREEN CREEK
MOOSE
BIRLEY CREEK
LAPP
TWO RIVERS
BUBBLES
UMBACH
OSBORN
FIREBIRD
FEDERAL
CURRANT
FLATROCK
HAY RIVER
BOUNDARY LAKE NORTH
EAGLE WEST
SEPTIMUS
SEXTET
LILY LAKE
SATURN
BEG WEST
MONTNEY
GRIZZLY SOUTH
MEL
WILDMINT
POCKETKNIFE
RIGEL EAST
TUPPER CREEKBOULDER
EVIE BANK
WOLVERINE
BUTLER
NIG CREEK NORTH
KYKLO
HOFFARD
MUSKRAT
FLATROCK WEST
TOWER LAKE
HIGHHAT MOUNTAIN
CECIL LAKE
SOJER
MERCURY
KOTCHO LAKE EAST
AIRPORT
OOTLA
DAIBER
BERNADET
CHOWADE
BLAIR
LOUISE
OWL
GOTE
ATTACHIE
TOOGA
WOLF
KOMIE
MIKE
PETITOT RIVER
BUICK CREEK WEST
BULLMOOSE WEST
WILLOW
GUNDY CREEK
TATTOO
SQUIRREL
SUNSET PRAIRIE
PARADISE
MILLIGAN CREEK
INGA NORTH
BEAR FLAT
DILLY
PORTAGE
HALFWAY
GRIZZLY NORTH
SIPHON EAST
BURNT RIVER
JULIENNE CREEK
PEEJAY WEST
BLUEBERRY WEST
WOODRUSH
AITKEN CREEK
HUNTER
CURRANT WEST
RED CREEK NORTH
BUCKINGHORSE
GOOSE
DAWSON CREEK
LAGARDE
BRIAR RIDGE
BEAVER RIVER
SILVERBERRY
MILLIGAN CREEK WEST
STONE CREEK
BEATTON RIVERBEATTON RIVER WEST
RED CREEK
RED DEER
GUNDY CREEK WEST
REDEYE
PLUTO
TOWNSEND
NORTH PINE
BOUDREAU
AITKEN CREEK NORTH
CRUSH
BULRUSH
ELBOW CREEK
BEAVERDAM
FORT ST JOHN SOUTHEAST
WINDFLOWER
BULLDOG
STODDART SOUTH
ROGER
GRASSY
LAPRISE CREEK WEST
JULIENNE CREEK NORTH
CROW RIVER
FARRELL CREEK WEST
ALCES
TRUTCH
GOPHER
REDWILLOW RIVER
WEASEL WEST
JULIENNE CREEK SOUTH
BLUEBERRY EAST
THETLAANDOA NORTH
JEDNEY WEST
THUNDER MOUNTAIN
MOBERLY LAKE
NIG CREEK WEST
ELLEH NORTH
PINTAIL
KOBES WEST
INGA SOUTH
0 8,100 16,200 24,300 32,4004,050Meters
REGIONAL MAP NORTHEAST BCOIL AND GAS
MINISTRY OF ENVIRONMENT
505093-004E01:500,000
NORTHEAST BC
MGM
CHD
2011-06-28
NAD 1983 UTM Zone 10N
Bing Maps and MapPoint Web Service - Copyright (c) 2010 Microsoft Corporation.BCGOV ILMB Crown Registry and Geographic Base Branch (CRGB) - data accessed through www.GeoBC.gov.bc.ca
1. Original in colour.2. Numerical scale reflects full-size print. Print scaling will distort this scale, however scale bar will remain accurate.3. Intended for illustration purposes, accuracy has not been verified for construction or navigation purposes.
P:\Current Projects\Other Projects\5050xx\505093\Cartography\505093-004E_OilGas.pdf
P:\C
urre
nt P
roje
cts\
Oth
er P
roje
cts\
5050
xx\5
0509
3\G
IS\5
0509
3-00
4E_O
ilGas
.mxd
" BC Communities
Gas Field
Oil Field
Oil/Gas Field
} OGC Facilities
* OGC Wellsites
NTS 50k Grid
REFERENCES
NOTES
LEGEND
CLIENT NAME: PROJECT LOCATION:
BY:
CHK'D:
SCALE: DATE: REF No: REV:
PROJ COORD SYS:

CSM #1
� 505093-001 – CSM#1 (fine grained soil) Site Plan with APECs� 505093-001B – CSM#1 (fine grained soil) Cross Section� Air Photograph 1A Conceptual Model (fine grained soil)� Photograph 1B: Ground Level Photograph Fine Grained Soils


505093
Air Photograph 1A: Conceptual Model (fine grained soil).
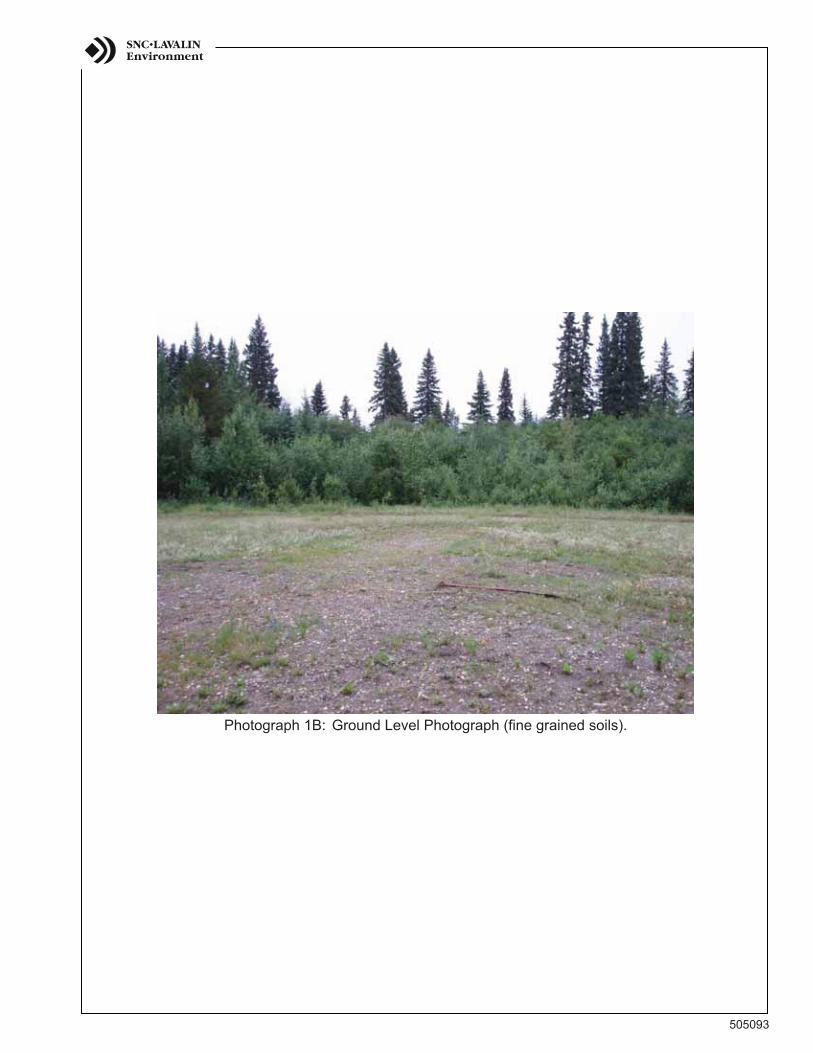
505093
Photograph 1B: Ground Level Photograph (fine grained soils).

CSM #2
� 505093-002 – CSM#2 (Organic Soils) Site Plan with APECs� 505093-002B – CSM#2 (Organic Soils) Cross Section� Air Photograph 2A Conceptual Site Model (organic soil)� Photograph 2B: Ground Level Photograph Organic Soils� 505093-003 – Post Abandonment Wellhead Assessment


505093
Air Photograph 2A: Conceptual Model (organic soils).

505093
Photograph 2B: Ground Level Photograph (organic soils).


APPENDIX I
Stage 1 PSI Background Data Sources

1 505093 / January 24, 2012Printed on Recycled Paper
APPENDIX I: Stage 1 PSI Background Data Sources
The first component of a Stage 1 Preliminary Site Investigation (PSI) is review of relevant client
and government files relating to the site. A summary of the site information is as follows:
� Resource company records:
� Site survey plans with notations;
� Drilling, workover, well servicing, and completion reports;
� Mud additives lists;
� Drilling waste handling and disposal documentation;
� Operation and maintenance records;
� Facilities / pipeline abandonment or decommissioning reports; and
� Previous environmental investigation reports.
� Legal titles;
� Provincial and/or municipal government agencies
� zoning; and
� land use restrictions (i.e., Agricultural Land Reserve).
� Ministry of Environment databases;
� Spills;
� Contaminated Site Registry; and
� SWIS, WASTE, COORS (do not typically provide information of use).
� Oil and Gas Commission (or Ministry of Energy Mines and Petroleum Resources Archives);
� Rig, wellsite and reclamation inspection reports;

2 505093 / January 24, 2012Printed on Recycled Paper
� Drilling reports;
- Well authorization documentation;
- Flaring authorizations; and
� Production records.
� Physiological Data Sources;
� Geology, surficial geology and soil surveys;
� Orthophotography, satellite imagery;
� If imagery of the wellsite does not capture the associated facility, a separate image of
the associated facility must be provided (e.g., aerial, satellite, etc. and site
photographs);
� Topographic maps;
� Nearby groundwater well logs; information on aquifers or groundwater supplies;
� Site construction records (Pre-site or Schedule A assessments); and
� Drilling waste sump suitability.
Following completion of the file review a review of aerial and satellite imagery is completed.
Review of aerial or satellite imagery can provide a visual chronological history of activities that
occurred at a site when viewed at an appropriate scale. Imagery can provide valuable information
about a site, especially when the company documentation is not available or incomplete.
Information about the site such as location of facilities and features, sumps and flare pits, spills
and clean up can be obtained. If the results of the Stage 1 PSI indicate contamination is likely,
imagery can be used to develop a soil sampling plan. Submissions of aerial photographs or
satellite photographs that provide sufficient detail are required with the CoR Part 1 application.
Ensure all information is provided with the application, including the date the imagery was
reviewed, the name of the reviewer, photograph identification, year, scale, and observations.
A site reconnaissance is then carried out.

3 505093 / January 24, 2012Printed on Recycled Paper
A site reconnaissance is conducted to confirm site operations and environmental conditions that
may not have been apparent through the historical review. A site reconnaissance is of increased
importance where historical records are incomplete and the location of APEC, either confirmed
or inferred based on historical activities, remain unknown. Common examples of these include
drilling waste disposal areas (DWDA), former flaring facilities and decommissioned pipelines or
production facilities.
Often intrusive assessments must be completed under winter access conditions; however, effort
should be made to complete the site reconnaissance during snow free conditions
(and preferably during the growing season) to ensure meaningful observations of surficial
conditions including the condition of vegetation on site and on surrounding land. Consideration
should be given to locating suitable background sampling locations during the reconnaissance.
A summary of the types of observations considered necessary to develop a sound
understanding of site conditions and to develop a CSM is included below
Where abandonment or decommissioning of a facility (i.e., flare pit, pipelines, drilling waste,
disposal areas) has occurred, depressions may be the only remaining visible evidence regarding
its location. These should be documented and considered in conjunction with other corroborative
evidence in establishing the most likely locations of unconfirmed APEC at a site. Photographs
should also be taken to record the general site condition, land use and each APEC.
In low-lying wet environments or where unsuitable substrate was identified for on-site drilling
waste disposal, a remote upland site may have been identified for the remote disposal of drilling
wastes. These should be inspected as part of the site reconnaissance.
Other ancillary facilities that can be associated with a given well site (tied to lease) include
temporary camps and access road. Based on the inferred temporary land use typical at these
types of facilities, impacts to soil and groundwater would not be anticipated. However, these
facilities should be inspected during the site reconnaissance to confirm or refute the presence of
evidence of contamination.

4 505093 / January 24, 2012Printed on Recycled Paper
Documentation of a site reconnaissance should include the following:
� Date (d/m/y): The date on which the site reconnaissance was conducted.
� Assessor: The person who conducted the site visit and their employer’s name.
� Surrounding land use: State the land use surrounding the site in all four directions.
� Topography: Describe the topography across the site. Include any topographical changes
that may occur and the relation to off lease areas.
� Vegetation: List the type of vegetation and plant species on the site and the surrounding area.
� Proximity to neighbouring features: Features such as residences, water wells, surface
waterbodies (ponds, streams, rivers) must be listed with distances from the lease provided.
� Visual indicators: Document the type of facility present, its size and location.
On-site equipment or tanks, along with visual signs of former facilities, or open or buried
earthen pits may indicate potential contamination sources.
� Evidence of past spills: Provide information on any visual indicators of contamination.
Indicators may include staining, presence of crusted soils (indicating salt spills), changes in
soil characteristics, slumping, depression areas, etc.
� Adjacent land affected by operations on the site: Any operational off lease impacts
originating from the site must be noted. This may include spills that extended off lease, off
lease vegetation impacts, rutting, and water ponding. Detailed information should be recorded
during the site visit identifying the type of impact, the potential cause, area affected, etc.
� Vegetation stress: Provide the location of any stressed vegetation and size of the impacted
area. Visual indicators of vegetation stress include bare soil or indicator plant species such as
kochia or fox tail barley, which are typically associated with saline soils.
Site construction technique (pad, cut and fill, strip to side) is important from a stratigraphic
perspective as well as understanding the reclamation status of the site. The interpretation of the
working grade of the site during drilling and operations requires an understanding of the
reclamation status of the site. For instance, the assessor should be aware if there has been
restoration of cut and fill slopes or redistribution of surface soils.

5 505093 / January 24, 2012Printed on Recycled Paper
Interviews
Interviews with knowledgeable persons may improve the understanding of environmental
conditions and historical operations at a site. Only interviews of people with first-hand
knowledge of a site are useful. Interviews are primarily completed to identify environmental
concerns at a site (e.g., spills, etc.) and to confirm APEC and PCOC at a site. Interviews can be
useful in providing additional and corroborating evidence where incomplete or partial information
was obtained from other sources during the Stage 1 PSI. Interviewees should include
landowner (or occupant[s]) and resource company representatives. The investigator should
confirm with the interviewees that they are not aware of other individuals with more complete
knowledge that might be better suited to participating in the interview process.

APPENDIX II
List of Potential Contaminants of Concern (SNC in-house reference)
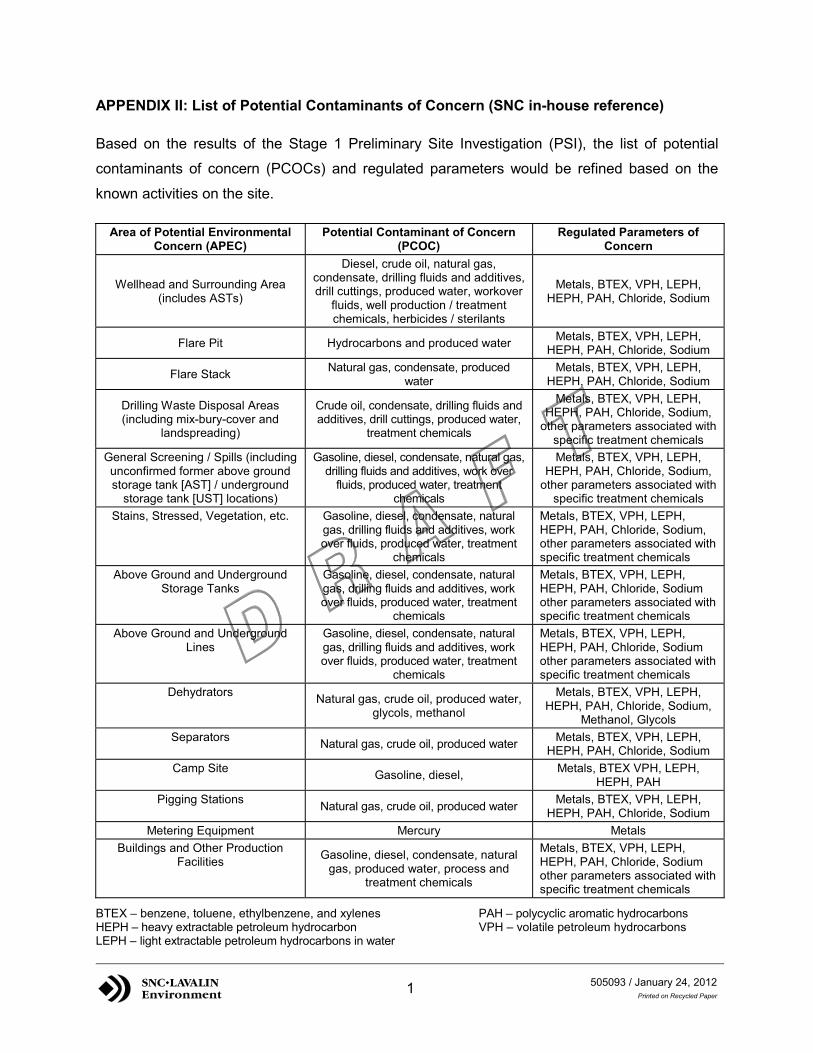
1 505093 / January 24, 2012Printed on Recycled Paper
APPENDIX II: List of Potential Contaminants of Concern (SNC in-house reference)
Based on the results of the Stage 1 Preliminary Site Investigation (PSI), the list of potential
contaminants of concern (PCOCs) and regulated parameters would be refined based on the
known activities on the site.
Area of Potential Environmental Concern (APEC)
Potential Contaminant of Concern (PCOC)
Regulated Parameters of Concern
Wellhead and Surrounding Area(includes ASTs)
Diesel, crude oil, natural gas, condensate, drilling fluids and additives, drill cuttings, produced water, workover
fluids, well production / treatment chemicals, herbicides / sterilants
Metals, BTEX, VPH, LEPH, HEPH, PAH, Chloride, Sodium
Flare Pit Hydrocarbons and produced water Metals, BTEX, VPH, LEPH, HEPH, PAH, Chloride, Sodium
Flare Stack Natural gas, condensate, produced water
Metals, BTEX, VPH, LEPH, HEPH, PAH, Chloride, Sodium
Drilling Waste Disposal Areas (including mix-bury-cover and
landspreading)
Crude oil, condensate, drilling fluids and additives, drill cuttings, produced water,
treatment chemicals
Metals, BTEX, VPH, LEPH, HEPH, PAH, Chloride, Sodium,
other parameters associated with specific treatment chemicals
General Screening / Spills (including unconfirmed former above ground storage tank [AST] / underground
storage tank [UST] locations)
Gasoline, diesel, condensate, natural gas, drilling fluids and additives, work over
fluids, produced water, treatment chemicals
Metals, BTEX, VPH, LEPH, HEPH, PAH, Chloride, Sodium,
other parameters associated with specific treatment chemicals
Stains, Stressed, Vegetation, etc. Gasoline, diesel, condensate, natural gas, drilling fluids and additives, work over fluids, produced water, treatment
chemicals
Metals, BTEX, VPH, LEPH, HEPH, PAH, Chloride, Sodium, other parameters associated with specific treatment chemicals
Above Ground and Underground Storage Tanks
Gasoline, diesel, condensate, natural gas, drilling fluids and additives, work over fluids, produced water, treatment
chemicals
Metals, BTEX, VPH, LEPH, HEPH, PAH, Chloride, Sodium other parameters associated with specific treatment chemicals
Above Ground and Underground Lines
Gasoline, diesel, condensate, natural gas, drilling fluids and additives, work over fluids, produced water, treatment
chemicals
Metals, BTEX, VPH, LEPH, HEPH, PAH, Chloride, Sodium other parameters associated with specific treatment chemicals
Dehydrators Natural gas, crude oil, produced water, glycols, methanol
Metals, BTEX, VPH, LEPH, HEPH, PAH, Chloride, Sodium,
Methanol, GlycolsSeparators Natural gas, crude oil, produced water Metals, BTEX, VPH, LEPH,
HEPH, PAH, Chloride, SodiumCamp Site Gasoline, diesel, Metals, BTEX VPH, LEPH,
HEPH, PAHPigging Stations Natural gas, crude oil, produced water Metals, BTEX, VPH, LEPH,
HEPH, PAH, Chloride, SodiumMetering Equipment Mercury Metals
Buildings and Other Production Facilities Gasoline, diesel, condensate, natural
gas, produced water, process and treatment chemicals
Metals, BTEX, VPH, LEPH, HEPH, PAH, Chloride, Sodium other parameters associated with specific treatment chemicals
BTEX – benzene, toluene, ethylbenzene, and xylenes PAH – polycyclic aromatic hydrocarbonsHEPH – heavy extractable petroleum hydrocarbon VPH – volatile petroleum hydrocarbonsLEPH – light extractable petroleum hydrocarbons in water
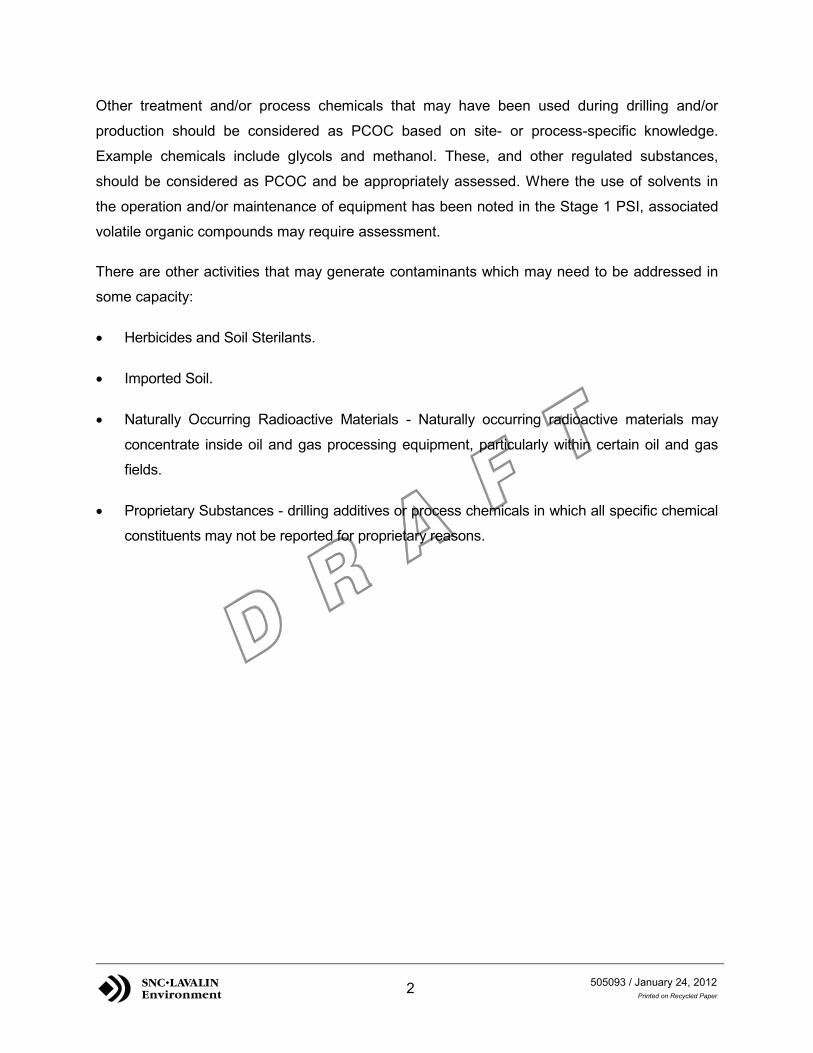
2 505093 / January 24, 2012Printed on Recycled Paper
Other treatment and/or process chemicals that may have been used during drilling and/or
production should be considered as PCOC based on site- or process-specific knowledge.
Example chemicals include glycols and methanol. These, and other regulated substances,
should be considered as PCOC and be appropriately assessed. Where the use of solvents in
the operation and/or maintenance of equipment has been noted in the Stage 1 PSI, associated
volatile organic compounds may require assessment.
There are other activities that may generate contaminants which may need to be addressed in
some capacity:
� Herbicides and Soil Sterilants.
� Imported Soil.
� Naturally Occurring Radioactive Materials - Naturally occurring radioactive materials may
concentrate inside oil and gas processing equipment, particularly within certain oil and gas
fields.
� Proprietary Substances - drilling additives or process chemicals in which all specific chemical
constituents may not be reported for proprietary reasons.

APPENDIX III
Depth-Dependant Standards
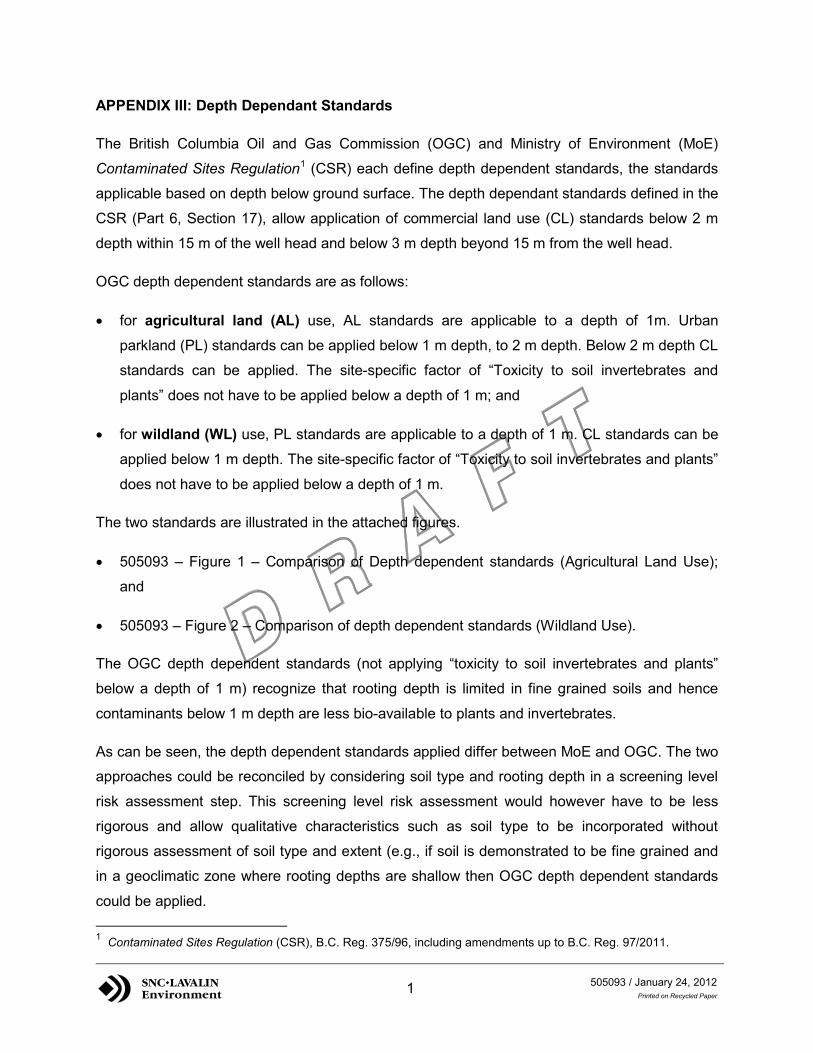
1 505093 / January 24, 2012Printed on Recycled Paper
APPENDIX III: Depth Dependant Standards
The British Columbia Oil and Gas Commission (OGC) and Ministry of Environment (MoE)
Contaminated Sites Regulation1
OGC depth dependent standards are as follows:
(CSR) each define depth dependent standards, the standards
applicable based on depth below ground surface. The depth dependant standards defined in the
CSR (Part 6, Section 17), allow application of commercial land use (CL) standards below 2 m
depth within 15 m of the well head and below 3 m depth beyond 15 m from the well head.
� for agricultural land (AL) use, AL standards are applicable to a depth of 1m. Urban
parkland (PL) standards can be applied below 1 m depth, to 2 m depth. Below 2 m depth CL
standards can be applied. The site-specific factor of “Toxicity to soil invertebrates and
plants” does not have to be applied below a depth of 1 m; and
� for wildland (WL) use, PL standards are applicable to a depth of 1 m. CL standards can be
applied below 1 m depth. The site-specific factor of “Toxicity to soil invertebrates and plants”
does not have to be applied below a depth of 1 m.
The two standards are illustrated in the attached figures.
� 505093 – Figure 1 – Comparison of Depth dependent standards (Agricultural Land Use);
and
� 505093 – Figure 2 – Comparison of depth dependent standards (Wildland Use).
The OGC depth dependent standards (not applying “toxicity to soil invertebrates and plants”
below a depth of 1 m) recognize that rooting depth is limited in fine grained soils and hence
contaminants below 1 m depth are less bio-available to plants and invertebrates.
As can be seen, the depth dependent standards applied differ between MoE and OGC. The two
approaches could be reconciled by considering soil type and rooting depth in a screening level
risk assessment step. This screening level risk assessment would however have to be less
rigorous and allow qualitative characteristics such as soil type to be incorporated without
rigorous assessment of soil type and extent (e.g., if soil is demonstrated to be fine grained and
in a geoclimatic zone where rooting depths are shallow then OGC depth dependent standards
could be applied. 1 Contaminated Sites Regulation (CSR), B.C. Reg. 375/96, including amendments up to B.C. Reg. 97/2011.

