5.1 air quality - california energy · pdf fileemission controls meeting the bact definition...
TRANSCRIPT

5.1 Air Quality 5.1.1 Introduction This section presents the methodology and results of an analysis performed to assess potential impacts of airborne emissions from the construction and routine operation of the Chula Vista Energy Upgrade Project (CVEUP). Section 5.1.1 presents the introduction, applicant information, and the basic San Diego Air Pollution Control District (SDAPCD) rules applicable to the CVEUP. Section 5.1.2 presents the project description, both current and proposed. Section 5.1.3 presents data on the emissions of criteria and air toxic pollutants from the proposed project. Section 5.1.4 discusses the best available control technology (BACT) evaluation for the project. Section 5.1.5 presents applicable laws, ordinances, regulations, and standards (LORS). Section 5.1.6 presents the air quality impact analysis for the proposed turbine replacement project. Section 5.1.7 presents agency contacts, and Section 5.1.8 presents permit requirements and schedules. Section 5.1.9 contains references cited or consulted in preparing this section.
MMC Energy, Inc. (MMC) is proposing to modify its present power generation facility located at 3497 Main Street, in Chula Vista, California, as follows:
• Remove the existing power generation equipment consisting of a Pratt & Whitney Twinpac™, Model FT4/GG4, rated at 44.5 megawatts (MW), operating in simple-cycle mode.
• Install new power generation equipment consisting of two General Electric (GE) LM6000 turbines, rated at 93 MW total, operating in simple-cycle mode. Install a new 550-kilowatt (kW) emergency generator driven by a diesel engine rated at approximately 851 brake horsepower (bhp).
The CVEUP will modernize the existing power facility by replacing the existing units with new equipment that is more efficient.
5.1.1.1 Regulatory Items Affecting Modification Although a regulatory compliance analysis (LORS) is presented in Section 5.1.5, there are several SDAPCD regulations that directly affect the permitting and review process (Determination of Compliance) for the proposed modification as follows:
• Rule 20.1(c)(63) defines a replacement emissions unit as “an emission unit which supplants another emission unit where the replacement emission unit serves the same function and purpose as the emission unit being replaced, as determined by the Air Pollution Control Officer.
• Rule 20.1(d)(3)(iv) states that “Emission increases from a replacement project or emission unit shall be calculated as the replacement project’s or emission unit’s post-project potential to emit minus the existing project’s or emission unit’s pre-project potential to emit.
• Rule 20.1(d)(4)(i)(C) states that “Reduction in the potential to emit for a replacement project or emission unit shall be calculated as the existing project’s or emission unit’s
ES062007014SAC/360346/072150001(CVEUP_005.1_AIR QUALITY.DOC) 5.1-1

5.1 AIR QUALITY
pre-project potential to emit minus the replacement project’s or emission unit’s post-project potential to emit.
• Rule 20.1(d)(4)(ii)(D) states that “Actual emission reductions from a replacement project or emission unit shall be calculated as the existing project’s or emission unit’s pre-project actual emissions minus the replacement project’s or emission unit’s post-project potential to emit.
• Rule 20.1(c)(11)(ii) states that “For modified emission units, the entire emission unit’s post-project potential to emit shall be subject to BACT, except as follows. The provisions of this Subsection (c)(11)(ii) shall not apply to relocated or replacement emission units.
BACT applies to the emissions increase associated with the modification and not the emission unit’s entire potential to emit, if control technology, an emission limit, or other emission controls meeting the BACT definition was previously applied to the unit and if the project’s emission increase is less than the major modification thresholds of Table 20.1-5 in the SDAPCD NSR Rule 20.1.
BACT applies to the emission unit’s entire post-project potential to emit, if the emission unit was previously subject to BACT but BACT was determined to not be cost-effective, technologically feasible or proven in field application.
BACT applies to the emissions increase associated with the emission unit and not the emission unit’s entire potential to emit if the emissions increase associated with the modification is less than 25 percent of the emission unit’s pre-project potential to emit and if the project’s emission increase is less than the major modification thresholds of Table 20.1-5 in the SDAPCD NSR Rule 20.1.
Rule 20.1(c)(39) states:
“Modified Stationary Source” means a stationary source where a new or modified emission unit is or will be located or where a change in the aggregation of emission units occurs, including, but not limited to, the movement of a relocated emission unit to or from a stationary source or where a modification of an existing unit occurs. The following shall not be considered a modification of a stationary source:
The replacement of an emission unit, provided there is no increase in the unit’s potential to emit or in the potential to emit of any other unit at the stationary source.
Rule 20.2 (d)(1)(iii) and Rule 20.3 (d)(1)(iii) states that “Any replacement emission unit with a post-project potential to emit of 10 pounds per day or more of particulate matter less than 10 microns in equivalent diameter (PM10), oxides of nitrogen (NOx), volatile organic compounds (VOC), or oxides of sulfur (SOx) shall be equipped with BACT for each such air contaminant.
Regulation 1, Rule 2 (b)(26) defines a major source as “a stationary source which has or will have, after issuance of a permit, an aggregate potential to emit one or more air contaminants in amounts equal to or greater than any of the following emission rates:”
5.1-2 ES062007014SAC/360346/072150001(CVEUP_005.1_AIR QUALITY.DOC)

5.1 AIR QUALITY
Air Contaminant Emission Rate
(tons/year)
Particulate Matter (PM10) 100
NOx 50
VOCs 50
SOx 100
Carbon Monoxide (CO) 100
Lead 100
Based on a reading of the regulations noted above, the proposed turbines would be classified as “replacement emissions units,” not “identical replacement units” and, as such, the rule requirements noted above would be applicable to the proposed units.
5.1.2 Project Description 5.1.2.1 Current Facility The current MMC facility is comprised of a Pratt & Whitney FT8 Twinpac™, model FT4/GG4, rated at 44.5 MW (per the APCD PTO #976039). The existing facility consists of two combustion turbines with a total heat rating of 688 million British thermal units per hour (MMBtu/hr), firing natural gas, and operating in simple-cycle mode. Each turbine is equipped with dry low NOx burners (DLN), and the common exhaust is equipped with a selective catalytic reduction (SCR) system, which includes an automatic ammonia injection system. The exhaust stack is equipped with a continuous emissions monitoring system (CEMS) and data acquisition system. The facility has a current Title V permit (#978119). In addition to the equipment noted above, the site also has the requisite power generation support systems, electrical switch yard, administrative buildings, etc. The present turbines, as noted above, have a total power rating of 44.5 MW, a calculated heat rate of 15,637 British thermal units per kilowatt-hour (Btu/kW-hr) (higher heating value [HHV]) based on firing natural gas with a heat content of 20,610 British thermal units per pound (Btu/lb) or 1,000 British thermal units per standard cubic foot (Btu/scf). The turbines combust fuel at a rate of approximately 33,383 pounds per hour (lb/hr)
The present facility is operational and has a full complement of equipment required for operation such as: gas compressors, gas let-down station, generator step-up transformer, electrical switchgear, control room, control system, lube oil system, ammonia storage and delivery system, etc. An 8-inch firewater main pipeline, a 4-inch potable water pipeline, an 8-inch natural gas pipeline and 69-kilovolt (kV) overhead transmission line have already been installed to provide these services to the existing facility. Wastewater is piped into a holding sump and eventually flows into the Chula Vista city sanitary sewer system. A copy of the current facility air permit to operate is presented in Appendix 5.1A.
5.1.2.2 Proposed Facility The proposed facility will consist of two GE LM6000 combustion turbines, each rated at 46.5 MW. These turbines will incorporate water injection for primary NOx control. Each
ES062007014SAC/360346/072150001(CVEUP_005.1_AIR QUALITY.DOC) 5.1-3

5.1 AIR QUALITY
turbine will have its own exhaust stack, as compared to the present facility, which exhausts two turbines through a common stack. In addition to water injection, each unit will be equipped with an SCR system using ammonia as the reaction agent in the final NOx control process, and CO oxidation catalyst for control of CO emissions. Each stack will have a CEMS as required by the local APCD and Title IV acid rain regulations.
Each of the new turbines will operate in simple-cycle mode and will fire natural gas only. Other equipment to be located on the modified site will support the combustion process such as demineralized water production system, water storage tank and forwarding pumps, electrical switchyard area, ammonia storage and containment area, administration building, gas compressor area, etc. Based upon a natural gas heat content of 1,018 Btu/scf (22,877 Btu/lb), each turbine will have a maximum heat rating of approximately 468.8 MMBtu/hr, with a heat rate of 8,500 Btu/kW-hr (HHV). Each turbine will consume fuel at a rate of 20,470 lb/hr (460,020 standard cubic feet per hour) at maximum rated load. To enhance power production, each turbine will be equipped with an inlet air fogging system.
In addition, the facility is proposing to add a “black start” emergency generator rated at approximately 550 kW. The generator will be driven by a compression ignition engine, firing natural gas, and rated at approximately 851 bhp. The engine will meet all applicable U.S. Environmental Protection Agency (USEPA) Tier 3 emissions standards.
All power from the facility will be sold to the California power grid under the control of the California Independent System Operator (CAISO).
Proposed equipment specifications are summarized as follows:
Turbines: • Engine Manufacturer: General Electric • Engine Model: LM6000 • Fuel: natural gas • Nominal MW rating: 46.5 MW • Number of turbines: 2 • Heat rating: 468.8 MMBtu/hr (HHV) each
IC Engine: • Manufacturer: Caterpillar • Model: 3412C TA • Fuel: Diesel or distillate oil • Revolutions per minute: 1,800 • Useable horsepower: 851 • Fuel consumption: ~48 gallons per hour (gph) • Exhaust flow: ~6,459 actual cubic feet per minute • Exhaust temperature: ~958 degrees Fahrenheit (°F) • Generator rating: 550 kW
The only fuel to be combusted on site by the combustion turbines is Public Utilities Commission (PUC)-grade natural gas supplied by the San Diego Gas and Electric Company. The gas will have an HHV of approximately 1,018 Btu/scf, and a sulfur content that is not expected to exceed 0.5 grains/100 scf. The black start diesel generator will fire only California-certified low-sulfur low-aromatic diesel fuel. Table 5.1-1 presents a fuel use
5.1-4 ES062007014SAC/360346/072150001(CVEUP_005.1_AIR QUALITY.DOC)

5.1 AIR QUALITY
summary for the proposed facility. Fuel use values are based on the maximum heat rating of each system, fuel specifications, and maximum operational scenario.
TABLE 5.1-1 Estimated Fuel Use Summary for the CVEUP
System Units Per Hour Per Day Per Year
Single Turbine mmscf 0.461 11.1 2,030
All Turbines mmscf 0.921 22.1 4,060
Black Start Diesel Engine gallons 48 48 2,496
Natural gas at 1,018 Btu/scf HHV. Diesel fuel use per manufacturer’s specification 52 hours per year estimated runtime. Modeling based on ½ hour per day, 1 day per week (26 weeks per year) mmscf = million standard cubic feet
The existing and proposed site is located in Chula Vista (City), San Diego County, California. The site is located at 3497 Main Street. The topography of the site is essentially flat, with a mean elevation of approximately 58 feet above mean sea level. The site and immediately surrounding area to the north, east, and west are primarily commercial and industrial in nature. Immediately south of the site is dedicated open space. The site occupies approximately 3.82 acres of presently industrial land. Elevations to the north, west, east, and south of the site are relatively low, i.e., similar to site elevations.
5.1.2.3 Climate and Meteorology San Diego and Chula Vista are located on San Diego Bay in the southwest corner of southern California. The prevailing winds and weather are tempered by the Pacific Ocean, with the result that summers are cool and winters warm in comparison with other places along the same general latitude. Temperatures of freezing or below have rarely occurred at the station since the record began in 1871, but hot weather, 90 degrees or above, is more frequent.
Dry easterly winds sometimes blow in the vicinity for several days at a time, bringing temperatures in the 90s and at times even in the 100s in the eastern sections of the City and outlying suburbs. At the National Weather Service station itself, however, there have been relatively few days on which 100 degrees or higher was reached.
As these hot winds are predominant in the fall, highest temperatures occur in the months of September and October. Records show that over 60 percent of the days with 90 degrees or higher have occurred in these two months. High temperatures are almost invariably accompanied by very low relative humidities, which often drop below 20 percent and occasionally below 10 percent.
A marked feature of the climate is the wide variation in temperature within short distances. In nearby valleys daytimes are much warmer in summer and nights noticeably cooler in winter, and freezing occurs much more frequently than in the City. Although records show unusually small daily temperature ranges, only about 15 degrees between the highest and lowest readings, a few miles inland these ranges increase to 30 degrees or more.
ES062007014SAC/360346/072150001(CVEUP_005.1_AIR QUALITY.DOC) 5.1-5

5.1 AIR QUALITY
Strong winds and gales associated with Pacific, or tropical storms, are infrequent due to the latitude. The seasonal rainfall is about 10 inches in the City, but increases with elevation and distance from the coast. In the mountains to the north and east the average is between 20 and 40 inches, depending on slope and elevation. Most of the precipitation falls in winter, except in the mountains where there is an occasional thunderstorm. Eighty-five percent of the rainfall occurs from November through March, but wide variations take place in monthly and seasonal totals. Infrequent measurable amounts of hail occur in San Diego, but snow is practically unknown at the Weather Service Office location. In each occurrence of snowfall only a trace was recorded officially, but in some locations amounts up to or slightly exceeding a half-inch fell, and remained on the ground for an hour or more.
As on the rest of the Pacific Coast, a dominant characteristic of spring and summer is the nighttime and early morning cloudiness. Low clouds form regularly and frequently extend inland over the coastal valleys and foothills, but they usually dissipate during the morning and the afternoons are generally clear.
Considerable fog occurs along the coast, but the amount decreases with distance inland. The fall and winter months are usually the foggiest. Thunderstorms are rare, averaging about three a year in the city. Visibilities are good as a rule. The sunshine is plentiful for a marine location, with a marked increase toward the interior.
Wind rose data supplied by the SDAPCD as representative of the site are presented in Appendix 5.1B. This data was derived from the San Diego and Miramar wind observation stations for the period 1996 through 1998.
5.1.3 Emissions Evaluation 5.1.3.1 Current Facility Emissions and Permit Limitations Data derived from the facility Title V permit (#978119) in Appendix 5.1A, indicates that the facility presently has a single operating permit (#976039) which covers the existing turbine process. The facility is limited to firing only natural gas in the turbine. Emissions limitations are as follows:
• NOx emissions may not exceed 50 tons per calendar year.
• NOx emissions may not exceed 9 parts per million by volume, dry basis (ppmvd) (15 percent oxygen [O2]) on a 1 hour basis, or 5 ppmvd over a continuous rolling 3-hour period.
• CO emissions may not exceed 250 tons per calendar year.
• CO emissions may not exceed 70 ppmvd (15 percent O2) over a 3-hour period
• VOC emissions (as methane) may not exceed 2 ppmvd (as demonstrated by source testing)
• Ammonia emissions, as a result of ammonia slip from the SCR system, may not exceed 10 ppmvd, as demonstrated by source testing
5.1-6 ES062007014SAC/360346/072150001(CVEUP_005.1_AIR QUALITY.DOC)

5.1 AIR QUALITY
The NOx and CO calendar year limitations were placed on the facility to insure its minor source classification. Annual limits on VOC, PM10, and SOx, although not stated in the permit, are implied at the following levels (per Rule 20.1):
• VOC 50 tons per year • PM10 100 tons per year • SOx 100 tons per year
Based upon the potential emissions values, on a pounds per hour basis, only NOx and CO required annual limit statements in the permit. Emissions values for the turbines as derived from a proposed modification application, dated May 2001, indicate that the approximate emissions values for the two turbines (total) are as follows:
• NOx 14.07 lb/hr • CO 108.0 lb/hr • PM10 4.54 lb/hr • VOC 1.89 lb/hr • SOx 1.58 lb/hr
A back-calculation using the pounds per hour values and the annual major source limits indicates that only NOx and CO would result in the need for annual operating hour limits, which is consistent with the permit annual emissions limits for NOx and CO (with CO being the limiting pollutant).
Table 5.1-2 presents the existing facility emissions data and shows the calculated annual hours limits for each pollutant.
TABLE 5.1-2 Current Facility Emissions Summary Data
Pollutant ppmvd lb/hr tons/year Hour Limit
NOx 5 14.07 50 7,107
CO 70 108.0 250 4,629
VOC 2 1.89 50 8,760
PM10 — 4.54 100 8,760
SOx — 1.58 100 8,760
Ammonia 10 — — —
Based on a yearly operating limit of 4,629 hours, the estimated facility potential to emit would be as shown in Table 5.1-3.
ES062007014SAC/360346/072150001(CVEUP_005.1_AIR QUALITY.DOC) 5.1-7

5.1 AIR QUALITY
TABLE 5.1-3 Potential to Emit Estimates for Current Facility
Pollutant lb/hr Maximum Hours per Year Potential to Emit (tons/year)
NOx 14.07 4,629 32.6
CO 108.0 4,629 249.97
VOC 1.89 4,629 4.4
PM10 4.54 4,629 10.51
SOx 1.58 4,629 3.7
5.1.3.2 Proposed Facility Emissions Installation and operation of the proposed new combustion turbines will result in a change in the emissions signature for the facility. Criteria pollutant emissions from the proposed new turbines are delineated in the following sections, while emissions of hazardous air pollutants (HAPs) are delineated in Section 5.9.
5.1.3.3 Normal Operations Operation of the proposed process and equipment systems will result in emissions to the atmosphere of both criteria pollutants and toxic air pollutants. Criteria pollutant emissions will consist primarily of NOx, CO, VOCs, SOx, and PM10/2.5. Air toxic pollutants will consist of a combination of toxic gases and toxic particulate matter species. Table 5.1-4 lists the pollutants that may potentially be emitted from the proposed facility.
TABLE 5.1-4 Criteria and Toxic Pollutants Potentially Emitted from the CVEUP
NOx
CO
VOC
SOx
PM10/PM2.5
Ammonia
PAHs
Acetaldehyde
Acrolein
Benzene
1-3 Butadiene
Ethylbenzene
Formaldehyde
Hexane
Naphthalene
Propylene
Propylene Oxide
Toluene
Xylene
Diesel Particulate Matter
Arsenic
Aluminum
Cadmium
Chromium III
Copper
Iron
Lead
Mercury
Manganese
Nickel
Silver
Zinc
5.1-8 ES062007014SAC/360346/072150001(CVEUP_005.1_AIR QUALITY.DOC)

5.1 AIR QUALITY
5.1.3.4 Criteria Pollutant Emissions Table 5.1-5 presents data on the criteria pollutant emissions expected from the plant equipment and systems under normal operating scenarios.
TABLE 5.1-5 Estimated Maximum Hourly, Daily, and Annual Criteria Pollutant Emissions for the CVEUP LM6000 Turbines
Pollutant Exhaust Gas
Concentration*
Emission Factor
lb/MMBtu
Max Hour Emissions, lb (each turbine)
Max Daily Emissions including startup, lb
(each turbine)
Max Annual Emissions, tons(each turbine)
NOx 2.5 ppmvd 0.00895 4.2 123.9 11.6
CO 6.0 ppmvd 0.0132 6.2 161.5 15.0
VOC 2.0 ppmvd 0.00256 1.2 27.8 2.5
SOx - 0.00234 1.1 26.4 2.4
PM10/PM2.5 - 0.0107 3.0 120.0 6.7
NH3 5 ppmvd - 3.2 75.8 6.9
Max Hour Emissions, lb
(both turbines)
Max Daily Emissions including startup, lb
(both turbines)
Max Annual Emissions, tons(both turbines)
NOx 8.4 247.8 23.2
CO 12.4 323.0 29.9
VOC 2.4 54.8 5.0
SOx 2.2 52.8 4.8
PM10/PM2.5 10.0 144.0 13.2
NH3
Same factors as above.
6.4 151.5 13.9
* NOx, CO, VOC, and SOx at 15% O2 dry. Startup/shutdown not included except where noted. PM2.5 = PM10.
Table 5.1-6 presents a summary of the black start engine emissions.
TABLE 5.1-6 Black Start Engine Emissions for the CVEUP
Pollutant Emission Factor
(g/hp-hr)
Max Hour Emissions
(lb)
Max Daily Emissions
(lb)
Max Annual Emissions
(tons)
PM10/2.5* 0.15 g/hp-hr 0.28 0.28 0.01 NOx 2.75 g/hp-hr 5.16 5.16 0.1 CO 2.60 g/hp-hr 4.88 4.88 0.1 VOC 0.25 g/hp-hr 0.47 0.47 0.01 SOx 0.1759 g/hp-hr 0.33 0.33 0.01
* All particulate matter is classified as diesel particulate matter (DPM)
ES062007014SAC/360346/072150001(CVEUP_005.1_AIR QUALITY.DOC) 5.1-9
5.1 AIR QUALITY
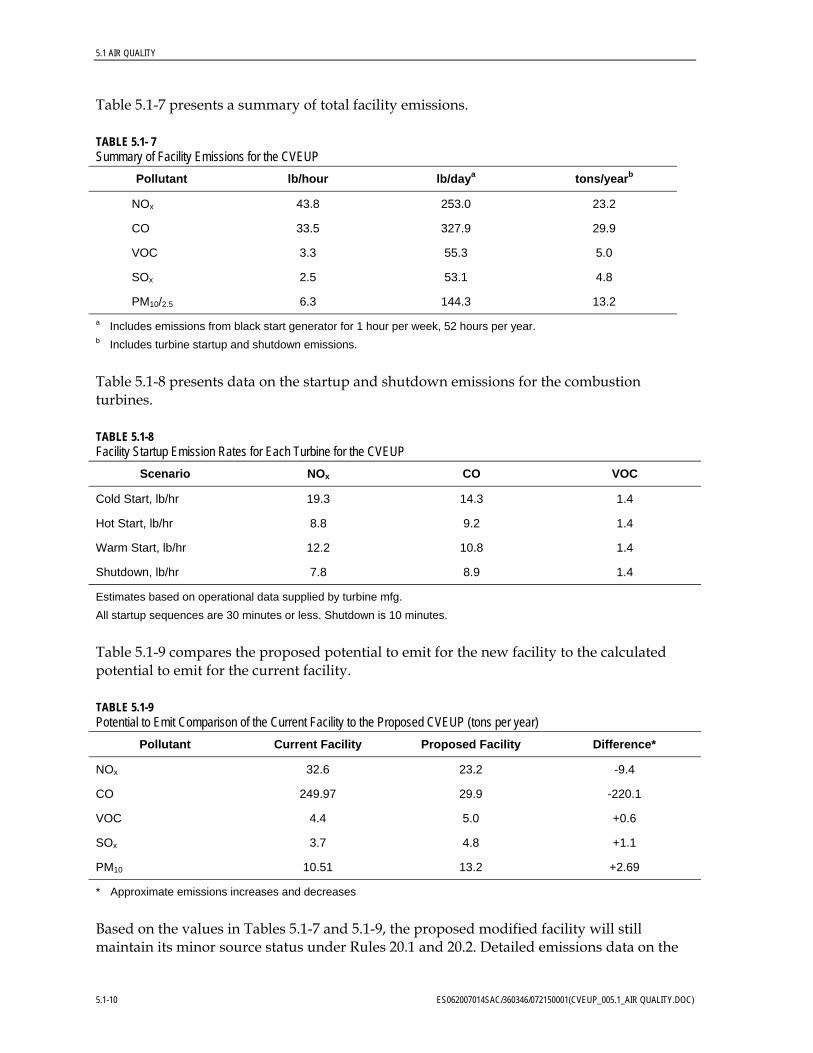
Table 5.1-7 presents a summary of total facility emissions.
TABLE 5.1- 7 Summary of Facility Emissions for the CVEUP
Pollutant lb/hour lb/daya tons/yearb
NOx 43.8 253.0 23.2
CO 33.5 327.9 29.9
VOC 3.3 55.3 5.0
SOx 2.5 53.1 4.8
PM10/2.5 6.3 144.3 13.2 a Includes emissions from black start generator for 1 hour per week, 52 hours per year. b Includes turbine startup and shutdown emissions.
Table 5.1-8 presents data on the startup and shutdown emissions for the combustion turbines.
TABLE 5.1-8 Facility Startup Emission Rates for Each Turbine for the CVEUP
Scenario NOx CO VOC
Cold Start, lb/hr 19.3 14.3 1.4
Hot Start, lb/hr 8.8 9.2 1.4
Warm Start, lb/hr 12.2 10.8 1.4
Shutdown, lb/hr 7.8 8.9 1.4
Estimates based on operational data supplied by turbine mfg. All startup sequences are 30 minutes or less. Shutdown is 10 minutes.
Table 5.1-9 compares the proposed potential to emit for the new facility to the calculated potential to emit for the current facility.
TABLE 5.1-9 Potential to Emit Comparison of the Current Facility to the Proposed CVEUP (tons per year)
Pollutant Current Facility Proposed Facility Difference*
NOx 32.6 23.2 -9.4
CO 249.97 29.9 -220.1
VOC 4.4 5.0 +0.6
SOx 3.7 4.8 +1.1
PM10 10.51 13.2 +2.69
* Approximate emissions increases and decreases
Based on the values in Tables 5.1-7 and 5.1-9, the proposed modified facility will still maintain its minor source status under Rules 20.1 and 20.2. Detailed emissions data on the
5.1-10 ES062007014SAC/360346/072150001(CVEUP_005.1_AIR QUALITY.DOC)
5.1 AIR QUALITY
proposed facility are presented in Appendix 5.1A. The proposed facility modifications will not trigger the Prevention of Significant Deterioration (PSD) program requirements, therefore a PSD increment analysis protocol is not required (see Appendix 5.1C). The proposed criteria pollutant mitigation strategy for CVEUP is discussed in Appendix 5.1G.
5.1.3.5 Hazardous Air Pollutants See Section 5.9 for a detailed discussion and quantification of hazardous air pollutant emissions from the proposed facility. See Appendix 5.1D for the public health analysis support materials.
5.1.3.6 Construction Construction-related emissions are expected to be minimal due to the following:
• The site is only 3.82 acres in size, and is essentially flat.
• Minimal site preparation will be required prior to construction of the building pads, foundations, support structures, etc.
• Construction activity is expected to last for a total of 7 to 8 months.
Construction-related issues and emissions at the MMC site are consistent with issues and emissions encountered at any construction site. Compliance with the provisions of the following permits will generally result in minimal site emissions: (1) grading permit, (2) storm water pollution prevention plan requirements (construction site provisions), (3) use permit, (4) building permits, and (5) the air district authority to construct permit, which will require compliance with the provisions of all applicable fugitive dust rules that pertain to the site construction phase. An analysis of construction site emissions is presented in Appendix 5.1E. This analysis incorporates the following mitigation measures or control strategies:
• Construction equipment exhaust emissions will comply with all applicable USEPA and California emissions standards for each equipment type and category.
• Construction equipment will use only California-certified diesel (low sulfur, low aromatic content) and gasoline fuels.
• Each piece of equipment will be included in a preventative maintenance program to ensure correct operation and to minimize exhaust emissions.
• Equipment use scheduling will minimize equipment onsite time as well as idling time once onsite.
• Water will be used as the primary fugitive dust suppression control method. Water will applied to all disturbed portions of the site, including unpaved roads, parking and laydown areas, at a minimum of twice daily.
• Track-out sites will either be sweep or water flushed on a daily basis to remove track-out materials from all paved access roads.
• Vehicle speeds will be generally limited to 5 miles per hour onsite.
ES062007014SAC/360346/072150001(CVEUP_005.1_AIR QUALITY.DOC) 5.1-11

5.1 AIR QUALITY
• Reasonable erosion control strategies will be Implemented to prevent soil and silt runoff from the site.
• Disturbed areas will be re-vegetated as soon as practical.
• All trucks entering or leaving the site will cover all loads of soils, sands, and other loose materials, or each truck will provide a minimum freeboard height of 2 feet.
• Water or chemical surface stabilizers will be used on any storage piles or identified wind erosion areas.
Use of these mitigation measures and control strategies will ensure that the site does not cause any violations of existing air quality standards as a result of construction-related activities.
5.1.4 Best Available Control Technology Evaluation 5.1.4.1 Current Facility Control Technologies Table 5.1-10 summarizes the control technologies currently installed on the Pratt & Whitney Twinpac turbines.
TABLE 5.1-10 Current Turbine BACT Controls, Pratt & Whitney Twinpac Engines
Pollutant BACT Emissions Limit BACT System(s)
NOx 9 ppmvd – 1 Hour Avg 5 ppmvd – 3 Hour Avg
50 tons per year
Low NOx Burner and SCR
CO 70 ppmvd – 3 Hour Avg 250 tons per year
Good Combustion Practices
VOC 2 ppmvd Good Combustion Practices
SOx — Natural Gas
PM10 — Natural Gas
NH3 10 ppmvd —
5.1.4.2 Proposed Facility Best Available Control Technology Table 5.1-11 presents the BACT for the proposed new turbines.
TABLE 5.1-11 Proposed BACT for the CVEUP LM6000 Turbines
Pollutant Proposed BACT Emissions Level
Proposed BACT System(s)
Meets Current BACT Requirements
NOx 2.5 ppmvd Water injection with SCR Yes
CO 6.0 ppmvd CO Catalyst and Good Combustion Practices
Yes
5.1-12 ES062007014SAC/360346/072150001(CVEUP_005.1_AIR QUALITY.DOC)

5.1 AIR QUALITY
TABLE 5.1-11 Proposed BACT for the CVEUP LM6000 Turbines
Pollutant Proposed BACT Emissions Level
Proposed BACT System(s)
Meets Current BACT Requirements
VOC 2.0 ppmvd Natural Gas, CO Catalyst, Good Combustion
Practices
Yes
SOx — Natural Gas with total sulfur less than 0.5 gr / 100 scf
Yes
PM10/ PM2.5 — Natural Gas with total sulfur less than 0.5 gr / 100 scf
Yes
Ammonia Slip 5 ppmvd SCR catalyst with ammonia reactant
Yes
See Table 5.1-5 for BACT-related mass emissions values.
These emissions rates, as proposed for BACT, are consistent with recent BACT determinations, as summarized in the Tables 5.1-12 through 5.12-15.
TABLE 5.1-12 South Coast Air Quality Management District BACT Data for Simple-Cycle Gas Turbines
Pollutant BACT Typical Technology
NOx 5 ppm dry @ 15% O2, 1 or 3 hr avg a. SCR + DLN, or, b. SCR + water or steam injection
Sulfur Dioxide Natural gas fuel PUC-regulated gas
CO 6 ppm dry @ 15% O2, 1 or 3 hr avg Catalytic oxidation
VOC 2 ppm dry @ 15% O2 Catalytic oxidation
PM10 Natural gas fuel PUC regulated gas
Achieved in practice, from SACQMD website August 2005
TABLE 5.1-13 South Coast Air Quality Management District Recent BACT Decisions for Simple-Cycle Gas Turbines (achieved in practice)
Facility NOx CO VOC PM10/ SOx
Colton 3.5* 6 2 Natural gas
Indigo 5 6 2 Natural gas
LADWP-Valley 5 6 2 Natural gas
Ammonia slip BACT is 5 ppmv for all listings. SCR for NOx all listings. CO catalyst for CO and VOC all listings. * Dated 2-17-04, applicant proposed 3.5 ppm NOx, while AQMD states 5 ppm NOx is BACT/LAER From South Coast Air Quality Management District website, August 2005.
ES062007014SAC/360346/072150001(CVEUP_005.1_AIR QUALITY.DOC) 5.1-13

5.1 AIR QUALITY
TABLE 5.1-14 Summary of BACT Recommendations from ARB-CEC BACT Guidance (Simple-Cycle)
NOX CO VOC SOX PM10
5 ppm dry @15% O2, 3 hr avg
5 ppm NH3 slip @ 15% O2
6 ppm dry @15% O2
3 hr avg
2 ppm dry @ 15% O2
3 hr avg
Natural Gas Fuel
Fuel S< 1gr / 100 scf
Natural Gas Fuel
Source: CARB, 1999.
TABLE 5.1-15 Recent Facility BACT Determinations for Large Simple-Cycle Gas Turbines
Facility/Location NOX CO VOC PM10/SOX
GWF Tracy 5 ppm 6 ppm 2 ppm Natural gas
Enpower Corp. CPA Peaker Analysis*
5-8 ppm 6-10 ppm 2-3 ppm Natural gas
Henrietta Peakers 3.6 ppm 6 ppm 2 ppm Natural gas
Los Esteros 5 ppm 6 ppm 2 ppm Natural gas
Calpeak-Enterprise 5 ppm 6 ppm 2 ppm Natural gas
Calpeak-Border 5 ppm 6 ppm 2 ppm Natural gas
RAMCO 5 ppm 6 ppm 2 ppm Natural gas
* Not a public domain document. ppm = parts per million
The USEPA RACT-BACT-LAER Clearinghouse (RBLC) was also consulted to review recent USEPA BACT decisions for simple-cycle gas-fired gas turbines. These recent BACT decisions are summarized in Table 5.1-16.
TABLE 5.1-16 Simple-Cycle Turbine RBLC BACT Determinations (Natural Gas)
RBLC ID Unit Size, MMBtu/hr
NOx ppm
CO ppm
VOC ppm
CA0997 1611 2 4 1.4
VA0263 1624 10.5 9 —
VA0266 1624 9 9 —
VA0262 866 9 51 2.6
VA0261 2132 — 2 1.7
IA0060 — 3 5 —
SC0064 1751 2.5 14 —
OK0072 1832 3.5 17.2 —
5.1-14 ES062007014SAC/360346/072150001(CVEUP_005.1_AIR QUALITY.DOC)

5.1 AIR QUALITY
TABLE 5.1-16 Simple-Cycle Turbine RBLC BACT Determinations (Natural Gas)
RBLC ID Unit Size, MMBtu/hr
NOx ppm
CO ppm
VOC ppm
VA0250 1887 2.5 — —
FL0232 1591 25 10 —
IN0095 469 25 25 —
MI0327 1679 15 — —
CA0593 412 5 6 2
MI0296 855 9 25 —
IN0096 1146 9 25 —
FL0227 1803 9 7.4 1.4
FL0229 1910 9 9 1.4
MI0321 849 9 25 —
CA0951 464 5 6 2
SC0058 3296 3.5 11.7 3.5
AR0042 6077 3.5 7 —
NM0043 1500 9 9 7
Average - 8.5 13.9 2.55
Range 412 – 6077 2 -25 2 – 51 1.4 – 7
A representative compilation of BACT determinations is presented in AWMA Paper #42752 (June 2002), “Comparison of the Most Recent BACT Determinations for Combustion Turbines by State Air Pollution Control Agencies.” Data presented in this paper was derived from surveys conducted nationwide. Simple-cycle BACT data is summarized as follows:
• NOx 5-12 ppm • CO 9-25 ppm • VOC No Data • PM10 Natural gas fuel • Sulfur Dioxide (SO2) Natural gas fuel
Based on the above data, the most appropriate and current range for BACT for simple-cycle combustion turbines (achieved in practice) is as follows:
• NOx 5 ppm (DLN, DLN+SCR, SCR + water/steam injection) • CO 6 ppm (good combustion practices [GCP], GCP + CO catalyst) • VOC 2 ppm GCP, GCP + CO catalyst) • PM10 Natural gas fuel (clean fuel) • SOx Natural gas fuel (clean fuel)
ES062007014SAC/360346/072150001(CVEUP_005.1_AIR QUALITY.DOC) 5.1-15

5.1 AIR QUALITY
Based on the above data, the proposed emissions levels for the new LM6000 turbines meet the BACT requirements of the SDAPCD.
5.1.4.3 Combined Cycle – Alternative BACT MMC Energy is not proposing to build a combined-cycle power plant for the following reasons:
1. The SDG&E has identified a need for peaking capacity, including fast-start capability. A combined-cycle facility would not be able to meet these requirements. Also, the addition of a correctly sized steam turbine would increase the power output of the proposed facility to well over the capacity of the existing electrical interconnection equipment. MMC Energy, Inc. has made a business decision to limit the facility megawattage increase to remain within the capacity of the existing electrical interconnection and provide peaking power. This decision was made in light of current power needs, financing and construction time periods, time frame to meet commercial operations date, need to have a facility that can start quickly to provide peak power to the grid in a minimum amount of time, site size, and a desire to minimize other environmental impacts such as land use, noise, water use, etc.
2. A combined-cycle plant (with a fired or non-fired heat recovery steam generator [HRSG]) would require the addition of a cooling tower. The type of tower would most likely be a wet tower, as the site is estimated to be too small to handle the installation of the additional equipment for the combined-cycle alternative and a dry tower system. A wet tower would increase PM10/ PM2.5 emissions as well as HAP emissions. In addition, a wet tower would increase the water use rate at the site, as well as impact the wastewater discharges to the municipal sewer system.
3. A combined-cycle facility that utilizes a non-fired HRSG would be expected to have the same pollution control equipment as the proposed modification and, as such, the emissions would be essentially be the same for this configuration.
4. A combined-cycle facility with a fired HRSG would result in an increase in emissions from the fuel burned in the duct burner system, and would result in the same power impacts as noted item #1.
5. The owner may not be able to secure an amended power purchase agreement to sell the additional electricity from a combined-cycle plant which would have direct ramifications on the financing and cost effectiveness of the plant (i.e., cost of power produced versus rate-payer issues).
Therefore, the combined-cycle configuration has not been chosen by MMC Energy as a viable alternative to the proposed simple-cycle modification and BACT pollution control systems. Appendix 5.1F contains a similar analysis prepared for the RAMCO Miramar Energy Facility by a Resource Catalysts Project Team (May 2004) which presents a detailed cost and configuration analysis for an LM6000 turbine similar to the one proposed for the CVEUP. The conclusion of the analysis was that the combined-cycle configuration did not result in any greater emissions reductions than the simple-cycle proposal, and the costs for the combined-cycle alternative were prohibitive.
5.1-16 ES062007014SAC/360346/072150001(CVEUP_005.1_AIR QUALITY.DOC)

5.1 AIR QUALITY
5.1.5 Air Quality Impact Analysis This section describes the results, in both magnitude and spatial extent of ground level concentrations resulting from emissions from the CVEUP. The maximum modeled concentrations were added to the maximum background concentrations to calculate a total impact.
Potential air quality impacts were evaluated based on air quality dispersion modeling, as described in herein. All input and output modeling files are contained on a CD-ROM disk provided to CEC Staff under separate cover. All modeling analyses were performed using the techniques and methods as discussed with the SDAPCD (Desiena, 2006).
5.1.5.1 Dispersion Modeling For modeling the potential impact of the project in terrain that is both below and above stack top (defined as simple terrain when the terrain is below stack top and complex terrain when it is above stack top) the AERMOD (V04300) was used as well as the latest versions of the meteorological (AERMET) and terrain (AERMAP) preprocessors (both V04300). The purpose of the AERMOD modeling analysis was to evaluate compliance with the California and federal air quality standards.
The meteorological data for AERMOD was provided by the SDAPCD. Three years (2000-2002) of hourly data collected in Chula Vista at 80 East J Street was combined with three years of upper air data from Miramar for the same time period.
As part of the input requirements into AERMET and AERMOD, a land use classification must be made. The area surrounding the Chula Vista Monitoring Station was determined to be primarily urban. Similarly, following the methods outlined by the Auer land use classification method, the land use within a 3-kilometer radius around the project can be classified as urban. As part of the AERMET input requirements, Albedo, Bowen Ratio, and Surface Roughness must be classified by season. These were provided by the SDAPCD.
AERMOD input data options are listed below. Use of these options follows the USEPA’s (November, 2005) modeling guidance, SDAPCD guidance, and/or sound scientific practice. An explanation of these options and the rationale for their selection is provided below.
• Final plume rise • Stack tip downwash • Default option for temperature gradients, wind profile exponents, and calm processing • Elevated receptor terrain heights option
The option of not selecting urban dispersion coefficients, as described below, follows AERMOD guidance when high quality turbulence data is collected in an urban environment. This avoids the double counting of the effects of the urban heat island.
5.1.5.2 Model Selection Several other USEPA models and programs were used to quantify pollutant impacts on the surrounding environment based on the emission sources operating parameters and their locations. The models used were Building Profile Input Program for PRIME (BPIP-PRIME, current version 04274), the SCREEN3 (version 96043) dispersion model for fumigation impacts, and the Industrial Source Complex – Short Term dispersion model (ISCST3, current
ES062007014SAC/360346/072150001(CVEUP_005.1_AIR QUALITY.DOC) 5.1-17

5.1 AIR QUALITY
version 02035) which is used in the health risk assessment. These models, along with options for their use and how they are used, are discussed below. These models were used for the following:
• Comparison of impacts to significant impact levels • Compliance with state and federal ambient air quality standards (AAQS) • Calculation of health risk impacts
5.1.5.3 Good Engineering Practice Stack Height Analysis Good engineering practice (GEP) stack height was calculated at 90 feet based on existing onsite and offsite structure dimensions. The design stack height of 70 feet does not exceed GEP stack height, thus downwash effects were included in the modeling analysis.
BPIP-PRIME was used to generate the wind-direction-specific building dimensions for input into ISCST3. All onsite and the nearby offsite structures were included for analysis with BPIP. The building location plan, located in Appendix 5.1B, shows the buildings included in the downwash analysis.
5.1.5.4 Receptor Grid Selection and Coverage Receptor and source base elevations were determined from the U.S. Geological Survey (USGS) Digital Elevation Model (DEM) data using the 7½ minute format data (10-meter spacing between grid nodes). All coordinates were referenced to UTM North American Datum 1927 (NAD27), zone 11. The receptor locations and elevations from the DEM files will be placed exactly on the DEM nodes. Every effort will be made to maintain receptor spacing across DEM file boundaries.
Cartesian coordinate receptor grids are used to provide adequate spatial coverage surrounding the project area for assessing ground-level pollution concentrations, to identify the extent of significant impacts, and to identify maximum impact locations. The receptor grids used in this analysis are as follows:
• 10-meter resolution from the project fenceline and extending outwards in all directions 500 meters. This is called the downwash grid. In addition, receptors were placed at 10-meter intervals or less along the property fenceline.
• 50-meter resolution that extends outwards from the edge of the downwash grid to 2 kilometers in all directions. This is referred to as the intermediate grid.
• 200-meter resolution that extends outwards from the edge of the intermediate grid to 10 kilometers in all directions in receptor areas inside the contiguous United States (receptor elevations are not available in USGS datasets for areas inside Mexico, which are 6 kilometers or more from the project site). This is referred to as the coarse grid.
• 10-meter resolution around any location on the coarse and intermediate grids where a maximum impact is modeled that is above the concentrations on the downwash grid. In the modeling analyses, all overall maximum impacts occurred in the downwash receptor grid, so no refined receptor grids were required.
5.1-18 ES062007014SAC/360346/072150001(CVEUP_005.1_AIR QUALITY.DOC)
5.1 AIR QUALITY
Concentrations within the facility fenceline will not be calculated. The coarse and fine receptor grid figure, located in Appendix 5.1B, displays the receptors grids used in the modeling assessment. A facility boundary figure is also presented in Appendix 5.1B.
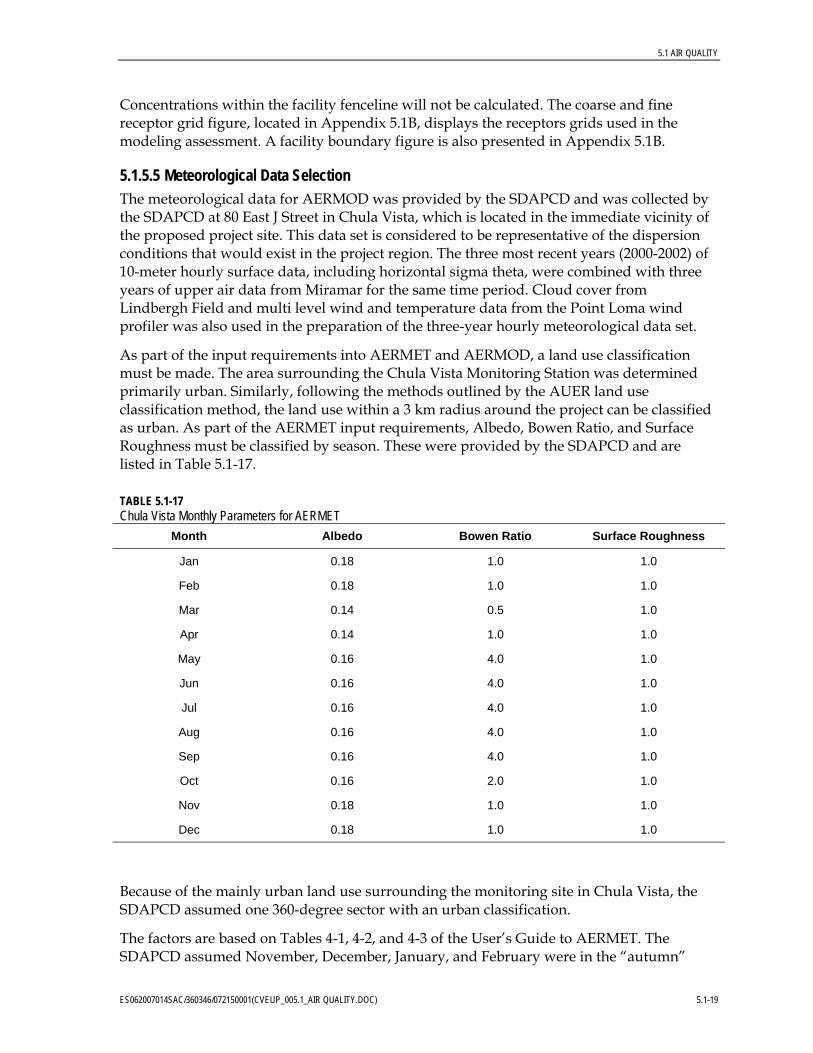
5.1.5.5 Meteorological Data Selection The meteorological data for AERMOD was provided by the SDAPCD and was collected by the SDAPCD at 80 East J Street in Chula Vista, which is located in the immediate vicinity of the proposed project site. This data set is considered to be representative of the dispersion conditions that would exist in the project region. The three most recent years (2000-2002) of 10-meter hourly surface data, including horizontal sigma theta, were combined with three years of upper air data from Miramar for the same time period. Cloud cover from Lindbergh Field and multi level wind and temperature data from the Point Loma wind profiler was also used in the preparation of the three-year hourly meteorological data set.
As part of the input requirements into AERMET and AERMOD, a land use classification must be made. The area surrounding the Chula Vista Monitoring Station was determined primarily urban. Similarly, following the methods outlined by the AUER land use classification method, the land use within a 3 km radius around the project can be classified as urban. As part of the AERMET input requirements, Albedo, Bowen Ratio, and Surface Roughness must be classified by season. These were provided by the SDAPCD and are listed in Table 5.1-17.
TABLE 5.1-17 Chula Vista Monthly Parameters for AERMET
Month Albedo Bowen Ratio Surface Roughness
Jan 0.18 1.0 1.0
Feb 0.18 1.0 1.0
Mar 0.14 0.5 1.0
Apr 0.14 1.0 1.0
May 0.16 4.0 1.0
Jun 0.16 4.0 1.0
Jul 0.16 4.0 1.0
Aug 0.16 4.0 1.0
Sep 0.16 4.0 1.0
Oct 0.16 2.0 1.0
Nov 0.18 1.0 1.0
Dec 0.18 1.0 1.0
Because of the mainly urban land use surrounding the monitoring site in Chula Vista, the SDAPCD assumed one 360-degree sector with an urban classification.
The factors are based on Tables 4-1, 4-2, and 4-3 of the User’s Guide to AERMET. The SDAPCD assumed November, December, January, and February were in the “autumn”
ES062007014SAC/360346/072150001(CVEUP_005.1_AIR QUALITY.DOC) 5.1-19

5.1 AIR QUALITY
category, March and April were “spring”, and May, June, July, August, and September were “summer”. San Diego does not have snow cover so there are no months that would be categorized as winter.
For the Bowen ratio, the SDAPCD used Table 4-2c for November, December, January, February, and March. These months are during the rainy season in San Diego so SDAPCD used the wet conditions table. For April and October SDAPCD used Table 4-2b for average moisture conditions to represent the transition between the wet and dry season. For the rest of the summer months the SDAPCD used Table 4-2a for dry moisture conditions during the dry season.
To avoid double-counting the effects of the urban heat island because of the use of high-quality measured onsite turbulence data, AERMOD was used without the urban option. This was done because the meteorological data is sufficient to fully define the profiles of wind, temperature, and turbulence, and because it includes estimates of the urban nighttime mixing height. See Appendix 5.1B for support data.
5.1.5.6 Background Air Quality In 1970, the United States Congress instructed the USEPA to establish standards for air pollutants, which were of nationwide concern. This directive resulted from the concern of the effects of air pollutants on the health and welfare of the public. The resulting Clean Air Act (CAA) set forth air quality standards to protect the health and welfare of the public. Two levels of standards were promulgated—primary standards and secondary standards. Primary national ambient air quality standards (NAAQS) are “those which, in the judgment of the administrator [of the USEPA], based on air quality criteria and allowing an adequate margin of safety, are requisite to protect the public health (state of general health of community or population).” The secondary NAAQS are “those which in the judgment of the administrator [of the USEPA], based on air quality criteria, are requisite to protect the public welfare and ecosystems associated with the presence of air pollutants in the ambient air.” To date, NAAQS have been established for seven criteria pollutants as follows: SO2, carbon monoxide (CO), ozone, nitrogen dioxide (NO2), sub 10-micron particulate matter (PM10), sub 2.5-micron particulate matter (PM2.5), and lead.
The criteria pollutants are those that have been demonstrated historically to be widespread and have a potential to cause adverse health impacts. USEPA developed comprehensive documents detailing the basis of, or criteria for, the standards that limit the ambient concentrations of these pollutants. The State of California has also established AAQS that further limit the allowable concentrations of certain criteria pollutants. Review of the established air quality standards is undertaken by both USEPA and the State of California on a periodic basis. As a result of the periodic reviews, the standards have been updated, i.e., amended, and additions, and deletions, over the ensuing years to the present.
Each federal or state AAQS is comprised of two basic elements: (1) a numerical limit expressed as an allowable concentration, and (2) an averaging time which specifies the period over which the concentration value is to be measured. Table 5.1-18 presents the current federal and state AAQS.
5.1-20 ES062007014SAC/360346/072150001(CVEUP_005.1_AIR QUALITY.DOC)

5.1 AIR QUALITY
TABLE 5.1-18 State and Federal Ambient Air Quality Standards
Pollutant Averaging Time California Standards
Concentration National Standards
Concentration
1 hour 0.09 ppm (180 µg/m3) - Ozone
8 hour 0.07 ppm (137 µg/m3) 0.08 ppm (157 µg/m3) (3-year average of annual
4th-highest daily maximum)
8 hour 9.0 ppm (10,000 μg/m3) 9 ppm (10,000 μg/m3) Carbon Monoxide
1 hour 20 ppm (23,000 μg/m3) 35 ppm (40,000 μg/m3)
Annual Average 0.03 ppm (56 µg/m3) 0.053 ppm (100 µg/m3) Nitrogen dioxide
1 hour 0.18 ppm (338 µg/m3) -
Annual Average - 0.03 ppm (80 µg/m3)
24 hour 0.04 ppm (105 µg/m3) 0.14 ppm (365 µg/m3)
3 hour - 0.5 ppm (1,300 µg/m3)
Sulfur dioxide
1 hour 0.25 ppm (655 µg/m3) -
24 hour 50 µg/m3 150 µg/m3 Respirable particulate matter (10 micron)
Annual Arithmetic Mean 20 µg/m3 -
Annual Arithmetic Mean 12 µg/m3 15 µg/m3 (3-year average) Fine particulate matter (2.5 micron)
24 hour - 35 µg/m3 (3-year average of 98th percentiles)
Sulfates 24 hour 25 µg/m3 -
30 day 1.5 µg/m3 - Lead
Calendar Quarter - 1.5 µg/m3
µg/m3 = micrograms per cubic meter Source: CARB website, table updated 2/22/07
Brief descriptions of health effects for the main criteria pollutants are as follows.
Ozone—Ozone is a reactive pollutant that is not emitted directly into the atmosphere, but rather is a secondary air pollutant produced in the atmosphere through a complex series of photochemical reactions involving precursor organic compounds (POC) and NOx. POC and NOx are, therefore, known as precursor compounds for ozone. Significant ozone production generally requires ozone precursors to be present in a stable atmosphere with strong sunlight for approximately three hours. Ozone is a regional air pollutant because it is not emitted directly by sources, but is formed downwind of sources of POC and NOx under the influence of wind and sunlight. Short-term exposure to ozone can irritate the eyes and cause constriction of the airways. In addition to causing shortness of breath, ozone can aggravate existing respiratory diseases such as asthma, bronchitis, and emphysema.
Carbon Monoxide—Carbon monoxide is a non-reactive pollutant that is a product of incomplete combustion. Ambient carbon monoxide concentrations generally follow the
ES062007014SAC/360346/072150001(CVEUP_005.1_AIR QUALITY.DOC) 5.1-21

5.1 AIR QUALITY
spatial and temporal distributions of vehicular traffic and are also influenced by meteorological factors such as wind speed and atmospheric mixing. Under inversion conditions, carbon monoxide concentrations may be distributed more uniformly over an area out to some distance from vehicular sources. When inhaled at high concentrations, carbon monoxide combines with hemoglobin in the blood and reduces the oxygen-carrying capacity of the blood. This results in reduced oxygen reaching the brain, heart, and other body tissues. This condition is especially critical for people with cardiovascular diseases, chronic lung disease or anemia, as well as fetuses.
Particulate Matter (PM10 and PM2.5) —PM10 consists of particulate matter that is 10 microns or less in diameter (a micron is 1 millionth of a meter), and fine particulate matter, PM2.5, which consists of particulate matter 2.5 microns or less in diameter. Both PM10 and PM2.5 represent fractions of particulate matter, which can be inhaled into the air passages and the lungs and can cause adverse health effects. Particulate matter in the atmosphere results from many kinds of dust- and fume-producing industrial and agricultural operations, combustion, and atmospheric photochemical reactions. Some of these operations, such as demolition and construction activities, contribute to increases in local PM10 concentrations, while others, such as vehicular traffic, affect regional PM10 concentrations.
NAAQS for particulate matter were first established in 1971. The standards covered total suspended particulate matter (TSP), or particles that are 30 microns or smaller in diameter. In 1987, USEPA changed the standards from TSP to PM10 as the new indicator. The new standards were based on a comprehensive study of information on the health effects from inhaling particulate matter. In December 1994, the USEPA began a long review process to determine if the PM10 standards set in 1987 provide a reasonable margin of safety, and if a new standard should be established for finer particles.
Based on numerous epidemiological studies and other health- and engineering-related information, USEPA established new standards for PM2.5 in 1997. Before establishing the new PM2.5 standards, discussions were conducted with the Clean Air Scientific Advisory Committee (CASAC). CASAC is a group of nationally recognized experts in the fields related to air pollution, environmental health, and engineering. CASAC reviewed and commented on the information generated by USEPA regarding proposed particulate matter standards.
Subsequent to these discussions and reviews, USEPA established PM2.5 standards of 35 μg/m3, 24-hour average concentration, and 15 μg/m3, annual average concentration. USEPA also confirmed the national PM10 standards of 150 μg/m3, 24-hour average, and 50 μg/m3, annual average, as providing an adequate margin of safety for limiting exposure to larger particles. The recommendations for new PM2.5 standards and for maintaining the PM10 standards were released in a staff report that presents the conclusions of the USEPA and of the CASAC review committee.
Several studies that USEPA relied on for its staff report have shown an association between exposure to particulate matter, both PM10 and PM2.5, and respiratory ailments or cardiovascular disease. Other studies have related particulate matter to increases in asthma attacks. In general, these studies have shown that short-term and long-term exposure to particulate matter can cause acute and chronic health effects. PM2.5, which can penetrate deep into the lungs, causes more serious respiratory ailments. These studies, along with
5.1-22 ES062007014SAC/360346/072150001(CVEUP_005.1_AIR QUALITY.DOC)

5.1 AIR QUALITY
information provided by USEPA in the 1996 staff report, were used as the basis for evaluating the impacts of the proposed facility emissions of PM10 and PM2.5, on public health.
Nitrogen Dioxide and Sulfur Dioxide—Nitrogen dioxide (NO2) and SO2 are two gaseous compounds within a larger group of compounds, NOx and SOx, respectively, which are products of the combustion of fuel. NOx and SOx emission sources can elevate local NO2 and SO2 concentrations, and both are regional precursor compounds to particulate matter. As described above, NOx is also an ozone precursor compound and can affect regional visibility. (Nitrogen dioxide is the “whiskey brown-colored” gas readily visible during periods of heavy air pollution.) Elevated concentrations of these compounds are associated with increased risk of acute and chronic respiratory disease.
SO2 and NOx emissions can be oxidized in the atmosphere to eventually form sulfates and nitrates, which contribute to acid rain. Large power plants with high emissions of these substances because of the use of coal or oil are subject to emissions reductions under the Phase I Acid Rain Program of Title IV of the 1990 CAA Amendments. Power plants, with individual equipment capacity of 25 MW or greater that use natural gas or other fuels with low sulfur content, are subject to the Phase II Program of Title IV. The Phase II program requires plants to install CEMS in accordance with the Code of Federal Regulations (40 CFR Part 75) and report annual emissions of SOx and NOx.
Lead—Gasoline-powered automobile engines used to be the major source of airborne lead in urban areas. Excessive exposure to lead concentrations can result in gastrointestinal disturbances, anemia, and kidney disease, and, in severe cases, neuromuscular and neurological dysfunction. The use of lead additives in motor vehicle fuel has been eliminated in California, and lead concentrations have declined substantially as a result.
The nearest criteria pollutant air quality monitoring site to the proposed project site would be the station located in Chula Vista. Ambient monitoring data for this site for the most recent 3-year period is summarized in Table 5.1-19. Data from this site is estimated to present a reasonable representation of background air quality for the project site and impact area.
TABLE 5.1-19 Monitoring Data Summary (Highest Monitored Values)
Pollutant Site Avg. Time 2003 2004 2005
1 Hr 8 10 9 Ozone, pphm Chula Vista
8 Hr 6 9 8
24 Hr 65 44 52 PM10, µg/m3 Chula Vista
Annual 27 26 27
ES062007014SAC/360346/072150001(CVEUP_005.1_AIR QUALITY.DOC) 5.1-23

5.1 AIR QUALITY
TABLE 5.1-19 Monitoring Data Summary (Highest Monitored Values)
Pollutant Site Avg. Time 2003 2004 2005
24 Hr 41 33 34 PM2.5, µg/m3 Chula Vista
Annual 14 12 12
8 Hr 5.4 2.5 2.1 CO, ppm Chula Vista
1 Hr 6.9 3.9 2.8
1 Hr 0.102 0.072 0.071 NO2, ppm Chula Vista
Annual 0.018 0.016 0.016
24 Hr 0.9 1.5 0.5
Annual 0.4 0.3 0.3
1 Hr 3.0 4.2 1.6
SO2, pphm Chula Vista
3 Hr 2.1 2.1 0.9
Table 5.1-20 shows the background air quality values based upon the data presented in Table 5.1-21. The background values represent the highest values reported for the site during any single year of the most recent three-year period. Appendix 5.1B presents the background air quality data summaries.
TABLE 5.1-20 Background Air Quality Values
Pollutant and Averaging Time Background Value, µg/ m3
Ozone – 8 Hour 177
PM10 – 24 Hour 65
PM10 – Annual 27
PM2.5 – 24 Hour 41
PM2.5 – Annual 14
CO – 8 Hour 6000
CO – 1 Hour 7886
NO2 – 1 Hour 192
NO2 – Annual 34
SO2 – 1 Hour 110
SO2 – 3 Hour 55
SO2 – 24 Hour 39
SO2 – Annual 11
5.1-24 ES062007014SAC/360346/072150001(CVEUP_005.1_AIR QUALITY.DOC)

5.1 AIR QUALITY
5.1.5.7 Impacts on Class II Areas Operational characteristics of the turbine, such as emission rate, exit velocity, and exit temperature vary by operating load and ambient temperature. A screening modeling analysis, using AERMOD and one year of hourly meteorology (year 2000 from the 2000 through 2003 data set) was performed for the 100 percent load (with and without the fogger), 75 percent load, and 50 percent load conditions in order to determine the turbine operating condition that will result in the highest modeled concentrations for averaging periods of 24-hours or less. These conditions were considered for three ambient temperature conditions: 30°F (a cold December day), 59°F (CAISO conditions), and 93°F (a hot July day). The 59°F condition was assumed to represent annual average conditions. As such, no screening analyses were performed for annual average concentrations, which were modeled later for the 59°F case at 100 percent load (without the fogger), which is the typical operating scenario.
The results of the load screening analysis are listed in Appendix 5.1E. The screening analysis shows that the worst-case load and ambient temperature condition is 100 percent load with the fogger off at 30°F) for short-term CO and NO2 impacts, and 50 percent load at 93°F for short-term SO2 and PM10 impacts. Start-up and shutdown turbine NOx and CO emissions were modeled with stack characteristics for the worst-case 1-hour screening condition (i.e., 100 percent load without the fogger at 30°F).
5.1.5.8 Refined Analysis Facility sources, including the emergency generator diesel engine, were modeled in the analysis for comparisons with Significant Impact Levels (SILs) and CAAQS/NAAQS, as necessary.
For the turbines, start-up and shutdown emissions were also accounted for in the analysis for all short-term (24-hours or less) and long-term (annual) averages in the air quality modeling. Because the start-up time for each turbine is not less than 1-hour, the worst-case 1-hour impact analysis modeling for NOx and CO were based on which startup conditions produced the highest emissions for either pollutant. In addition, both turbines were assumed to startup simultaneously. For longer averaging periods such as the 3-hour, 8-hour, and 24-hour averaging times, multiple start-ups/shutdowns along with full load operation for both turbines were modeled in order to calculate the worst-case impacts. Detailed emission calculations for all averaging periods are included in Appendix 5.1A.
The worst-case modeling input information for each pollutant and averaging period are shown in Table 5.1-21 for normal operating conditions and turbine startup/shutdown conditions. As discussed above, the combustion turbine stack parameters used in modeling the impacts for each pollutant and averaging period reflected the worst-case operating condition for that pollutant and averaging period identified in the load screening analysis. Stack parameters associated with operation at 100 percent load with the fogger off at the average temperature of 59°F were used in modeling annual average impacts.
ES062007014SAC/360346/072150001(CVEUP_005.1_AIR QUALITY.DOC) 5.1-25

5.1 AIR QUALITY
TABLE 5.1-21 Stack Parameters and Emission Rates for Refined AERMOD Modeling
Emission Rates (g/s)a
Stack Height
(m)
Stack Diameter
(m)
Stack Temp. (deg K)
Exhaust Velocity
(m/s) NOX SO2 CO PM10/2.5
Averaging Period: 1-hour for Normal Operating Conditions for CO and NOx Emissions
Turbines (each) 21.336 3.9624 684.8 22.75 0.533 N/A 0.780 N/A
Emergency Generator 4.572 0.2540 787.6 60.16 0.325 N/A 0.307 N/A
Averaging Period: 1-hour for Normal Operating Conditions for SO2 Emissions
Turbines (each) 21.336 3.9624 681.5 14.92 N/A 0.139 N/A N/A
Emergency Generator 4.572 0.2540 787.6 60.16 N/A 0.0208 N/A N/A
Averaging Period: 3-hours for Normal Operating Conditions
Turbines (each) 21.336 3.9624 681.5 14.92 N/A 0.139 N/A N/A
Emergency Generator 4.572 0.2540 787.6 60.16 N/A 6.94E-3 N/A N/A
Averaging Period: 8-hours for Normal Operating Conditions
Turbines (each) 21.336 3.9624 684.8 22.75 N/A N/A 0.780 N/A
Emergency Generator 4.572 0.2540 787.6 60.16 N/A N/A 3.84E-2 N/A
Averaging Period: 24 hours for Normal Operating Conditions
Turbines (each) 21.336 3.9624 681.5 14.92 N/A 0.139 N/A 0.630
Emergency Generator 4.572 0.2540 787.6 60.16 N/A 8.67E-4 N/A 7.39E-4
Averaging Period: Annual for Normal Operating Conditionsb
Turbines (each) 21.336 3.9624 707.6 22.32 0.467 0.091 N/A 0.412
Emergency Generator 4.572 0.2540 787.6 60.16 1.93E-3 1.24E-4 N/A 1.05E-4
Averaging Period: 1-hour for Turbine Start-up/Shutdown Conditions
Turbines (each) 21.336 3.9624 684.8 22.75 2.432 N/A 1.802 N/A
Averaging Period: 8-hours for Turbine Start-up/Shutdown Conditions
Turbines (each) 21.336 3.9624 684.8 22.75 N/A N/A 0.981 N/A
a Modeled emission rates based on a higher (5,000 hours) estimated hours of operation. b Annual averaging periods include start-up/shutdown emissions, where applicable.
5.1.5.9 Normal Operations Impact Analysis In order to determine the magnitude and location of the maximum impacts for each pollutant and averaging period, the AERMOD model was used. Table 5.1-22 summarizes maximum modeled concentrations for each criteria pollutant and associated averaging periods. In order to assess the significance of the modeled concentrations, the maximum concentrations were modeled and compared to the Class II Prevention of Significant
5.1-26 ES062007014SAC/360346/072150001(CVEUP_005.1_AIR QUALITY.DOC)

5.1 AIR QUALITY
Deterioration (PSD) SILs. All modeled facility pollutant concentrations with the exception of 1-hour NO2 concentrations are less than the SILs for those pollutants.
The maximum impacts for NO2 (1-hour and annual averages), CO (1-hour and 8-hour averages), SO2 (1-hour, 3-hour, 24-hour, and annual averages), and PM10/PM2.5 (24-hour and annual averages) occurred in the immediate vicinity of the facility either on the fenceline or within the downwash grid in the 10-meter-spaced receptor areas. Therefore, no additional 10-meter-spaced receptor grids in the coarse or intermediate receptor grid areas were required.
Because the maximum modeled impacts for CO are less than the significance levels, the CVEUP would not significantly affect the San Diego attainment area. As noted above, all modeled impacts are less than the Class II significance levels and modeled 1-hour NOx impacts (both with and without background) are less than the 1-hour state standard.
TABLE 5.1-22 Air Quality Impact Summary for Normal Operating Conditions
Ambient Air Quality
CAAQS/NAAQS
Pollutant Avg.
Period
Maximum Concentration
(µg/m3) Background
(µg/m3) Total
(µg/m3)
Class II Significance
Level (µg/m3)
SIL
(µg/ m3) (µg/m3) (µg/m3)
1-hour 114.90 192 307 - 19 470 - NO2
Annual 0.34 34 34.34 1 1 - 100
24-hour 2.87 65 67.9 5 5 50 150 PM10
Annual 0.29 27 27.29 1 1 20 50
24-hour 2.87 41 43.9 5 5 - 65 PM2.5
Annual 0.29 14 14.29 1 1 12 15
1-hour 108.54 7886 7995 2000 2000 23,000 40,000 CO
8-hour 8.27 6000 6008 500 500 10,000 10,000
1-hour 7.35 110 117 - - 655 -
3-hour 2.42 55 57.4 25 25 1300 1,300
24-hour 0.64 39 39.6 5 5 105 365
SO2
Annual 0.07 11 11.07 1 1 - 80
Following USEPA guidance, shoreline fumigation impacts were not assessed as the distance to the nearest shoreline of the Pacific Ocean (San Diego Bay) is greater than 3 kilometers.
Based on the above modeling results, emissions from the proposed CVEUP will not significantly affect the ambient air quality of the area.
ES062007014SAC/360346/072150001(CVEUP_005.1_AIR QUALITY.DOC) 5.1-27
5.1 AIR QUALITY
5.1.5.10 Commissioning Impacts Analysis – Turbines There are several scenarios that are possible during commissioning and that are expected to result in NOx, and CO emissions that are greater than during normal operations. (During commissioning, VOC, PM10/2.5 and SO2 emissions are expected to be no greater than full load operations.) Typically, these commissioning activities occur prior to the installation of the abatement equipment (e.g., SCR and oxidation catalyst) while the turbines are being tuned to achieve optimum performance. During turbine tuning, NOx and CO emission control systems would not be functioning.
For the purposes of air quality modeling, NO2 and CO impacts could be higher during commissioning than under other operating conditions already evaluated. The commissioning activities for each turbine are expected to consist of several phases. Though precise emission values during the phases of commissioning cannot be provided, given the consideration for contingencies during shakedown, the worst case short-term emissions profile during expected commissioning-period operating loads are summarized in Table 5.1-23.
• Initial load testing and checkout of an engine (typical for both turbines)—This phase consists of two to four operating days of unsynchronized operation, for approximately 2 to 4 hours per day, followed by an average of approximately 1 to 2 days per engine of low-load checkout (low-load checkout also is estimated at approximately 2 to 4 hours per day). The average operating load for this initial load testing is expected to be 5 to 10 percent, based on a range of 0 percent and 10 percent load.
• Initial tuning—This phase consists of 15 to 30 operating days of testing and tuning at various loads and up to full load per turbine for not more than an average of 8 operating hours per day. The average operating load is expected to be 75 percent, based on a typical commissioning range between 50 percent and 100 percent load. Upon completion of initial tuning phase, the SCR and the CO oxidation catalyst will be loaded. The second tuning phase will be done with the SCR and CO oxidation catalyst operation and may include up to 100 hours of operation per turbine.
• Final tuning—This phase consists of 15 to 30 operating days of SCR and oxidation catalyst tuning and pre-witness testing performance verification at an average of not more than 12 to 16 hours per day. The average operating load is expected to be 75 percent, based on a range of 50 percent and 100 percent load.
The expected daily emissions during commissioning (assuming both turbines are commissioned simultaneously) will be:
NOx 2,448 pounds per calendar day CO 2,160 pounds per calendar day
During the commissioning period, only one turbine will typically be undergoing various phases of commissioning at the same time. However, both turbines may be in operation at the same time, with one turbine undergoing commissioning while the other turbine has finished commissioning and is in normal (non-commissioning) operation. However, for conservatism, it has been assumed that both turbines will be undergoing commissioning simultaneously for the modeling analysis.
5.1-28 ES062007014SAC/360346/072150001(CVEUP_005.1_AIR QUALITY.DOC)

5.1 AIR QUALITY
The maximum 1-hour NOx impact during commissioning was calculated to be 99.2 μg/m3 based on simultaneous commissioning of both turbines (results were ratioed from the start-up impacts discussed below). With the maximum background 1-hour NO2 concentration of 192 μg/m3, the maximum total impact would be 291 μg/m3, which is below the state 1-hour NO2 standard of 470 μg/m3.
The maximum 1-hour and 8-hour CO impacts during commissioning based on simultaneous commissioning of both turbines were calculated to be 87.5 μg/m3 and 52.5 μg/m3, respectively (results were ratioed from the start-up impacts discussed below). With the maximum background 1-hour and 8-hour CO concentrations of 7,886 μg/m3 and 6,000 μg/m3, respectively, the maximum total impacts would be 7,973 μg/m3 and 6,053 μg/m3, respectively. These impacts are each below the state and federal standards for CO. The CO concentrations from commissioning are also less than the PSD significance levels.
5.1.5.11 Start-up and Shutdown Impacts Analysis Start-up and shutdown activities typically affect emissions of NOx and CO. (During start-up, PM10/PM2.5, and SO2 emissions are expected to be no greater than for full-load operations.) A separate modeling assessment for start-up emissions is presented as the start-up emissions by themselves are greater than the worst-case hourly emissions. Modeling was performed with AERMOD as discussed previously for 1-hour and 8-hour CO and 1-hour NO2 concentrations. CO and NOx emissions for 1-hour averaging times were modeled for one cold start-up period, assumed to occur for the entire hour. CO emissions for 8-hour averaging times were modeled assuming one cold start-up and one warm start-up during the 8-hour period. These emissions and stack characteristics are shown in Table 5.1-22 above. The initial maximum start-up impacts occurred in the immediate vicinity of the facility within the downwash grid in the 10-meter-spaced receptor areas. Therefore, no additional 10-meter-spaced receptor grids in the coarse or intermediate receptor grid areas were required.
Table 5.1-23 presents a summary of the start-up and shutdown emission estimates for the turbines. Appendix 5.1B presents more details with regards to startup/shutdown emissions and assumptions.
TABLE 5.1-23 Facility Startup and Shutdown Emission Rates for Each Turbine
Scenario NOx CO VOC
Cold Start, lb/hr 19.3 14.3 1.4
Hot Start, lb/hr 8.8 9.2 1.4
Warm Start, lb/hr 12.2 10.8 1.4
Shutdown, lb/hr 7.8 8.9 1.4
All startup sequences are 30 minutes or less. Shutdown is 10 minutes.
Table 5.1-24 presents the results of the startup/shutdown modeling. CO concentrations due to start-up/shutdown conditions are less than the Class II significance levels and modeled 1-hour NOx impacts (both with and without background) are less than the 1-hour state standard.
ES062007014SAC/360346/072150001(CVEUP_005.1_AIR QUALITY.DOC) 5.1-29

5.1 AIR QUALITY
5.1-30 ES062007014SAC/360346/072150001(CVEUP_005.1_AIR QUALITY.DOC)
TABLE 5.1-24 Startup and Shutdown Modeling Results
Ambient Air Quality
CAAQS/NAAQS
Pollutant Avg.
Period
Maximum Concentration
(µg/ m3) Background
(µg/ m3) Total
(µg/ m3)
Class II Significance
Level (µg/ m3) (µg/ m3) (µg/ m3)
NO2 1-hour 37.54 192 230 - 470 -
1-hour 27.81 7886 7914 2000 23,000 40,000 CO
8-hour 9.09 6000 6009 500 10,000 10,000
5.1.5.12 Impacts on Soils, Vegetation, and Sensitive Species Impacts on soils, vegetation, and sensitive species were determined to be “insignificant” for the following reasons:
• No soils, vegetation, or sensitive species were identified in the project area, which are recognized to have any known sensitivity to the types or amounts of air pollutants expected to be emitted by the proposed facility.
• The facility emissions are expected to be in compliance with all applicable air quality rules and regulations.
• The facility impacts are predicted to result in no violations of existing air quality standards, nor will the emissions cause an exacerbation of an existing violation of any quality standard.
5.1.6 Laws, Ordnances, Regulations, and Statutes Table 5.1-25 presents a summary of local, state, and federal LORS deemed applicable to the proposed modification.
5.1.7 Agency Jurisdiction and Contacts Table 5.1-26 presents data on the following: (1) air quality agencies that may or will exercise jurisdiction over air quality issues resulting from the proposed power plant, (2) the most appropriate agency contact for the proposed project, (3) contact address and phone information, and (4) the agency involvement in required permits or approvals.

5.1 AIR QUALITY
TABLE 5.1-25 Summary of Applicable LORS for Air Quality
Regulation Citation Compliance Strategy/Determination
Federal Regulations
CAAA of 1990, 40 CFR 50 CVEUP operations will not cause violations of state or federal AAQS.
40 CFR 52.21 Impact analysis shows compliance with NAAQS, facility is not subject to PSD
40 CFR 72-75 MMC will submit all required applications for inclusion to the Acid Rain program and allowance system, CEMS will be installed as required.
40 CFR 60 MMC will determine subpart applicability and comply with all emissions, monitoring, and reporting requirements
40 CFR 70 Title V application will be submitted within 12 months of commencement of operation
40 CFR 63 MMC will evaluate substances and amounts stored, determine applicability, and comply with all program level requirements
40 CFR 64 MMC will determine subpart applicability and comply with all emissions, monitoring, and reporting requirements
State Regulations
CHSC 44300 et seq. MMC will determine applicability, and prepare inventory plans and reports as required
CHSC 41700 SDAPCD Authority to Construct (ATC) will ensure that no public nuisance results from operation of facility
Local APCD Regulations
Rule 10 – Permits Required This application and the enclosed district permit forms constitute compliance with this rule.
Rule 11 – Exemptions from Permits The proposed modification is not exempt from the permitting requirements of Rule 10.
Rule 50.1 – NSPS/NESHAPs Visible Emissions
The proposed modification will comply with all NSPS/NESHAPs visible emissions limitations.
Rule 51 – Nuisance The proposed modification is not expected to create any type of public nuisance.
Rule 52 – Particulate Matter PM emissions from the combustion of natural gas in gas turbines is not expected to exceed 0.10 gr/dscf.
Rule 52.1 – NSPS/NESHAPs PM The proposed modification will comply with all NSPS/NESHAPs PM limitations.
Rule 53 – Specific Air Contaminants Applicable provisions in (d)(1) and (2) are complied with through the use of natural gas fuels.
ES062007014SAC/360346/072150001(CVEUP_005.1_AIR QUALITY.DOC) 5.1-31

5.1 AIR QUALITY
5.1-32 ES062007014SAC/360346/072150001(CVEUP_005.1_AIR QUALITY.DOC)
TABLE 5.1-25 Summary of Applicable LORS for Air Quality
Regulation Citation Compliance Strategy/Determination
Rule 53.2 – NSPS/NESHAPs Specific Contaminants
The proposed modification will comply with all NSPS/NESHAPs specific contaminant limitations.
Rule 54 – Dust and Fumes Use of natural gas fuels will insure compliance with the rule limits.
Rule 54.1 – NSPS/NESHAPs Dust and Fumes The proposed modification will comply with all NSPS/NESHAPs dust and fume limitations.
Rule 62 – sulfur Content of Fuels Use of natural gas fuels will insure compliance with the rule limits.
Rule 62.1 – NSPS/NESHAPs Fuel Sulfur Use of natural gas fuels will insure compliance with any NSPS/NESHAPs rule limits.
Rule 68 – NOx Limits/Fuel Burning Use of natural gas fuels and BACT will insure compliance with any rule NOx limits.
Rule 68 – NSPS/NESHAPs NOx Limits Use of natural gas fuels and BACT will insure compliance with any NSPS/NESHAPs rule NOx limits.
Rule 69.3 – Turbine RACT Use of natural gas fuels and BACT will insure compliance with all rule provisions.
Rule 69.3.1 – Turbine BARCT Use of natural gas fuels and BACT will insure compliance with all rule provisions.
Rule 69.4 – IC Engines RACT The new IC engine will comply with all rule provisions and USEPA tier standards.
Rule 69.4.1 – IC Engine BARCT The new IC engine will comply with all rule provisions and USEPA tier standards.
Rules 20.1-20.3 – NSR This application and support documentation shows compliance with all rule provisions.
Rule 1200 – Toxics NSR Facility risk pursuant to the HRA does not exceed any significance thresholds.
Rule 1210 – HRA Public Notice Facility risks are below the public notice threshold values.

5.1 AIR QUALITY
TABLE 5.1-26 Agencies, Contacts, Jurisdictional Involvement, Required Permits for Air Quality
Agency Contact Jurisdictional Area Permit Status
California Energy Commission
Assigned Project Manager Assigned CEC Staff Analyst 1516 Ninth St. Sacramento, Ca. 95814
Primary reviewing and certification agency.
Will certify the proposed facility under the energy siting regulations and CEQA. Certification will contain a variety of conditions pertaining to emissions and operation.
San Diego Air Pollution Control District
Tom Weeks, Chief Engineering Division 10124 Old Grove Rd. San Diego, Ca. 92131 858-566-2715
Prepares Determination of Compliance (DoC) for CEC, Issues SDAQMD Permit to Construct and Operate, Primary air regulatory and enforcement agency.
DoC will be prepared subsequent to AFC submittal.
ATC application submitted to APCD in February 2007.
California Air Resources Board
Mike Tollstrup Chief, Project Assessment Branch 1001 I St., 6th Floor Sacramento, Ca. 95814 916-322-6026
Oversight of AQMD stationary source permitting and enforcement program
CARB staff will provide comments on applicable AFC sections affecting air quality and public health. CARB staff will also have opportunity to comment on draft ATC.
Environmental Protection Agency, Region IX
Gerardo Rios Chief, Permits Section USEPA-Region 9 75 Hawthorne St. San Francisco, Ca. 94105415-947-3974
Oversight of all AQMD programs, including permitting and enforcement programs
USEPA Region 9 staff will receive a copy of the DoC. USEPA Region 9 staff will have opportunity to comment on draft ATC.
5.1.8 Permit Requirements and Schedules A Permit to Construct is required in accordance with the SDAPCD rules. A complete application for a “Permit to Construct”, including the required Title V application forms, has previously been filed (February 2007) with the SDAPCD. This section (Air Quality) and Section 5.9 (Public Health) contain the same information as the submitted SDAPCD project application.
5.1.9 References Air and Waste Management Association (AWMA). 2002. Technical Paper #42752. July.
California Air Resources Board (CARB). 1999. Guidance for Power Plant Siting and Best Available Control Technology, PAB-SSD. July.
California Air Resources Board (CARB). 2006. Best Available Control Technology Clearinghouse Program, http://www.arb.ca.gov/bact/bact.htm. August.
ES062007014SAC/360346/072150001(CVEUP_005.1_AIR QUALITY.DOC) 5.1-33

5.1 AIR QUALITY
California Air Resources Board (CARB). 2006. California Air Quality Data Statistics, 2002-2005 Data, ADAM Database, http://www.arb.ca.gov/adam, Air Quality Data Branch, Sacramento, California. September.
California Air Resources Board (CARB). 2006. The 2006 California Almanac of Emissions and Air Quality. CARB, Technical Support Division.
California Energy Commission. 2006. Energy Facilities Siting/Licensing Process Web Site. http://www.energy.ca.gov/sitingcases/index.html.
Desiena, Ralph. 2006. Permit Modeling Guidance, SDAPCD. December 21.
Holzworth, G.C. 1972. Mixing Heights, Wind Speeds, and Potential for Urban Air Pollution throughout the Contiguous United States. January.
Midwest Research Institute. 1996. Improvement of Specific Emission Factors (BACM Project No. 1), Final Report. Prepared by Midwest Research Institute for South Coast AQMD. March.
National Weather Service. 2006. California Climate data ⎯ Normals, Means, and Extremes for Newark (1948-2005) and Oakland WSO (1948-2005). August.
RAMCO Inc. 2001. Expansion Emergency Power Plant Permitting Application, Chula Vista Peaker Generating Station. May.
South Coast Air Quality Management District (SCAQMD). 1993. CEQA Air Quality Handbook. April.
South Coast Air Quality Management District website, August 2005.
U.S. Department of Agriculture Forest Service. 2002. USDA Forest Service Class I Area Information. http://www.fs.fed.us/r6/aq/natarm/r5/. August.
U.S. Environmental Protection Agency (USEPA). 1985. Guideline for Determination of Good Engineering Stack Height (Technical Support Document for the Stack Height Regulation) (Revised), EPA-450/4-80-023R. Office of Air Quality Planning and Standards, Research Triangle Park, North Carolina 27711. June.
U.S. Environmental Protection Agency (USEPA). 1989. 40 CFR Part 51, Appendix W:, Guideline on Air Quality Models and CARB (Reference Document for California Statewide Modeling Guideline. April.
U.S. Environmental Protection Agency (USEPA). 1991. Nonroad Engine and Vehicle Emission Study ⎯ Report, 21A-2001, Office of Mobile Sources, Washington, D.C. 20460. November.
U.S. Environmental Protection Agency (USEPA). 1992. Workbook for Plume Visual Impact Screening and Analysis (Revised), EPA-454/R-92-023, Office of Air and Radiation, Office of Air Quality Planning and Standards, Research Triangle Park, North Carolina 27711. October.
U.S. Environmental Protection Agency (USEPA). 1995. Compilation of Air Pollution Emission Factors, Volume I, Fifth Edition; AP-42.
5.1-34 ES062007014SAC/360346/072150001(CVEUP_005.1_AIR QUALITY.DOC)

5.1 AIR QUALITY
ES062007014SAC/360346/072150001(CVEUP_005.1_AIR QUALITY.DOC) 5.1-35
U.S. Environmental Protection Agency (USEPA). 1995. Onsite Meteorological Program Guidance for Regulatory Model Applications, EPA-450/4-87-013, August.
U.S. Environmental Protection Agency (USEPA). 1995. User’s Guide for the Industrial Source Complex (ISC3) Dispersion Models, EPA-454/B-95-003a, Office of Air Quality Planning and Standards, Research Triangle Park, North Carolina 27711. September.
U.S. Environmental Protection Agency (USEPA). 1995. User’s Guide to the Building Profile Input Program (Revised), EPA-454/R-93-038, Office of Air Quality Planning and Standards, Research Triangle Park, North Carolina 27711. February.
U.S. Environmental Protection Agency (USEPA). 2005. User’s Guide for the AERMOD Model, EPA-454/B-03-001, Office of Air Quality Planning and Standards, Research Triangle Park, North Carolina 27711. September.