5.3 rate of change and slope 5.4 the slope formula algebra 5.3
TRANSCRIPT
5 .3 RATE OF CHANGE AND SLOPE5.4 THE SLOPE FORMULA
Algebra 5.3

5.3 Learning Targets
Language GoalStudents will be able to verbally relate a
constant rate of change to the slope of a lineMath GoalStudents will be able to find rates of change
and slopes.Essential QuestionsWhy are graphs a valuable source of
information?
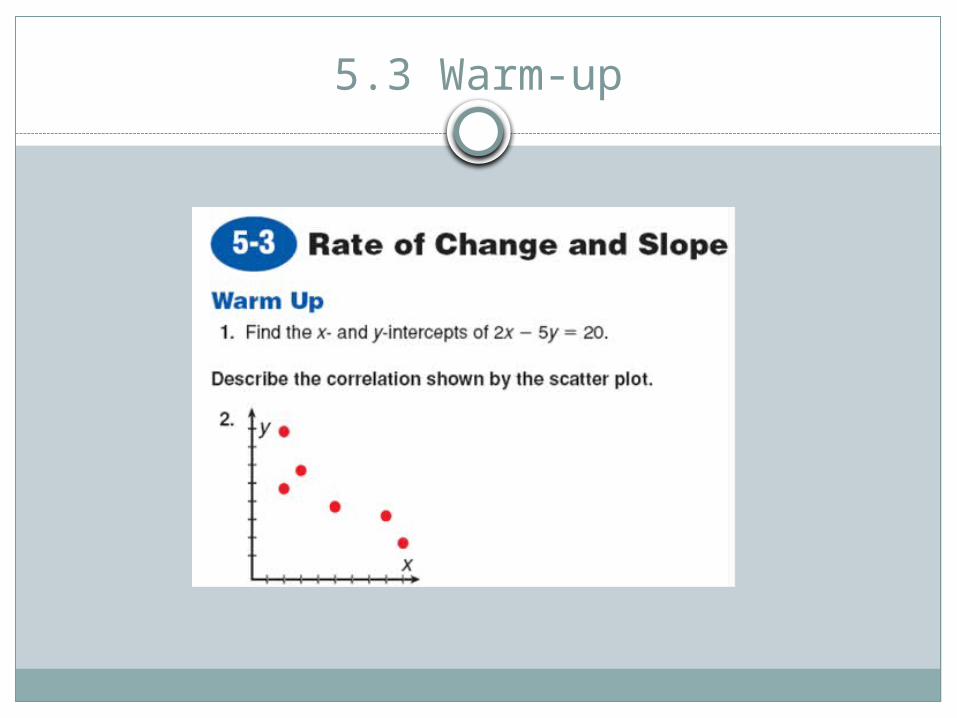
5.3 Warm-up
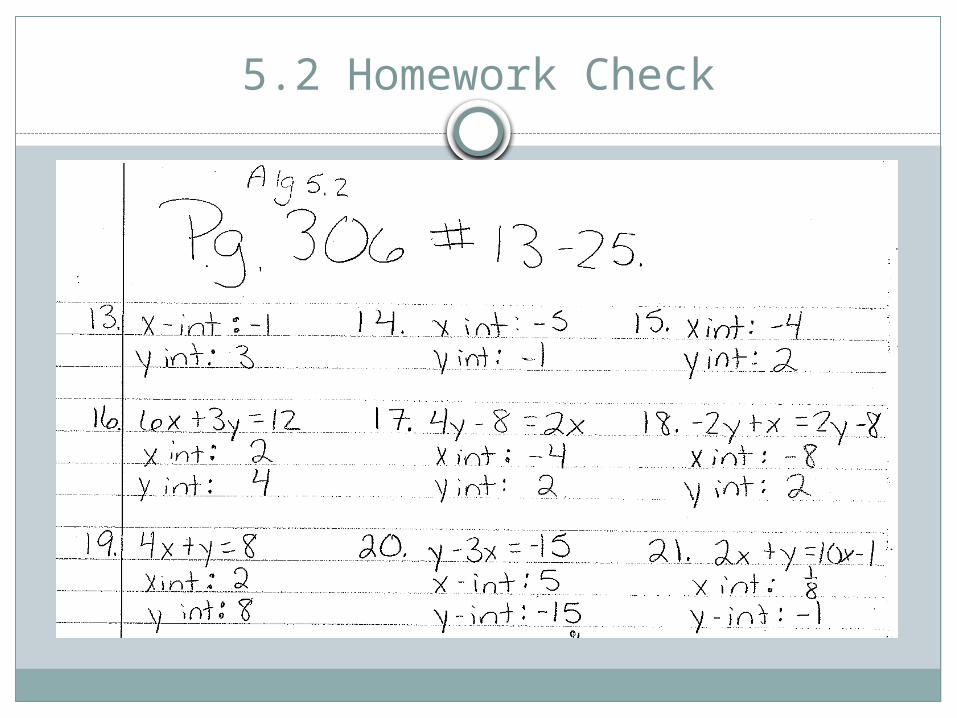
5.2 Homework Check
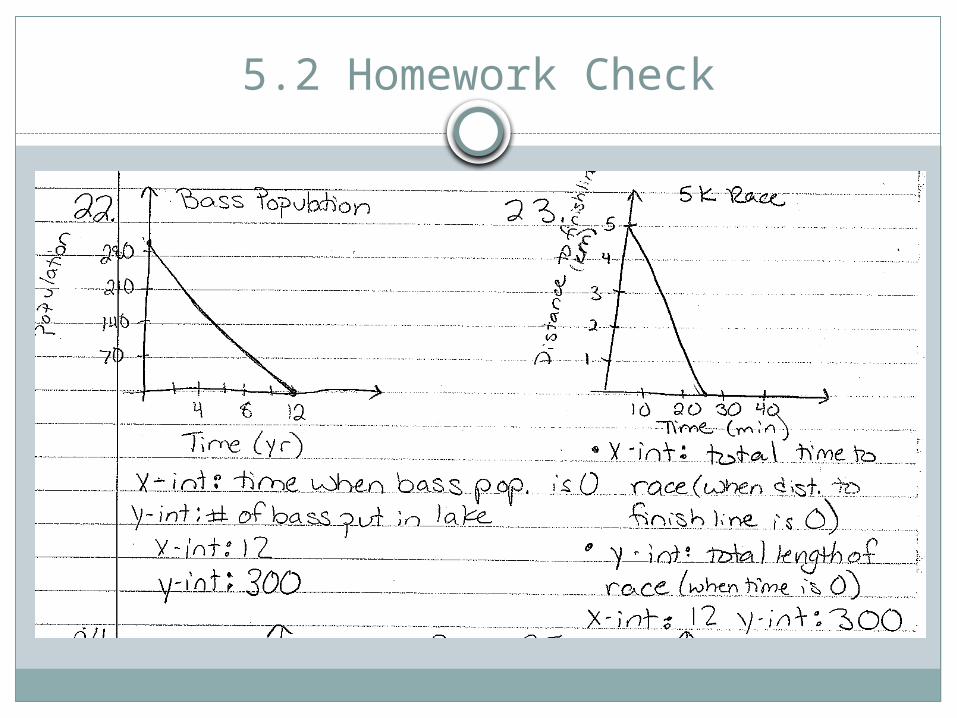
5.2 Homework Check
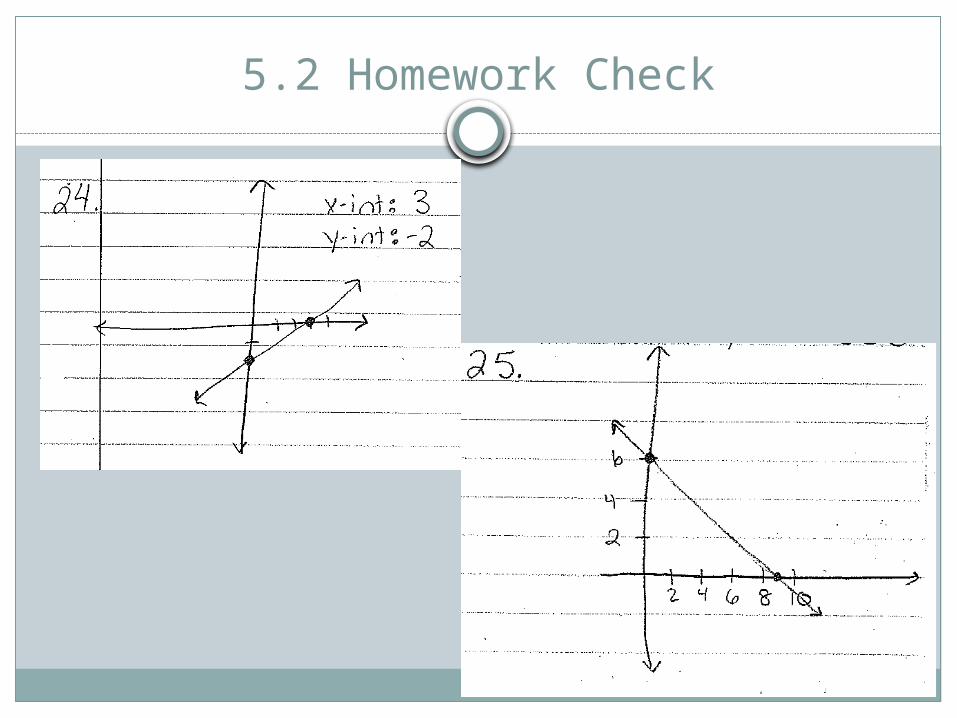
5.2 Homework Check
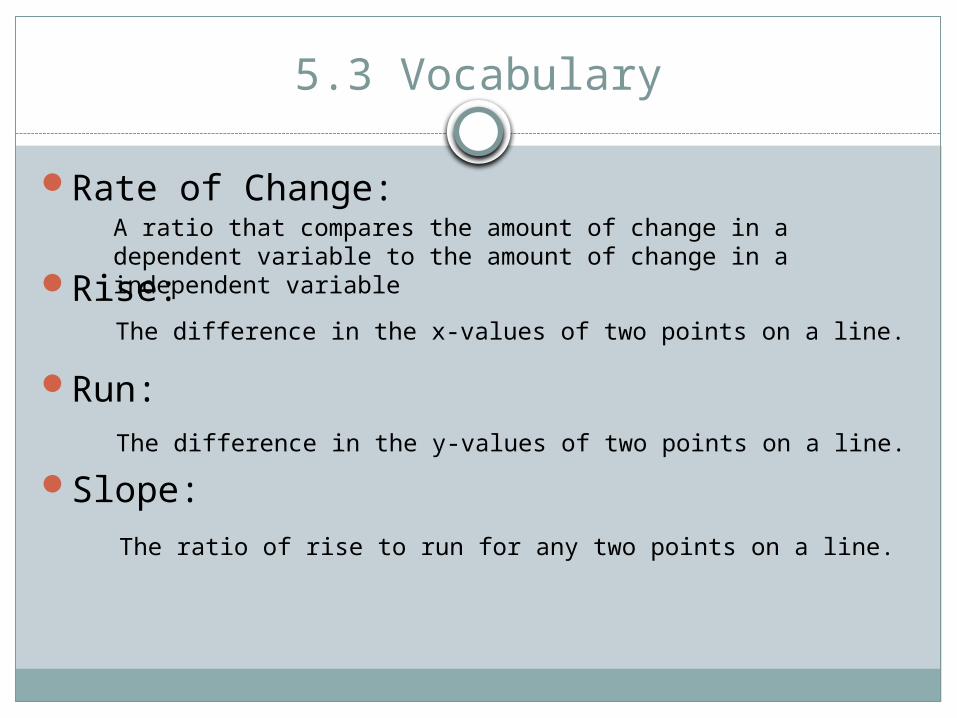
5.3 Vocabulary
Rate of Change:
Rise:
Run:
Slope:
A ratio that compares the amount of change in a dependent variable to the amount of change in a independent variable
The difference in the x-values of two points on a line.
The difference in the y-values of two points on a line.
The ratio of rise to run for any two points on a line.
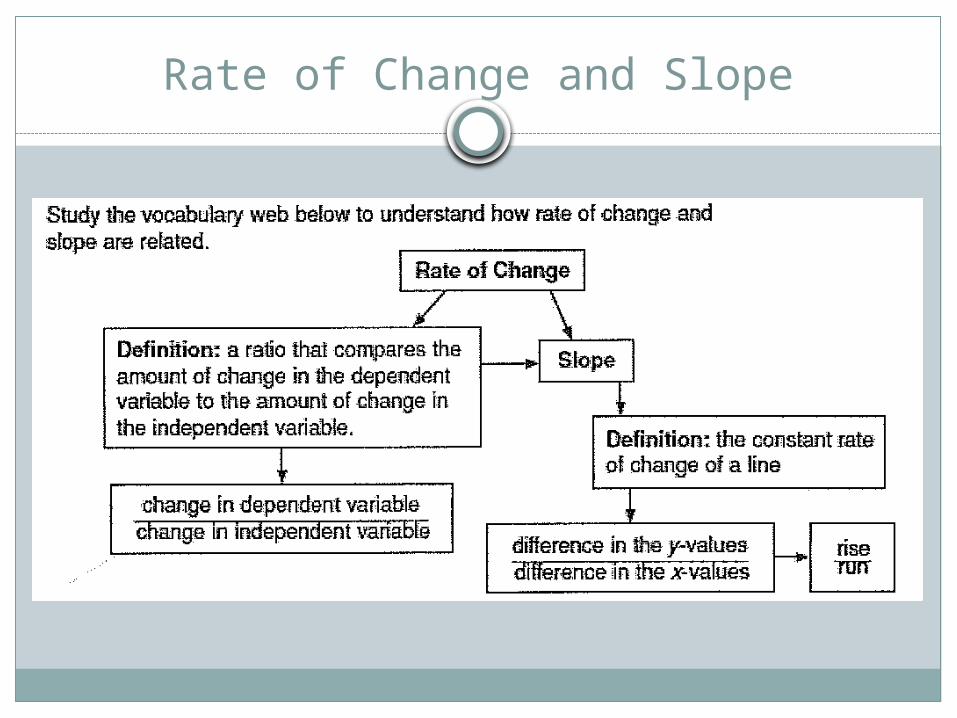
Rate of Change and Slope
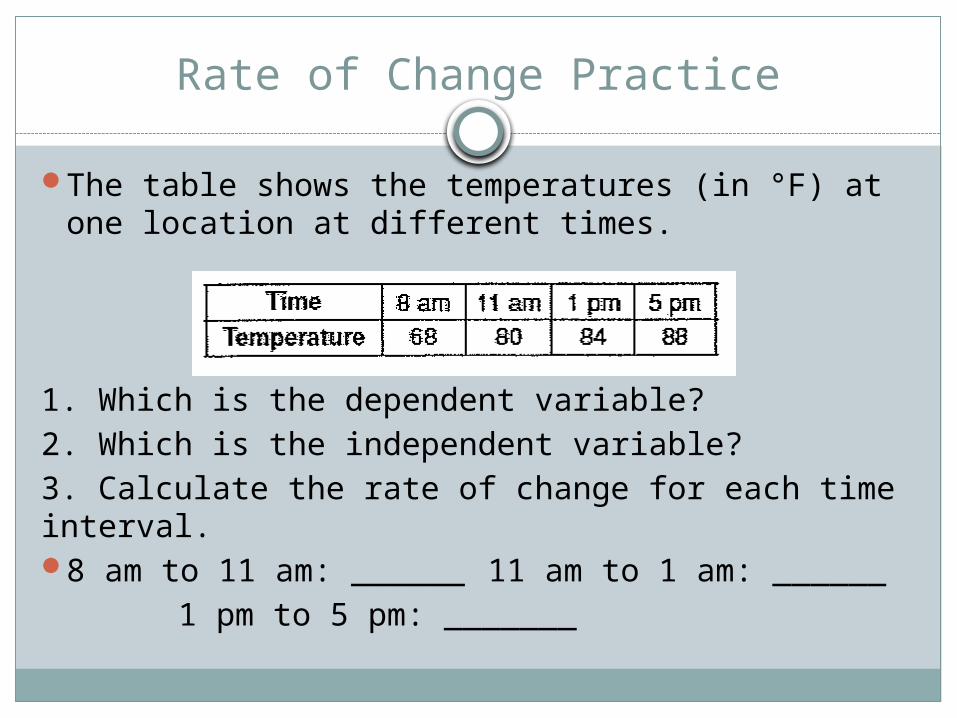
Rate of Change Practice
The table shows the temperatures (in °F) at one location at different times.
1. Which is the dependent variable?2. Which is the independent variable?3. Calculate the rate of change for each time interval.8 am to 11 am: ______ 11 am to 1 am: ______
1 pm to 5 pm: _______

Hint!!
The independent variable is usually a form of time!!!
Example 1: Word Problem
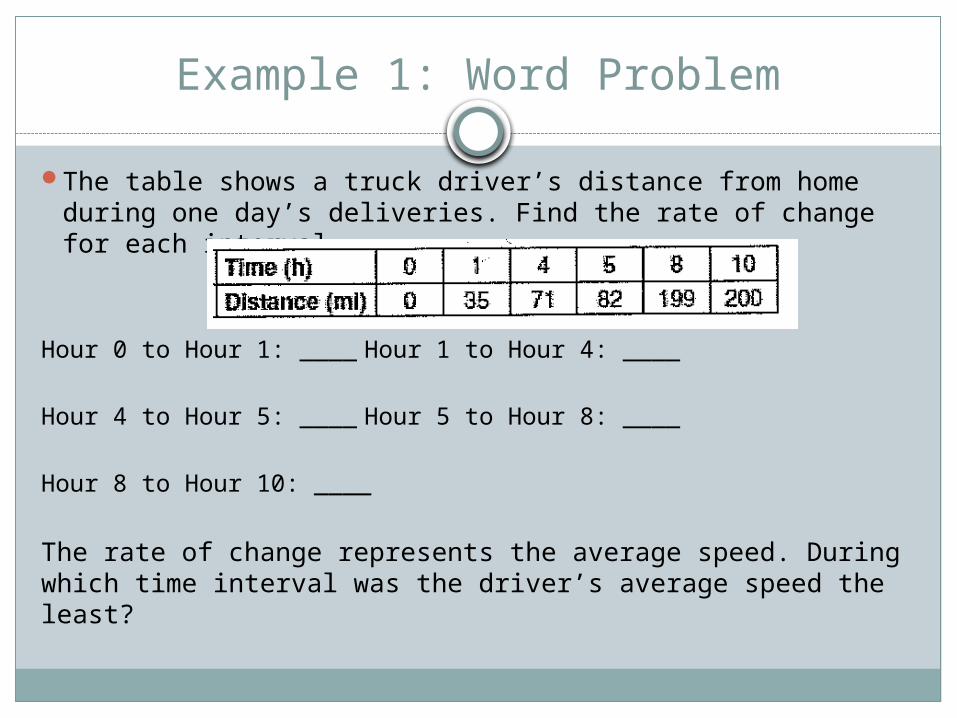
The table shows a truck driver’s distance from home during one day’s deliveries. Find the rate of change for each interval.
Hour 0 to Hour 1: ____ Hour 1 to Hour 4: ____
Hour 4 to Hour 5: ____ Hour 5 to Hour 8: ____
Hour 8 to Hour 10: ____
The rate of change represents the average speed. During which time interval was the driver’s average speed the least?
Example 2: Finding Rates of Change from a Graph
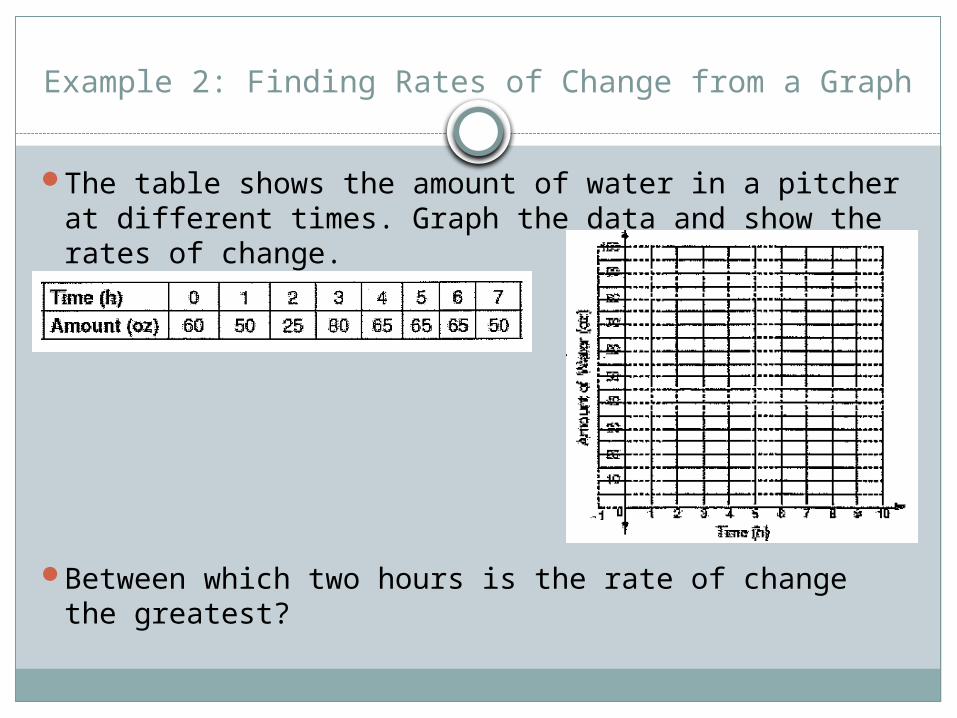
The table shows the amount of water in a pitcher at different times. Graph the data and show the rates of change.
Between which two hours is the rate of change the greatest?
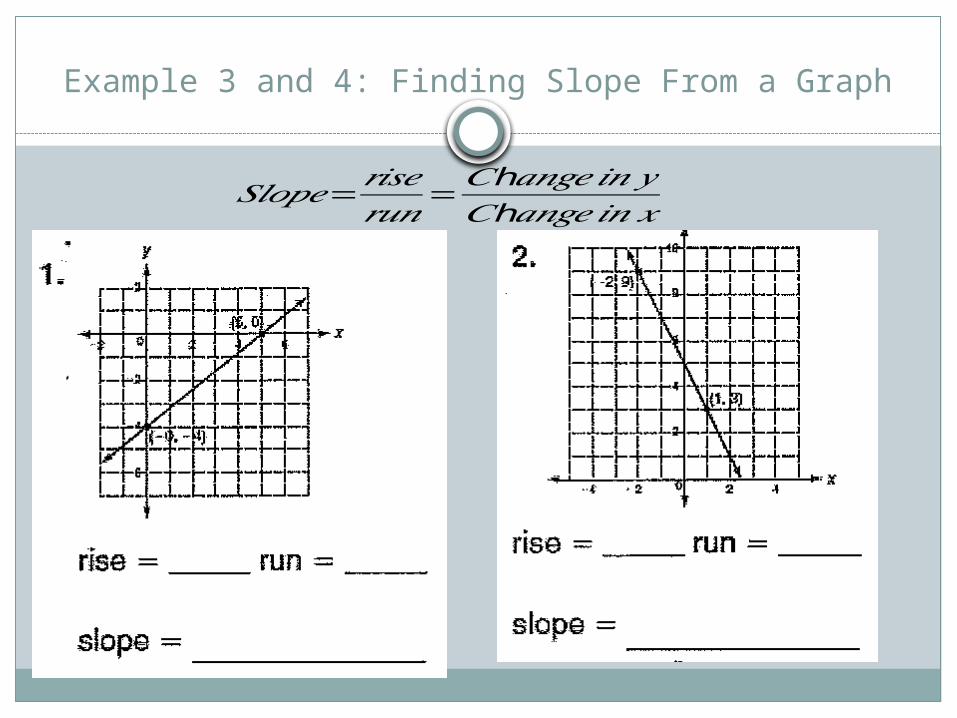
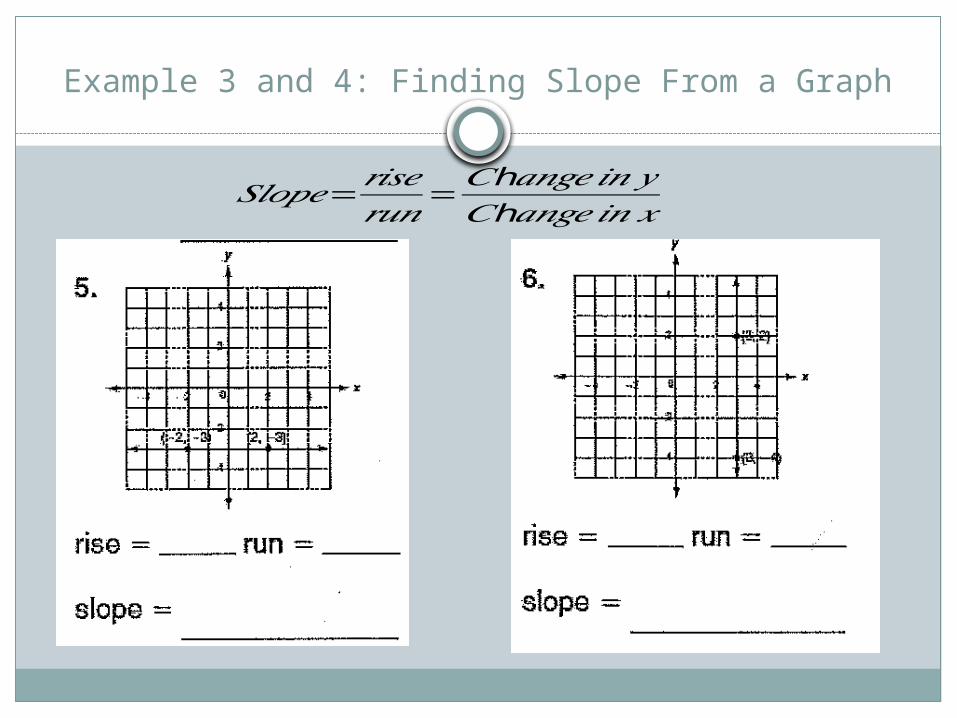
Example 3 and 4: Finding Slope From a Graph
𝑆𝑙𝑜𝑝𝑒=𝑟𝑖𝑠𝑒𝑟𝑢𝑛
=h𝐶 𝑎𝑛𝑔𝑒𝑖𝑛 𝑦h𝐶 𝑎𝑛𝑔𝑒 𝑖𝑛𝑥
Example 3 and 4: Finding Slope From a Graph
𝑆𝑙𝑜𝑝𝑒=𝑟𝑖𝑠𝑒𝑟𝑢𝑛
=h𝐶 𝑎𝑛𝑔𝑒𝑖𝑛 𝑦h𝐶 𝑎𝑛𝑔𝑒 𝑖𝑛𝑥
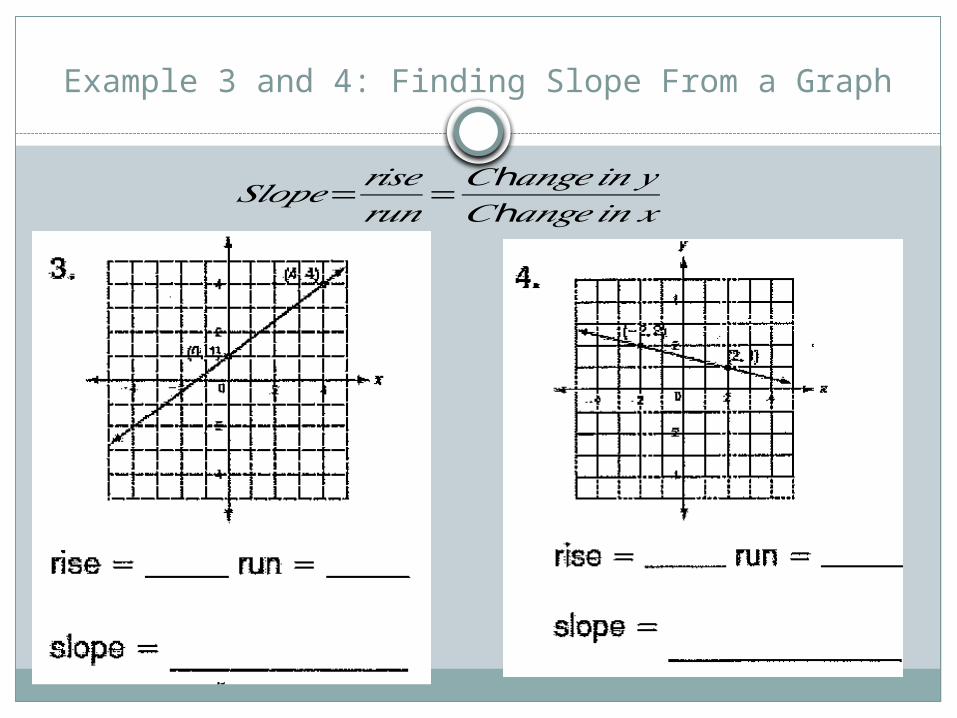
Example 3 and 4: Finding Slope From a Graph
𝑆𝑙𝑜𝑝𝑒=𝑟𝑖𝑠𝑒𝑟𝑢𝑛
=h𝐶 𝑎𝑛𝑔𝑒𝑖𝑛 𝑦h𝐶 𝑎𝑛𝑔𝑒 𝑖𝑛𝑥
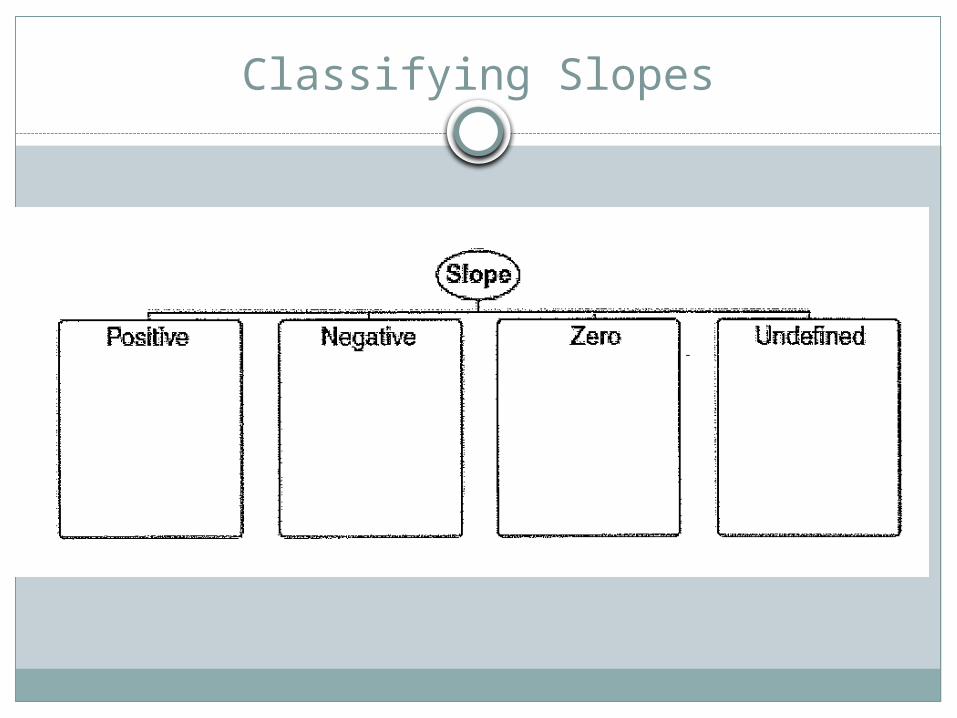
Classifying Slopes
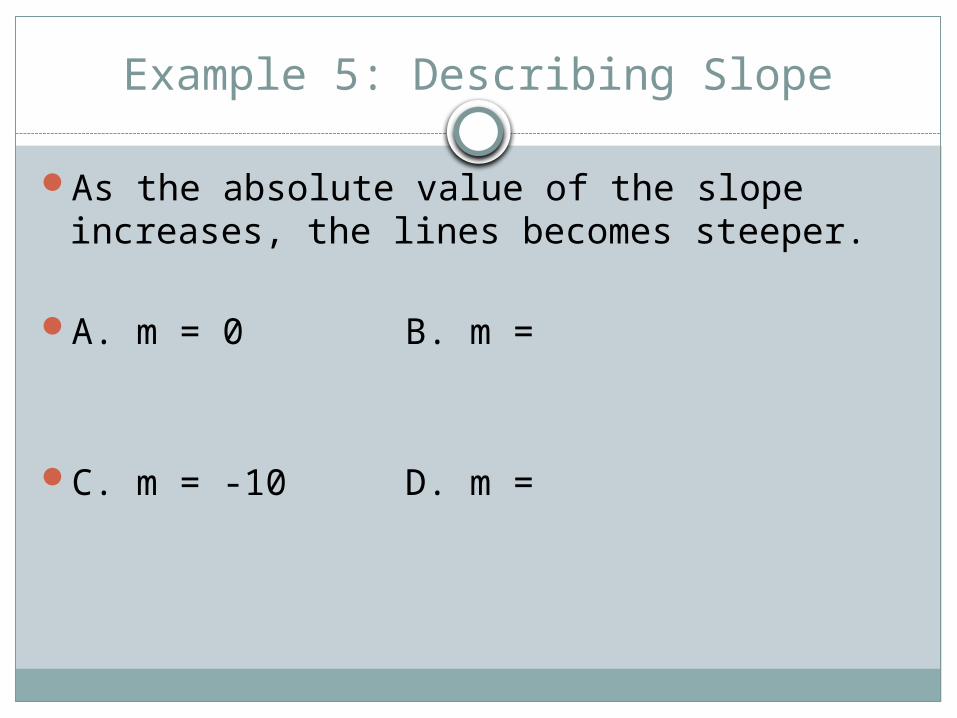
Example 5: Describing Slope
As the absolute value of the slope increases, the lines becomes steeper.
A. m = 0 B. m =
C. m = -10 D. m =
Extra Practice Finding Slope WS
Work with a partner or individually. We will discuss as a class.
Make sure that you find a point that lies on an intersection between an x and y integer.
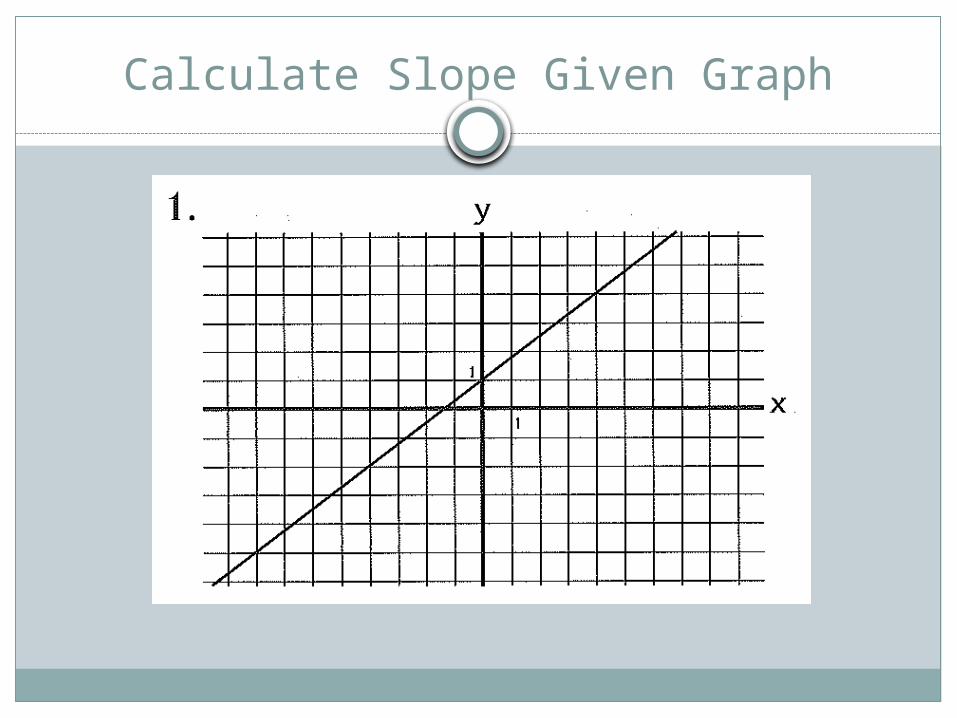
Calculate Slope Given Graph
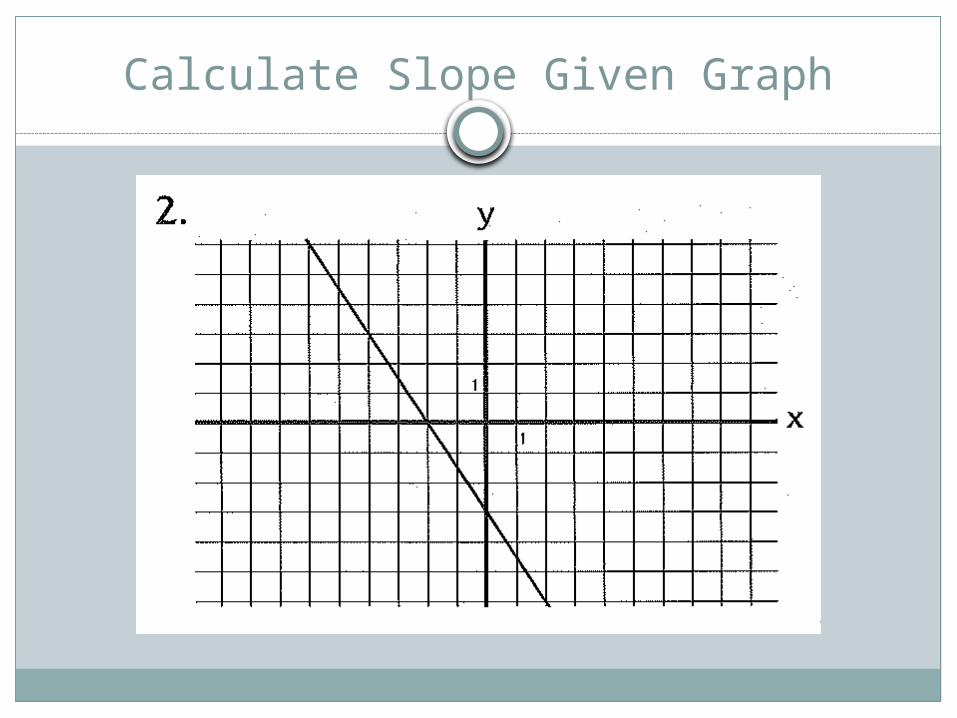
Calculate Slope Given Graph
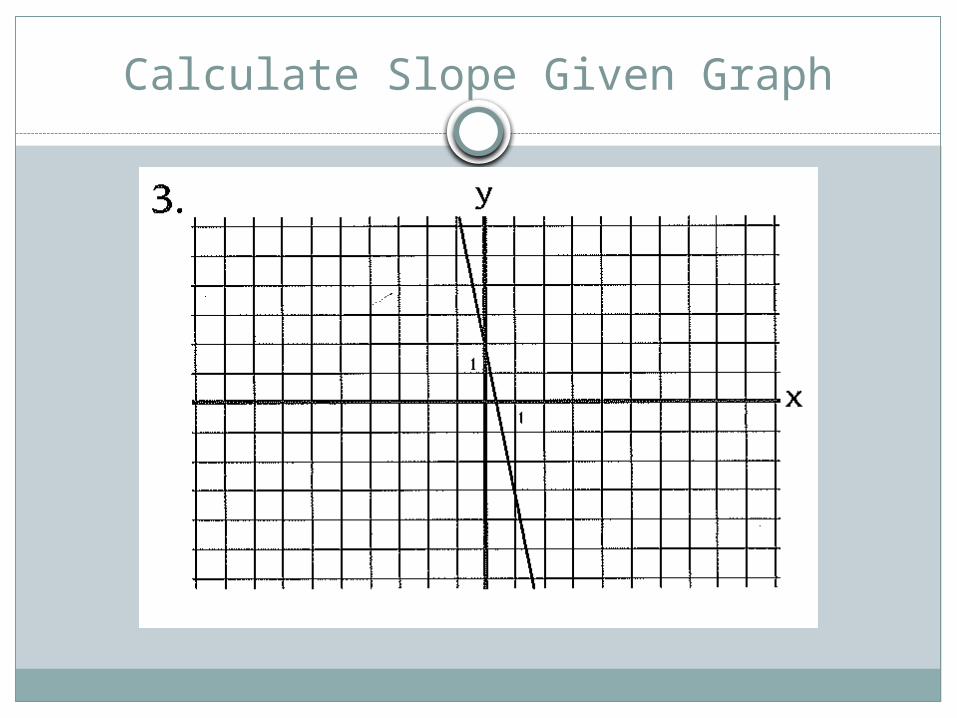
Calculate Slope Given Graph
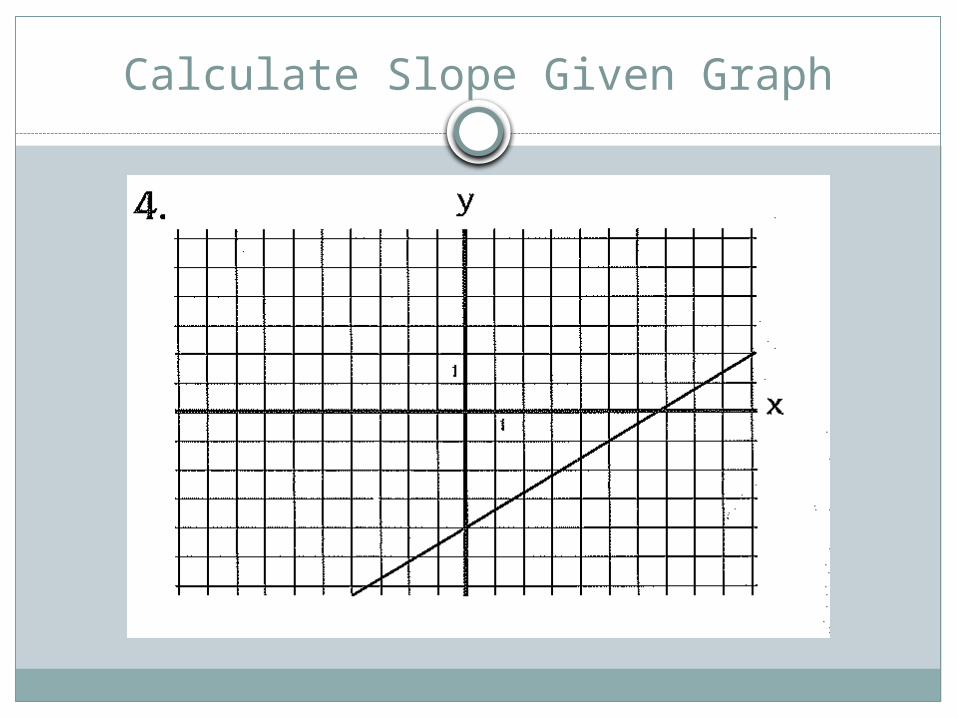
Calculate Slope Given Graph
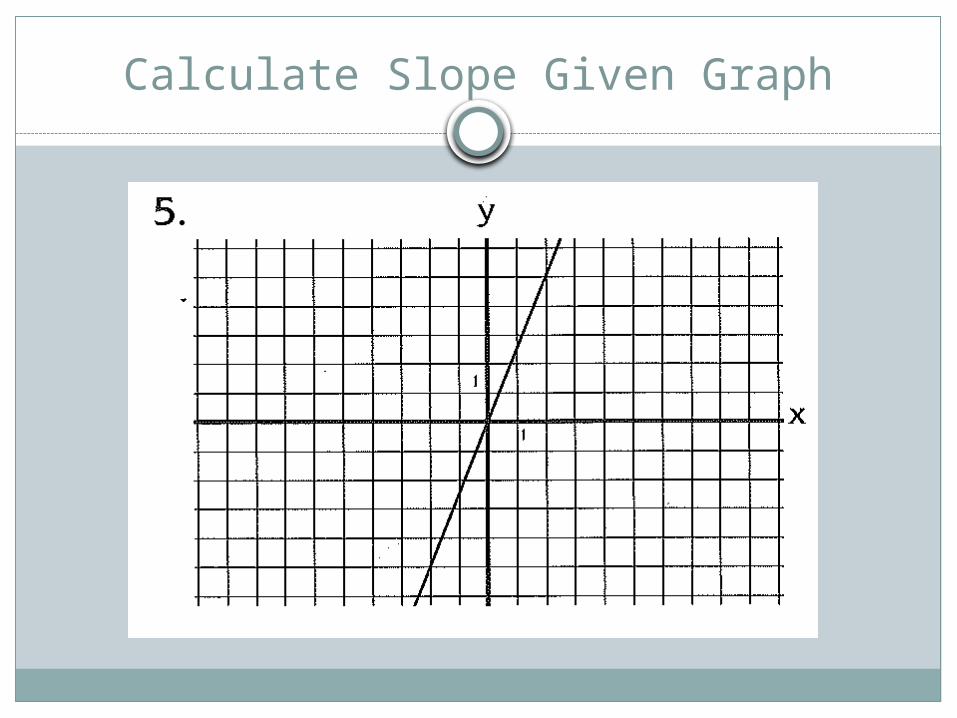
Calculate Slope Given Graph
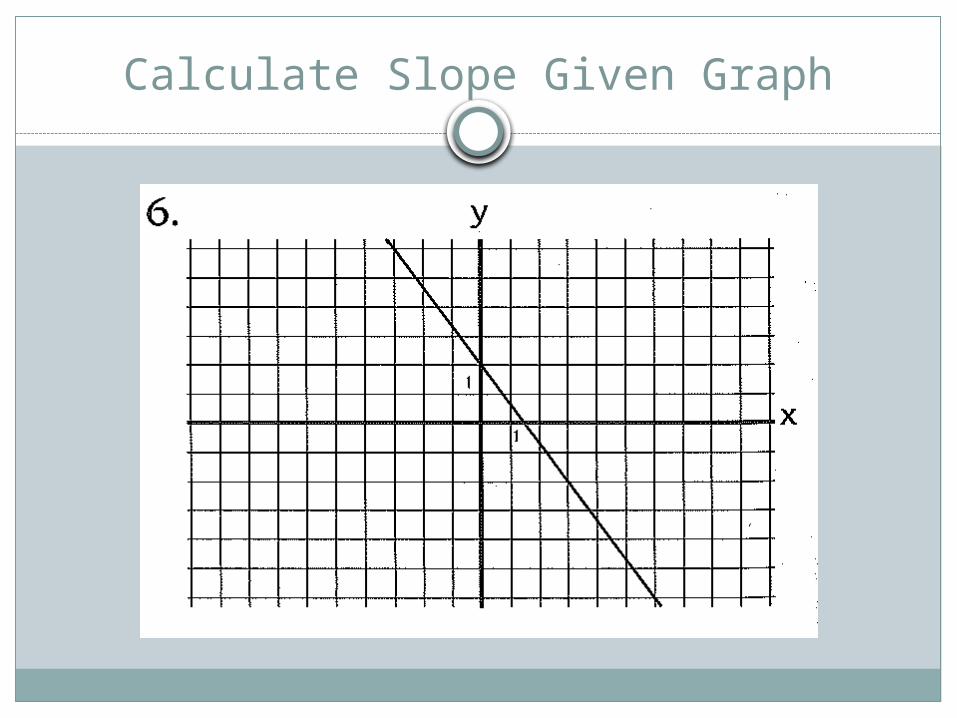
Calculate Slope Given Graph
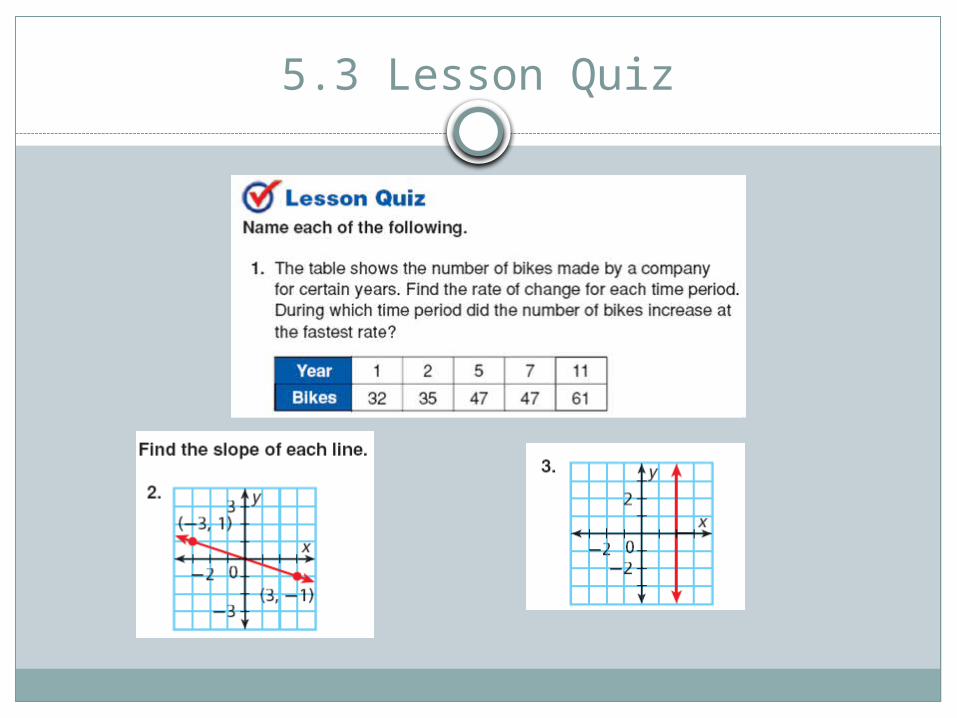
5.3 Lesson Quiz