534 techno-economic assessment of hybrid post-combustion
TRANSCRIPT

Energie & Umwelt / Energy & EnvironmentBand / Volume 534ISBN 978-3-95806-545-1
Energie & Umwelt / Energy & EnvironmentBand / Volume 534ISBN 978-3-95806-545-1
Techno-economic Assessment of Hybrid Post-combustion Carbon Capture Systems in Coal-fired Power Plants and Steel PlantsYuan Wang
534
Ener
gie
& Um
wel
tEn
ergy
& E
nvir
onm
ent
Tech
no-e
cono
mic
Ass
essm
ent o
f Hyb
rid P
ost-
com
bust
ion
Car
bon
C
aptu
re S
yste
ms
in C
oal-
fired
Pow
er P
lant
s an
d St
eel P
lant
sYu
an W
ang

Schriften des Forschungszentrums JülichReihe Energie & Umwelt / Energy & Environment Band / Volume 534


Forschungszentrum Jülich GmbHInstitut für Energie- und KlimaforschungTechno-ökonomische Systemanalyse (IEK-3)
Techno-economic Assessment of Hybrid Post-combustion Carbon Capture Systems in Coal-fired Power Plants and Steel Plants
Yuan Wang
Schriften des Forschungszentrums JülichReihe Energie & Umwelt / Energy & Environment Band / Volume 534
ISSN 1866-1793 ISBN 978-3-95806-545-1

Bibliografische Information der Deutschen Nationalbibliothek. Die Deutsche Nationalbibliothek verzeichnet diese Publikation in der Deutschen Nationalbibliografie; detaillierte Bibliografische Daten sind im Internet über http://dnb.d-nb.de abrufbar.
Herausgeber Forschungszentrum Jülich GmbHund Vertrieb: Zentralbibliothek, Verlag 52425 Jülich Tel.: +49 2461 61-5368 Fax: +49 2461 61-6103 [email protected] www.fz-juelich.de/zb Umschlaggestaltung: Grafische Medien, Forschungszentrum Jülich GmbH
Druck: Grafische Medien, Forschungszentrum Jülich GmbH
Copyright: Forschungszentrum Jülich 2021
Schriften des Forschungszentrums JülichReihe Energie & Umwelt / Energy & Environment, Band / Volume 534
D 82 (Diss. RWTH Aachen University, 2020)
ISSN 1866-1793 ISBN 978-3-95806-545-1
Vollständig frei verfügbar über das Publikationsportal des Forschungszentrums Jülich (JuSER)unter www.fz-juelich.de/zb/openaccess.
This is an Open Access publication distributed under the terms of the Creative Commons Attribution License 4.0, which permits unrestricted use, distribution, and reproduction in any medium, provided the original work is properly cited.

I
Abstract Post-combustion carbon capture technology is seen as an indispensable option for global CO2 mitigation. Nevertheless, the benchmark post-combustion carbon capture technology, i.e. the MEA-based chemical absorption technology, has been reported to be rather energy-intensive. Meanwhile, the performance of the gas permeation membrane technology, one of the emerging alternative carbon capture technologies, has also been found to be restricted by the membrane properties, especially when it is designed to be applied in industrial-scale plants. As a result, the applications of the post-combustion carbon capture technology in the power and industrial sectors are faced with great resistance. On the other hand, the research of post-combustion carbon capture for industry is found to lag behind the power sector. The objective of this work is to advance the feasibility of post-combustion carbon capture technology as well as contribute to the study of carbon capture in the steelmaking industry.
In order to do this, two types of hybrid membrane/MEA carbon capture systems (Hybrid D1 & D2) were designed in Aspen Plus®. In the Hybrid D1 system, a single-stage membrane is combined with an MEA system while a cascaded membrane system and an MEA system are combined in the Hybrid D2 system. For comparison, two widely studied standalone capture systems (cascaded membrane & MEA) were also modeled. The Polyactive® membrane was selected to be the investigated membrane material. These carbon capture systems were deployed in a reference coal-fired power plant and a reference iron & steel plant, respectively. A model of the power plant was simulated using EBSILON® Professional to represent the detailed operation. Pinch analysis was used to analyze the potential for waste heat integration of the capture systems into the water-steam cycle. In addition, the performances of the capture systems when the power plant is operated at part-load were investigated. As for the iron & steel plant, the energy use network and point sources of CO2 emissions inside the plant were analyzed so as to specify the boundary condition for carbon capture. A cost model based on the discounted cash flow approach was developed for economic analysis.
In the power plant, it is revealed that the Hybrid D1 system is neither an energy-efficient nor a cost-effective design. The Hybrid D2 system, however, has shown to lead to both a lower efficiency penalty (9.7 %-pts) and a lower CO2 avoidance cost (48.8 €/tCO2) than the standalone cascaded membrane and MEA systems in the power plant. A basic principle for the design of a hybrid system is concluded according to the result.
In the iron & steel plant, the Hybrid D2 system leads to the lowest CO2 avoidance cost (53.9 €/tCO2) but the differences in the avoidance costs of different capture systems are insignificant considering the uncertainty of the cost model. It is also found that the steam supply strategy has pronounced impacts on the cost competitiveness of a carbon capture system. In addition, it is disclosed that an overall lower CO2 avoidance cost can be achieved by deploying multiple types of capture systems to deal with different point sources of CO2 emissions as compared to deploying only one single type of capture system.

II

III
Kurzfassung Die Abscheidung von CO2-Emissionen aus Verbrennungsprozessen wird im Kontext einer globalen Klimagasminderung als unverzichtbare Option gesehen, um den erwarteten treibhausgasbedingten Temperaturanstieg zu vermeiden. Favorisiert für derartige Anwendungen werden derzeit MEA-basierte chemische Absorptionsverfahren, deren Einsatz jedoch sehr energieintensiv ist. Eine weitere vielversprechende Abscheidetechnologie ist der Einsatz von Gaspermeations-membranen. Ihr Einsatz in großtechnischen Anlagen ist allerdings aufgrund der Membraneigenschaften begrenzt. Neben den technischen Restriktionen entscheidet nicht zuletzt die Wirtschaftlichkeit der Verfahren über einen zukünftigen Einsatz. Im Rahmen der Arbeit wird analysiert, inwieweit eine Kopplung bzw. Kombination von MEA-Verfahren und Membrantechnologien (Hybridverfahren) eine Option darstellen könnten. Hierzu werden verschiedene Kombinationsmöglichkeiten sowohl aus technischer als auch ökonomischer Perspektive für die Anwendungsfelder Kohlekraftwerke und Stahlherstellung untersucht.
Als mögliche Kombinationsmöglichkeiten werden zwei Hybridverfahren vorgeschlagen, die sich durch die Anordnung und Verschaltung der Einzelverfahren unterscheiden. Dies ist zum einen eine Kombination eines einstufigen Membranprozesses, der dem MEA Verfahren vorgeschaltet ist (Hybrid D1). Zum anderen handelt es sich um einen kaskadierten Membranprozess, der vor einem MEA Prozess angeordnet wird (Hybrid D2). Die technische Analyse basiert auf detaillierten Aspen Plus®-Modellierungen. Zum Vergleich wurde auch der ausschließliche Einsatz von MEA Verfahren und ein kaskadiertes Membransystem analysiert. Als Membranmaterial wird eine Polyactive® Membran angenommen. Die CO2-Abscheidung in einem Steinkohlekraftwerk wurde mit EBSILON® Professional simuliert, um den Kraftwerksbetrieb detailliert darstellen zu können. Auf der Basis einer Pinch Point-Analyse wurde das Potenzial für die Integration von Abwärme zwischen den Abscheidungssystemen und dem Wasser-Dampf-Kreislauf analysiert. Daneben wurden auch Analysen zum Teillastbetrieb eines Kraftwerks durchgeführt. Gegenüber einem Kohlekraftwerk fallen die CO2 Emissionen bei der Stahlerzeugung in einem Hüttenwerk an unterschiedlichsten Stellen an. Das Energienetz und die punktuellen Quellen der CO2-Emissionen innerhalb der Anlage wurden analysiert, um die Randbedingung für die Kohlenstoffabscheidung festzulegen. Für die Wirtschaftlichkeitsanalysen wurde ein eigenes Modell entwickelt, das auf einem Discounted Cashflow-Ansatz basiert.
Die Ergebnisse zeigen, dass für einen Kraftwerkseinsatz das Hybrid D1 System im Vergleich mit den anderen untersuchten Verfahren weder energieeffizient noch wirtschaftlich darstellbar ist. Demgegenüber ist festzustellen, dass die Effizienzeinbußen des Hybrid D2 System mit 9,7 %-Punkte gegenüber einem ausschließlich kaskadierten Membraneinsatz deutlich niedriger sind und das Verfahren auch relativ niedrige CO2-Vermeidungskosten (48,8 €/tCO2) aufweist. Auch bei einem Einsatz in einem Stahlhüttenwerk weist das Hybrid D2 System im Vergleich mit allen anderen Verfahren die geringsten CO2-Vermeidungskosten (53,9 €/tCO2) auf. Aber die Unterschiede in den Vermeidungskosten der verschiedenen Erfassungssysteme sind angesichts der Unsicherheit des Kostenmodells unbedeutend. Es ist festzustellen, dass die Wahl der Dampfversorgungsstrategie in einem Hüttenwerk die Wirtschaftlichkeit von CO2-Abscheidungssystemen maßgeblich beeinflusst. Gegenüber einem Kraftwerksprozess besteht bei einem Hüttenwerk die Möglichkeit, unterschiedliche Abscheideverfahren je nach Charakteristik der CO2-Quelle einzusetzen. Die Analysen zeigen, dass dies zu niedrigeren CO2-Vermeidungskosten führt.

IV

i
Table of Contents Abstract....................................................................................................................................... I
Kurzfassung ...............................................................................................................................III
List of Figures ............................................................................................................................. v
List of Tables ............................................................................................................................. xi
Abbreviations and symbols ....................................................................................................... xv
1 Motivation ........................................................................................................................... 1
1.1 CO2 emissions and reduction measures ...................................................................... 1
1.2 Carbon capture – an indispensable solution to CO2 mitigation ..................................... 2
1.3 Objective and structure ................................................................................................ 3
2 Literature review and related work ...................................................................................... 5
2.1 An overview of decarbonization approaches ................................................................ 5
2.2 The MEA-based chemical absorption technology ........................................................ 7
2.3 Literature review of the application of the MEA-based chemical absorption technology 16
2.4 Gas permeation membrane technology ......................................................................19
2.5 Literature review of the application of the gas permeation membrane technology .......25
2.6 Hybrid carbon capture system ....................................................................................27
2.7 Review of the costing method for carbon capture .......................................................29
2.8 Discussion ..................................................................................................................31
2.9 Summary ....................................................................................................................33
3 Modeling of carbon capture systems and costing method ..................................................35
3.1 Modeling of MEA-based chemical absorption system .................................................35
3.2 Modeling of membrane-based separation systems .....................................................43
3.3 Modeling of hybrid capture systems ............................................................................46
3.4 Modeling of CO2 compression train .............................................................................49

ii
3.5 General costing method ..............................................................................................50
3.6 Discussion ..................................................................................................................56
3.7 Summary ....................................................................................................................60
4 Retrofitting of carbon capture systems into a coal-fired power plant ...................................63
4.1 Model of the reference power plant .............................................................................64
4.2 Parametric study for the MEA system .........................................................................69
4.3 Integration of the MEA system into the water-steam cycle ..........................................77
4.4 Parametric study for membrane-based separation system ..........................................88
4.5 Technical evaluation of the studied carbon capture systems .......................................92
4.6 Pinch analysis and waste heat integration ................................................................ 100
4.7 Economic evaluation ................................................................................................. 108
4.8 Discussion ................................................................................................................ 121
4.9 Summary .................................................................................................................. 124
5 Deployment of carbon capture systems in a greenfield iron and steel plant ..................... 127
5.1 Reference integrated iron and steel plant .................................................................. 127
5.2 Design basis for carbon capture................................................................................ 133
5.3 Technical analysis for carbon capture ....................................................................... 137
5.4 Economic analysis .................................................................................................... 143
5.5 Discussion ................................................................................................................ 151
5.6 Summary .................................................................................................................. 155
6 Summary ......................................................................................................................... 157
6.1 Scope and objectives ................................................................................................ 157
6.2 Approach .................................................................................................................. 157
6.3 Results of carbon capture deployment ...................................................................... 158
6.4 Conclusions and contributions .................................................................................. 161
Appendix A Definition ............................................................................................................. 163

iii
A.1 Definition of CO2 loading ............................................................................................... 163
A.2 Definition of CO2 capture rate ........................................................................................ 163
A.3 Definition of m value for amine solution ......................................................................... 163
Appendix B MEA model in Aspen Plus® ................................................................................. 165
B.1 MEA scrubbing model ................................................................................................... 165
B.2 Other initial specifications of the MEA model ................................................................. 166
B.3 Detailed information on the MEA model ........................................................................ 166
B.4 Convergence sequence ................................................................................................ 167
B.5 Calculation of MEA regeneration thermal energy .......................................................... 168
B.6 CO2 solubility ................................................................................................................. 169
B.7 CO2 heat capacity ......................................................................................................... 170
Appendix C Cascaded membrane system ............................................................................. 171
C.1 Model of the cascaded membrane system in Aspen Plus® ............................................ 171
C.2 Detailed information on the cascaded membrane model ............................................... 172
Appendix D Hybrid model design ........................................................................................... 173
D.1 Hybrid model D1 ........................................................................................................... 173
D.2 Hybrid model D2 ........................................................................................................... 174
Appendix E Power plant ......................................................................................................... 175
E.1 Information of hard coal ................................................................................................. 175
E.2 Characteristics of the steam generator .......................................................................... 176
E.3 Characteristics of the combustion chamber ................................................................... 177
E.4 Characteristics of the steam turbine .............................................................................. 178
E.5 Integration of the MEA system into the power plant in EBSILON® ................................. 179
Appendix F Reference iron & steel plant ............................................................................... 181
F.1 Raw materials and products .......................................................................................... 181
F.2 Characteristic of the available natural gas ..................................................................... 182

iv
Appendix G HEN optimization for carbon capture in the power plant ...................................... 183
G.1 Pinch analysis for MEA-CO2 compression-LP preheaters ............................................. 183
G.2 Pinch analysis for membrane-CO2 compression-LP preheaters .................................... 184
G.3 Pinch analysis for Hybrid D1-CO2 compression-LP preheaters ..................................... 185
G.4 Pinch analysis for Hybrid D2-CO2 compression-LP preheaters ..................................... 186
G.5 Steam extraction for LP preheaters ............................................................................... 187
G.6 Optimized HEN for the standalone cascaded membrane system .................................. 188
G.7 HEN for cascaded membrane-CO2 compression-feed water ........................................ 189
G.8 HEN for MEA-CO2 compression-feed water .................................................................. 190
G.9 HEN for Hybrid D1 – CO2 compression – feed water .................................................... 191
G.10 HEN for Hybrid D2 – CO2 compression – feed water .................................................. 192
Appendix H Costing method ................................................................................................... 193
H.1 Sizing of separation vessels .......................................................................................... 193
H.2 Difference between CO2 captured and avoided ............................................................. 194
H.3 Classification of cost estimate ....................................................................................... 195
Appendix I Economic analysis for carbon capture in the reference power plant ...................... 197
I.1 Breakdown of CAPEX & OPEX ...................................................................................... 197
I.2 Material, pressure and temperature factors .................................................................... 205
Appendix J Economic analysis for carbon capture in the reference iron & steel plant ............. 207
J.1 Geometric results of the capture systems ...................................................................... 207
J.2 Overview of the equipment costs ................................................................................... 207
J.3 CAPEX .......................................................................................................................... 211
J.4 OPEX ............................................................................................................................ 215
References ............................................................................................................................. 219

v
List of Figures Figure 1.1 Structure and workflow of the present thesis ............................................................. 4
Figure 2.1 Technology readiness level (TRL) of CCS technologies ............................................ 6
Figure 2.2 Schematic of amine scrubbing .................................................................................. 8
Figure 2.3 Classification of membrane materials for CO2 separation .........................................19
Figure 2.4 Schematic of a single-stage membrane CO2 separation process. ............................22
Figure 2.5 Schematic of a two-stage membrane system ...........................................................23
Figure 2.6 Flow diagram of a two-stage membrane system with sweep gas .............................24
Figure 2.7 Hybrid membrane-absorption systems: a) series arrangement, b) parallel arrangement .............................................................................................................................28
Figure 2.8 A modified two-step membrane CO2 separation process with cryogenic technology .................................................................................................................................................29
Figure 3.1 Schematic of the MEA-based chemical absorption system ......................................35
Figure 3.2 Breakdown of the convergence for the MEA model ..................................................40
Figure 3.3 Specific regeneration energy as a function of the solvent flow rate ..........................42
Figure 3.4 CO2 capture rate as a function of the solvent flow rate .............................................42
Figure 3.5 Schematic of a cross-flow membrane module ..........................................................43
Figure 3.6 Schematic flowsheet of a single-stage membrane separation system. ....................44
Figure 3.7 Schematic flowsheet of the cascaded membrane separation system .......................44
Figure 3.8 Schematic flowsheet of the hybrid capture system design 1 .....................................47
Figure 3.9 Schematic flowsheet of the hybrid capture model design 2 ......................................48
Figure 3.10 Four-stage CO2 compression train ........................................................................49
Figure 3.11 General approach for cost estimation ....................................................................50
Figure 4.1 Overview of the workflow for Chapter 4 ....................................................................63
Figure 4.2 Plan of the water-steam cycle ..................................................................................65
Figure 4.3 Plan of the fuel-flue gas route ...................................................................................66

vi
Figure 4.4 Topology of the reference coal-fired power plant model ...........................................67
Figure 4.5 Specific reboiler duty as a function of the CO2 lean loading .....................................70
Figure 4.6 Breakdown of the MEA regeneration energy ............................................................71
Figure 4.7 MEA solvent flowrate and CO2 loading difference as a function of CO2 lean loading 72
Figure 4.8 Stripper inlet temperature and boil-up ratio as a function of CO2 lean loading ..........73
Figure 4.9 Specific reboiler duty as a function of the absorber packing height .........................74
Figure 4.10 Specific reboiler duty as a function of the absorber packing height........................74
Figure 4.11 Specific reboiler duty as a function of the CO2 concentration in the flue gas ..........75
Figure 4.12 Specific reboiler duty as a function of the MEA solution flow rate ..........................76
Figure 4.13 Iterative calculation for determining the enthalpy of the steam entering the reboiler .................................................................................................................................................78
Figure 4.14 Existing steam extraction ports on turbines ............................................................79
Figure 4.15 Integration of the MEA system into the reference power plant ................................80
Figure 4.16 h-s diagram of steam without the MEA system ......................................................83
Figure 4.17 h-s diagram of steam with and without the MEA system ........................................84
Figure 4.18 h-s diagram of steam with and without pressure control valve ...............................84
Figure 4.19 Specific regeneration energy and efficiency penalty as a function of the reboiler temperature ..............................................................................................................................85
Figure 4.20 Pressure and enthalpy of steam at the steam extraction port .................................86
Figure 4.21 Mass flow rate of the extracted steam as a function of the reboiler duty .................87
Figure 4.22 Efficiency penalties caused by the cascaded membrane system (incl. compression) .................................................................................................................................................88
Figure 4.23 Influence of the CO2 concentration in the flue gas ..................................................89
Figure 4.24 CO2 concentration in the permeate and retentate gases and required membrane .90
Figure 4.25 Membrane area and CO2 purity in the permeate gas as a function of the H2O removal ratio .............................................................................................................................91
Figure 4.26 CO2 and H2O fractions in the permeates as a function of H2O removal ratio ..........92

vii
Figure 4.27 Comparison of efficiency penalties between different capture models ....................95
Figure 4.28 Normalized values of CO2 concentration in the flue gas at different loads ..............97
Figure 4.29 CO2 concentration as a function of the load of the reference power plant ..............98
Figure 4.30 Flue gas flow rate as a function of the load of the reference power plant ...............98
Figure 4.31 Efficiency of the power plant as a function of load ..................................................99
Figure 4.32 Efficiency penalties caused by the CO2 capture systems as a function of load .......99
Figure 4.33 Composite curves of the cascaded membrane system......................................... 101
Figure 4.34 Composite curves of the MEA system .................................................................. 102
Figure 4.35 Composite curves of the Hybrid D1 system .......................................................... 102
Figure 4.36 Composite curves of the Hybrid D2 model ........................................................... 103
Figure 4.37 Zoom-in on the LP feedwater preheaters in the water-steam cycle ...................... 104
Figure 4.38 Utilization of the waste heat from the cascaded membrane system and CO2 compression ........................................................................................................................... 105
Figure 4.39 Utilization of the waste heat from the MEA system and CO2 compression ........... 106
Figure 4.40 Utilization of the waste heat from the Hybrid D1 system and CO2 compression train ............................................................................................................................................... 106
Figure 4.41 Utilizing waste heat from the Hybrid D2 system and CO2 compression ................ 107
Figure 4.42 Efficiency penalties before and after heat integration ........................................... 108
Figure 4.43 Purchased equipment costs for the cascaded membrane separation system ....... 110
Figure 4.44 Purchased equipment costs for the MEA system ................................................. 110
Figure 4.45 Purchased equipment costs for the Hybrid D1 system ......................................... 111
Figure 4.46 Purchased equipment costs for the Hybrid D2 system ......................................... 111
Figure 4.47 CO2 capture and avoidance costs ........................................................................ 113
Figure 4.48 Annual cost of carbon capture system as a function of operation time ................. 117
Figure 4.49 LCOE with carbon capture as a function of operation time ................................... 117
Figure 4.50 LCOE as a function of membrane price ................................................................ 118
Figure 4.51 LCOE as a function of membrane lifetime ............................................................ 119
viii
Figure 4.52 LCOE as a function of the CO2 allowance price ................................................... 120
Figure 5.1 Production process and CO2 emission sources in the reference iron and steel plant. ............................................................................................................................................... 129
Figure 5.2 Weight percent of CO2 emissions from different units in the iron and steel plant .... 131
Figure 5.3 Diagram of the energy flows in the reference iron and steel plant .......................... 132
Figure 5.4 Steam generator model in EBSILON® .................................................................... 135
Figure 5.5 The boundary of techno-economic analysis for carbon capture in the reference plant ............................................................................................................................................... 136
Figure 5.6 Electricity demand for CO2 capture and compression ............................................ 137
Figure 5.7 Thermal energy demand for CO2 capture ............................................................... 138
Figure 5.8 Amount of CO2 captured and avoided .................................................................... 140
Figure 5.9 Sensitivity of the CO2 avoidance rate to the CO2 emission factor of the imported electricity ................................................................................................................................. 142
Figure 5.10 Sensitivity of the CO2 avoidance rate to the CO2 emissions from the SGU ........... 143
Figure 5.11 Annualized CAPEXs for CO2 capture ................................................................... 144
Figure 5.12 OPEXs for CO2 capture and compression ............................................................ 145
Figure 5.13 HRC cost as a function of the CO2 allowance price .............................................. 149
Figure 5.14 Comparison of CO2 avoidance costs with two steam supply methods .................. 151
Appendix B
Figure B. 1 Flowsheet diagram of the MEA-based scrubbing system in Aspen Plus ............... 165
Appendix C
Figure C. 1 Flowsheet of the cascaded membrane system in Aspen Plus® ............................ 171
Appendix D
Figure D. 1 Flowsheet of the hybrid capture model design 1 in Aspen Plus® ........................... 173
Figure D. 2 Flowsheet of the hybrid capture model design 2 in Aspen Plus® ........................... 174
Appendix E
Figure E. 1 Characteristics of the steam generator ................................................................. 176

ix
Figure E. 2 Characteristics of the combustion chamber .......................................................... 177
Figure E. 3 Characteristics of the steam turbine ...................................................................... 178
Figure E. 4 Implementation of the integration of MEA system in EBSILON®............................ 179
Appendix G
Figure G. 1 Optimized HEN for the standalone cascaded membrane system ......................... 188
Figure G. 2 HEN design for heat integration of the cascaded membrane system, CO2 compression train and LP preheaters ...................................................................................... 189
Figure G. 3 HEN design for heat integration of the MEA system, CO2 compression train and LP preheaters ............................................................................................................................... 190
Figure G. 4 HEN design for integration of the Hybrid D1 system, CO2 compression train and LP preheaters ............................................................................................................................... 191
Figure G. 5 HEN design for integration of the Hybrid D2 system, CO2 compression train and LP preheaters ............................................................................................................................... 192
Appendix H
Figure H. 1 Difference between the amounts of CO2 captured and avoided ............................ 194

x

xi
List of Tables Table 2.1 Evaluation of solvent properties .................................................................................12
Table 2.2 Published technical and economic results of the MEA system in power plants ..........17
Table 2.3 Comparison of membrane modules ...........................................................................22
Table 2.4 Published technical and economic evaluation of the membrane-based CO2 separation process .....................................................................................................................................26
Table 3.1 Initial specifications of the absorber ...........................................................................36
Table 3.2 Initial specifications of the stripper .............................................................................37
Table 3.3 Summary of coefficients for equilibrium reaction .......................................................39
Table 3.4 Values of parameters k and E ...................................................................................39
Table 3.5 Input experimental data for validation ........................................................................41
Table 3.6 Gas permeance (Nm3m−2h−1bar−1) of Polyactive® ......................................................45
Table 3.7 Initial specifications of the single-stage membrane separation system ......................45
Table 3.8 Initial specifications of the cascaded membrane separation system ..........................46
Table 3.9 Breakdown for CAPEX ..............................................................................................51
Table 3.10 Equipment delivered capital cost correlations .........................................................52
Table 3.11 Equipment cost data for Turton’s equation ..............................................................53
Table 3.12 Breakdown for OPEX .............................................................................................54
Table 3.13 Formulas for economic calculation ..........................................................................55
Table 3.14 Assumptions and cost parameters for the CO2 capture systems .............................56
Table 4.1 Inlet parameters of turbines and condenser...............................................................65
Table 4.2 Characteristics of the flue gas ..................................................................................66
Table 4.3 Validation of the power plant model ...........................................................................68
Table 4.4 Flue gas flow rate ......................................................................................................75
Table 4.5 Summary of optimized specifications .........................................................................76
Table 4.6 Estimation of the mass flow rate of the extracted steam ............................................78
xii
Table 4.7 Parameters of possible steam extraction ports ..........................................................79
Table 4.8 Comparison of two pressure control scenarios ..........................................................82
Table 4.9 Summary of the CO2 capture rate distribution inside the hybrid capture systems ......93
Table 4.10 Technical results for the carbon capture systems ....................................................94
Table 4.11 Input heat values and the efficiencies of the power plant at different loads ..............96
Table 4.12 Summary of available waste heat .......................................................................... 103
Table 4.13 Effects of the heat integration for the cascaded membrane system ...................... 106
Table 4.14 Effects of the heat integration for the MEA system ................................................ 106
Table 4.15 Effects of the heat integration for the Hybrid D1 system ........................................ 107
Table 4.16 Effects of the heat integration for the Hybrid D2 system ........................................ 107
Table 4.17 Additional heat exchanger areas for the waste heat integration ............................. 108
Table 4.18 Assumptions and cost parameters for the power plant cost model ........................ 109
Table 4.19 Summary of economic results ............................................................................... 112
Table 4.20 Comparison of the present study with published results of the MEA technology .... 114
Table 4.21 Comparison of the present study with the published results of cascaded membrane systems................................................................................................................................... 115
Table 4.22 Breakeven CO2 allowance price and LCOE ........................................................... 120
Table 4.23 Breakdown of the total reboiler duty ...................................................................... 121
Table 4.24 Breakdown of the specific electricity demand into capture sections ....................... 122
Table 5.1 Characteristics of the reference iron and steel plant. ............................................... 127
Table 5.2 Characteristics of the flue gases in the reference iron and steel plant ..................... 130
Table 5.3 Characteristics of the off-gases .............................................................................. 131
Table 5.4 The composition of the flue gas from the steam generation plant ............................ 135
Table 5.5 Specific reboiler duty and electricity demand ........................................................... 139
Table 5.6 Additional CO2 generated due to the imported electricity and steam generator ....... 139
Table 5.7 CO2 capture and avoidance rates ............................................................................ 141

xiii
Table 5.8 The assumptions and cost parameters for the reference iron and steel plant .......... 143
Table 5.9 CO2 capture, avoidance and HRC costs .................................................................. 146
Table 5.10 Comparison of the present study with literature ..................................................... 148
Table 5.11 Breakeven HRC cost and CO2 allowance price ..................................................... 150
Table 5.12 Additional CO2 emission and CO2 avoidance rates with imported electricity and steam ...................................................................................................................................... 150
Appendix B
Table B. 1 Other initial specifications of the MEA model ......................................................... 166
Table B. 2 Blocks in the MEA model and economic consideration .......................................... 166
Table B. 3 Redefined convergence sequence for the MEA model ........................................... 167
Table B. 4 Coefficients to determine CO2 solubility ................................................................. 169
Table B. 5 Coefficients to determine CO2 heat capacity [193, 194] ......................................... 170
Appendix C
Table C. 1 Blocks in the cascaded membrane model and economic consideration ................. 172
Appendix E
Table E. 1 Elemental analysis of Klein Kopje .......................................................................... 175
Appendix F
Table F. 1 Raw Materials, products, by-products, intermediate products, waste Materials, off-gases and ............................................................................................................................... 181
Table F. 2 Characteristic of the natural gas ............................................................................. 182
Appendix G
Table G. 1 Process streams for pinch analysis........................................................................ 183
Table G. 2 Process streams for pinch analysis........................................................................ 184
Table G. 3 Process streams for pinch analysis........................................................................ 185
Table G. 4 Process streams for pinch analysis........................................................................ 186
Table G. 5 Steam extraction for LP preheaters ....................................................................... 187
Appendix H
xiv
Table H. 1 Classification of cost estimate ................................................................................ 195
Appendix I
Table I. 1 Breakdown of the CAPEX of the MEA system ......................................................... 197
Table I. 2 Breakdown of the OPEX for the MEA system .......................................................... 198
Table I. 3 Breakdown of the CAPEX for the cascaded membrane separation system ............. 199
Table I. 4 Breakdown of the OPEX for the cascaded membrane separation system ............... 200
Table I. 5 Breakdown of the CAPEX for the Hybrid D1 system ................................................ 201
Table I. 6 Breakdown of the OPEX for the Hybrid D1 system .................................................. 202
Table I. 7 Breakdown of the CAPEX for the Hybrid D2 system ................................................ 203
Table I. 8 Breakdown of the OPEX for the Hybrid D2 system .................................................. 204
Table I. 9 Material, pressure and temperature factors for the MEA system ............................. 205
Table I. 10 Material, pressure and temperature factors for the cascaded membrane system .. 206
Appendix J
Table J. 1 Geometric results of important components of capture systems ............................. 207
Table J. 2 Equipment costs for cascaded membrane system (million €) ................................. 207
Table J. 3 Equipment costs for the MEA system (million €) ..................................................... 209
Table J. 4 Equipment costs for the Hybrid D2 system (million €) ............................................. 209
Table J. 5 Equipment costs for the CO2 compression trains (million €) .................................... 211
Table J. 6 Cost parameters for CAPEX estimation .................................................................. 211
Table J. 7 CAPEX data for the cascaded membrane system (million €) .................................. 213
Table J. 8 CAPEX for the MEA system (million €) ................................................................... 214
Table J. 9 CAPEX for the Hybrid D2 system (million €) ........................................................... 214
Table J. 10 Cost parameters for the OPEX estimation ............................................................ 215
Table J. 11 OPEX data for the capture systems (million €/yr) .................................................. 216
Table J. 12 OPEX data for the CO2 compression trains and steam generation plant (million.€/yr) ............................................................................................................................................... 218

xv
Abbreviations and symbols Abbreviations
AACE Association for the advancement of cost engineering
AC Aftercooler
AEA Aspen Energy Analyzer
BFG Blast furnace gas
BOFG Basic oxygen furnace gas
CAPEX Capital expenditure
CCR CO2 capture rate
CCS Carbon dioxide Capture and Storage
CEPCI Chemical Engineering Plant Cost Index
CHP Combined heat and power
COG Coke oven gas
ETS Emission trading scheme
EU European Union
FGD Flue gas desulfurization
FCI Fixed capital investment
gpu Gas permeation unit
HETP Height equivalent to the theoretical plate
HI Heat integration
HP High pressure
HRC Hot rolled coil
IEMC Integrated environmental control model
IMTP Intalox metal tower packing
IP Intermediate pressure

xvi
LCOE Levelized cost of electricity
LP Low pressure
MEA Monoethanolamine
NCV Net calorific value
OBF Oxygen blast furnace
OECD Organization for economic cooperation and development
OPEX Operational expenditure
PEC Purchased equipment costs
PH Preheater
RLHX Rich-lean heat exchanger
SCR Selective catalytic reduction
SGP Steam generation plant
TGRBF Top gas recycling blast furnace
TRL Technology readiness level
WI Working investment
Chemicals
AMP Aminomethylpropanol
AR Argon
C2H6 Ethane
C3H8 Propane
C4H10 Butane
C5H12 Pentane
CH4 Methane
CO2 Carbon dioxide

xvii
MDEA Methyldiethanolamine
MEA Monoethanolamine
N2 Nitrogen
NaOH Sodium hydroxide
O2 Oxygen
PCV Pressure control valve
PZ Piperazine
TAME Tertamylmethylether
Latin symbols
A Area of membrane [m2]
a Annuity factor
ai Stoichiometric coefficient of component i
Bi Concentration of component i
Ci Cost of equipment i
Cp,i Mass-specific heat capacity of species i [J/(kg▪°C)]
d Diameter [m]
D Diffusivity
Di Minimum diameter of equipment i [m]
E Activation energy [cal/mol]
f Correction factor
F Mole flow [kmol/h]
G Gas
h Specific enthalpy [kJ/kg]
Hi Height of equipment i [m]
hi Depth of component i [m]
xviii
I CO2 intensity [ton/MWh]
K Equilibrium constant
k Pre-exponential factor
L Liquid
M Exponent for cost calculation
Mi Molar weight of component i [kg/kmol]
mi Mass flow rate of substance i [ton/s]
��� Molality of species i [mol i/kg H2O]
n Temperature exponent
N Number of components in reaction
p Pressure [bar]
P Permeance [m3m−2h−1bar−1]
pd Pressure drop
q Specific heat [GJth/t CO2]
R Universal gas constant [8.3145 J/mol▪K]
r Pressure ratio
S Solubility
T Temperature [ºC]
t time [s]
us,i Settling velocity in equipment i [m/s]
Vi volumetric flowrate of component i [m3/s]
W Power [MWe]
xi Mole fraction of species i in the liquid phase
yi Mole fraction of species i in the gas phase
Z Equipment specific constant
xix
Greek symbols
α CO2 loading [mol CO2 / mol MEA]
βi/j Selectivity of component i relative to j
η Efficiency of power plant [%]
ρi Density of phase i [Kg/m3]
Subscript
ab Absorber
abs absorption
amb ambient
an annual
av avoided
c Column
cap capture
comp CO2 compression
e Electric
g gas phase
G Gas stream
i,top The top of equipment i
In inlet
kd Knockout drum
l Liquid phase
L Liquid stream
M Material
mem membrane
output Output of power plant

xx
p Pressure
per permeate
reb reboiler
ref Reference
ret retentate
sens Sensible
sol Total solution
strip Stripper
T Temperature
th Thermal
tot total
v Vapor
vap vapor
Superscript
’ Saturated water
” Saturated steam
0 Base case
abs absorption
l Liquid phase
s saturation
sens Sensible
vap vapor

1
1 Motivation
1.1 CO2 emissions and reduction measures
As the largest contributor of all greenhouse gases (GHG) from human activities to global warming [1, p. 53], anthropogenic CO2 is released mostly by burning fossil fuels or the use of raw materials. Particularly, the energy and industry sectors are the two major sources of CO2 emissions1. It is reported that, in the year 2017, 41 % of the total CO2 emissions were generated in electricity and heat production across the world [2]. On the other hand, industrial sectors emit about 19 % of global GHG emissions [2]. In particular, the iron and steel industry is an energy- and carbon-intensive process which makes up about 6 % of global CO2 emissions [3].
In general, 5 technological measures have been considered for the global reduction of CO2 emissions, which are shown as follows [1, p. 53]:
� increasing the efficiency of energy conversion; � switching to less carbon-intensive fuels; � increasing the use of renewable or nuclear energy; � enhancing biological absorption capacity in forests and soils; � CO2 capture and storage (CCS).
The first three measures have been widely taken or investigated for the power sector. Especially, the rapidly rising installed capacity and declining costs of renewable energy (e.g. solar, wind, etc.) have been witnessed in recent years [4]. However, the supply of renewable energy is still constrained by cost, intermittent supply, land use and other factors [1, p. 58]. As a result, on a global level, coal is still widely used to produce electricity as a result of its relatively low cost, especially in countries with large energy consumption rates [5]. In these countries, the use of coal is likely to remain to play a significant role in their energy structure for the foreseeable future [6]. It is reported that the global coal consumption has rebounded in 2017 after a decline in two consecutive years [6, p. 4]. Moreover, even in countries where renewable energy is replacing fossil fuels rapidly, many coal-fired power plants are still running and will not be decommissioned right away.
In the iron and steel industry, the reduction of energy consumption and CO2 emissions have been mostly relied on increasing the efficiency of the production process for decades. The energy intensity of steelmaking has dropped by 60 % from 1960 to 2017 [7]. Nevertheless, the decreasing rate has been apparently slowing down in recent years [7]
As the modern steel production process is already working close to their thermodynamic limits, further CO2 reduction in the iron and steel industry is unlikely to be realized by simply increasing the efficiency of energy use. Introducing renewable energy into steel production process has
1 The term ‘emission’ only refers to anthropogenic emission in this thesis.

1.2 Carbon capture – an indispensable solution to CO2 mitigation
2
also been studied and shown great potential for CO2 reduction [8]. However, this requires a substantial change in the current production process and entails much higher energy demand [8].
1.2 Carbon capture – an indispensable solution to CO2 mitigation
According to several studies [9, p. 323, 10, 11], there is currently no single CO2 reduction solution that is able to accomplish a global transition to 1.5 ºC-consistent pathways. Besides, studies have shown that CO2 mitigation costs would significantly increase without CCS in global CO2 removal scenarios [12, 13]. Therefore, the deployment of CCS will play an essential role in many countries to achieve a CO2 emission trajectory consistent with limiting the temperature rise to 1.5 ºC. Additionally, the concept CCU (carbon capture and utilization) is drawing more attention than the CCS concept in recent years as the public perception of CO2 storage is generally negative [14]. Studies for the utilization of CO2 [15, 16, 17, 18] and the fact that commercial application of CO2 [15] already exist are likely to increase the public acceptance of carbon capture tehnologies.
1.2.1 Post-combustion carbon capture
CCS technology consists of two major processes: capture and storage. State-of-the-art CCS technologies differ from each other mostly in the CO2 capture process. Essentially, CO2 capture technologies for stationary plants can be divided into three types [19, 20]: 1) Post-combustion, 2) Oxy-fuel combustion, and 3) Pre-combustion. Of the three types of CO2 capture systems, post-combustion capture (PCC) is considered the most straightforward scheme as fewer retrofits to target plants are required in comparison to the other two. Post-combustion capture systems separate CO2 from flue gases produced from the combustion of fossil fuels so that it will not intervene in production processes. As a result, post-combustion capture technologies are most favored by existing plants for its end-of-pipe feature.`
1.2.2 Challenges and research gap
In spite of the existence of a variety of post-combustion capture technologies, the most studied one is known as the amine-based chemical absorption process, or amine scrubbing technology. The monoethanolamine (MEA) is very often selected as the amine solvent for this technology [21]. Nevertheless, this reference post-combustion technology is reported to be rather costly and energy-intensive [11, 22, 23]. Against this backdrop, efforts have been made by many CCS researchers to develop less energy-intensive post-combustion capture systems in recent years [24, 25, 26, 27, 28, 29, 30]. One technology that has drawn a great deal of attention of some researchers for post-combustion CO2 capture is the membrane-based gas permeation technology [31, 32, 33]. However, this technology is found to be highly limited by the inherent properties of the membrane materials (permeability, selectivity, and resistance to acidic gases) [32, 34, 35, 36]. Therefore, further improvements to membrane materials would be of great importance so as to implement this technology.

1 Motivation
3
As mentioned in the last section, a great deal of CO2 is emitted from both the power sector and the steel industry. Many papers on post-combustion CO2 capture technologies applied in the power sector have been published in the past few years [5, 31, 37, 38, 39]. Nonetheless, research work on post-combustion carbon capture from industry comparatively lags behind.
As the renewable energy market is expanding rapidly and becoming increasingly economically feasible, CCS may not be the primary option for CO2 mitigation in the power sector. By contrast, the role CCS can play in industry to abate process CO2 emissions is increasingly prominent. Some researchers have even argued that ‘carbon capture is more important in the industry than in the power sector due to a lack of alternatives for low-carbon plants’ [40].
Although some publications concerning the deployment of CCS in the iron and steel industry exist [41, 42, 43], they are mostly focused on the MEA-based technology. Although a few studies have been reported on the investigation of carbon capture from steelmaking processes using gas permeation technology [44, 45], a systematic techno-economic study for it has not been seen.
1.3 Objective and structure
In light of the motivation, the objectives of this thesis include:
� Advancing the feasibility of post-combustion carbon capture technology by developing hybrid MEA/membrane CO2 capture systems;
� Comparing the techno-economic performances of the developed hybrid systems with the standalone carbon capture technologies (membrane-based separation & MEA-based capture systems) in power and steelmaking plants;
� Filling the research gap for a comprehensive techno-economic analysis for the membrane-based carbon capture technology in the iron & steel industry.
Consequently, the following questions shall be answered:
1. Do hybrid membrane/MEA systems have potential for pushing forward the feasibility of post-combustion carbon capture in power sector and steelmaking industry?
2. What would the impacts on an iron & steel plant be when the post-combustion carbon capture systems are deployed?
What should be noted here is that the present study only focuses on the CO2 capture and compression processes. The transport, storage, and utilization of CO2 are not in the scope of this study.
Figure 1.1 encompasses the basic structure and workflow of this thesis. As illustrated, Chapter 2 discusses some published work related to the present study, covering research on MEA technology, membrane, carbon capture in power plants and steel industry, etc. In Chapter 3, the detailed information for the studied CO2 capture models as well as the cost model is presented.

1.3 Objective and structure
4
Given the simulated CO2 capture models, the deployments of them in a reference coal-fired power plant and a reference iron & steel plant are investigated in Chapter 4 and Chapter 5, respectively. Both technical and economic results for the deployments are discussed.
Finally, Chapter 6 gives a summary of the whole thesis.
Figure 1.1 Structure and workflow of the present thesis

5
2 Literature review and related work This chapter reviews the related literature work. Section 2.1 presents the current state of the decarbonization approaches in the power sector and iron & steel industry. Section 2.2 introduces the background knowledge with regard to the MEA-based chemical absorption technology as well as its development. Section 2.3 summarizes the reported technical and economic performances of the MEA-based system applied in coal-fired power plants and the iron & steel industry.
The basic knowledge and status quo of the application of the gas permeation membrane technology are presented in Section 2.4 and 2.5, respectively. In Section 2.6, several studied hybrid CO2 capture systems are introduced. Section 2.7 briefly reviews the general costing method for carbon capture. Finally, a discussion of the related work from literature is made in Section 2.8. The whole chapter ends with a summary section (Section 2.9).
2.1 An overview of decarbonization approaches
2.1.1 Carbon capture routes and technologies
As discussed in the last chapter, carbon capture is one of the most straight forward approaches to decarbonizing the power sector. Particularly, three pathways for CO2 capture are being widely investigated [1, 46]:
� Post-combustion: CO2 is captured from flue gases after combustion. � Oxy-fuel: high purity O2 is used for combustion, which results in higher CO2
concentration in the flue gas � Pre-combustion: CO2 is captured from syngas produced in a gasification unit for fossil
fuels
Of the three routes, the post-combustion route is considered the most suitable option for the existing coal-fired power plants mainly because of its end-of-pipe feature. Therefore, a capture system can be added more easily as a retrofit.
A wide range of post-combustion capture technologies exist although not all of them have been commercialized and ready for full-scale operation [11, 38, 46]. These technologies include absorption (chemical & physical), adsorption, membrane, cryogenic, etc. [1, 38, 46, 47]. Many studies have been reported concerning the application and development of these technologies [19, 48, 49].
Of the studied technologies, the amine-based chemical absorption technology is by far the most mature post-combustion carbon capture technology [11]. Bui et al. [11] have concluded the readiness level of relevant technologies in the field of capture, transport, storage, and utilization (see Figure 2.1).

2.1 An overview of decarbonization approaches
6
Figure 2.1 Technology readiness level (TRL) of CCS technologies [11]
2.1.2 Decarbonization in coal-fired power plants
For power plants, all the three capture routes mentioned above have been tested. However, as shown in Figure 2.1, the application of the post-combustion amine-based capture technology in power plants is in the leading position and has entered the commercialization phase (TRL9). The pre-combustion and oxy-fuel technologies have also been deployed in power plants for carbon capture but are still in the demonstration phase (TRL7) (see Figure 2.1). According to Bui et al. [11], there are 17 commercial-scale CCS projects in operation around the world. SaskPower’s demonstration power plant with CCS, known as the Boundary Dam [50], is currently the largest commercial CCS project. In this project, the MEA-based chemical absorption technology is used and 1 MtCO2 can be captured per year. Another big CCS project in operation, which started in 2017 in United States, is Petra Nova [51]. Equipped with the chemical absorption technology as well, this project is able to capture 1.4 million metric tons of CO2 per year [11, 51]. In Germany, a pilot CO2-scrubbing plant at Niederaussem was commissioned as the first of its kind in 2009 [52]. Fluor and E.ON Kraftwerke (E.ON) cooperate in running a pilot-scale carbon capture plant in Wilhelmshaven, Germany [53, 54]. This plant started operation in 2012 and has captured 8000 tons of CO2 by June 2014 [55].
In the meantime, membrane-based CO2 separation technologies are drawing greater attention in recent years. We can see in Figure 2.1 that polymeric membranes have been used in power
2 Literature review and related work
7
plants for carbon capture on the pilot-scale. In the natural gas industry, the membrane-based technology has even been implemented in demo-scale plants. For the post-combustion route, there are two main pathways for recovering CO2 from flue gases using membranes. One concept is using non-dispersive porous membranes in gas-liquid contactors. In this system, flue gases pass on one side of membranes while, on the other side, amine solutions exist. The CO2 in the flue gas will go through the membrane and be absorbed by amines [19]. It is the amine solvent that determines the selectivity instead of the membrane. This pathway can be seen as an improvement to the traditional amine-based scrubbing process. The second concept is using gas permeation membranes. In this scheme, CO2 is separated from other components in flue gases by selective membranes and no amine solutions are involved [49, 56]. The CO2 permeability and selectivity are decided by the membrane properties.
Compared to other post-combustion technologies, the gas permeation membrane technology has less impact on the environment and simpler system design. Therefore, it is worth further exploring the potential of this technology.
2.1.3 Decarbonization in the iron & steel industry
In the iron and steel industry, efforts have long been made to increase the efficiency of the production process so as to decrease both costs and CO2 emissions. In addition, some modifications to the conventional production process have also been proposed and investigated in order to further decrease emissions.
One widely studied technology is called the top gas recycling blast furnace (TGRBF) first identified by the ULCOS program [57]. This technology injects nearly pure oxygen into the blast furnace so that the concentration of CO2 and CO will be increased in the blast furnace gas (BFG). A capture plant is implemented to separate CO2 and the remainder of the BFG will be sent back to the blast furnace. The CO can play as a reducing agent and thus significantly reduce the demand for coke [58]. Various capture processes have been proposed to separate CO2 from the BFG, such as amine scrubbing [57, 59], membrane [59], and pressure swing adsorption with cryogenic distillation [60, 61].
Another commercial production process that is able to largely reduce CO2 emissions is the direct reduced iron (DRI) process [58]. In this route, the iron ore reacts with H2 and CO and is reduced to iron. The reduced iron is delivered to the electric arc furnace (EAF) to produce steel. In the advanced DRI process, which is known as the Circored process [62], pure H2 is used as the reducing agent so that the CO2 emissions can be further mitigated. Other technological routes including the smelting reduction process and EAF in a mini mill are also capable of mitigating CO2 emissions [8, 43].
2.2 The MEA-based chemical absorption technology
As noted previously, the MEA-based chemical absorption, or amine scrubbing technology, is by far the most mature post-combustion CO2 capture technology. The amine scrubbing technology

2.2 The MEA-based chemical absorption technology
8
was invented by Bottoms [63] and first used in industry to separate CO2 from natural gas and hydrogen [21]. Then, it was first installed in 1991 for CO2 capture [64]. Currently, the scrubbing technology is widely used in the oil and gas industry as well as in providing CO2 for beverage production [65]. In 2009, Rochelle et al. [21] appealed to advance amine scrubbing technology in coal-fired power plants for CO2 capture.
2.2.1 Process, reaction, and modeling
Basic process description
Figure 2.2 displays a very flow diagram of the conventional amine scrubbing process. The flue gas is first cooled down by a scrubber and then enters the absorber at the bottom. The aqueous solution of the MEA goes into the absorber at the top and flows counter-currently to the flue gas stream. The CO2 in the flue gas then reacts exothermically with the MEA via direct contact of the two streams. As a result, some of the CO2 is transferred from the flue gas to the MEA solution to form chemical compounds such as carbamate. After this transfer, the amine solution is commonly called a ‘CO2-rich or ‘rich loading’ solution [66]. It then leaves the absorber at the bottom and is pumped up to the top of the stripper.
Figure 2.2 Schematic of amine scrubbing [1, p. 115]
In the stripper column, the CO2-rich solution moves downwards while a flow of steam ascends from the bottom of the stripper. This flow of steam generated in the reboiler is usually called the stripping steam [66]. With the thermal energy provided by the stripping steam, the weakly-bound CO2 is stripped off the amine solution, whereby a concentrated CO2 stream is formed and the MEA solution gradually regenerated. Driven by the ascending steam, the concentrated CO2 stream enters an overhead condenser where part of the water is condensed. The uncondensed

2 Literature review and related work
9
part of the concentrated CO2 stream is then sent to the CO2 compression unit. The reflux of the overhead condenser is directed back to the stripper. The MEA solution, from which the CO2 is stripped, then goes to the reboiler together with the condensed stripping steam. Part of the liquid in the reboiler is boiled to create the stripping steam while the regenerated MEA solution (CO2-lean solution [66]) is led back to the absorber, finishing the recycling. Some heat can be recovered from the CO2-lean solution before it enters the absorber by exchanging heat between the CO2-rich and -lean solutions in the rich-lean heat exchanger. The source of the thermal heat used to regenerate the MEA solution and produce the stripping steam usually comes from a flow of steam. To maintain the solution quality, additional equipment is needed such as filters, carbon beds, and thermally operated reclaimers, all of which are used to subdue the degradation and corrosion [1].
Essentially, both the absorber and stripper are gas-liquid contactors. To ensure sufficient contact surface, trays or packings (random or structured) are chosen to be installed inside the columns. For the CO2 chemical absorption, MacDowell et al. [67] argue that the structured packing is a better choice for it is commercially available, has a large surface area, and has a low-pressure drop along the height of the column.
Reaction
Generally, there are three reaction mechanisms proposed for the reaction between CO2 and MEA, or any primary amines[68]. The most commonly accepted one is the zwitterion mechanism [69, 70] and is widely used to explain the CO2 absorption into solvents. According to this mechanism, the primary amines first react with CO2 to form zwitterions which are then neutralized to form carbamate or bicarbonate. The overall reactions are presented below [68, 71]:
���� � � ��� ����� � ��� ������������� (2.1)
��� � � � �� � ����� � � ������������������ (2.2)
The ‘R’ stands for the organic functional group. For both reactions, the forward reaction is exothermic while the reverse reaction is endothermic. It can be seen that, in equilibrium, reaction 2.1 yields a CO2 loading of 0.5 mole CO2 per mole of amine, while reaction 2.2 has a loading of 1 mole CO2 per mole amine solvent. Hence, the formation of bicarbonate is beneficial to higher CO2 loading.
Modeling approaches to reactive distillation columns
With regard to the modeling of reactive distillation columns, two types of modeling approaches are normally used in Aspen Plus®: the equilibrium model and the rate-based model [72, 73]. The equilibrium model assumes that the gas-liquid reaction reaches equilibrium at each theoretical stage while the rate-based model assumes that the gas-liquid equilibrium occurs only at the interface of the two phases. Normally, the absorption/desorption process does not operate at equilibrium. Therefore, for the equilibrium model, the tray efficiency (tray column) or the height

2.2 The MEA-based chemical absorption technology
10
equivalent of a theoretical plate (HETP, pack column) is used for corrections. By contrast, the rate-based model is a rigorous model and thus, in theory, reflects reactions inside columns more precisely.
Some papers have been published on the comparison of the two models. Peng et al [74] compared the two models for packed reactive distillation columns for the production of tertamylmethylether (TAME). They found that the results of both models agree well with experimental data. However, the rate-based model is much more difficult to converge for simulation [74]. Abu Zahra et al. [73] also carried out a comparison study for the two modeling approaches for CO2 capture simulation. Their work indicates that no major differences are found in predicting the energy consumption of the overall process but the rate-based model is more accurate in predicting the columns’ temperature profiles and mass transfer [73]. Zhang et al. [75] used the second generation rate-based model of distillation to simulate the CO2 capture process and found that the model is superior to the traditional equilibrium model.
To sum up, the rate-based reactive distillation column better represents the real distillation process and thus is a more accurate model in predicting the operation of a system. Therefore, it is selected as the modeling approach for the present study.
Two film theory
Unlike the equilibrium modeling approach, which assumes that the gas and liquid are well mixed, the mass and heat transfer must be considered in the rate-based modeling. Since the detailed velocity profile near the interface of the two phases is yet known, there exist several theories to describe the mass transfer [76]. The two-film theory, proposed by Lewis and Whitman [77], is a common conceptualization method to explain the mass transfer between the two phases. The two-film model is often used for the rate-based modeling of reactive distillation [78]. This model postulates that a stagnant film of each phase exists near the interface. The molecular diffusion dominates the mass transfer inside the film. Therefore, the transport through the film can be described by Fick’s first law [79]. According to this theory, the mass transfer through the film is in equilibrium while beyond the film the concentration is homogeneous.
Calculation of the reboiler duty
The reboiler duty refers to the thermal energy required to regenerate the amine solvent in the reboiler. This is a major indicator for the evaluation of a chemical absorption system. The overall mass-specific reboiler duty qreb can be perceived as a combination of three parts [66, 80] as follows:
qreb = qsens + qvap,H2O + qabs,CO2 (2.3)
, where qsens stands for the sensible heat to increase the temperature of the solution at the stripper inlet, qvap,H2O is the heat to generate stripping steam, and qabs, CO2 is the heat to strip CO2 from the amine solution in the stripper.

2 Literature review and related work
11
qsens can be estimated by the equation:
(2.4)
where Δα is the CO2 loading difference between the outlet and inlet of the absorber.
qvap, H2O can be estimated by:
(2.5)
where pH2O / pCO2 is the partial pressure ratio of water vapor to CO2 at the top of the stripper.
qabs, CO2 can be estimated by:
. (2.6)
As stressed by Oexmann et al [66, 81], these three parts are actually not independent of each but instead mutually connected. In fact, the entire reboiler heat duty comes from the stripping steam. This division simply offers a mathematical method to estimate the reboiler heat duty and analyze the influences of those parameters in Equations 2.4 to 2.6.
2.2.2 Directions for improving the amine scrubbing technology
As mentioned above, the CO2 chemical absorption is an energy-intensive technology. It is reported that the regeneration of MEA consumes 3.6 – 4.0 GJ/tCO2 for CO2 capture from coal-fired power plants [11, 23, 82, 83]. This is one of the main reasons why this technology has not been widely equipped to deal with CO2 emissions. Naturally, efforts have been made to reduce the energy consumption of this technology. These efforts have been made in three major directions: 1) development of novel solvents, 2) optimizing operating parameters, and 3) process modification.
Solvents
For CO2 capture, the solvent plays an undoubtedly important role. Its features, including the absorption capacity of CO2, absorption rate, heat absorption, and degradation, significantly impact the CO2 capture process. It is known that amines are compounds and functional groups that contain a basic nitrogen atom. Essentially, amines can be divided into three types: 1) primary amine, 2) secondary amine, and 3) tertiary amine.
The MEA, which is the most extended solvent for CO2 capture [84], belongs to the category of primary amine. Meanwhile, other types of amines are also being paid much attention to in order to reduce the energy consumption of this technology. For instance, Oexmann [66] did a thorough study in his doctoral thesis the characteristics and performances of various candidate
p,L reb feed,strip solsens
CO2 amine
C (T -T ) M 1qΔα M x
,�
H2Ovap,H2O vap,H2O
CO2 CO2strip,top
p 1q Δhp M
,� �
� � ��
abs,CO2abs,CO2
CO2
Δhq
M�

2.2 The MEA-based chemical absorption technology
12
solvents for CO2 capture. In his thesis, the inherent properties of each type of amine are summarized as displayed in Table 2.1.
Oexmann [66] has concluded that MEA shows a high reaction rate with CO2 but a high energy demand for regeneration. Secondary and tertiary amines generally have higher CO2 capacities and lower degradation tendency compared with primary amines but their reaction rates with CO2 are significantly lower.
Table 2.1 Evaluation of solvent properties [66, p. 14]
Heat of absorption Absorption rate CO2 capacity Degradation
tendency
Primary amine high high medium high
Secondary amine high medium medium medium
Tertiary amine medium low high low
In recent years, Piperazine (PZ) has been appearing to be a promising solvent. Dugas [85] has noted that 8 m PZ exhibits a 70 % higher CO2 capacity than 7 m MEA. In addition, due to the fact that each type of amine has some undesired characteristics, blends of multiple amines are drawing a lot of attention so as to overcome these characteristics. For instance, Rochelle and his colleagues [86] have tested the performances of some advanced amines by mixing MEA with MDEA and MDEA with PZ, respectively, for CO2 capture from a 500 MWe coal-fired power plant. It is found that both mixtures lead to lower cost of electricity and the cost of CO2 avoided than MEA. Nwaoha et al [87] used a triple-solvents blend (Aminomethylpropanol (AMP)-PZ-MEA) in chemical absorption for CO2 capture and found that the heat duty is significantly lower than MEA.
Despite the promising novel solvents mentioned above, MEA is still chosen as the simulated solvent in this thesis. This is because, on the one hand, there is sufficient published data concerning this solvent. On the other hand, this study is focused on process design and costing of process instead of developing novel scrubbing solvent.
Optimizing the operating parameters
For the MEA-based capture system, some operating parameters, including the CO2 concentration in flue gas, CO2 lean loading (CO2 loading in CO2-lean solution), MEA concentration, and pressure in the reboiler, etc., have been recognized to be able to affect the regeneration energy [80, 82, 88]. It has been found out that the CO2 lean loading has an optimal value for CO2 capture for a specific operation. As introduced above, the reboiler heat duty consists of three parts (qsens, qvap,H2O, qabs,CO2). At low CO2 lean loadings, the generation of the stripping steam (qvap,H2O) is central to the thermal energy requirement while, at high loadings, the heat duty for heating up the solvent at the inlet of the stripper (qsens) predominates [80].

2 Literature review and related work
13
Therefore, given a certain boundary condition, a CO2 loading leading to the minimum reboiler duty is expected. Different optimal values were obtained in different studies though.
It is shown that a higher solvent concentration can also result in less energy consumption [88]. However, problems such as erosion and solvent degradation will come along with increased solvent concentration. Additionally, increasing the pressure in the reboiler will result in a decrease in the regeneration energy. Nevertheless, maintaining a higher pressure inevitably requires more auxiliary power. Abu-Zahra et al. [82] believe that a reduction of about 20 % of the thermal energy consumption is achievable by optimizing the operating parameters.
Process modification
Modifying the process based on the conventional design of amine scrubbing is also a way of reducing energy consumption. For instance, Jung et al. [28] have developed an advanced MEA-based CO2 capture process by splitting flows and utilizing a phase separation heat exchanger. Sanpasertparnich et al. [27] improved the CO2 absorption process by implementing intercoolers along the height of the absorber.
Moullec et al. [89] conducted a comprehensive review of 20 elementary modifications published in literature and patents. The authors concluded that these modifications can be classified into three categories based on their effects on the process, namely: 1) absorption enhancement; 2) heat integration; 3) heat pumps. The basic concept of ‘absorption enhancement’ is to increase CO2 loading in the rich-loading solution at the bottom of the absorber. A higher CO2 rich-loading means the solvent is able to have a higher CO2 capacity and thus results in a reduced solvent flowrate and the sensible heat. The general idea of ‘heat integration’ is to establish heat transfers between streams so that waste heat can be partially recovered and thereby reboiler duty can be reduced. Finally, the ‘heat pump’ modification is intended to increase heat quality by sacrificing more mechanical work. Under each category of modifications, several sub-classes of modification are clearly illustrated and discussed. Moreover, some of these process modifications can be combined to enable further optimization.
In all 20 cases of modification, MEA is regarded as the reference solvent, but how these modifications affect energetic performances of the chemical absorption process are influenced by what kind of solvents are used. One example given in this paper is that intercooled absorber (ICA) has little effect on MEA whereas it can reduce reboiler duty by 7% for a mixture of AMP and PZ [89]. It has also been asserted by authors that these modifications will inevitably increase the capital cost and overall complexity. Given the possible consequences of the modifications, which of these modifications should be adopted in practice is subject to specific conditions. What should also be noted here is that most of these modifications have been assessed via modeling work, but only a few have been validated by experimental results at the appropriate scale.

2.2 The MEA-based chemical absorption technology
14
2.2.3 Integration of the MEA system into steam turbines
As described in Section 2.2.1, the amine scrubbing system requires a steam supply for solvent regeneration. In coal-fired power plants, the optimum source of steam is the onsite steam/water cycle. According to a report of IEAGHG [90, p. 23], this solution leads to the best thermodynamic performance. Besides, that building an additional CHP to provide steam is also an option. In doing so, an excess of electricity is also available. This solution is very often seen in the MEA-based capture system applied in the iron & steel industry [43, 58]. In addition, Singh et al. [91] have proposed to build a new natural gas boiler to generate steam. Nevertheless, additional investments and space constraints must be taken into account for the addition of a boiler.
In simulating the amine scrubbing system in Aspen Plus®, the thermal energy consumption (i.e. the reboiler heat duty) of the system can be calculated. However, in some situations (e.g. in power plants), it is more straightforward to evaluate the performances of systems with electricity consumption. Thus, the conversion of the thermal energy consumption of the capture system to the electric energy consumption is demanded. Some researchers did this conversion by using empirical equations [92, 93]. These equations, however, lead to a certain degree of uncertainty and inaccuracy. Hence, more rigorous approaches (e.g. modeling of the water-steam cycle) have been more often used in recent years to reflect the integration process more accurately [66, 81, 94].
Steam extraction
In the past decade, many studies have reported on the integration of the MEA system into both existing and green-field coal-fired power plants [37, 90, 95, 96]. The integration into green-field is generally considered to be more technically and economically efficient for that the steam turbines can be designed to be able to provide steam precisely fit for the solvent regeneration. This kind of turbine is often referred to as carbon capture ready (CCR) turbines [90]. On the contrary, the integration into steam turbines that are not CCR will inevitably intervene in the default operating conditions and thus modifications are needed. As stated in the IEA report [95], the integration of PCC into green-field power plants has been extensively investigated. However, the lessons learned in these studies are likely to be impractical for the existing coal-fired power plant fleet. Therefore, retrofitting the CO2 capture system into existing power plants is recently drawing more attention.
Alie [97] analyzed the potential steam extraction locations in detail for existing coal-fired power plants and concludes that the IP/LP crossover pipe is the most suitable site in spite of the fact that the temperature and pressure are not 100 % matching the required steam for the solvent regeneration. This conclusion is in line with the analyses of Gibbins et al. [98] and Oexmann [66]. Although the integration approaches are in essence plant-specific, it has been a ‘consensus’ that IP/LP crossover pipe is the optimum option for steam extraction in most power plants by many other researchers [37, 39, 94, 96, 99, 100, 101].

2 Literature review and related work
15
Modifications to steam turbines for steam extraction
As mentioned above, the properties of the steam extracted in Alie’s study [97] are not perfectly fit for solvent regeneration in the reboiler. Actually, this situation occurs in most other relevant studies. Hence, different kinds of modifications to the steam turbines have been proposed.
Throttles and desuperheaters are normally used to control the pressure and temperature of the extracted steam. A let-down turbine is also suggested to be added when the pressure of the extracted steam is higher than in the reboiler [37]. In this way, both the temperature and pressure can be reduced to the desired conditions while producing extra electricity. Nevertheless, Romeo et al. [102] argue that the addition of a gas let-down turbine is effective to reduce the efficiency penalty but would increase the CO2 capture cost and reduce the amount of CO2 avoided.
Particularly, Lucquiaud and Gibbins [65] have made a summary of possible modifications to steam turbines to make them ready for carbon capture. They have provided 3 options and the detailed description for each design is as follows [65]:
� Clutched LP turbine: The flow rate of the feed steam to the reboiler equals the flow rate of one of the LP turbines. Therefore, this LP turbine would be shut down when the CO2 capture system is in operation and leaves other parts of the steam turbines uninfluenced. Nevertheless, this design is not flexible once the required amount of steam has changed.
� Throttled LP turbine: This design is more flexible compared with the clutched LP turbine. One control valve is placed at the inlet of the LP turbine to maintain the pressure at the crossover pipe at the desired value. The drawback of this design is that energy loss is unavoidable over the throttle.
� Floating IP/LP crossover pressure: In this configuration, the pressure at the crossover pipe is set to drop to the exact required value when steam is extracted. Additional throttles are also needed to adjust the pressure of the extracted steam when it deviates from the set value on the crossover pipe. Furthermore, the IP turbine must be modified to be capable of standing varied backpressure.
Waste heat integration
The integration of the CO2 capture system into steam turbines not only involves the integration of the steam but also the integration of the waste heat. In the overall CCS process, considerable waste heat will be generated in both the CO2 capture and compression sections at many locations. Hence, the utilization of the waste heat is essential to minimizing the negative impacts of CCS technologies.
Pfaff et al. [94] suggest that the waste heat rejected in the intercoolers of the CO2 compression train and overhead condenser of the stripper can be used to preheat the feed water in the water-steam cycle. Consequently, the efficiency of the overall process can increase. They also

2.3 Literature review of the application of the MEA-based chemical absorption technology
16
investigated the possibility of preheating combustion air by using waste heat. In this case, the efficiency can increase by as much as 0.52 %-pts. Cifre et al.[100] also performed the simulation for recovering discharged heat from the intercoolers in the compression train. Their modifications lead to an increase of plant efficiency by 0.1 %-pts and elimination of two low-pressure preheaters.
Hanak et al. [103] and Harkin et al. [104] used pinch analysis to study heat integration in power plants equipped with CCS. They simulated both the MEA-based systems and coal-fired power plants, as well as the integration, in Aspen Plus®. Hanak et al. [103] used Aspen Energy Analyzer (AEA) to perform pinch analysis for the integrated system. They found that the waste heat from the flue gas and capture process can be utilized for preheating the feedwater [103]. Harkin et al. [104] also integrated CCS with a coal pre-drying system. Leng et al. [105] also used pinch analysis to optimize the heat exchanger network (HEN) for a 600MWe power plant with a solvent-based capture unit. As a result, the energy penalty entailed by the capture unit is reduced by 5.3 %-pts and the demand for cooling water is reduced by 55 % [105].
2.3 Literature review of the application of the MEA-based chemical absorption technology
2.3.1 MEA system in coal-fired power plants
Concerning the application of the MEA chemical absorption technology, a great deal of research nowadays concentrate on the impacts of the integration of the technology into existing coal-fired power plants [66, 88, 101]. Also, energetic and economic evaluations can be found in various sources of literature [106, 107].
Roeder and Kather [108] used EBSILON® Professional to produce a model for a 600 MWe coal-fired power plant and Aspen Plus® to simulate an MEA-based chemical absorption process, respectively. They then investigated the influences of the CO2 capture system on this reference power plant under different loads. It was found that the efficiency penalty of the power plant with 90 % of CO2 captured increases from 10.7 % to 11.4 %-pts as the load decreases from 100 % to 40%. In addition, decreasing the CO2 capture rate from 90 % to 75 % recovers 5 % of total power use.
Oexmann [66] manages to simulate interactions between power plants and chemical absorption processes by developing his own semi-empirical model for chemical absorption in EBSILON®
Professional. His model was validated against experimental results from a pilot plant and proven to be able to very well represent the actual function of chemical absorption. This semi-empirical model was integrated into a power plant with a gross output of 1137 MW to investigate the impacts of the overall CO2 capture process. According to his simulation, the reboiler duty of the MEA system is 3.58 GJ/tCO2 and the net efficiency penalty 10.36 %-pts.
Also, Ramezan et al. [37] present a wide-ranging study performed to evaluate the technical and economic feasibility of integrating amine-based CO2 capture technology into an existing coal-

2 Literature review and related work
17
fired power plant (450 MW output). Different cases with varying CO2 capture rates (96 %, 90 %, 70 %, 50 % and 30 %) were tested. Their results show that the net efficiency penalty is 10.5 %-pts when 90 % of CO2 is mitigated. This report also suggests that a positive correlation exists between the CO2 capture rate and total investment cost.
Cifre et al [100] simulated coal-fired power plants in EBSILON® Professional and the chemical absorption process using MEA in CHEMASIM. C++ codes were developed by the authors to couple these two models in different simulation tools. Two reference coal-fired power plants, a 600MW hard coal, and a 1000 MW lignite power plant, were studied in this paper for CO2 capture. As a result, the efficiency losses caused by CO2 capture and compression are 14 and 16 %-pts for the two power plants, respectively.
Many researchers have also conducted cost evaluations for the MEA system in power plants. Similarly, the cost estimates are more or less based on some assumptions or predictions, such as fuel price, discount rate, operating time, etc. Some economic results for the MEA system in power plants are shown below in Table 2.2
Table 2.2 Published technical and economic results of the MEA system in power plants
Source Abu-Zahra
et al. [82, 109]
NZEC [110]
Dave et al. [111]
Rao et al. [38]
IEA [112]
Li et al. [113]
Dave et al. [111]
Year of cost data 2004 2009 2010 2000 2010 2013 2010
Region EU China China US OECD US Australia
Currency € RMB RMB US$ US$ US$ AU$
Capture rate [%] 90 90 90 90 90 85 90
Gross output [MWe] 600 600 600 500 Average 650 600
Efficiency penalty [%-pts]
14 12.4 12.1 - - 10.6 10.7
LCOE w/o CCS [currency/MWh]
31.4 271 - 49 66 71.9 -
LCOE w/ CCS [currency/MWh]
57.4 512 - 97 107 130.8 -
Cost of CO2 avoided [currency/tCO2]
39.3 326.2 203 59.1 58 86.4 91.3
It can be seen from Table 2.2 that, with the capture rate fixed at around 90 %, the efficiency losses caused by the MEA system are all estimated to be more than 10 %-pts by different studies. Additionally, the cost data are reported for different regions and thus presented in

2.3 Literature review of the application of the MEA-based chemical absorption technology
18
different currencies on the basis of varied years. Therefore, the published cost data must be updated in order to be compared with the results obtained in the present study.
2.3.2 MEA system in the iron & steel industry
Reducing CO2 emissions in the iron and steel industry by using the MEA system has also been investigated by some researchers. Arasto et al. [42] performed case studies for applying MEA-based chemical absorption system (90% capture rate) at an integrated steel mill (Ruukki Metals Ltd.’s Raahe steel mill). The plant, situated on the coast of the Gulf of Bothnia, produces 2.6 million tons’ hot metal and emits approximately 4 million tons of CO2 every year. In this study, Aspen Plus® was used to model the carbon capture processes. CO2 is captured from two sources: power plant and hot stove, CO2 from which accounts for about 70 % of total emissions. According to their results, approximately 50-75% of the emission from the site can be captured using post-combustion capture. However, achieving higher percentages of CO2 avoidance is technically less feasible [42]. The total energy consumption of CCS is estimated to be 0.41 MJ/kg CO2 captured. Besides, the electricity generation decreases from 1200 to 730 GWh/yr due to the implementation of the MEA system.
As a sequel to the work of Arasto et al. [42], Tsupari et al. [114] studied the economic feasibility of post-combustion capture of CO2 for the same integrated steel mill described above with the same system boundary. In this study, the economic appraisals for five different cases with the MEA system are compared with the reference case without CO2 capture under the assumption that the CO2 allowance and electricity prices are 50 $/tCO2 and 80 $/MWh, respectively. According to their results, capturing 2.89 million tons CO2 per year would increase the annual cost of the whole steel plant by 77 million dollars [114].
Ho et al. [43] have compared the MEA capture costs for CO2 capture from industrial sources in Australia. In their schemes, gas pre-treatment units, CO2 capture unit, and CO2 compression unit are all considered. It is shown by their results that 2.75 million tons of CO2 when an MEA system is equipped to capture CO2 from the blast furnace gas in an iron & steel plant. In terms of economics, the cost of CO2 avoided is 68 US$/tCO2 [43]. It is also reported in one of their following studies that the cost of CO2 avoided entailed by the MEA system applied at iron and steel mills ranges from 80 to over 200 AU$/tCO2 for various sources of emissions [58, 115].
IEA Greenhouse Gas (IEAGHG) R&D Program published a report on the techno-economics of deploying CO2 capture technologies in a typical integrated steel mill in Western Europe. This conceptual steel mill has a production of 4 million tons of hot rolled coil (HRC) every year [116]. The techno-economic analysis was carried out in three cases:
� Case 1 (base case): An integrated steel mill without CCS; � Case 2: Deployment of the MEA system in two sub-cases.
� EOP-L1: CO2 capture from the hot stove and steam generation plant; � EOP-L2: CO2 capture from the steam generation plant, hot stove, coke oven, and
lime production units;

2 Literature review and related work
19
� Case 3: Oxygen blast furnace (OBF) with top gas recycle combined with MDEA-based chemical absorption (TGRBF).
In the base case (case 1), the specific energy consumption for production is 21.27 GJ/t HRC. With the MEA system deployed, the energy consumption rises from 21.27 to 24.64 GJ/tHRC in the case of EOP-L1 and to 25.94 GJ/tHRC in EOP-L2. Concerning the economic analysis, the CO2 avoidance costs are 73.6 US$/tCO2 and 81.2 US$/t CO2 for the EOP-L1 and EOP-L2 cases, respectively [116, p. 7].
2.4 Gas permeation membrane technology
2.4.1 Membrane material
A variety of gas permeation membranes exist in terms of materials. In general, three types of CO2 selective membranes are being widely investigated [32, 35, 36]: ceramic (inorganic), polymeric (organic), and hybrid (mixed matrix) membranes. Figure 2.3 illustrates a general classification of the current existing membranes.
Figure 2.3 Classification of membrane materials for CO2 separation [36, 117, 118]
Ceramic membranes refer to porous inorganic membranes. This type of membrane is produced by putting a porous thin top layer on a ceramic support [36, p. 9]. The top layer material can be silicon carbide, carbon, zeolite, and so on. In fact, there exists a second type of inorganic membranes: dense inorganic membranes. The main difference is dense inorganic membranes consist of thin layers of metal [36, p. 10]. This type of inorganic membrane has so far been less studied for CO2 separation compared with ceramic membranes.
As shown in Figure 2.3, the polymeric membrane can be further divided into two basic types: rubbery and glassy [119]. Shekhawat et al. [36, p. 10] reported that all industrial membrane-based gas separation processes use glassy membranes due to their high selectivity and good mechanical strength. In comparison, rubbery membranes have ‘low chain intersegmental

2.4 Gas permeation membrane technology
20
mobility and long relaxation times’ [36, p. 10]. In recent years, block copolymers containing both glassy and rubbery components have been produced in the attempt to take advantage of both components. There are already some commercially available copolymer membranes such as PolarisTM [19], Pebax® [120] and Polyactive® [121]. In addition, a special kind of polymeric membrane called facilitated transport membrane [122] is often discussed independently of other polymeric membranes as its transport mechanism is distinct.
The mixed matrix membrane is a relatively new type of membrane material, which is fundamentally a combination of inorganic and organic materials so that the advantages of both materials can be taken. One example is incorporating zeolites in Pebax®, on which both increased selectivity and permeability have been observed. The fabrication of this kind of membrane requires excellent organic-inorganic interfacial adhesion [118, p. 83].
Ramasubramanian and Ho [123] have reviewed membranes that can be used for CO2 separation and analyzed their pros and cons. Polymeric membranes are usually operated at low temperatures and possess better thermal stability and mechanical strength compared to ceramic membranes. In addition, polymeric membranes are easier to manufacture with a large surface area. Although facilitated transport membranes demonstrate comparatively high selectivity and permeability, their permeances which are dependent on membrane thickness and reliability still need to be further improved [123]. Ramasubramanian and Ho [123] also suggest that ceramic membranes, including silica and zeolite, give a better permeability-selectivity trade-off. However, fabricating defect-free layers on ceramic membranes with large surface areas is much more difficult than on polymeric membranes.
In industrial-scale carbon capture projects, large flow rates of flue gases are usually to be dealt with. Given the upper bound of the current membrane properties [34, 124], a large-area membrane is required for carbon capture in industrial-scale plants [31, 125]. On account of this situation, the polymeric membranes are considered by many researchers as the proper material to be used for carbon capture [31, 35, 126, 127].
2.4.2 Transport mechanisms of gas permeation membranes
Solution-diffusion
The solution-diffusion mechanism is most used to describe the gas transport mechanism on polymeric membranes. The permeability of the polymeric membrane is dependent on the membrane properties, permeant properties, and the interaction between membranes and permeants [36, p. 6]. As reported, the first two of the abovementioned factors (membrane and permeant properties) determine the diffusivity of a gas through a certain membrane while the last factor decides the solubility of the gas [36].
In principle, the permeability P of a permeant through a membrane is the product of the solubility S and diffusivity D:
P = S ▪ D (2.7)

2 Literature review and related work
21
In gas mixtures, the selectivity (β) of component i relative to component j is calculated by:
βi/j = Pi / Pj = (Si/Sj) ▪ (Di/Dj) (2.8)
Knudsen diffusion and molecular sieving
The Knudsen diffusion is observed on inorganic membranes or dense polymeric membranes [118, p. 71]. The Knudsen diffusion happens when the pore diameters of the membrane layer are smaller than the mean free path dimensions of the gas species. As to the molecular sieving mechanism, it happens when the pore size on the membrane is comparable to the diameters of gas molecules [118, p. 72]. Gas species are filtered based on the sizes of molecules (size exclusion), i.e. molecules larger than the pore channel of membranes cannot pass through.
Facilitated transport
The facilitated transport membranes involve a reversible complex reaction in addition to the solution-diffusion mechanism [36, 123]. Carrier agents, such as amines, exist in the facilitated transport membranes. These agents react with gas species to form complexes on one side of membranes. The formed complexes then diffuse through membranes and release the gas species on the other side while the carrier agents are recovered [36, p. 69].
2.4.3 Membrane module for polymeric membranes
Apart from the membrane material, the configuration of the membrane module is another important influencing factor for CO2 separation. The membrane module refers to a unit comprised of membranes, a housing, feed inlet and permeate outlet. Several variables must be taken into account for the configuration of a membrane module: pressure drop, heat transfer, concentration polarization, etc. [118].
In general, three kinds of module configurations are currently used as membrane containers: 1) spiral wound [118, 128, 129] 2) hollow fiber [118, 130], and 3) envelope [118, 131]. Naturally, the modules decide the forms into which membraned are produced. An important indicator to evaluate membrane modules is the packing density, which equates to the surface area of membrane per volume inside the module. A typical spiral wound type module is produced by Synder Filtration [128]. The packing density for this type of module is in the range of 100-400 m2/m3 [131]. The hollow fiber module generally has the highest packing density (up to 30000 m2/m3 [132]). Usually, a cylindrical vessel is used to be filled with bundled strands of hollow fibers. In the envelope type module, the envelopes or discs are stacked layer on layer with a permeate pipe through the centers. In this configuration, several layers of the membrane are wrapped around an axial collection pipe, with the packing density usually within the range of 300-1000 m2/m3 [132]. For both the spiral wound and envelope modules, spacers are placed between every two membrane layers to create space for feed gas.
Luhr [117] summarizes not only packing densities, but also other important traits for different membrane modules in his doctoral thesis. Part of his summary is listed in Table 2.3. In terms of

2.4 Gas permeation membrane technology
22
the cost and the packing density, hollow fiber has advantages over the other two types. However, fibers can easily be blocked by particulate matters and thus must be completely replaced. This leads to inconvenient implementation in power or industrial plants, where the flue gases usually contain ashes.
Table 2.3 Comparison of membrane modules, adapted from Luhr’s work [117, p. 19]
Module type Spiral-wound Envelope Hollow fiber
Packing density (m2/m3) <1000 200-500 <10,000
Pressure drop High in long
permeate path Moderate High in the fibers
Cleaning possibility Hard Medium Chemical washing or replaced
Manufacturing Easy and cheap Easy Cheap
Cost (€/m2) 8-37 40-150 2-8
2.4.4 System design for the gas permeation membrane
The single-stage membrane separation process
Figure 2.4 illustrates a basic CO2 capture process using the gas permeation membrane. Prior to the membrane module, a wet scrubber is often used to cool down the flue gas to the optimal operating temperature of the membrane. Inside the membrane module, a fraction of CO2 permeates through the membrane and a stream (permeate gas) with a higher CO2 concentration is gained on the permeate side. Then, the CO2 stripped stream, which is referred to as retentate gas, is exhausted to the atmosphere. The partial pressure of CO2 in the flue gas is usually very small, so compressors, or vacuum pumps, or both are often used to increase the driving force for CO2.
Figure 2.4 Schematic of a single-stage membrane CO2 separation process [133].

2 Literature review and related work
23
Compared to the chemical absorption process, the membrane separation process is apparently simpler and contains fewer components. The main consumers of energy are the compressors and vacuum pumps. However, A single-stage membrane system, with the current membrane properties, has been found unable to yield the desired CO2 stream [5]. As is reported [5, 34, 124, 133], a trade-off between the permeability and selectivity of CO2 is observed on the state-of-the-art membranes. As a result of the trade-off, it is very hard to get a CO2 stream with a high degree of CO2 separation and high purity CO2 simultaneously. Moreover, in order to get a high degree of CO2 separation from flue gases from industrial-scale facilities, very large membrane areas are required. Hence, advanced process designs are needed to improve performance.
The cascaded membrane separation process
Cascaded membrane system refers to a design in which multiple stages of membranes are connected in series to enhance CO2 separation. Figure 2.5 illustrates a two-stage membrane system for CO2 separation designed by Zhao et al. [31]. The permeate gas from the first stage is compressed and then directed to the second stage to be further separated. In this scheme, the retentate stream from the second stage is recirculated to the feed side of the first stage membrane in order to increase the CO2 concentration in the feed gas. An expander is also often placed downstream of the second stage membrane on the retentate side to recover some energy from the compressed gas.
Figure 2.5 Schematic of a two-stage membrane system [31]
A multi-stage system cannot change the fact that the CO2 partial pressure difference in flue gases is usually very small, so compressors or vacuum pumps are still needed to increase the driving force. Ho et al. [134] have compared the effects of these two strategies for increasing driving forces. They found that the vacuum pump strategy results in a larger membrane area but saves 35 % of total capture costs. In addition, a two-step vacuum design is utilized so that lower energy requirements can be met while enough driving forces are still guaranteed [134]. Similarly, Lin et al. [135] and Merkel et al. [5] reported that a two-stage vacuum pump system consumes less energy than a compressor but a larger membrane area is unavoidable. Compared with the single-stage membrane, a multi-stage membrane system is capable of simultaneously achieving a high degree of CO2 separation and CO2 purity. It has been reported that two-stage systems can capture 90 % of CO2 and a CO2 purity of 95 % in the permeate stream is achievable [5, 31]. Casale [136] has also investigated three-stage membrane systems for CO2 capture and found that the three-stage systems show no improvements in terms of saving energy and decreasing membrane areas as compared to two-stage membrane systems.

2.4 Gas permeation membrane technology
24
The cascaded membrane with sweep gases
The use of sweep gas on the permeate side is another approach to increasing the driving force for CO2 permeation. [137]. An advanced two-stage membrane separation system with sweep gas is displayed in Figure 2.6. The sweep gas (air) enters the second-stage membrane module on the permeate side, forming a counter flow with the stream on the feed side. The CO2 that accumulates on the permeate side is then carried away by the sweep gas, which leads to the increase of CO2 partial pressure difference.
Mixing air with the permeate gas would inevitably dilute the CO2 concentration. Therefore, it is unfeasible to further separate CO2 from the mixed gas. In this scheme, the mixed stream is recycled to the boiler and the flue gas with a higher CO2 concentration can be obtained. Merkel et al. [5] have compared two-stage membrane systems with and without sweep gas for CO2 capture for a 600 MW coal-fired power plant. The results show that the use of sweep gas reduces not only the membrane area but also the total power use.
Figure 2.6 Flow diagram of a two-stage membrane system with sweep gas [5]

2 Literature review and related work
25
2.5 Literature review of the application of the gas permeation membrane technology
2.5.1 Post-combustion membrane-based separation processes in power plants
The tests of CO2 separation using gas permeation membranes have mostly been conducted on lab-scale. As of now, no pilot-scale or industrial-scale implementation of gas permeation membrane for post-combustion CO2 capture has been reported. Simulation thus far is the primary method for predicting the performance of the membrane-based separation processes. Moreover, research of CO2 separation using membrane-based technology focuses the application mainly on power plants.
Zhao et al. [31, 138] used PRO/ǁ to simulate multi-stage membrane separation systems for a 600MW reference power plant. Both energetic and economic analyses were performed and the results are compared with the MEA-based chemical absorption process. Their cascaded membrane system was tested under three different CO2 capture rates: 50%, 70%, and 90%. The unit price of the membrane used for the cost estimation is 50 €/m2. It is concluded in their paper that only under a separation degree of 50% and 70 % will this system be attractive in terms of energy consumption and costs [31]. It is also important to note that the exhaust gas in their approach only consists of CO2 and N2. The influences of other gases, such as O2 and H2O, are not investigated. Low et al. [32] found that the existence of water vapor has a small positive sweep effect which can enhance CO2/N2 separation.
Instead of studying the CO2 capture process in isolation, Zhai and Rubin [139] simulated a complete system that contains a power plant equipped with CCS via the Integrated environmental control model (IECM). They tested the performances of both single- and multi-stage membrane systems. Types of coals (bituminous, sub-bituminous and lignite) and power plants (subcritical, supercritical and ultra-supercritical) are also considered important influencing factors. It is concluded from the paper that efforts to produce highly permeable membranes are more economical than increasing CO2/N2 selectivity.
Maas et al. [140] also estimated the energetic and economic results for a membrane-based separation process for CO2 capture. Being operational under 25 °C, the cascaded membrane system designed by the authors reaches the lowest energy consumption. One important conclusion drawn from their research is that the CO2 allowance must exceed 37 €/tCO2 to make membrane-based separation technology economically feasible.
Roussanly et al [141] used a numerical model to assess the technical and cost performances of 1600 sets of membrane properties for carbon capture from a coal power plant. Furthermore, they compared the performances of the membranes to the reference MEA-based capture process. It is found by them that the minimum permeance and selectivity of the membrane are

2.5 Literature review of the application of the gas permeation membrane technology
26
3 Nm3m-2h-1bar-1 and 65, respectively, to render the membrane technology as competitive as the MEA technology [141].
Some technical and economic estimates from the aforementioned studies are summarized in Table 2.4. Comparing the results with that of the MEA system (see Table 2.2), we can find that the membrane-based CO2 separation processes do not show advantages over the MEA technology at the capture rate of 90 % in terms of energy consumption and costs. The fact that large membrane areas and mechanical work are needed makes gas permeation membrane technology less competitive than initially expected. In general, the membrane properties are still the key factors that constrain the application of the gas permeation membrane. What should be noted is that Zhao et al. [31] argued that, at CO2 capture rate of 70 %, their multi-stage membrane system causes less efficiency penalty on power plants than the MEA system. Nevertheless, they did not compare the costs.
Table 2.4 Published technical and economic evaluation of the membrane-based CO2 separation process
Source NETL [142]
Maas et al. [140]
Zhai et al. [139]
Zhao et al. [31]
Roussanaly et al. [33]
Capture system Cascaded membrane
Year of cost data 2010 2013 2010 2009 2008
Region US EU US EU
Currency US$ € US$ € € Permeance of
membrane [Nm3m-2h-1bar-1]
1000gpu* 3 1000gpu* 3 3
Capture rate [%] 90 90 90 90 90
Net output w/o CCS [MWe]
550 555.5 550
754
Efficiency penalty [%-pts]
12.7 9.6 12.5 9.8
-
LCOE w/o CCS [currency/MWh]
59.4 57.7 61.5 -
59
LCOE w/ CCS [currency/MWh]
117 85.9 118 -
94
Cost of CO2 captured [€/tCO2]
- - 46.8 31
-
Cost of CO2 avoided [€/tCO2]
83 44.7 80 -
53
2 Literature review and related work
27
*1gpu = 2.74x10⁻³ Nm3m-2h-1bar-1 [143]
2.5.2 Post-combustion membrane-based processes in the iron & steel industry
Chung et al. [59] investigated the scenario in which the membrane separation is used to capture CO2 from the blast furnace gas in the TGRBR technology. They simulated a three-stage membrane separation system using the MTR Polaris membrane in MATLAB. As a result, they found that the CO2 avoidance cost by using membrane separation is 34.4 US$/tCO2 compared to 40.6 US$/tCO2 with a PZ-based amine scrubbing system. In particular, a hybrid amine scrubbing/membrane system with heat recovery developed by the authors shows the best cost performance, resulting in a CO2 avoidance cost of 30.4 US$/tCO2 [59]. Their cost results are based on the year of 2015.
Lie et al. [144] evaluated three types of membrane experimentally for CO2 capture from blast furnace gases. According to their estimation, the costs for the CO2 recovery ranged from 15 to 17.5 €/tCO2.
2.6 Hybrid carbon capture system
In the past few years, as enumerated above, a variety of post-combustion carbon capture technologies have been developed (absorption, adsorption, membrane, etc.). However, they are also more or less faced with challenges regarding energy consumption or costs. No single capture technology has by far exhibited obvious advantages over other options. For example, the MEA-based chemical absorption and gas permeation membrane technologies result in comparable efficiency penalties when they are deployed in coal-fired power plants. More than 10 %-pts of efficiency losses are normally witnessed in those studies when the capture rate is set at 90 %. Therefore, some scientists have brought forward the concept of hybrid capture systems that combine multiple CO2 separation technologies.
Membrane Technology & Research (MTR), Inc. and the University of Texas at Austin (UT Austin) are among the pioneers in the development of hybrid capture technology. They collaborated on hybrid membrane-absorption capture systems that combine MTR’s air-swept Polaris™ membrane contactor with UT Austin’s PZ advanced flash stripper capture technology [145]. Two variations of their models are displayed in Figure 2.7. In the series arrangement (Figure 2.7 (a)), the flue gas is first treated in the chemical absorption unit and approximately 50 % of the CO2 is removed. Then, the stream exiting the stripper with a fraction of 10 % CO2 permeates through the membrane unit so that the remaining CO2 in the stream is further separated. As a whole, 90 % removal of CO2 in the flue is achieved. In the parallel arrangement (Figure 2.7 (b)), the flue gas is first split and then two split streams are directed to the absorber and membrane, respectively. The major advantage of the parallel arrangement is that the volume of the flue gas to be treated in the chemical absorption system largely decreases. Consequently, the absorber can be only roughly half its normal size. In both schemes, the permeate gas in the membrane is driven by the sweep gas back to the boiler as combustion air

2.6 Hybrid carbon capture system
28
so that the CO2 concentration in the flue gas is higher (around 20 %) than in normal cases. It is concluded by authors that in the series case the solvent regeneration energy is less required, while in the parallel case the capital costs will decrease compared to the conventional chemical absorption process [145]. It is reported that a project of bench-scale tests for this system was initiated in 2014 and a 0.1MW pilot plant located at UT Austin was to be modified for testing [146]. Nonetheless, no technical and economic performances of the pilot-scale test have yet been published.
Figure 2.7 Hybrid membrane-absorption systems: a) series arrangement, b) parallel arrangement [145]
The University of Kentucky has also been working on a hybrid system combining membrane and chemical absorption [147]. In their design, a membrane device is installed between the absorber the stripper. The membrane media could concentrate carbon loading in the solution coming from the absorber by permeating a majority of the water and rejecting a major fraction of carbonate/bicarbonate species. Moreover, the ammonia solution on the permeate side can be recycled to the absorber for additional CO2 capture.
The cryogenic technology is also investigated as a candidate for hybrid system design. Actually, in the system presented in Figure 2.6, cryogenic technology is already involved. The CO2-enriched permeate gas from the first-stage membrane is dehydrated and subsequently sent to a compression-condensation-membrane loop. As a result, high-purity CO2 liquid can be attained and readied for sequestration. However, Scholes et al [148] argue that this scheme would result in the dilution of oxygen in the burner and eventually reduces the overall efficiency of the power plant. Hence, they consider the addition of an air separation membrane to pre-treat the sweep air. This additional configuration ensures that the CO2 recovered in the second-stage membrane will not dilute the O2 concentration (see Figure 2.8). In addition, a simplified process is also studied, wherein the membrane unit in the compression-condensation-membrane loop is removed. The optimized process successfully reduces the CO2 avoidance cost to less than US $32/tCO2.
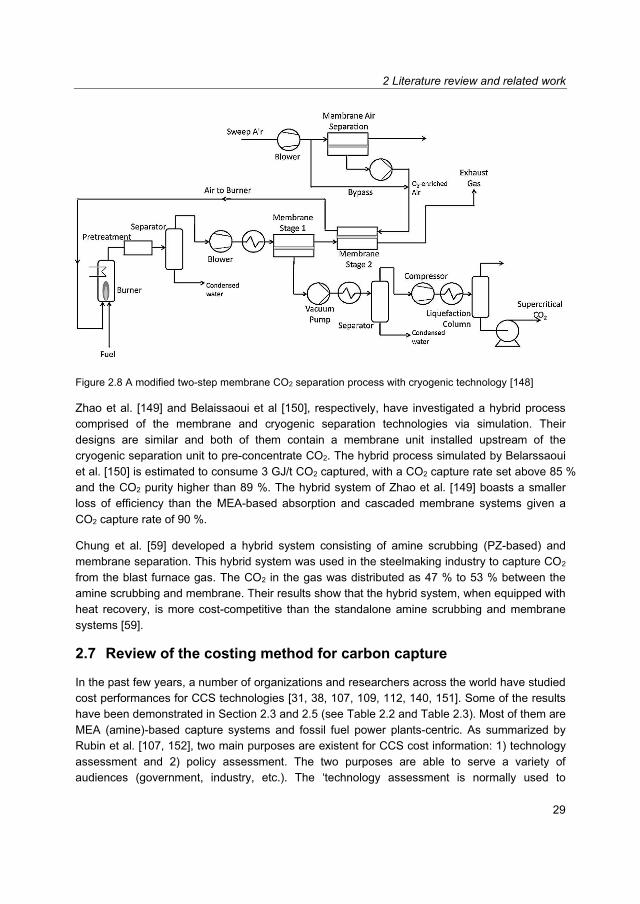
2 Literature review and related work
29
Figure 2.8 A modified two-step membrane CO2 separation process with cryogenic technology [148]
Zhao et al. [149] and Belaissaoui et al [150], respectively, have investigated a hybrid process comprised of the membrane and cryogenic separation technologies via simulation. Their designs are similar and both of them contain a membrane unit installed upstream of the cryogenic separation unit to pre-concentrate CO2. The hybrid process simulated by Belarssaoui et al. [150] is estimated to consume 3 GJ/t CO2 captured, with a CO2 capture rate set above 85 % and the CO2 purity higher than 89 %. The hybrid system of Zhao et al. [149] boasts a smaller loss of efficiency than the MEA-based absorption and cascaded membrane systems given a CO2 capture rate of 90 %.
Chung et al. [59] developed a hybrid system consisting of amine scrubbing (PZ-based) and membrane separation. This hybrid system was used in the steelmaking industry to capture CO2 from the blast furnace gas. The CO2 in the gas was distributed as 47 % to 53 % between the amine scrubbing and membrane. Their results show that the hybrid system, when equipped with heat recovery, is more cost-competitive than the standalone amine scrubbing and membrane systems [59].
2.7 Review of the costing method for carbon capture
In the past few years, a number of organizations and researchers across the world have studied cost performances for CCS technologies [31, 38, 107, 109, 112, 140, 151]. Some of the results have been demonstrated in Section 2.3 and 2.5 (see Table 2.2 and Table 2.3). Most of them are MEA (amine)-based capture systems and fossil fuel power plants-centric. As summarized by Rubin et al. [107, 152], two main purposes are existent for CCS cost information: 1) technology assessment and 2) policy assessment. The two purposes are able to serve a variety of audiences (government, industry, etc.). The ‘technology assessment is normally used to
2.7 Review of the costing method for carbon capture
30
‘compare the costs of alternative CO2 capture options’ while the ‘policy assessment’ to ‘support a variety of regulatory, legislative, and advocacy activities’ [107].
According to Rubin et al. [152], discrepancies and inconsistencies exist in the costing methods and guidelines used by different organizations. As a result, comparing the economic results from different sources becomes difficult or even impossible. Therefore, Rubin and his colleagues, who have been working on CCS costing method for over a decade [38, 106, 107, 139, 151, 153, 154, 155, 156, 157], called for the CCS research community to pay more attention to the uniformity, consistency, and transparency of the costing methods for CCS as well as the terminology [152]. In order to address the inconsistency and ambiguity in the published CCS costing methods, a few publications suggesting costing methodology were selected and closely checked in the present study. These publications include a NETL report [158], two reports for the EU funded project ‘CAESAR’ [159] and ‘CEMCAP’ [160], and a paper of Abu-Zahra et al. [109]. It is noticed by the author of this thesis that, in spite of the differences in the costing methods used in the four publications, their costing guidelines can essentially be fitted into one ‘common costing method’ proposed by IEAGHG, which can be divided into 5 steps [161]:
1. Defining the project scope: does the cost model target CO2 capture, transport, storage, or the whole CCS value chain?
2. Defining the elements of CAPEX and OPEX: which cost elements should be included? 3. Quantifying the elements of cost: how to estimate the cost of each element defined in
the second step? 4. Defining economic assumptions: cost year, currency, constant vs current cost value,
discount rate, escalation… 5. Calculating key cost metrics: cost of CO2 captured, cost of CO2 avoided, LCOE…
It is particularly in the 2nd and 3rd steps that the differences are most revealed. It is found that the 4 surveyed publications used different guidelines for CAPEX estimation whereas they are consistent with breaking the OPEX into variable and fixed costs. The distinct guidelines for CAPEX are largely attributed to the different grouping norms. For instance, in both the NETL report [158] and the ‘CEMCAP’ project [160], the CAPEX is defined at 5 levels even though the 5 levels and the elements under each level are not exactly the same. By contrast, the ‘CAESAR’ project [159] and Abu-Zahra et al. [109] simply divided the CAPEX elements into two major categories: direct and indirect costs. Furthermore, the approaches to quantifying the considered elements also vary from one publication to the others.
Apparently, the distinct grouping and quantifying methods for the CAPEX elements are confusing and sometimes even misleading for the readers who try to compare the results or use the cost models. Therefore, as advocated by Rubin et al. [152], the cost elements, as well as the assumptions, must be clearly specified and stated regardless of what kind of cost estimation guideline is used.

2 Literature review and related work
31
2.8 Discussion
2.8.1 Bottlenecks of the MEA– and membrane-based carbon capture technologies
Despite the fact that a variety of post-combustion capture technologies have been studied for many years, the MEA-based chemical absorption technology is still the leading candidate for industrial-scale application in all senses. The fact that this technology has been operated in multiple pilot- and demo-scale power plants has well prepared it for full-scale implementation in the near future (see Figure 2.1). The major barrier is the fact that the system has a rather high energy demand and thus damages the economic benefits of plants. According to the studies demonstrated in Section 2.3, this technology can lead to around 10 %-pts efficiency penalty for power generation given a capture rate of 90 %.
Developing less energy-consuming solvents to replace MEA has become one of the major directions for improving the performance of the chemical absorption system. Progress has been made on the quest of novel solvents as introduced in Section 2.2.2. However, the solvents that have been investigated so far either bring new technical problems or have not been fully tested in actual operating conditions. Moreover, even though some solvents are able to reduce the heat duty for regeneration, they require steam with higher quality, which adversely results in even higher electric energy consumption [66, p. 141].
Unlike the amine-based chemical absorption technology, the gas permeation technology in principle involves no chemical reactions. Its demand for thermal energy is much lower as compared to the reference MEA technology. However, when taking the electricity consumption into account, this technology has been found to show no obvious advantages over the conventional MEA based technology in energy consumption [140, 142]. Moreover, large-area membrane is required to deal with the flue gases from industrial-scale plants and hence the capital cost is very high. The root cause is that the CO2 separation ability of current membrane is highly restricted by the permeability and selectivity of the membrane material. The upper bound for the membrane properties discovered by Robeson et al in 1991 still have not been crossed [34, 124].
2.8.2 Potential of hybrid CO2 capture systems
In recent years, many scientists have been trying to figure out a solution to improving carbon capture by combining multiple capture technologies instead of looking for breakthroughs for single technology systems. As introduced in Section 2.6, some hybrid systems studied appear to be more energy-saving or economical than single capture technologies. Although there is not enough data, especially experimental data, to prove that hybrid systems are feasible in actual operation yet, this concept represents at least a possible direction for research.
One thing that most of the studied hybrid capture systems have in common is that the MEA-based capture system is often included. This is not surprising considering the maturity of this

2.8 Discussion
32
technology and thus it would lay a solid foundation for the feasibility of any newly developed hybrid systems. The key point of designing a hybrid system is how to make the best of each technology while avoiding their innate weaknesses. One good example is the design proposed by MTR and UT Austin [145], which combines chemical absorption and membrane technologies. The hybrid systems have shown great potential for making CO2 capture less energy-intensive (see Figure 2.7). In their schemes, the boiler is also included in the whole hybrid capture process. The ensuing impacts on the combustion of fuels have not been discussed. Moreover, no economic analyses for their designs have yet been published.
Given the potential of the concept of the hybrid capture system, it is of great interest to further investigate the hybridization of the MEA and membrane technology with regard to process design. Moreover, in order to make comprehensive comparison of the hybrid system and single technology system, both technical and economic evaluations are indispensable.
2.8.3 Integration of the post-combustion capture systems into target plants
Current studies on the integration of the post-combustion systems into target plants mainly pay attention to two aspects: 1) system integration and 2) waste heat integration. The system integration focuses on how to connect the capture systems to the target plants and where the energy supply comes from. For waste heat integration, the principal task is to save energy by utilizing the exhaust waste heat.
Comparing the two single capture technologies discussed in the present study (MEA and membrane), the gas permeation membrane technology is found to be easier to integrate because this technology demands mostly electricity, a form of energy that is convenient for utilization and calculation.
By contrast, the MEA-based system is normally designed to be coupled with steam turbines and thus the integration is more complicated than the gas permeation membrane technology. The extraction location and pressure control measures must be specifically sorted out. With respect to the pressure control for the steam extraction, it is interesting to note that, as discussed in Section 2.2.3, the control measures are not always clearly stated in some published papers. For instance, some scientists analyzed the integration of the MEA system under the condition that the pressure at the extraction point is kept constant at the nominal value but without explaining what measures are taken [100, 102].
However, there are also some scientists who have highlighted the approaches to pressure control for heat integration. The three modification options provided by Lucquiaud and Gibbins [65] have been introduced in Section 2.2. In addition, Oexmann and his colleagues have also conducted detailed research with regard to the pressure control measures. Their design is pretty much the same as the second type of modification (‘Throttled LP turbine’) of Lucquiaud and Gibbins [65], which situates a pressure control valve upstream of the LP turbine so as to maintain the pressure at the steam extraction point. It is revealed that this design has been most investigated for the integration of the MEA system into existing power plants for its
2 Literature review and related work
33
flexibility of dealing with varied steam demand and hence is also a feasible approach for this study. Nonetheless, there are still divided opinions on how to operate this design. One option is to maintain the pressure at the nominal value of the power plant. Another possibility is to keep the pressure precisely at the required pressure for the steam use, i.e. the pressure of the steam entering the reboiler. Both options are to be tested in this thesis.
The core of integration analysis is to figure out how the integration would affect the operation of the plants and calculate the impacts quantitatively. Finally, a big challenge concerning the integration is how to realize those aforementioned approaches via simulation tools in the present study. The impacts of post-combustion capture technologies on full-scale power plants have by far mostly been evaluated by simulation work, especially for the MEA-based system. There is no simulation tool specifically designed to represent complex interactions between a CO2 capture unit and an industrial-scale plant at present. A solution must be found to address this challenge.
2.8.4 Lack of research for post-combustion CO2 capture in the iron & steel industry
It is also found that the CCS study for the steel-making industry lags behind the study for the power sector. Only a few publications that report the application of the MEA-based system in the iron & steel industry [44, 58, 59, 116]. Due to the fact that the operations of steel plants differ from each other, the published results are principally plant-specific. Different capture strategies are seen in various studies. This is because a steel plant, unlike a coal-fired power plant, has multiple sources of CO2 emissions. In addition, the characteristics of the flue gas mixtures (CO2
fractions, dust, acid gases) are normally different than that of power plants [58, 116]. As a result, different studies have distinct opinions about which point sources should be targeted for carbon capture. Additionally, the steam supply approach, which is normally extracted from steam turbines in power plants, should be again examined for the iron and steel industry.
Comparatively, only a few studies have been published concerning the use of the gas permeation membrane technology in the iron and steel industry. Moreover, no studies with respect to a holistic techno-economic evaluation of post-combustion CO2 capture from the iron & steel industry with gas permeation membrane technology have been found. Therefore, a comprehensive techno-economic assessment is necessary to fill this research gap.
2.9 Summary
This chapter has introduced related work found in the literature. Some studies relevant to the MEA-based chemical absorption and gas permeation membrane technologies are covered.
First of all, Section 2.1 reviews the current state of the CO2 mitigation approaches in coal-fired power plants and the iron and steel industry. It is found that the conventional MEA-based system is so far the most mature capture technology and has entered the commercialization

2.9 Summary
34
phase. Meanwhile, the gas permeation membrane technology has also been applied in coal-fired power plants or other industrial sectors for carbon capture on pilot- or demo-scale.
Section 2.2 demonstrates the basic process of the MEA-based chemical absorption system and relevant background knowledge. The state of the art of this technology including novel solvents and designs are also introduced. Section 2.3 summarizes some simulation results from the literature regarding the application of the MEA-based system applied in coal-fired power plants and steel plants. In coal-fired power plants, according to various sources, this technology leads to around 10 %-pts efficiency penalty when 90 % of CO2 in the flue gas is captured. The costs vary in different studies due to distinct assumptions and calculation bases. So do the results of the MEA-based system applied in steel plants.
Section 2.4 introduces some basic knowledge about the gas permeation membrane technology. According to reports, the polymeric membrane is so far the only option to be used on large-scale CO2 separation. Some widely studied separation systems existing using the gas permeation membrane are also noted in this section. In particular, the process of the cascaded membrane (two-stage) separation system is explained. The results of this system applied in power plants from the literature are summarized in Section 2.5. It is revealed that the cascaded membrane system does not have obvious advantages over the MEA-based system in terms of energy consumption and costs, especially at high CO2 capture rates.
Section 2.6 lists some concepts of hybrid MEA/membrane CO2 capture systems that have been studied. Some of the hybrid designs turn out indeed to be either more energy-efficient or cost-effective than the standalone MEA or membrane technology. In Section 2.7, a general costing guideline for CCS is summarized by reviewing some relevant studies. The guideline will be used to build up a cost model for this work.
A discussion regarding the related work noted in this chapter is made in Section 2.8. Firstly, the challenges and problems faced by the current MEA-based and gas permeation membrane technologies are discussed. Given these challenges for the two standalone capture technologies, it is conceived that developing hybrid systems that are able to take advantage of both technologies’ features is likely to further push the feasibility of post-combustion carbon capture technology. In order to examine the conception, complete techno-economic evaluations should be conducted for the developed hybrid capture systems. Lastly, filling the research gap with respect to the application of the gas permeation membrane for CO2 capture in the iron and steel industry should also be one of the focuses of the present study.

35
Flue gas
Reboiler
Absorber
Stripper
30wt% MEASolution
40°C, 1.05bar
Steam/condensatefrom/to steam turbine
Rich-loading pump
Lean-loading pump
Rich-lean Heat Exchanger
Cooler
Washingcolumn
Condenser
To CO2 compressionMakeup water
and solvent
To makeup systemCooling Water
Flue gas
Cooling Water
Blower
NaOH solvent tank
Wet scrubber
3 Modeling of carbon capture systems and costing method This chapter introduces the CO2 capture models developed in Aspen Plus®. Section 3.1 and 3.2 describe the modeling of a cascaded membrane separation system and an MEA-based chemical absorption system, respectively. Section 3.3 illustrates how two types of hybrid capture systems are configured. In Section 3.4, a 4-stage CO2 compression train modeled in the present work is demonstrated. Finally, the general approach to cost analysis used in the present study is illuminated in Section 3.5.
3.1 Modeling of MEA-based chemical absorption system
A conventional MEA-based chemical absorption system is modeled in Aspen Plus®. The model is developed based on a simple example rate-based MEA model provided by Aspentech [72]. As discussed in Section 2.2, rate-based model can more accurately predict the behaviors of reactive columns. The thermophysical property and reaction kinetic models used in this example model are built based on the work of U.T. Austin [162] and Hikita et al [163]. The transport property models and their coefficients have been validated against experimental data from the literature.
3.1.1 Process description
The flowsheet schematic of the MEA-based chemical absorption system is displayed in Figure 3.1. The flowsheet of the MEA model in Aspen Plus is demonstrated in Appendix B (see Figure B. 1)
Figure 3.1 Schematic of the MEA-based chemical absorption system
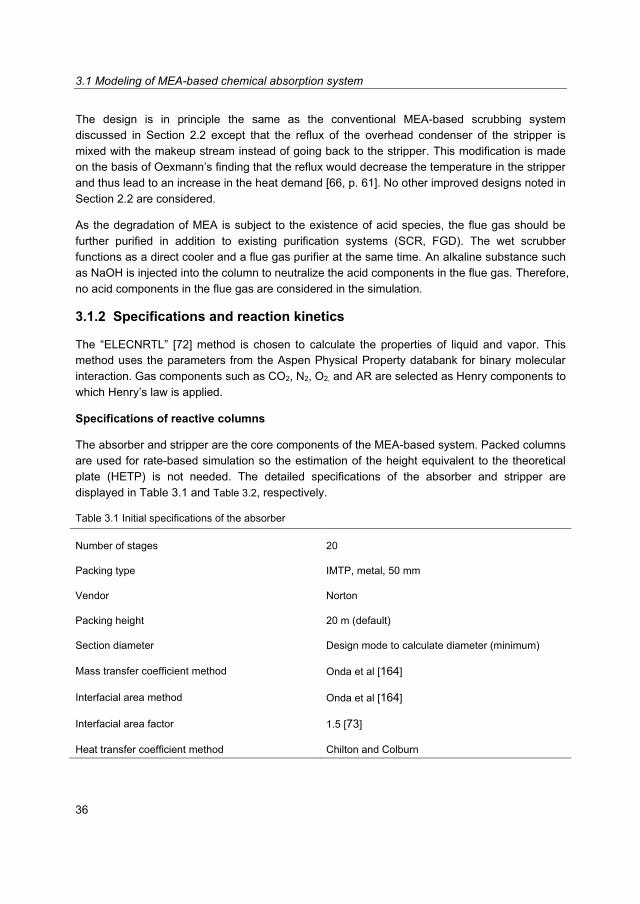
3.1 Modeling of MEA-based chemical absorption system
36
The design is in principle the same as the conventional MEA-based scrubbing system discussed in Section 2.2 except that the reflux of the overhead condenser of the stripper is mixed with the makeup stream instead of going back to the stripper. This modification is made on the basis of Oexmann’s finding that the reflux would decrease the temperature in the stripper and thus lead to an increase in the heat demand [66, p. 61]. No other improved designs noted in Section 2.2 are considered.
As the degradation of MEA is subject to the existence of acid species, the flue gas should be further purified in addition to existing purification systems (SCR, FGD). The wet scrubber functions as a direct cooler and a flue gas purifier at the same time. An alkaline substance such as NaOH is injected into the column to neutralize the acid components in the flue gas. Therefore, no acid components in the flue gas are considered in the simulation.
3.1.2 Specifications and reaction kinetics
The “ELECNRTL” [72] method is chosen to calculate the properties of liquid and vapor. This method uses the parameters from the Aspen Physical Property databank for binary molecular interaction. Gas components such as CO2, N2, O2, and AR are selected as Henry components to which Henry’s law is applied.
Specifications of reactive columns
The absorber and stripper are the core components of the MEA-based system. Packed columns are used for rate-based simulation so the estimation of the height equivalent to the theoretical plate (HETP) is not needed. The detailed specifications of the absorber and stripper are displayed in Table 3.1 and Table 3.2, respectively.
Table 3.1 Initial specifications of the absorber
Number of stages 20
Packing type IMTP, metal, 50 mm
Vendor Norton
Packing height 20 m (default)
Section diameter Design mode to calculate diameter (minimum)
Mass transfer coefficient method Onda et al [164]
Interfacial area method Onda et al [164]
Interfacial area factor 1.5 [73]
Heat transfer coefficient method Chilton and Colburn

3 Modeling of carbon capture systems and costing method
37
Table 3.1 continued
Hold up correlation Stichlmair et al. [165]
Film resistance
Liquid: diffusion resistance with reactions in film. Film is discretized
Vapor: diffusion resistance but no reactions
Film discretization ratio 5
Flow mode Mixed
Table 3.2 Initial specifications of the stripper
Number of stages 21 (last stage for reboiler)
Reboiler type Kettle
Packing type FlEXIPAC, metal, 1Y
Vendor KOCH
Packing height 15 m (Default)
Section diameter Design mode to calculate diameter (minimum)
Mass transfer coefficient method Bravo et al. [166]
Interfacial area method Bravo et al. [166]
Interfacial area factor 0.4
Heat transfer coefficient method Chilton and Colburn
Hold up correlation Stichlmair et al. [165]
Film resistance
Liquid: diffusion resistance with reactions in film. Film is discretized
Vapor: diffusion resistance but no reactions
Film discretization ratio 5
Flow mode Mixed
The ‘Design mode’ is a function of the rate-based reactive distillation block in Aspen Plus® to automatically calculate the minimum diameter according to the input flow rate of the flue gas.

3.1 Modeling of MEA-based chemical absorption system
38
The outlet pressures of the rich-loading and lean-loading pumps are initially estimated using the following function [66, p. 62]:
��� !" # �$%&' ()*+$,-.� / � 010234�567' 8�9��������������� (3.1)
The outlet pressure is estimated as a function of the pressure of saturated water (�$%&' ) at the temperature of the hot side of the RLHX for the solution and the geodetic height of corresponding column. The initial value of pressure is likely to be adjusted after the first run of simulation to make the simulation converge successfully. The initial specifications of other important components are shown in Appendix B (see Table B. 1).
What should be noted is that the internal overhead condenser of the stripper is not configured. Instead, a cooler and flash blocks are used to function as a condenser. This is simply for ease of the simulation. Similarly, the same approach is used to represent the overhead washing column on top of the absorber. The ‘number of stage’ for the column in the model specification does not refer to the actual number of stage since there are no actual stages in a packed column. Therefore, the number of stage in a packed column model merely represents the precision of simulation and conceptual discretization. Generally, a higher number of stages leads to more accurate results but increases calculation time.
Reaction kinetics
The basic reactions have been introduced in Section 2.2. Specifically, five equilibrium and four kinetic reactions are considered in the MEA model.
Equilibrium reactions:
�� ��� � � �� (3.a)
� � � ��� � � � �� (3.b)
� �� � ��� � � � �� (3.c)
:;<� � � �=>? � � � (3.d)
:;<� � � � �=>? � � �� (3.e)
In the default setting, the equilibrium constants K for each reaction are computed from the standard Gibbs energy change in the Aspen model. In this work, the constants are estimated using the function proposed by Austgen et al. [162]:
lnK = C1 + C2/T + C3lnT + C4T (3.2)
Coefficients C1-C4 for each equilibrium reaction are summarized in Table 3.3.
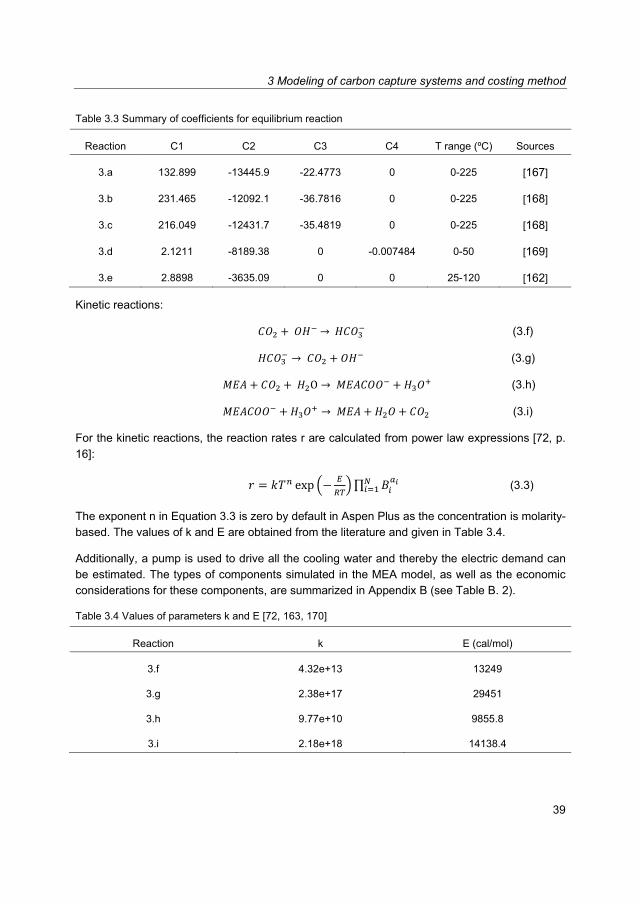
3 Modeling of carbon capture systems and costing method
39
Table 3.3 Summary of coefficients for equilibrium reaction
Reaction C1 C2 C3 C4 T range (ºC) Sources
3.a 132.899 -13445.9 -22.4773 0 0-225 [167]
3.b 231.465 -12092.1 -36.7816 0 0-225 [168]
3.c 216.049 -12431.7 -35.4819 0 0-225 [168]
3.d 2.1211 -8189.38 0 -0.007484 0-50 [169]
3.e 2.8898 -3635.09 0 0 25-120 [162]
Kinetic reactions:
� � � � @ �� �� (3.f)
� �� @ �� � � (3.g)
:;< � � ��A @ �:;<� � � � � (3.h)
:;<� � � � � @ �:;< � � � (3.i)
For the kinetic reactions, the reaction rates r are calculated from power law expressions [72, p. 16]:
� # B)C DEF GH I*JKL M�
5NO�PQ ����������������� (3.3)
The exponent n in Equation 3.3 is zero by default in Aspen Plus as the concentration is molarity-based. The values of k and E are obtained from the literature and given in Table 3.4.
Additionally, a pump is used to drive all the cooling water and thereby the electric demand can be estimated. The types of components simulated in the MEA model, as well as the economic considerations for these components, are summarized in Appendix B (see Table B. 2).
Table 3.4 Values of parameters k and E [72, 163, 170]
Reaction k E (cal/mol)
3.f 4.32e+13 13249
3.g 2.38e+17 29451
3.h 9.77e+10 9855.8
3.i 2.18e+18 14138.4

3.1 Modeling of MEA-based chemical absorption system
40
Sequence starts
Convergence 1 (CV1)
Convergence 2 (CV2)
Convergence 3 (CV3)
Convergence 4 (CV4)
Sequence ends
3.1.3 Closing the loop
To predict the behavior of the MEA system more accurately, it is necessary to run the model in a recycled manner as it is in reality. This action is termed ‘closing the loop’ in the present work and can only be achieved after the model has been successfully converged in the ‘open loop’ wherein the amine solution is not recycled.
Figure 3.2 Breakdown of the convergence for the MEA model
To close the loop, the properties (components, fractions, flow rate, etc.) of the amine solution after the component ‘cooler’ in Figure 3.1 should be identical to that of the amine solution entering the absorber. Many factors, such as amine leakage, calculation tolerance, and convergence methods, have influences on the convergence of the ‘closed loop’. In addition to these elements, it is found that the calculation sequence needs to be redefined to make the closed MEA model run successfully in the present work due to the fact that the Aspen Plus® normally computes the process in an illogical way. Therefore, the calculation of the process should be configured in a sequence in which the streams pass through the components as in reality. As a result, the calculation of the operation of the MEA model is divided into four convergences as demonstrated in Figure 3.2.
In Figure 3.2, the red lines denote the main convergence flow, under which three sub-convergences exist. For each convergence loop, one ‘tear stream’ (where initial inputs are given) is chosen. The initial input values for the tear streams are obtained from the results of the open loop model. The detailed configuration and definition for the convergence settings can be found in Appendix B (see Table B. 3).

3 Modeling of carbon capture systems and costing method
41
3.1.4 Validation
The thermal energy consumption of the closed MEA model was validated against the experimental results from the CASTOR pilot plant [73]. Since the present work focuses on the assessment of the performance of the overall process (macro-scale evaluation), the analysis of the detailed profiles inside the distillation columns (micro-scale evaluation) is not in the scope of this thesis
The input data and experimental results are tabulated in Table 3.5. For validation, the same input data as used in the CASTOR pilot plant [73] were input into the MEA model in this thesis. Five tests were made by varying the solvent flow rate. In addition to the input data, the geometric configurations of the MEA model were also adjusted to be the same as the pilot-scale plant configurations. The simulation results of the specific regeneration energy and CO2 capture rate are then, respectively, compared with the experimental results (see Figure 3.3 and Figure 3.4).
Table 3.5 Input experimental data for validation [73]
Parameter Test 1 Test 2 Test 3 Test 4 Test 5
Input
Solvent flow rate [m3/h]
23.00 19,00 16.07 14.80 12.50
Flue gas [Nm3/h] 4915 5011 4939 4926 4990
CO2 at inlet [mol %wet]
11.86 11.94 11.76 12.12 11.77
Flue gas inlet temp (°C)
47.3 48.0 46.8 46.9 47.2
Stripper pressure (kPa)
181 181 181 181 181
Experimental
Results
CO2 capture rate (%)
90 90 90 91 90
Regeneration energy (MJ/tCO2)
3897 3722 3725 3626 3745
It can be seen in Figure 3.3 that the simulation results of the specific regeneration energy are higher than the experimental results over the entire range of varied solvent flow rate. The trends of the two curves, however, are similar to each other. The relative deviations of all tests are less than 5.4 %. Figure 3.4 compares the capture rates of the simulation and experiment. In tests 1-3, the calculated capture rates are higher than the experimental results. In test 4, the simulation and experimental results are very close. The largest deviation of the calculated capture rate from the experimental result happens in test 5, in which the calculated capture rate is around 5 %

3.1 Modeling of MEA-based chemical absorption system
42
lower than in the experimental case. In spite of the deviations, the simulation results are generally in very good agreement with the experimental results.
Figure 3.3 Specific regeneration energy as a function of the solvent flow rate
Figure 3.4 CO2 capture rate as a function of the solvent flow rate

3 Modeling of carbon capture systems and costing method
43
Feed Retentate
Permeate
pin
TindA
pret
Tret
pper
Tper
yi
yi’
yi-dyFin Fret
Fper
3.2 Modeling of membrane-based separation systems
3.2.1 Calculation of gas permeation
A gas permeation module model developed in the Aspen Custom Modeler (ACM) by Aspentech is used in the present work to simulate the gas permeation membrane. This module can be imported into Aspen Plus® and functions as a block component. The block component is capable of representing a cross-flow membrane module as shown in Figure 3.5, which corresponds to the ‘envelope’ type of membrane module mentioned in Section 2.4.
Figure 3.5 Schematic of a cross-flow membrane module
For the cross-flow membrane module, the assumptions including ideal gas behavior, isothermal conditions, negligible pressure drop, and constant gas permeability are made. In ACM, the gas permeation membrane module is discretized into 100 cells by default. Given these assumptions, the mass balance of gas component i for the kth cell can be expressed as follows:
Fret,k-1 * yi,k = Fret,k * (yi,k – dy) + Fper,k * yi,k’ , (3.4)
Fper,k * yi,k’ = dA * Pmol * (pin * (yi,k-dy) – pper * yi,k’) , (3.5)
where, according to the assumptions mentioned above, pin = pret, Tin = Tret = Tper .
According to the ideal gas law:
Pmol = P * pamb/(R*T) . (3.6)
Particularly, the result of pin * (yi,k-dy) – pper * yi,k’ represents the driving force across the membrane for the gas component i.
3.2.2 Process description
Two membrane-based processes were modeled in Aspen Plus®: 1) single-stage membrane separation system and 2) cascaded membrane separation system (two-stage). The schematic flowsheets of the two systems are shown in Figure 3.6 and Figure 3.7, respectively. The two systems were modeled on the basis of the reported design of Zhao et al [31, 133] and Maas et

3.2 Modeling of membrane-based separation systems
44
feed
retentate
permeate
P
E
C2
Water knock-out
Mem 1Mem 2
Flue gas
NaOHsolvent tank
Wetscrubber
DehydrationC1
Coolingwater
feedretentate
permeate
P
Membrane
Flue gas
Cooling Water
Wet scrubber
Dewatering
P
Intercooling Aftercooling
Vacuum Pump 1
Vacuum Pump 2
al. [140]. In the two flowsheet charts, C denotes compression units, P denotes vacuum pumps and E stands for turbo-expanders.
Figure 3.6 Schematic flowsheet of a single-stage membrane separation system, adapted from the design of Zhao et al [133].
Figure 3.7 Schematic flowsheet of the cascaded membrane separation system, adapted from the design of Zhao et al. [31] and Maas et al. [140]
The basic processes of the systems are the same as introduced in Section 2.4. In both the single-stage and cascaded membrane systems, a wet scrubber is placed upstream of the membrane module. A dehydration unit containing silica gel is used to dry the flue gas before the separation process. It is assumed that 2/3 of the total moisture in the flue gas can be removed via the dehydration unit. Compared to the single-stage membrane, a compression unit is added upstream of the first-stage membrane module in the cascaded system in order to reduce the required membrane area, especially when a high CO2 capture rate is targeted. Moreover, in the cascaded membrane system, the retentate gas from the second membrane module is directed to mix with the feed gas at the inlet of the first stage membrane module. The screenshot of the flowsheet of the cascaded membrane system in Aspen Plus® are shown in Appendix C (see Figure C. 1)
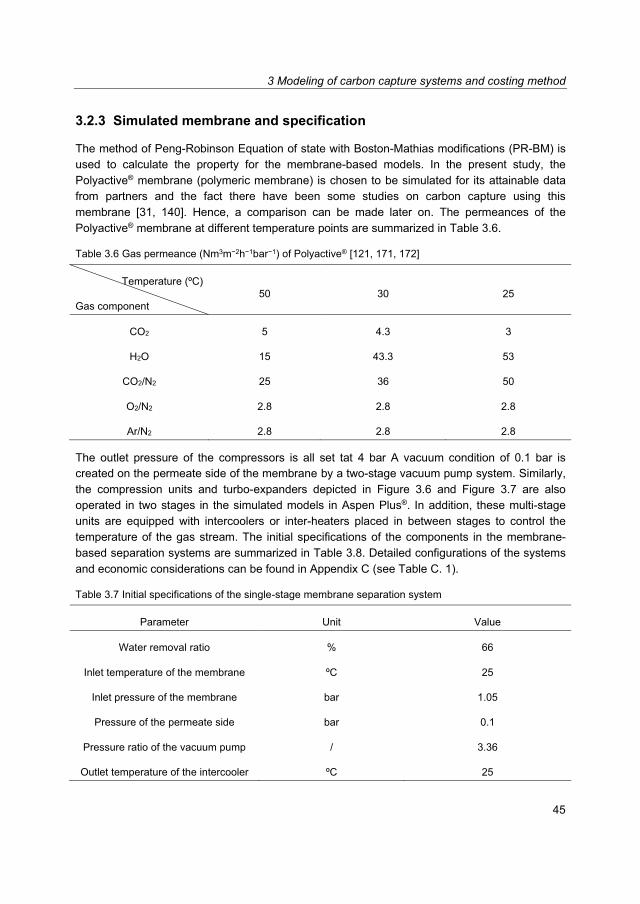
3 Modeling of carbon capture systems and costing method
45
3.2.3 Simulated membrane and specification
The method of Peng-Robinson Equation of state with Boston-Mathias modifications (PR-BM) is used to calculate the property for the membrane-based models. In the present study, the Polyactive® membrane (polymeric membrane) is chosen to be simulated for its attainable data from partners and the fact there have been some studies on carbon capture using this membrane [31, 140]. Hence, a comparison can be made later on. The permeances of the Polyactive® membrane at different temperature points are summarized in Table 3.6.
Table 3.6 Gas permeance (Nm3m−2h−1bar−1) of Polyactive® [121, 171, 172]
Temperature (ºC)
Gas component 50 30 25
CO2 5 4.3 3
H2O 15 43.3 53
CO2/N2 25 36 50
O2/N2 2.8 2.8 2.8
Ar/N2 2.8 2.8 2.8
The outlet pressure of the compressors is all set tat 4 bar A vacuum condition of 0.1 bar is created on the permeate side of the membrane by a two-stage vacuum pump system. Similarly, the compression units and turbo-expanders depicted in Figure 3.6 and Figure 3.7 are also operated in two stages in the simulated models in Aspen Plus®. In addition, these multi-stage units are equipped with intercoolers or inter-heaters placed in between stages to control the temperature of the gas stream. The initial specifications of the components in the membrane-based separation systems are summarized in Table 3.8. Detailed configurations of the systems and economic considerations can be found in Appendix C (see Table C. 1).
Table 3.7 Initial specifications of the single-stage membrane separation system
Parameter Unit Value
Water removal ratio % 66
Inlet temperature of the membrane ºC 25
Inlet pressure of the membrane bar 1.05
Pressure of the permeate side bar 0.1
Pressure ratio of the vacuum pump / 3.36
Outlet temperature of the intercooler ºC 25

3.3 Modeling of hybrid capture systems
46
Table 3.8 Initial specifications of the cascaded membrane separation system
Parameter Unit Value
Water removal ratio % 66
Inlet temperature of the membrane ºC 25
Inlet pressure of the membrane bar 4
Pressure of the permeate side of 1st stage membrane
bar 0.1
Pressure ratio of the 1st compression unit
/ 1.97
Pressure ratio of the 2nd compression unit
/ 2.02
Pressure ratio of the vacuum pump unit / 3.36
Pressure ratio of the expander unit / 0.51
Outlet temperature of the inter-cooler ºC 25
Outlet temperature of the inter-heater ºC 80
3.3 Modeling of hybrid capture systems
In the last two chapters, two types of widely studied capture systems (MEA & membrane-based systems) are modeled. The modeling of them, on the one hand, can lay a good foundation for the development of the new hybrid capture systems introduced in this section. On the other hand, they will be used as reference models to be compared with the hybrid models in the later chapters. In this section, two newly developed hybrid MEA/membrane capture systems are presented. Essentially, both hybrid capture systems are comprised of the membrane and MEA-based technologies.
3.3.1 Hybrid capture system design 1 (Hybrid D1)
The basic concept of the first design is to place a single-stage membrane separation system prior to the MEA system. In this design, the driving force for gases through the membrane is increased by vacuum pumps. The CO2-enriched permeate gas then enters the absorber and the CO2 is captured in the MEA chemical absorption process. The schematic flowsheet of this design is displayed in Figure 3.8.
As noted in Section 2.4, the single-stage membrane separation system is unable to produce desirable CO2-containing streams unless there are big breakthroughs on membrane properties. Nevertheless, when it is coupled with an MEA system in the Hybrid D1 system, the major task of

3 Modeling of carbon capture systems and costing method
47
Feed
Retentate
Permeate
C
MembraneDewatering
C
Intercooling Aftercooling
VacuumPump 1
VacuumPump 2
Reboiler
Absorber Stripper
30wt% MEASolution
40°C,1.05bar
Steam/condensatefrom/to steamturbine
Rich-loadingpump
Lean-loadingpump
Rich-leanHeat
Exchanger
Cooler
Washingsection
Condenser
To CO2 compression
Permeategas
To makeup system
Makeup water and solvent
Flue gas
NaOHsolvent tank
Wetscrubber
Coolingwater
the membrane is to elevate the CO2 concentration in the inlet gas stream (the permeate gas) for the chemical absorption process. There is no need for the CO2 fraction in the permeate gas to reach a very high value because the MEA system can guarantee that the final CO2 product stream has the required CO2 purity. In addition, the degree of CO2 separation of the single-stage membrane is restricted by the overall capture rate of the hybrid system. Consequently, to what extent the inlet CO2 concentration for the MEA system can be lifted is indirectly subject to the CO2 capture target of the hybrid system.
Figure 3.8 Schematic flowsheet of the hybrid capture system design 1
3.3.2 Hybrid capture system design 2 (Hybrid D2)
The flowsheet of the second hybrid model design Hybrid D2 is presented in Figure 3.9. This design is basically comprised of a cascaded membrane system (without the recycled gas) and an MEA system. Since the cascaded membrane system itself can produce a desirable CO2 product stream, the retentate gas streams from both membrane modules are mixed and then sent to the MEA system for further CO2 mitigation. Therefore, the basic concept of this design is to use the chemical absorption process to complement the CO2 capture of the membrane

3.3 Modeling of hybrid capture systems
48
Reboiler
Absorber Stripper
30wt% MEASolution
40°C,1.05bar
Steam/condensatefrom/to steamturbine
Rich-loadingpump
Lean-loadingpump
Rich-leanHeat
Exchanger
Cooler
WashingSection
Condenser
To CO2 compression
Flue gas
50°C,1.05bar
To makeup system
Makeup water and solvent
Feed
Retentate 1
Permeate 2
P
E
C
Water knock-out
Mem 1Mem 2
NaOHsolvent tank
Wetscrubber
Dehydration
Retentate 2
Fan
Permeate 1
system. Since the membrane has a trade-off feature between the CO2 capture rate and CO2 purity, a lower CO2 capture rate is set for the two-stage membrane in this design so as to guarantee a desirable CO2 purity in the final permeate gas stream (permeate 2). Finally, the CO2 product stream exiting the MEA system will be mixed with the permeate gas from the membrane system and thereby the mixed CO2 stream is ready for compression. Before the mix, the permeate gas coming from the second stage membrane must be compressed so that its pressure becomes the same as that of the product stream from the MEA part.
Figure 3.9 Schematic flowsheet of the hybrid capture model design 2
3.3.3 Specifications for hybrid models
As noted in Section 3.1 and 3.2, the methods ‘ELECNRTL’ and ‘PR-BM’ are used to calculate the properties of substances in the MEA and membrane-based capture systems, respectively. The two methods are also used for the MEA and membrane sections, respectively, in the two hybrid systems. To achieve this, both hybrid models must be divided into two sections, to each of which the corresponding method is configured as a sectional method and applied. What should be emphasized here is that a global property calculation method will cause calculation conflictions for the hybrid models due to fact that the MEA and membrane sections are run in distinct mechanisms and contain different chemical species. In principle, the basic specifications

3 Modeling of carbon capture systems and costing method
49
110 bar, 30°C
C`
CoolingWater
C` CCO2captured
KnockoutDrum 1
KnockoutDrum 2
KnockoutDrum 4
Stage 1 Stage 2 Stage 4
C
KnockoutDrum 3
Stage 3
of the block components are the same as their counterparts in the MEA or membrane systems since the two hybrid systems are essentially combinations of the introduced membrane and MEA systems.
3.4 Modeling of CO2 compression train
3.4.1 Process description
In this thesis, the CO2-enriched stream is designed to be compressed in a compression train and thereby ready for transport (see Figure 3.10). Through the compression process, the CO2-enriched gas stream will be compressed to 110 bar at 30 ºC, which makes the CO2 exist in a supercritical/dense phase and therefore energy-efficient for transport [173, p. 59].
Figure 3.10 Four-stage CO2 compression train
The compression of CO2 to such a high pressure will yield a large amount of exhaust heat along the process. As a result, the temperature of the stream will rise significantly. Therefore, a multi-stage (4-stage) compression train with intercooling is chosen to undertake the task (see Figure 3.10). Each stage consists of a compressor, a heat exchanger (cooler), and a water knockout drum. A fraction of impurities in the CO2 stream can be removed in this process. In addition, the pumps are used for driving the cooling water.
3.4.2 Specifications
The pressure ratios for the 4 stages in the compression train are assumed to be equal. Additionally, a pressure drop of 0.03 bar across each cooler is considered. Consequently, the pressure ratio is determined dependent on the inlet and outlet pressures considering the pressure drop. The function for calculating the pressure ratios (PR) is:
� # � R � 9STU8R9NV�9W�
XVTYZ[\�S]�^U_`[� (3.7)
, where pin and pout stand for the inlet and outlet pressures of the compression train, respectively. pd represents the pressure drop. The tolerance is set at 1e-8 for iterative calculations. The intermediate outlet temperature of the heat exchanger at each stage is set at 30 ºC.

3.5 General costing method
50
3.5 General costing method
3.5.1 General approach
This section introduces the cost model used in the present study. The general approach is presented in Figure 3.11, which is constructed based on the costing guideline summarized in Section 2.7. A discounted cash flow approach is used in this thesis for financial valuation. The cost estimation was conducted for the CO2 capture and compression processes. Three major variables are obtained to measure the economic performances: 1) CO2 capture cost, 2) CO2 avoidance cost and 3) costs of products. In general, the determination of elements for CAPEX and OPEX follows the guideline proposed by Peters and Timmerhaus [174] for chemical plants. Similar breakdown and grouping methods are also seen in the ‘CAESAR’ project [159] and work of Abu-Zahra et al. [109]. The approaches for quantifying the considered elements are also referenced from the two sources due to their Europe-centric research.
Figure 3.11 General approach for cost estimation
As can be seen in Figure 3.11, the geometric parameters and energy-related results in the Aspen models are required for cost estimation. All cost values are present in 2016 €. Concerning the cost escalation, the Chemical Engineering Plant Cost Index (CEPCI) [175] is used to escalate historic cost data as follows:
�������������������������������a�����b����< # ��a�����b����M c �;d�e����b����<�;d�e����b����M ���������������������������������f13����������������������
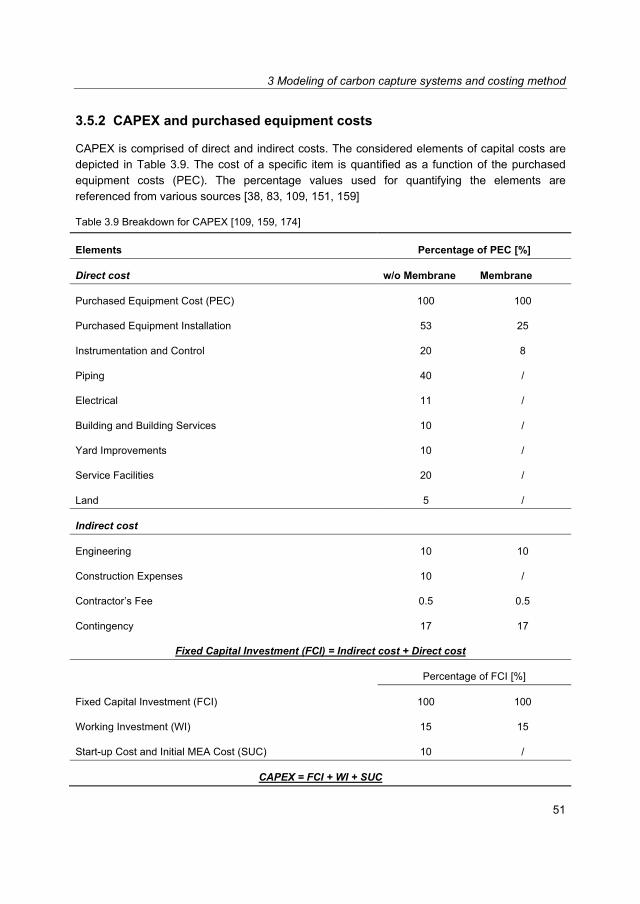
3 Modeling of carbon capture systems and costing method
51
3.5.2 CAPEX and purchased equipment costs
CAPEX is comprised of direct and indirect costs. The considered elements of capital costs are depicted in Table 3.9. The cost of a specific item is quantified as a function of the purchased equipment costs (PEC). The percentage values used for quantifying the elements are referenced from various sources [38, 83, 109, 151, 159]
Table 3.9 Breakdown for CAPEX [109, 159, 174]
Elements Percentage of PEC [%]
Direct cost w/o Membrane Membrane
Purchased Equipment Cost (PEC) 100 100
Purchased Equipment Installation 53 25
Instrumentation and Control 20 8
Piping 40 /
Electrical 11 /
Building and Building Services 10 /
Yard Improvements 10 /
Service Facilities 20 /
Land 5 /
Indirect cost
Engineering 10 10
Construction Expenses 10 /
Contractor’s Fee 0.5 0.5
Contingency 17 17
Fixed Capital Investment (FCI) = Indirect cost + Direct cost
Percentage of FCI [%]
Fixed Capital Investment (FCI) 100 100
Working Investment (WI) 15 15
Start-up Cost and Initial MEA Cost (SUC) 10 /
CAPEX = FCI + WI + SUC

3.5 General costing method
52
Since not all equipment configurations simulated in the present study match the parameters provided by available vendors, the costs of equipment are estimated by scaling based on historical cost data, capacity (size), temperature, pressure, and reference exponent. For different types of equipment, corresponding formulas are selected.
Compressor, blower, pump, scrubber, and heat exchanger
Purchased equipment costs of compressors, blowers, pumps, and heat exchangers can be
estimated from the following equation [176, p. 20]:
�� # �g� hhi
�jkjklkJ�������������������������� (3.9)
where mn = equipment costs for equipment i with the capacity �o ; o is obtained from the simulation.
mp = base costs of equipment i with the capacity op
= = exponent depending on the type of equipment.
qr- qs- qt = correction factors for the material of construction (M), operating pressure (P) and operating temperature (T).
Essentially, the costs of equipment are calculated based on the reference costs and then calibrated with correction factors. The term ‘capacity’ in Equation 3.9 refers to the capacity measure for a specific type of equipment. The detailed economic information for each piece of equipment can be found in Table 3.10. The correction factors for considered equipment have been summarized in Appendix I (see Table I. 9 and Table I. 10)
Table 3.10 Equipment delivered capital cost correlations [176, p. 18]
Equipment Capacity Measure [Unit]
Base Size QB
Base Costs CB [US$2010]
Size Range
Exponent M
Shall-and-Tube Heat Exchanger
Area [m2] 80 3.28 x 10⁴ 80-4000 0.68
Compressor, incl. motor
Power [kW] 250 9.84 x 10⁴ 250-
10000 0.46
(Large) Centrifugal Pump, incl. motor
Power [kW] 4 9.84 x 10³ 4-700 0.55
Scrubber (incl. random packing)
Volume (m3) 0.1 4.92 x 10³ 0.1-20 0.53

3 Modeling of carbon capture systems and costing method
53
Absorber, stripper, scrubber, and knockout drum
The capacity measure of the gas-liquid separation equipment is volume. However, the volumes of the scrubbers and knockout drums cannot be directly obtained from the models in Aspen Plus®. Therefore, a method suggested by Towler and Sinnott [177] is used to size the separation vessels. The detailed description of this sizing method is presented in Appendix H. With the vessel’s diameter and height obtained by this method, the volume can be calculated. With the volume data, the costs of scrubbers can be estimated using Equation 3.9. As for other separation vessels (absorber, stripper, knockout drum), the costs are estimated using the capital cost estimation method proposed by Turton [178] as there is no available reference cost data. Turton’s estimation equation is [178]:
u�vQw��x # yQ � yu�vQw�z� � y�{u�vQwz| (3.10)
, where yC are the equipment specific constants, ��x is the purchased equipment costs in 2001 US$ at standard condition, and z refers to the capacity measure. In order to determine the purchased equipment costs ( ��� for the actual operating condition, ��x is calibrated with correction factors as described in the last section:
�� # ��xkjklkJ (3.11)
The diameters and heights of the absorber and stripper can be read from the models in Aspen Plus®. Hence, the purchased equipment costs for the absorber and stripper can be directly determined using Equation 3.10. The values of K1, K2, and K3 for tower and packing are illustrated in Table 3.11.
Table 3.11 Equipment cost data for Turton’s equation [178]
Equipment Capacity measure
[Unit] Z1 Z2 Z3 Size Range
Tower Volume [m3] 3.4974 0.4485 0.1074 0.3-520
Packing Volume [m3] 2.4493 0.9744 0.0055 0.03-628
Membrane and membrane frame
Concerning the purchased cost of the membrane and its container (membrane frame), the costs are basically calculated as a function of the required area calculated in the simulation models in Aspen. Particularly, the cost of the membrane frame (container)is estimated by the equation proposed by Van Der Sluijs et al [179] :
�}85~" # � �www�w1� c �}85~"w (3.12)
, where A stands for the required membrane are and �}85~" is the cost of membrane frame and �}85~"w is the base cost.

3.5 General costing method
54
3.5.3 OPEX
As noted in Section 2.7, OPEX is comprised of the variable and fixed costs. The considered elements under each category and their quantifying method are demonstrated in Table 3.12. The percentage values for some items are also selected according to published data [38, 83, 109, 151, 159]
Table 3.12 Breakdown for OPEX [109, 159, 174]
Elements Quantifying method
Variable cost
Cooling Water
Cooling water make up [m3/GJ] x
Cooling Duty [GJ] x Cooling water
costs
Natural gas Fuel Costs [EUR/t] x Consumption
Electricity Electricity costs [EUR/MWh] x
Consumption
MEA make-up MEA cost x MEA degradation
Fixed costs
Local taxes 2 % of FCI
Insurance 1% of FCI
Maintenance (M) 4 % of FCI
Operating Labor (OL) No. of Shifts x 45 €/h▪shift
Supervision and Support Labor 30% of OL
Operating Supplies 15% of M
Laboratory Charges 10 % of OL
Plant Overhead Cost 60 % of (M + OL + S)
General Expenses
Administrative Cost 15 % of OL
Distribution and Marketing 0.5 % of OPEX
R&D Cost 5 % of OPEX
OPEX = Variable costs + Fixed costs

3 Modeling of carbon capture systems and costing method
55
3.5.4 CO2 capture and avoidance costs
The costs of CO2 captured and avoided are the two commonly used metrics to evaluate the
economic performances of a CO2 capture system. The latter is considered a better measure of
the effectiveness of a CCS technology [180, p. 16]. In addition, the costs of products are also
important metrics to reflect the impacts of CCS on plants. To calculate the metrics, the total
annual costs of the capture systems should be estimated first. The total annual cost is
calculated by summing up the OPEX and annualized CAPEX. The annualized CAPEX, on the
other hand, is the product of the CAPEX and annuity factor. With the total annual costs for the
capture and compression processes, the CO2 capture and avoidance costs can be calculated.
The relevant formulas are displayed in Table 3.13. Additionally, the difference between the CO2
capture and avoidance costs is presented in Appendix H (Figure H. 1) in case it is confusing for
some readers.
Table 3.13 Formulas for economic calculation
Symbol Equation
Total Annual Cost of CCS �5C- � # d;� � �<d;� c ��
CO2 intensity I # ��&%
��� 9�
Cost of CO2 captured ��&%-�59 # �5C- � ��&%-�59
Cost of CO2 avoided ��&%-5� # �� ;��' H �� ;8"}
e8"} H e��' ����d������u����
# �5C- �
��&%-�59 H���&%-��'������u��u����
Cost of HRC �$*� # �$*�-8"} � �5C- � �$*�-5C

3.6 Discussion
56
3.5.5 Basic assumptions
Some basic assumptions for the cost estimation of the CO2 capture systems are summarized in Table 3.14. It should be noted there is currently no commercial unit price for the Polyactive® membrane. Thus, only ballpark figures for the membrane price were used in previous studies when it comes to estimating the costs of membrane-based technologies [31, 140]. Similarly, an estimated membrane price of 50 €/m2 is assumed in the present study as the baseline value.
Table 3.14 Assumptions and cost parameters for the CO2 capture systems
Parameter Unit Value
Cooling water make-up m3/GJ 1 [109]
Discount rate % 8
Cooling water cost €/m3 0.15 [181]
Project lifetime year 25
Exchange rate (2016) €/US$ 1.11 [182]
Membrane price €/m2 50 [31]
Lifetime of membrane year 5
Price of natural gas €/GJ 4.18 [183]
Imported electricity price euro cent/kWh 8.8 [184]
Degradation rate of MEA kg/tCO2 1
MEA make-up cost €/kg 2.3
3.6 Discussion
3.6.1 Lessons learned for the modeling of CO2 capture systems in Aspen Plus®
All the capture systems modeled in Aspen Plus® are primarily used to estimate the energy consumption of the overall processes (macro-scale analysis). Hence, the detailed behaviors of the operation of each piece of equipment were thus not particularly examined. In light of this purpose, the MEA model was only validated against the energy-related experimental data. Nevertheless, when the operation of a certain piece of equipment (e.g. absorber, stripper, etc.) needs to be screened, the operating profiles (e.g. temperature, CO2 partial pressure, etc.) should also be validated.

3 Modeling of carbon capture systems and costing method
57
To specify the CO2 capture rates for the capture systems, several functions in Aspen Plus®, such as ‘Design Specs’, ‘Optimization’, and ‘Constraint’, were defined. Unless specifically stated in the following chapters, the CO2 capture rate is set at 90 % and the CO2 purity in the outlet stream set at 95 mol% for all the capture models. Some specifications were left undetermined until the models are applied with certain boundary conditions for the varied boundary conditions would lead to different configurations.
As discussed in Section 3.3, the hybrid models comprise many components and must be divided into two sections (Membrane and MEA parts) for the property calculation, for which two calculation methods (‘PR-BM’ and ‘ELECNRTL’) need to be applied. As a result, both the calculation time and convergence difficulty increase dramatically as compared to the single-technology capture models (MEA or membrane). Therefore, it has been found that it is more time-efficient to first conduct the simulation of the two sections of the hybrid models in two separate files. In doing so, the causes for errors in each section are easier to sort out, especially for sensitivity analyses. The interfacial data between the two sections can be manually transferred and recorded in spreadsheets. Furthermore, the interfacial data are also significant for analyzing the interactions between the sections. After the errors have been corrected, the hybrid models can be simulated in one single file (complete model), with the specifications that have already been examined in the separate Aspen files. Naturally, a successfully running complete model can save time for manually transferring the interfacial data. Moreover, the complete model is as important as the separate files in this study when the heat integration and heat exchanger network design is conducted.
As discussed in Chapter 2, one challenge for integrating the capture systems into target plants via simulation is that there are no available tools specifically programmed to realize this process. Therefore, the method for evaluating this dynamic interaction in the present study is to simulate the CO2 capture processes and target plants separately in different professional simulation tools and then couple them by transferring operating parameters. This chapter only introduces the capture models and the two following chapters will present two target plants respectively.
3.6.2 Derivation of the CO2 capture rates for the hybrid capture models
Another point that needs to be drawn attention to is the calculation of the CO2 capture rate (CCR) for the hybrid capture systems. Generally, the capture rate is defined as:
����{�| # {�&%|][[�{�&%|�\S�T�U
R 400� (3.13)
, where [CO2]feed represents the CO2 flow rate in the feed gas entering capture system while [CO2]product refers to the CO2 flow rate in the CO2 product stream. To be more specific, the CO2 product stream in the Hybrid 1 system refers to the stream exiting the overhead condenser of the stripper while, in the Hybrid 2 system, to the mixed stream that is sent for compression.
Normally, the capture rate of a capture system can be specified using the ‘Design Specs’ function in Aspen Plus®. Nevertheless, as noted above, the hybrid models were first run in

3.6 Discussion
58
separate files. Therefore, given an overall capture rate though, the respective capture rates of the two sections in the hybrid systems should also be specified. Therefore, it is necessary to figure out how the capture rate is mathematically distributed between the two sections in the hybrid systems so that the capture rate of each section can be defined individually.
CO2 capture rate for the Hybrid D1 system
For the model Hybrid D1 system (see Figure 3.8), the overall CO2 capture rate is defined as:
��� � �{�| # {�&%|�\S�T�U{�&%|][[� R 400�
# {�&%|�[\Y[_U[{�&%|][[� R {�&%|�\S�T�U
{�&%|�[\Y[_U[ R 400�
# ���~"~ R ���jI� (3.14)
[CO2]feed: CO2 flow rate in the feed gas
[CO2]product: CO2 flow rate in the product gas stream leaving the stripper
[CO2]permeate: CO2 flow rate in the permeate gas
It can be seen that the overall CO2 capture rate of the Hybrid D1 system is equivalent to the product of the two sections’ respective capture rates. Mathematically, this denotes that the overall capture is definitely lower than the individual capture rate of either section.
CO2 capture rate for the Hybrid D2 system
Concerning the model Hybrid D2 (see Figure 3.9), the CO2 capture rate of the membrane section is:
����~"~�{�| # {�&%|�[\Y[_U[�%{�&%|][[� R 400�
# {�&%|�[\Y[_U[�%{�&%|�[\Y[_U[�X R
{�&%|�[\Y[_U[�X{�&%|][[� R 400�
# ���Q' �' 5�" R ���CW�' 5�" (3.15)
, the CO2 capture rate of the MEA section is:
����jI��{�| # {�&%|�\S�T�U{�&%|][[��{�&%|�[\Y[_U�% R 400�
# ���Q' �' 5�" R ���CW�' 5�"
# {�&%|�\S�T�U{�&%|][[�R�Q���*Y[Y� R 400� (3.16)

3 Modeling of carbon capture systems and costing method
59
, the overall CO2 capture rate is calculated via:
��� � ��{�| ��# {�&%|�[\Y[_U[�%�{�&%|�\S�T�U{�&%|][[� R 400� (3.17)
, Equation 3.15, 3.16, and 3.17 combined:
��� � ��{�| ��# ���jI� � ���~"~ H ���jI� R ���~"~ (3.18)
[CO2]feed: CO2 flow rate in the feed gas
[CO2]product: CO2 flow rate in the product gas stream leaving the stripper
[CO2]permeate 1: CO2 flow rate in the permeate gas of the 1st stage membrane
[CO2]permeate 2: CO2 flow rate in the permeate gas of the 2nd stage membrane
Apparently, the mathematical relation between the total and sectional capture rates in the Hybrid D2 system is more complicated than that in the Hybrid D1 system. One thing the two designs have in common is that, given the overall capture rate, the sectional capture rates are actually interdependent from each other.
3.6.3 Costing method
Overnight construction and constant discount rate
The ‘overnight-costs’ approach is used in this thesis for estimating CAPEX. This approach assumes that a plant can be constructed in a single day [112, p. 17], i.e. the construction period is neglected. Additionally, the discount rate used in the present study is considered constant over the lifetime of a project. This approach apparently helps simplify an early-stage research-oriented assessment but is inappropriate for the costing of real projects.
Cost estimation for equipment
Since the geometric results of some components (e.g. heat exchangers, distillation towers, etc.) in the capture models are to be directly used for the economic analysis, the sizing and rating of the components must be carried out to determine the actual geometric results. It is worth noting that each of the block components that appear in the capture models is embodied and analyzed as one single unit. In other words, the sizes of the equipment in this thesis were estimated without considering the limitations of the currently available commercial products. As a matter of fact, the operation of some components in real industrial-scale CO2 capture projects have to be materialized by using multiple parallel units so that commercial equipment is available. For example, in Fluor’s design [173, 185], two absorbers and one stripper are coupled to deal with a large flow rate of flue gas.
Costing for membrane

3.7 Summary
60
In the study of Chowdhury [83], the cost of the membrane is comprised of an initial investment cost of membrane (CAPEX) and a replacement cost (OPEX) equivalent to 25 % of the initial investment cost. Clearly, this is a different approach to estimating the cost of membrane from the one used in the present study (see Table 3.9 and Table 3.12). In the approach used in this thesis, the annualized CAPEX of the membrane is calculated independently of the other equipment due to the fact that the lifetime of the membrane is shorter than the project lifetime (see Table 3.14). Therefore, an annuity factor different to the global one should be used to estimate the annualized CAPEX for the membrane and other components, respectively.
Calculation of the economic metrics for the power and steel plants
It can be seen from Table 3.13 that two different formulas are used for calculating the CO2 avoidance costs for power plants and steel plants, respectively. In spite of being in different forms, the two formulas are essentially the same and both of them represent the ratio of the incremental investments to the amount of CO2 avoided.
They are presented in different forms because the different products and scenarios are considered in the two sectors. In a power plant, it is assumed in this study that the carbon capture unit consumes internally generated power without importing any energy. Therefore, the net output of the power plant is reduced, and the amounts of CO2 avoided equals the amount of CO2 captured. Hence, the CO2 avoidance cost should be measured based on the CO2 intensity in order to distinguish it from the capture cost.
In contrast, in a steel plant, external energy is assumed to be available for supporting the operation of carbon capture units. Consequently, the production rate will not be influenced and thus the amounts of CO2 avoided and captured are different. Hence, both the capture and avoidance costs of CO2 can be calculated using the net total annual cost rather than the product cost.
Uncertainty of cost estimation
According to AACE international [186] and Towler and Sinnot [177, p. 311], cost estimates can be classified into 5 levels. The details of the classification are shown in Appendix H (Table H. 1). The cost estimation for each class corresponds to a level of maturity of the studied process, increasing from the conceptual design (Class 5) to the final detailed design (Class 1). The economic evaluation approach in this thesis is in line with the description of Class 4 (preliminary estimate). Therefore, a rough uncertainty of ± 30 % for the cost model used in the present work is expected. That said, the estimates for certain elements in CAPEX are expected to have higher accuracy as detailed designs are available.
3.7 Summary
In this chapter, the development of several CO2 capture models in Aspen Plus® has been introduced. In Section 3.1, a ‘closed loop’ MEA model was developed. The specific reboiler duty of this model has been validated against the experimental results from a pilot-scale plant.

3 Modeling of carbon capture systems and costing method
61
Section 3.2 demonstrates two membrane-based CO2 separation systems, i.e. the single-stage and the cascaded membrane systems. The mathematics behind the gas permeation module in ACM is also explained in this section. Section 3.3 displays two types of hybrid MEA/hybrid capture models. The initial specifications for all the capture models have been provided except for those that should be decided when the specific boundary condition is specified.
Section 3.4 presents a 4-stage compression train model that is used to simulate the CO2 compression process in the present study. Equal pressure ratios are assumed for all stages and the method for calculating the pressure ratio is presented.
In Section 3.5, a discounted cash flow approach is developed for the costing of the CO2 capture systems. In essence, the cost analysis for the CO2 capture is performed in three steps:
1. Purchased equipment cost 2. CAPEX & OPEX 3. Product cost, CO2 capture cost, and CO2 avoidance cost
In Section 3.6, the discussions over the newly developed hybrid capture models as well as the costing method are made. It is found that certain mathematical correlations exist between the overall CO2 capture rates and sectional CO2 capture rates in both hybrid systems. Concerning the costing method, some elements that might cause disagreement with other studies are mentioned. Moreover, it is predicted that the uncertainty of the cost analysis in the present study is around ± 30 % according to the classification of AACE.

3.7 Summary
62

63
4 Retrofitting of carbon capture systems into a coal-fired power plant
The CO2 capture models introduced in the last chapter are applied in a reference coal-fired power plant in this chapter. Section 4.1 presents the modeling process of the reference power plant as well as the boundary conditions set by the plant for the studied capture systems. Given the boundary conditions, parametric studies were conducted for the standalone MEA and membrane-based capture systems, respectively (see Section 4.2, 4.3 and 4.4). The optimized specifications obtained from the parametric studies for the standalone technologies are also used for their corresponding parts in the hybrid systems. In Section 4.5, technical evaluations for the studied capture systems are performed and the results are compared for both full and part load operations. Section 4.6 discusses the potential for reducing the efficiency penalties caused by the CO2 capture systems by optimizing the heat exchanger network (HEN). The cost estimates are illustrated in Section 4.7. Finally, discussions regarding the results attained in this chapter are made in Section 4.8. A brief structure of the workflow for this chapter is displayed in Figure 4.1.
Figure 4.1 Overview of the workflow for Chapter 4

4.1 Model of the reference power plant
64
4.1 Model of the reference power plant
4.1.1 Design basis
A conceptual coal-fired power plant is used as the target for the application of CCS. This reference power plant represents a generic 600 MW hard coal power plant in North Rhine-Westphalia, Germany [187]. It was modeled in EBSILON® Professional 13 according to the provided design parameters. The power plant model can be divided into two parts based on the types of streams flowing inside: 1) Water-steam cycle, 2) Fuel-flue gas route.
Major technical features of the reference power plant:
� Gross output: 600 MW � Net output: 555 MW � Boiler type: tower boiler with vertical piping � Live steam parameters: 285 bar/600 ºC/620 ºC � Condensing pressure: 45 mbar � Feedwater final temperature: 303.4 ºC
Water steam cycle
The layout of the cycle, which is based on a design of SIEMENS AG, is presented in Figure 4.2. The live steam works sequentially in the high-pressure (HP), intermediate-pressure (MP), and low-pressure (LP) turbines with reheating after the HP turbine. The feedwater is heated using extracted steam through a series of preheaters. 8 steam extraction ports exist, which are connected to feed water preheaters.
Major components:
� Steam generator � Steam turbines: HP, IP, LP � Condenser � Water pump � Feedwater preheater: 4 LP preheaters, 3 HP preheaters � Deaerator � Desuperheater and aftercooler � Power generator

4 Retrofitting of carbon capture systems into a coal-fired power plant
65
GIPT LPT
Condenser
Condensate pum
p
LP-PH 1/2LP-PH 3LP-PH 4Feed water tank / deaerator
Feed water pump
HP-PH 1
HP-PH 2
HP-PH 3
Desuperheater
Steam generator HPT
Figure 4.2 Plan of the water-steam cycle
The inlet parameters of the steam for each stage of the turbine are summarized in Table 4.1.
Table 4.1 Inlet parameters of turbines and condenser
Component p [bar] T [ºC] h [kJ/kg] m [kg/s]
HP turbine 285 600 3461.0 436.03
MP turbine 60 620 3705.8 359.58
LP turbine 5.49 269 2999.8 313.39
Condenser 0.045 Dryness: 0.8952 2303.0 257.52
Fuel/flue gas route
The plan of the fuel-flue gas route is displayed in Figure 4.3. The coal is ground to powders in the coal mill. The primary air can dry the coal powders and meanwhile deliver them into the furnace. In addition to the commonly used air preheater, heat from the water-steam cycle is also utilized to preheat the air. The flue gas leaving the furnace will go through several purification units before it is emitted from the stack.
Major components:

4.1 Model of the reference power plant
66
WFGD
Furnace
Ash Coalmill Primary air
preheater
Airpreheater
SCRElectrostaticprecipitator
Fan
FanSecondary airpreheater
� Furnace/combustion chamber � Coal mill � SCR � Air preheater � Electrostatic precipitator � Fan � WFGD
Figure 4.3 Plan of the fuel-flue gas route
Post-combustion CO2 capture models are placed after the WFGD unit and before the stack. It is postulated that all the purification units plus the scrubbers employed in the capture systems are able to get rid of all of the acidic gases, such as NOx and SOx. The information of the flue gas at full load is shown in Table 4.2. The hard coal of “Klein Kopje” is used as the fuel in the simulation. The elemental analysis of the hard coal can be found in Appendix F.
Table 4.2 Characteristics of the flue gas
Flue gas condition Unit Value
Pressure bar 1.05
Temperature ºC 50
Flow rate kmol/h 70670
Gas composition Mole fraction
CO2 mol% 13.5
N2 mol% 70.1
O2 mol% 3.7
H2O mol% 11.9
Ar mol% 0.8

4 Retrofitting of carbon capture systems into a coal-fired power plant
67
4.1.2 Modeling and validation
Modeling
Given the information summarized in the last section, the power plant model was developed in EBSILON® Professional 13. The water-steam and fuel-flue gas sections were built up respectively and then connected. The screenshot of the complete power plant model is presented in Figure 4.4.
Figure 4.4 Topology of the reference coal-fired power plant model
Two modes exist in the EBSILON® simulation tool: Design mode and Off-Design mode. The differences between the two modes are as follows:
Design mode: How to build a power plant
� Specifying parameters for components � Performing calculation in rated condition � Taking over the nominal values � Preparing for off-design calculation
Water steam cycle
Flue gas

4.1 Model of the reference power plant
68
Off-Design mode: how to operate a power plant
� Part load operation � Stodola’s law [188] applies in turbines � Model run in sub-profiles
Therefore, the power plant model working at full load was first built in the Design mode and examined under the rated condition. The boiler is embodied in two components in the model: steam generator and combustion chamber. One logical line connects the two blocks and a controller is used to transfer the caloric value from the combustion chamber to the water-steam cycle. Despite this logical connection, a stream of LP steam and a fraction of feed water at the outlet of the deaerator are designed to preheat the air two air preheaters in addition to the other two air preheaters using the heat of the flue gas.
As can be seen in Figure 4.4, the three turbines are represented by several turbine blocks. The division was made according to the actual steam extraction ports as the parameters at those ports are clear. What should be noted here is that the isentropic efficiencies of the turbines are not given. Hence, the efficiency of each turbine at full load must be calculated by the target-oriented method. In other words, once the inlet and outlet parameters of turbines are specified, the efficiency of each turbine block would be computed automatically to meet the fixed condition. This method also applies to other components. Then, these calculated results can be used to validate against the literature.
Validation
To validate the calculated results of the power plant model against the data obtained from the literature, a comparison is made regarding the electric output and flue gas data (see Table 4.3). In general, the simulation results agree well with the literature data, especially with respect to the electric output and coal demand. Comparatively, the simulation results of the flue gas have larger deviations. Therefore, the literature data is used as the input values for the simulation of the CO2 capture systems.
Table 4.3 Validation of the power plant model
Literature [187] Present study
Gross output [MWe] 600 598
Coal mass flow [kg/s] 48.5 47.97
Heat input by fuel (Qinput) [MWth] 1210 1210
Flue gas
Flue gas flow rate [m3/s] 444.4 461.5
P [bar] 1.05 1.005

4 Retrofitting of carbon capture systems into a coal-fired power plant
69
Table 4.3 continued
T [ºC] 50 46.5
CO2 [mol %] 13.5 14.8
O2 [mol %] 3.7 2.5
N2 [mol %] 70.1 71.2
H2O [mol %] 11.9 10.3
Ar [mol %] 0.8 0.85
4.1.3 Power loss and efficiency penalty
Once the CO2 capture unit is coupled with the power plant, the efficiency of the power plant will inevitably be reduced due to the fact that part of the power output is used to support the operation of the CO2 capture unit. What should be emphasized is that the fuel input rate is assumed to be constant at full load with or without carbon capture in the present thesis. That is to say, the net output of the reference power plant with carbon capture is lower than without. Generally, the power loss caused by the CO2 capture system can be classified into 3 parts:
1) Wsteam: power loss due to the extracted steam, 2) We: power consumed by the auxiliary equipment in CO2 capture systems, 3) Wcomp: power consumed by the CO2 compression train.
The total power loss is the sum of the three parts:
Wtot= Wsteam + We + Wcomp . (4.1)
As introduced in Section 2.2, Wsteam is related to the regeneration energy calculated in the MEA system and its calculation involves a conversion of thermal energy to electric energy. This conversion can only be achieved by integrating the MEA system into the water-steam cycle.
The efficiency penalty of the power plant is defined as the efficiency difference between the efficiency of the power plant with and without CO2 capture systems:
Δη = ηref - ηccs = Wtot,/Qinput . (4.2)
4.2 Parametric study for the MEA system
With the boundary condition set by the reference power plant, parametric studies were first made to examine the impacts of some important operating parameters on the MEA system. Some very important parameters including the CO2 lean loading, column packing height, and CO2 concentration in the flue gas were close checked so as to understand the characteristic of

4.2 Parametric study for the MEA system
70
0
2
4
6
8
10
12
0.16 0.18 0.20 0.22 0.24 0.26 0.28 0.30 0.32 0.34
Spec
ific
rebo
iler
duty
[GJ/
t CO
2]
CO2 lean loading [mol CO2/mol MEA]
Aspen
Equation-based
the MEA system and determine the optimal specifications. The initial specifications of the MEA system have already been summarized in Section 3.1 (see Table 3.1 and Table 3.2).
4.2.1 Influence of the CO2 lean loading
One important factor that would affect the energy consumption of the MEA technology is the CO2 lean loading. As introduced in Chapter 1, the CO2 lean loading refers to the CO2 loading in the initial MEA solvent (see Appendix A). The default value is 0.28 mol CO2/mol MEA. It was varied from 0.16 to 0.34, with an interval of 0.2, to find out which value leads to the least energy consumption. In addition to the simulation results, the results calculated by Equation 2.3 are also plotted on the same figure as a comparison as shown in Figure 4.5.
In general, the equation-based results are in good agreement with the simulation results. It can also be seen that the manually calculated results according to Equation 2.3 are slightly lower than the simulation results from Aspen.
Figure 4.5 Specific reboiler duty as a function of the CO2 lean loading
In terms of the trend of the curves, the specific regeneration energy drops dramatically as the CO2 loading is increased from 0.16 to 0.26 mol CO2/mol MEA. Afterward, the energy consumption begins to climb slowly as the CO2 loading is further increased. Therefore, the lowest energy consumption occurs at the CO2 loading of 0.26 mol CO2/mol MEA.
It has been introduced in Chapter 2 that the specific reboiler duty is essentially comprised of three parts: qsens, qvap,H2O, qabs,CO2. In order to figure out the reasons why the curves change in such a pattern in Figure 4.5, the regeneration energy must be broken down to investigate how each of the 3 parts changes as a function of the CO2 lean loading. Nevertheless, the simulation results only provide the aggregate specific regeneration energy in the reboiler. Hence, Equation 2.4 to 2.6 are used to break down the aggregate regeneration energy. What should be noted

4 Retrofitting of carbon capture systems into a coal-fired power plant
71
0
1
2
3
4
5
6
7
0.18 0.20 0.22 0.24 0.26 0.30 0.32 0.34
Spec
ific
rebo
iler
duty
[GJ/
t CO
2]
CO2 lean loading [mol CO2/mol MEA]
qsen
qvap,H2O
qabs,CO2
qsen
qvap,H2O
qabs, CO2
here is that only the equation-based calculated regeneration energy is broken down using this method. However, any conclusions drawn from the equation-based results can be applied to the simulation results as they have proven to agree well with each other.
It should also be noted that not all variables in Equation 2.4, 2.5 and 2.6 can be directly taken from the MEA model in Aspen Plus®. Three vital variables, Δhabs,CO2, Cp,L, and Δhvap,H2O, need to be estimated using the regression functions based on experimental results from the literature. The detailed estimation process is demonstrated in Appendix B. In Figure 4.6, the value of each contribution to the total regeneration energy is plotted against the CO2 lean loading.
Figure 4.6 Breakdown of the MEA regeneration energy
It is observed that the heat of CO2 absorption (qabs,CO2) barely changes as the loading is increased. This proves that the initial CO2 loading in the MEA solution has little effect on the specific regeneration energy. The conclusion corresponds to the fact introduced in Chapter 2 that the heat of absorption of CO2 is an innate property of absorption solvents.
Meanwhile, the heat for regenerating stripping steam (qvap,H2O) declines dramatically as the CO2 lean loading is increased. Only after the loading value is higher than 0.28 mol CO2/mol MEA has qvap,H2O become relatively stable. To analyze the variation of qvap,H2O, the CO2 loading difference between the rich and lean loadings and flowrate of MEA solution are plotted as a function of the CO2 lean loading in Figure 4.7.
It can be seen that as the lean loading is increased, the CO2 loading difference becomes smaller, which indicates that the specific capacity of the MEA solvent for CO2 absorption gets smaller. This is attributed to the fact that the rich loading is constrained by the stoichiometry of the reaction 2.a and 2.b. Therefore, increasing the CO2 lean loading would result in a decrease in the loading difference. As a result of the reduced specific CO2 absorption capacity, the flowrate of the MEA solution must be increased to maintain the CO2 capture rate.

4.2 Parametric study for the MEA system
72
Figure 4.7 MEA solvent flowrate and CO2 loading difference as a function of CO2 lean loading
It should be kept in mind that qvap,H2O represents the part of the energy that provides the partial pressure between the CO2-loaded solution and stripping vapor [66]. This partial pressure drives the CO2 in the solution towards the vapor going upwards in the stripper. A higher CO2 loading difference denotes that more CO2 needs to be stripped from the CO2-loaded solution. Consequently, higher energy is consumed in the reboiler to generate more stripping steam. This conclusion can be substantiated by the boil-up ratio curve plotted in Figure 4.8. It is noticed that the boil-up curve is similar to the qvap,H2O curve in Figure 4.6. As a result, qvap,H2O has greater values at low CO2 lean loadings. After the loading difference is smaller than 0.25 mol CO2/mol MEA, the change of qvap,H2O is negligible.
With respect to the sensible heat (qsen), as shown in Figure 4.6, it first declines as the CO2 loading is varied from 0.16 to 0.24 mol CO2/mol MEA. As mentioned previously, the sensible heat is to lift the temperature of the CO2-loaded solution entering the stripper (Tfeed.strip) to the temperature in the reboiler (Treb).
It can be seen from Figure 4.8 that the inlet temperature increases rapidly as the loading is changed from 0.16 to 0.24 mol CO2/mol MEA. Moreover, since the temperature in the reboiler is fixed at 120 ºC, the temperature change from the inlet to the reboiler (Treb - Tfeed.strip) gets smaller with the increased CO2 lean loading. Therefore, at low CO2 lean loadings (< 0.24 mol CO2/mol MEA), qsen drops due to the decreased temperature change.
Afterward, the flowrate of MEA solution increases significantly as shown in Figure 4.7. Meanwhile, the temperature change basically remains unchanged after the loading is higher than 0.26 mol CO2/mol MEA. As a result, qsen gets larger in order to deal with the increased amount of solution. In a word, the temperature is the dominant factor for qsen at low CO2 lean loadings while the dominant factor becomes the flowrate of the MEA solution at high CO2 lean loadings.
0
0.05
0.1
0.15
0.2
0.25
0.3
0.35
0.4
0
50
100
150
200
250
300
350
400
450
500
0.16 0.18 0.2 0.22 0.24 0.26 0.28 0.3 0.32 0.34
CO
2lo
adin
g di
ffer
ence
[mol
CO
2/mol
MEA
]
MEA
flow
rat
e[1
03km
ol/h
]
CO2 lean loading [mol CO2/mol MEA]
MEA solution
flowrate
CO₂ loading
difference

4 Retrofitting of carbon capture systems into a coal-fired power plant
73
0
0.1
0.2
0.3
0.4
0.5
0.6
0.7
90
95
100
105
110
115
0.16 0.18 0.2 0.22 0.24 0.26 0.28 0.3 0.32 0.34
Boil-
up ra
tio
Stri
pper
inle
t tem
pera
ture
[ºC]
CO2 lean loading [mol CO2/mol MEA]
Stripper inlettemperatureBoilup ratio
Figure 4.8 Stripper inlet temperature and boil-up ratio as a function of CO2 lean loading
As a result of the respective change of qsens, qvap,H2O, and qabs,CO2 over the CO2 lean loading, the aggregate regeneration energy are formed as shown in Figure 4.5. The CO2 lean loading of 0.26 mol CO2/mol MEA is chosen as the optimal lean loading value for the MEA system.
4.2.2 Influence of the column packing height
This section investigates the influences of the packing heights of the absorber and stripper on the reboiler duty of the MEA system. For this purpose, the absorber packing height was varied from 11 to 25 m and the stripper packing height was varied from 2 to 15 m, respectively, both with a step of 1 m. The specific reboiler duty with the varied packing heights of the absorber and stripper are shown in Figure 4.9 and Figure 4.10, respectively.
It can be found that increasing the packing heights of both columns results in reducing the thermal energy consumption. Increasing the packing height of the absorber would make the energy consumption drop from 5.38 GJ/tCO2 at 11 m to 3.76 GJ/tCO2 at 25 m. This is because the mass transfer area between the liquid and gas/vapor would increase as the packing heights increase in both columns. In other words, the CO2 absorption process in the absorber and the stripping process of CO2 in the stripper are enhanced when the packing heights are increased.
However, the packing height is limited by manufacturing ability and costs. Also, it is observed that the reduction of energy consumption is less obvious very after the absorber packing height is higher than 19 m. Likewise, after the stripper packing height is higher than 10 m, the energy consumption basically remains constant. Therefore, it is neither realistic nor economical to increase the packing heights of both columns to very high values. As of this section, the packing height of the absorber is maintained at the initial value (20 m) while the packing height of the stripper is varied from the initial value (15 m) to 10 m, a height that gives the least specific reboiler duty.

4.2 Parametric study for the MEA system
74
3.7
3.8
3.9
4
4.1
4.2
4.3
4.4
2 3 4 5 6 7 8 9 10 11 12 13 15
Spec
ific
rebo
iler
duty
[GJ/
t CO
2]
Stripper packing height [m]
Figure 4.9 Specific reboiler duty as a function of the absorber packing height
Figure 4.10 Specific reboiler duty as a function of the absorber packing height
4.2.3 Influence of CO2 concentration in the flue gas
The CO2 concentration in the flue gas is investigated for its influence on the reboiler duty. The input CO2 concentration into the MEA system was varied from 10 to 80 mol %. The absolute amount of CO2 was kept constant, which equals the amount of CO2 emission of the reference power plant. The CO2 concentration was changed by varying the total flue gas flow rate. The resulting flue gas flow rates are presented in Table 4.4.
3
3.5
4
4.5
5
5.5
11 12 13 14 15 16 17 18 19 20 21 22 23 24 25
Spec
ific
rebo
iler
duty
[GJ/
t CO
2]
Absorber packing height [m]

4 Retrofitting of carbon capture systems into a coal-fired power plant
75
3.4
3.5
3.6
3.7
3.8
3.9
4
4.1
4.2
10 20 30 40 50 60 70 80
Spei
fic r
eboi
ler
duty
[GJ/
t CO
2]
CO2 concentration [mol %]
Table 4.4 Flue gas flow rate
CO2 concentration
[mol %] 10 20 30 40 50 60 70 80
Flue gas flow rate
[kmol/h] 94463 47731 31821 23866 19093 15910 13638 11933
The specific reboiler duty as a function of the CO2 concentration is plotted in Figure 4.11. As the CO2 concentration is increased from 10 mol%, a dramatic drop in the specific reboiler duty has been witnessed. Nonetheless, the reboiler duty basically levels off after the concentration is beyond 40 mol%.
Figure 4.11 Specific reboiler duty as a function of the CO2 concentration in the flue gas
In addition, the correlation between the specific reboiler duty and the required flow rate of the MEA solution is shown in Figure 4.12. Also, the range of CO2 concentration is indicated on the same plot. It is found that there is a linear relationship between the specific reboiler duty and the required flow rate of the MEA solution. However, note that this relationship exists under the condition that the amount of CO2 dealt with is constant. According to this linear relationship, lower CO2 concentration not only leads to higher specific reboiler duty but also a higher flow rate of the MEA solution. Consequently, higher electric energy is consumed by pumps in the MEA system.
Figure 4.12 is very straightforward to show that the decreased values of the MEA solution flow rate and specific reboiler duty due to the incremental CO2 concentration become less and less as the CO2 concentration is increased.

4.2 Parametric study for the MEA system
76
Figure 4.12 Specific reboiler duty as a function of the MEA solution flow rate
4.2.4 Summary
After the parametric study, some operating parameters of the MEA system have been optimized so that the capture system can run under with a lower specific reboiler duty. The specifications and results before and after optimization are tabulated in Table 4.5. The MEA system is only operated under the optimized specifications in the following sections.
Table 4.5 Summary of optimized specifications
Unit Initial Optimized
Absorber height m 20 20
Stripper height m 15 10
CO2 lean loading mol CO2/mol MEA 0.28 0.26
Specific reboiler duty GJ/tCO2 4.00 3.94
In addition, some facts are uncovered:
� Key fact 1: There exists an optimal CO2 lean loading that can lead to the least specific reboiler duty
� Key fact 2: The reduction of the specific reboiler duty of the MEA system is insignificant when the CO2 fraction in the flue gas is higher than 40 mol%.

4 Retrofitting of carbon capture systems into a coal-fired power plant
77
4.3 Integration of the MEA system into the water-steam cycle
After the optimization of the specifications of the MEA system, the next question that needs to be addressed is how to integrate the MEA system into the water-steam cycle of the power plant. To convert thermal energy consumption to electricity consumption and, subsequently, investigate the impacts of the addition of the CO2 capture unit on the power plant, the integration of the MEA system into the power plant is indispensable. The general considerations for the integration of MEA system into a water-steam cycle have been introduced in Chapter 2 (see Section 2.2). Since the integration in the present study is focusing on retrofitting to an existing power plant, the location of the steam extraction in the water-steam cycle should be analyzed specifically due to distinct operating conditions and specifications in different cases.
4.3.1 Quality and quantity of extracted steam
To determine the extraction location, the required quality and quantity of the extracted steam for the MEA system in the present study must be sorted out, respectively.
Quality
The quality of the steam mainly refers to the pressure and temperature of the extracted steam. In utilizing the extracted steam, heat exchange happens between the steam and MEA solution in the kettle reboiler. Normally, the steam flows inside the tubes while the MEA solution and generated vapor flow outside of the tubes. During this process, the temperatures on both sides are considered to remain constant. To meet this description, all substances in the reboiler are in their saturated state. In other words, the steam should enter the reboiler in the state of saturated steam and exit in the state of saturated water. The latent heat of the steam is utilized. Under the assumption that the temperature difference between the hot and cold sides in the reboiler is constant at 10 ºC, the temperature of the steam can be calculated simply by adding 10 ºC to the reboiler temperature which is initially set at 120 ºC. As a result, the temperature of the steam should be 130 ºC. Furthermore, as the steam is in the saturated state, the corresponding saturation pressure is 2.7 bar according to the water-steam table. When a pressure-drop of 10 % is considered for the steam transport in the pipeline from the extraction point to the reboiler, the pressure of the extracted steam should be at least 3 bar.
Quantity
The quantity of steam is related to the MEA regeneration energy demand in the reboiler and the quality of the steam. Given the optimized specifications of the MEA system and the boundary condition set by the reference power plant, the regeneration energy is calculated to be 413 MWth for capturing 90 % of CO2. Since the enthalpy of the saturated steam and water at 130 ºC can be looked up in the steam table, the mass flow rate of the extracted steam can be primarily estimated under the assumption that the steam is extracted exactly at 3 bar, 130 ºC. The results are tabulated in Table 4.6.
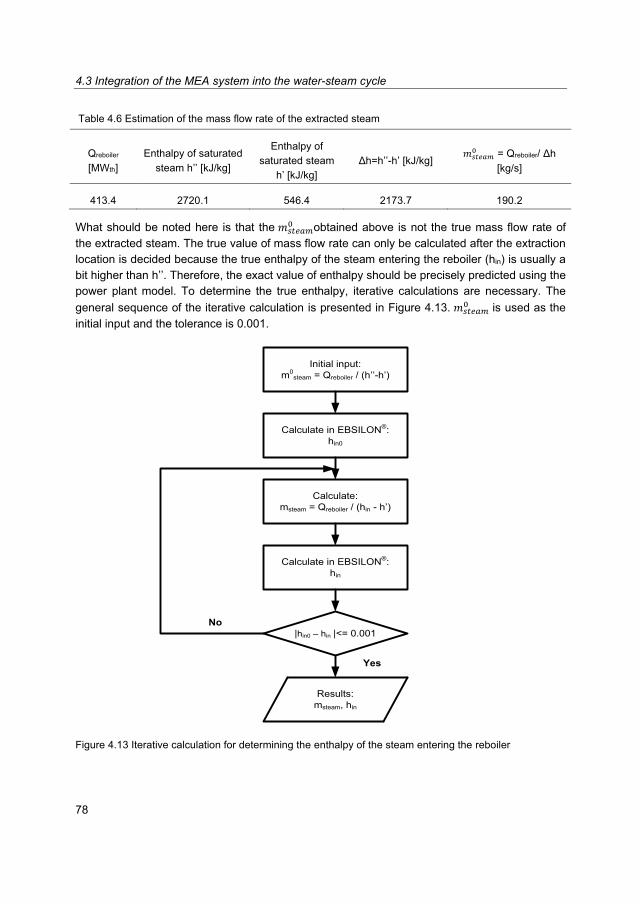
4.3 Integration of the MEA system into the water-steam cycle
78
Initial input:m0
steam = Qreboiler / (h’’-h’)
Calculate in EBSILON®:hin0
|hin0 – hin |<= 0.001
Calculate:msteam = Qreboiler / (hin - h’)
Calculate in EBSILON®:hin
Results:msteam, hin
No
Yes
Table 4.6 Estimation of the mass flow rate of the extracted steam
Qreboiler [MWth]
Enthalpy of saturated steam h’’ [kJ/kg]
Enthalpy of saturated steam
h’ [kJ/kg] Δh=h’’-h’ [kJ/kg]
�' "5~w = Qreboiler/ Δh [kg/s]
413.4 2720.1 546.4 2173.7 190.2
What should be noted here is that the �' "5~w obtained above is not the true mass flow rate of the extracted steam. The true value of mass flow rate can only be calculated after the extraction location is decided because the true enthalpy of the steam entering the reboiler (hin) is usually a bit higher than h’’. Therefore, the exact value of enthalpy should be precisely predicted using the power plant model. To determine the true enthalpy, iterative calculations are necessary. The general sequence of the iterative calculation is presented in Figure 4.13. �' "5~w is used as the initial input and the tolerance is 0.001.
Figure 4.13 Iterative calculation for determining the enthalpy of the steam entering the reboiler

4 Retrofitting of carbon capture systems into a coal-fired power plant
79
IPT LPTSteam
generator HPT
HPsteam
IPSteam LP
steam
B A C D E F G H
4.3.2 Determination of steam extraction location
As the power plant model has been built, the potential locations for steam extraction have manifested themselves. Taking a closer look at the steam turbines, we can find that there are 11 possible choices, whose locations and parameters are displayed in Figure 4.14 and Table 4.7, respectively. Of the 11 possible choices, 3 of them are extracting steam from the connecting pipes between turbines (HP, IP, and LP). The rest are using the existing extraction ports leading to the feedwater preheaters.
Figure 4.14 Existing steam extraction ports on turbines
Based on the temperature requirement discussed in the last section, all locations but G and H are suitable. In principle, the temperature should be as close to 130 ºC as possible so that less energy loss is entailed. Therefore, location E, LP, and F fit better than others. Furthermore, locations E and F are ruled out considering the required mass flow rate of steam (193 kg/s). It can be seen from Table 4.7 that the designed mass flow rates at port E and F are much less than the required value. In other words, the existing pipes at the two ports would not permeate considerably increased mass flow rate. Hence, the LP steam, i.e. the IP/LP crossover pipe is the only feasible option for the present study.
Table 4.7 Parameters of possible steam extraction ports
HP A B IP C D E LP F G H
Pressure [bar]
285.0 88.5 64.0 60.0 26.0 12.5 5.55 5.5 3.5 1.1 0.2
Temperature [ºC]
600.0 406.2 360.4 620.0 482.3 373.3 269.4 269.4 222.2 113.9 62.6
Flowrate [kg/s]
436 23 50 360 19 19 10 313 23 22 12

4.3 Integration of the MEA system into the water-steam cycle
80
Permeate gas
40°C,
1.05bar
Reboiler
Absorber Stripper
30wt% MEASolution
40°C, 1.05bar
Rich-loading pump
Lean-loading pump
Rich-lean Heat
Exchanger
Cooler
WashingCondenser
To CO2 compression
Makeup water and
solvent
To makeup system
Throttle
PMV
A
IPT
4.3.3 Implementation of integration
The schematic configuration of the integration is displayed in Figure 4.15. Steam is extracted at the IP/LP crossover pipe and directed to the reboiler. The condensate of the reboiler is sent back to the deaerator to keep the mass balance of water in the water-steam cycle. The detailed simulated integration in EBSILON® can be found in Appendix E (see Figure E. 4), in which an energy consumer represents the reboiler.
Figure 4.15 Integration of the MEA system into the reference power plant
It can be found in Table 4.7 that the temperature of the steam at the crossover pipe (269.4 ºC) is higher than 130 ºC, being far off the designed operating condition in the reboiler. Therefore, in

4 Retrofitting of carbon capture systems into a coal-fired power plant
81
order to avoid potential fouling of the reboiler, a heat exchanger is installed to desuperheat the extracted steam the condensate of the reboiler is used as the coolant. In doing so, the demand for the amount of extracted steam to the deaerator is reduced due to the elevated temperature of the condensate from the reboiler.
Pressure control measures
Note that the nominal pressure at the IP/LP crossover pipe of the reference power plant is 5.5 bar, which is higher than the required pressure of the extracted steam. Moreover, it can be inferred that the pressure at the extraction point will drop according to Stodola’s law [188] after a certain amount of steam is extracted. Therefore, in EBSILON®, the integrated system must be simulated in the off-design mode so that the change of pressure can be realized via simulation.
It can also be predicted that 3 situations are likely to happen after the steam extraction:
1) The pressure drops exactly to the target value (3 bar); 2) The pressure at the extraction point is still higher than the target value; 3) the pressure at the extraction point drops to below the target value.
Out of question, the first case would be the best situation wherein no extra pressure control measures need to be taken. For the second and third cases, extra pressure control measures are necessary. In order to cope with variable amounts of extracted steam, two pressure control components are used, i.e. a throttle and a pressure control valve (PCV) according to the lesson learned in Chapter 2. The throttle is placed on the pipe leading from the extraction point to the reboiler while the control valve is put between the extraction point and the inlet of LPT. Their placements are also displayed in Figure 4.15
The throttle is used to handle the second situation, i.e. it can throttle the pressure at the extraction port, when the pressure is higher than the target value, down to the required pressure. As discussed in Chapter 2, two options concerning the operation researchers of the pressure control valve are commonly used [65, 66]:
� Scenario 1: the pressure control valve is activated only when the pressure at the extraction point drops to below the target value. In this case, the pressure at the extraction point would be maintained exactly at the required pressure and thus the throttle does not need to function. In other words, the pressure at the extraction point is allowed to float between 5.5 bar and the required pressure of the extracted steam.
� Scenario 2: the pressure control valve is adjusted to maintain the pressure of the extraction point at the nominal pressure (5.5 bar), regardless of how much steam is extracted. Thus, the throttle is always activated to decrease the pressure of the extracted steam.
Using the calculation method introduced above, the actual required mass flow rate of the extracted steam for supporting the MEA system is calculated to be 188.8 kg/s. Given this amount of steam, it turns out that the pressure at the IP/LP crossover pipe would decline to

4.3 Integration of the MEA system into the water-steam cycle
82
1.83 bar. Therefore, the pressure control valve needs to be operated to lift the pressure in either scenario. The efficiency penalties caused by the two pressure control scenarios were calculated using Equations 4.1 and 4.2 and the results are displayed in Table 4.8.
Table 4.8 Comparison of two pressure control scenarios
Unit w/o MEA Scenario 1 Scenario 2
Net output MWe 555 477.8 452.7
Efficiency penalty of the power plant
%-pts / 10.9 12.9
Specific enthalpy at extraction point
kJ/kg 2997.6 2869.7 2995.8
Temperature at extraction point
ºC 268.3 201.8 267.5
It is apparent that scenario 1 causes less efficiency penalty than scenario 2. 25.1 MWe is recovered by allowing for a floating backpressure of the IP turbine. Additionally, it is also found that scenario 1 will lead to a greater change of operating parameters at the IP/LP crossover pipe. Hence, in actual operation, the last few stages of blades in the IP turbine must be designed to stand the varied backpressure and temperature. Since the present study is conducted only from a perspective of energy consumption, scenario 1 is chosen as the pressure control strategy in this thesis.
4.3.4 Impacts of the integration on the steam turbines
Since it is already revealed that, as shown in Table 4.8, scenario 1 of the pressure control causes changes in operating parameters at the IP/LP crossover pipe. It is of great significance to see, consequently, what impacts on the operation of turbines would be.
The enthalpy-entropy (h-s) diagrams of steam flowing through the 3 stages of turbines are investigated. Figure 4.16 demonstrates the h-s diagram of the steam in the base case, without the MEA system. The black curves ‘HP Inlet-B’, ‘IP Inlet-E’, and ‘E-LP Exit’ stand for the h-s curves of the steam in the HP, IP, and LP turbines, respectively. The vertical distance of each curve equals the specific enthalpy change. The break between the points B and IP Inlet is caused by the reheating. The parameters of the steam in the IP and LP turbines are continuous. The point E is the boundary between the medium and low-pressure turbines with a nominal pressure of 5.5 bar. This is where steam is designed to be extracted in the present work.

4 Retrofitting of carbon capture systems into a coal-fired power plant
83
Figure 4.16 h-s diagram of steam without the MEA system
The h-s diagram of steam with the addition of the MEA system is plotted in Figure 4.17. The red curves stand for the h-s diagram of the steam after the MEA is integrated. Due to the fact that the steam extraction is conducted between the IP and LP turbines, the HP curves of the cases with and without MEA overlap each other. The control valve is operated to keep the pressure at 3 bar. As a result, the outlet pressure of the IP turbine drops from 5.5 to 3 bar.
Notably, the condensing pressure barely changes before and after the MEA system is integrated. Consequently, a power shift occurs between the IP and LP turbines, i.e. more power is generated in the IP turbine while less power generated in the LP turbine as indicated in Figure 4.17. It can be reasoned that the power loss in the LP turbine is comprised of two parts: 1) decreased mass flow rate of steam; 2) decreased specific enthalpy change. Essentially, the LP turbine will be working at part load when the MEA system is in operation. In the IP turbine, the mass flow rate of the steam remains constant whereas the steam expands more than in the base case owing to the decreased backpressure. This denotes that the volume of the steam at the last few stages of blades in the IP turbine will expand more than it is designed to.
Also, there is found to be a break of the red curve, namely a horizontal shift from the black curve to the red curve. This is caused by the addition of the pressure control valve. To investigate the consequences of this break, a blue curve representing the case in which the MEA system is integrated without activating the pressure control valve is plotted in Figure 4.18. This blue curve is plotted to compare with the case in which pressure control valve is used. In fact, it is impossible to get the steam with the required quality without using the pressure control valve. Hence, this plot is only to elucidate the impacts of the control valve.
w/o MEA
5.5 bar
HP Inlet
B
IP Inlet
E
LP Exit
HP
IP
LP
3750
3550
3350
3150
2950
2750
2550
2350
2150
6.0 6.2 6.4 6.6 6.8 7.0 7.2 7.4 7.6 7.8
A
C
D
F
G
H
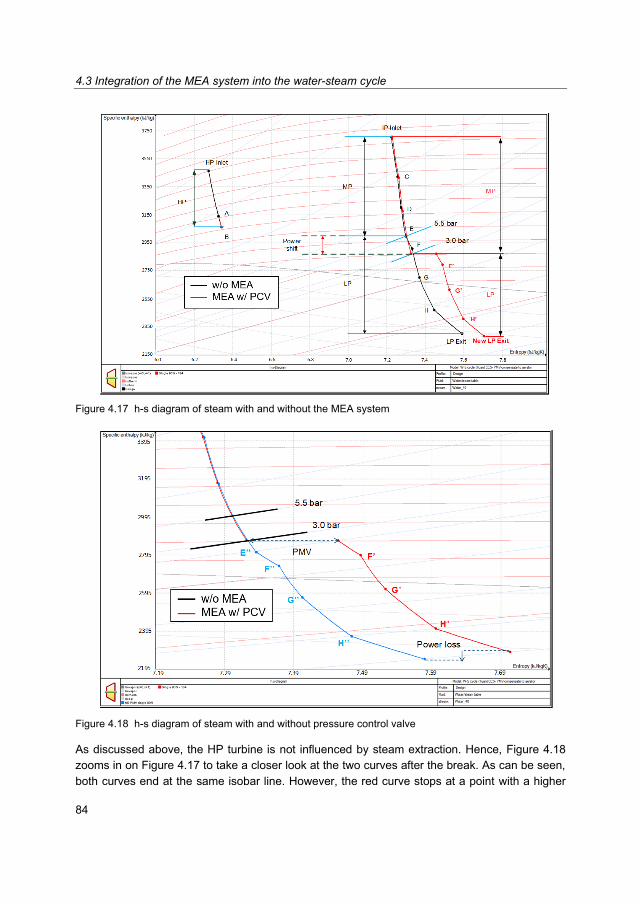
4.3 Integration of the MEA system into the water-steam cycle
84
Figure 4.17 h-s diagram of steam with and without the MEA system
Figure 4.18 h-s diagram of steam with and without pressure control valve
As discussed above, the HP turbine is not influenced by steam extraction. Hence, Figure 4.18 zooms in on Figure 4.17 to take a closer look at the two curves after the break. As can be seen, both curves end at the same isobar line. However, the red curve stops at a point with a higher

4 Retrofitting of carbon capture systems into a coal-fired power plant
85
enthalpy value. Therefore, a throttling loss, denoted by the vertical distance between G and H, is caused by activating the pressure control valve.
4.3.5 Impacts of the reboiler temperature
Several operating parameters have been optimized via the parametric study. Another factor that would influence the energy consumption of the MEA system is the reboiler temperature. This parameter determines the approach for the integration of the MEA system and thus relates the thermal regeneration energy to the electric energy demand. Owing to this fact, this parameter has direct impacts on both the MEA system and the power plant.
In this section, the temperature was varied from 95 to 130 ºC with a step of 5 ºC to investigate how the reboiler temperature would influence the regeneration energy. Furthermore, due to the fact that the reboiler temperature directly influences the quality and quantity of the extracted steam and consequently determines the efficiency penalty caused by the CO2 capture unit, the efficiency penalty is also plotted over the temperature range for evaluation. The results are displayed in Figure 4.19.
Figure 4.19 Specific regeneration energy and efficiency penalty as a function of the reboiler temperature
Figure 4.19 indicates that the specific reboiler duty of the MEA system descends all the way down as the temperature rises. There is a similar decreasing tendency for the curve of the
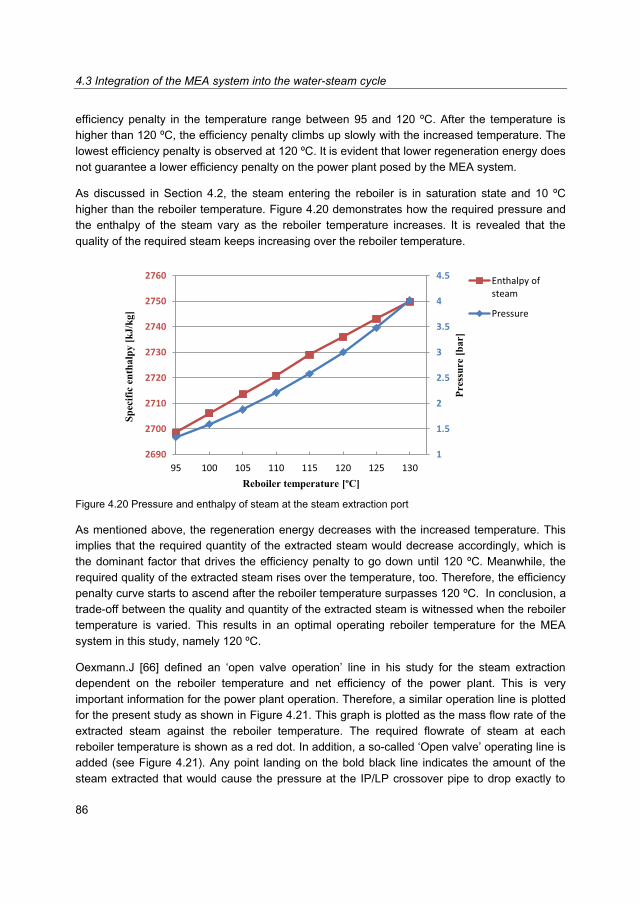
4.3 Integration of the MEA system into the water-steam cycle
86
1
1.5
2
2.5
3
3.5
4
4.5
2690
2700
2710
2720
2730
2740
2750
2760
95 100 105 110 115 120 125 130Pr
essu
re [b
ar]
Spec
ific
enth
alpy
[kJ/
kg]
Reboiler temperature [ºC]
Enthalpy ofsteam
Pressure
efficiency penalty in the temperature range between 95 and 120 ºC. After the temperature is higher than 120 ºC, the efficiency penalty climbs up slowly with the increased temperature. The lowest efficiency penalty is observed at 120 ºC. It is evident that lower regeneration energy does not guarantee a lower efficiency penalty on the power plant posed by the MEA system.
As discussed in Section 4.2, the steam entering the reboiler is in saturation state and 10 ºC higher than the reboiler temperature. Figure 4.20 demonstrates how the required pressure and the enthalpy of the steam vary as the reboiler temperature increases. It is revealed that the quality of the required steam keeps increasing over the reboiler temperature.
Figure 4.20 Pressure and enthalpy of steam at the steam extraction port
As mentioned above, the regeneration energy decreases with the increased temperature. This implies that the required quantity of the extracted steam would decrease accordingly, which is the dominant factor that drives the efficiency penalty to go down until 120 ºC. Meanwhile, the required quality of the extracted steam rises over the temperature, too. Therefore, the efficiency penalty curve starts to ascend after the reboiler temperature surpasses 120 ºC. In conclusion, a trade-off between the quality and quantity of the extracted steam is witnessed when the reboiler temperature is varied. This results in an optimal operating reboiler temperature for the MEA system in this study, namely 120 ºC.
Oexmann.J [66] defined an ‘open valve operation’ line in his study for the steam extraction dependent on the reboiler temperature and net efficiency of the power plant. This is very important information for the power plant operation. Therefore, a similar operation line is plotted for the present study as shown in Figure 4.21. This graph is plotted as the mass flow rate of the extracted steam against the reboiler temperature. The required flowrate of steam at each reboiler temperature is shown as a red dot. In addition, a so-called ‘Open valve’ operating line is added (see Figure 4.21). Any point landing on the bold black line indicates the amount of the steam extracted that would cause the pressure at the IP/LP crossover pipe to drop exactly to

4 Retrofitting of carbon capture systems into a coal-fired power plant
87
the required pressure. Below this line is the throttle in operation while the pressure control valve must be used in the area above the line. This graph provides direct messages concerning the operation of the pressure control components as long as the reboiler temperature and mass flow rate of the extracted steam are given. The actual mass flow rates of the extracted steam corresponding to the reboiler temperature are plotted as red dots on the graph. Apparently, for the present study, the pressure control valve should be activated for all the reboiler temperatures.
Figure 4.21 Mass flow rate of the extracted steam as a function of the reboiler duty
4.3.6 Summary
Through the analyses for the potential steam extraction points in the water-steam cycle, it is found that the IP/LP crossover pipe is the best location, which is in line with many other studies [37, 66, 94]. In order to obtain the steam with required quality, additional pressure control components must be installed. Moreover, the influences of the integration of the MEA system into the water-steam cycle have been examined. The key findings are summarized as follows:
� Key fact 3: A pressure control scenario that allows for a floating backpressure of the IP turbine is more energy-efficient than the fixed pressure scenario.
� Key fact 4: A steam extraction with a floating pressure of the IP/LP crossover pipe would result in a power generation shift between the IP and LP turbines.
� Key fact 5: There exists an optimal reboiler temperature (or temperature window) that leads to the minimum efficiency penalty caused by the MEA system, which is 120 ºC in the

4.4 Parametric study for membrane-based separation system
88
present study. In other words, a low specific reboiler duty does not necessarily lead to a low efficiency penalty.
4.4 Parametric study for membrane-based separation system
A parametric study was done for the single-stage (see Figure 3.6) and cascaded membrane systems (see Figure 3.7) in order to determine the optimum specifications not only for the standalone membrane-based systems but also for the membrane sections in the hybrid systems. Three factors: temperature of the inlet gas, CO2 capture rate, and H2O content, were tested in the parametric study in order to better understand the characteristics of the Polyactive® membrane.
4.4.1 Influence of the operating temperature on the cascaded membrane system
As presented in Table 3.6, the characteristic data of the Polyactive® membrane at three temperature points are available. Clearly, the permeances and selectivities are distinct under different temperatures. Hence, it is necessary to test which temperature is optimal for CO2 separation. A parametric study was thus conducted by running the cascaded membrane separation model at 25, 30, and 50 ºC, respectively. Figure 4.22 displays the efficiency penalties caused by the implementation of the cascaded membrane separation system at three temperature points (indicated by the striped columns). The penalties caused by the compression train (indicated in red) are added on top of them. During the simulation, it was found that a simultaneous CO2 capture rate of 90% and CO2 purity of 95 mol% is impossible to be reached at 50 ºC.
Figure 4.22 Efficiency penalties caused by the cascaded membrane system (incl. compression)

4 Retrofitting of carbon capture systems into a coal-fired power plant
89
Apparently, the separation is constrained by the inherent features of the membrane material at this temperature. As a result, the target purity of CO2 had to be lowered to 90 mol%, in this case, to attain the simulation converge. However, despite the different CO2 purity in the 50 ºC case, the CO2 purities in all three cases after compression are higher than 95 mol%, meeting the requirement for CO2 transport. Additionally, it is revealed that the efficiency penalty caused by the CO2 compression barely changes much with the temperature whereas efficiency penalty caused by the capture system ascends from 9.05 to 17.15 %-pts as the temperature increases.
On the contrary, the required membrane area decreases from 0.45 to 0.31 million m2. This is because that the permeance of CO2 has a higher value at a higher temperature (see Table 3.6). Therefore, the required membrane area drops as the temperature is increased. Meanwhile, due to the fact that the selectivity of CO2/N2 will drop when the temperature increases, more energy must be consumed to yield the target CO2 purity. In a word, there is a trade-off between the required membrane area and energy consumption when the temperature is varied. As we seek to minimize the energy demand, 25 ºC is selected as the optimal temperature for the operation of the gas permeation membrane.
4.4.2 Influence of the CO2 concentration in the flue gas on the cascaded membrane system
The inlet CO2 concentration was changed from 10 to 50 mol % to examine how the electricity demand changes as a function of the varied CO2 concentration. The result is depicted in Figure 4.23.
Figure 4.23 Influence of the CO2 concentration in the flue gas
It can be seen from Figure 4.23 that the electricity demand of the cascaded membrane system rises dramatically when the inlet CO2 concentration is below 20 mol%. Apparently, the slope of the curve becomes steeper as the concentration value decreases. Therefore, a low CO2
50556065707580859095100
40
60
80
100
120
140
160
0 10 20 30 40 50 60
CO
2fr
actio
n in
the
inte
rmed
iate
pe
rmea
te g
as [m
ol %
]
Ele
ctri
city
con
sum
ptio
n [M
W]
CO2 concentration in the flue gas [mol %]Electricity consumption CO₂ fraction in the intermediate permeate gas

4.4 Parametric study for membrane-based separation system
90
0
0.5
1
1.5
2
2.5
3
3.5
4
4.5
0
10
20
30
40
50
60
70
80
0 10 20 30 40 50 60 70 80 90 100
Mem
bran
e ar
e [1
06m
2 ]
CO
2co
ncen
trat
ion
[mol
%]
CO2 capture rate [%]
CO₂ in
permeate gas
CO₂ in
retentate gas
Membrane
area
concentration is definitely not desirable. It should be noted that the inlet CO2 concentration is only increased to 50 mol % because at this point the first stage membrane module of the cascaded membrane system can already yield the required CO2-enriched stream (90 % capture rate and 95 % purity) as shown by the red curve in Figure 4.23. Further increase in the concentration is meaningless for the cascaded membrane system.
4.4.3 Influence of the CO2 capture rate on the single-stage membrane system
Note that, in the two hybrid systems developed in the present study, the MEA technology deals either with the permeate gas from the membrane section in the Hybrid D1 model (see Figure 3.8) or with the retentate gas from the membrane section in the Hybrid D2 model (see Figure 3.9). In either case, it is of great importance to figure out how the CO2 concentrations vary in the permeate and retentate gases when different capture rates are imposed on the membrane. Therefore, the CO2 capture rate for the single-stage membrane was varied from 10 to 95 % to investigate the influences on the CO2 fraction in the permeate gas and required membrane area.
In Figure 4.24, the blue and the red curves demonstrate how the CO2 fraction in the permeate and retentate gas streams change with the varied capture rate, respectively. In addition, the required membrane area for each capture rate is plotted in as a green curve. It can be observed that the membrane area rises exponentially to allow more CO2 to permeate through the membrane.
Figure 4.24 CO2 concentration in the permeate and retentate gases and required membrane area as a function of the CO2 capture rate
In both gas streams, the CO2 fractions drop as the capture rate is increased. Nonetheless, the causes are different. As the capture rate increases, a larger membrane area is required so that more CO2 goes through the membrane into the permeate gas. In the meantime, increasing

4 Retrofitting of carbon capture systems into a coal-fired power plant
91
2.96
2.98
3.00
3.02
3.04
3.06
3.08
3.10
3.12
87.0
88.0
89.0
90.0
91.0
92.0
93.0
94.0
0 10 20 30 40 50 60 70 80 90 100
Mem
bran
e ar
ea [1
06m
2 ]
Spec
ific
ener
gy c
onsu
mpt
ion
[kW
h/to
n C
O2]
H2O removal ratio [%]
Specific energy
consumption
Membrane area
amounts of other gas components permeate through the membrane, too. As a result, the CO2 fraction in the permeate gas is diluted although the absolute amount of CO2 on permeate side is rising. On the contrary, the decrease of the CO2 concentration in the retentate gas is directly attributed to the reduced amount of CO2 on the retentate side. It is notable that the CO2 fraction in the permeate gas is above 40 mol% over the whole range of varied capture rate. Influence of H2O content on the single-stage membrane system
The dehydration unit prior to the membrane unit is set by default to remove 2/3 of the total H2O from the flue gas in all membrane-based capture models. In doing so, energy consumed by compressors and pumps would decrease. On the other hand, according to Table 3.6, H2O has a higher permeance than CO2 on Polyactive® membrane. So, it is of great interest to investigate how the H2O content would affect the CO2 separation. The H2O removal ratio was varied from 0 to 90 %. The CO2 capture rate was fixed at 90 %. The required membrane area and specific energy consumption of vacuum pumps are plotted against the removal ratio of H2O in Figure 4.25.
As can be seen in Figure 4.25, as the removal ratio of H2O content is increased, less energy is consumed to create a vacuum. Furthermore, it is found that a larger membrane area is required to capture CO2 when less H2O exists inside the membrane unit, This denotes that the existence of H2O enhances the transport of CO2 through membranes, which is considered due to the ‘sweep effect’ by Low et al. [32]. This ‘sweep effect’, as displayed in Figure 4.26, leads to the decreased CO2 fraction in the permeate gas as less water is removed, accompanied by the increased H2O fraction. The Equation 3.5 clearly illuminates how the CO2 fraction in the permeate gas would affect the required membrane area. As the CO2 fraction increases, the driving force Pin * yCO2,ret – Pper * yCO2,per becomes greater, resulting in a smaller membrane area as shown above under the condition that the amount captured CO2 is constant.
Figure 4.25 Membrane area and CO2 purity in the permeate gas as a function of the H2O removal ratio

4.5 Technical evaluation of the studied carbon capture systems
92
0
10
20
30
40
50
60
0 10 20 30 40 50 60 70 80 90 100
Gas
frac
tion
[mol
%]
H2O removal ratio [%]
CO₂
H₂O
Figure 4.26 CO2 and H2O fractions in the permeates as a function of H2O removal ratio
In conclusion, a higher removal ratio of H2O can reduce energy consumed by pressure-changing equipment as less water vapor needs to be compressed. On the other hand, a lower removal ratio leads to a smaller membrane area to separate the same amount of CO2 in that the existence of H2O assists in increasing the driving force for CO2 permeation. However, the existence of H2O will also cause the CO2 fraction in the permeate gas to decrease.
4.4.4 Summary
A series of parametric studies were performed on the cascaded or single-stage membrane separation systems. As a result, some key facts have been disclosed:
� Key fact 6: The cascaded membrane system gives a better performance at a lower temperature in terms of energy consumption
� Key fact 7: For the single-stage membrane system, the CO2 fraction in the permeate gas is always higher than 40 mol% when the capture rate is varied between 10 and 95 %.
� Key fact 8: A higher content of H2O in the flue gas is beneficial to CO2 transport through the membrane. However, the enhanced CO2 transport comes at the cost of a lower CO2 purity in the permeate gas and higher energy consumption.
4.5 Technical evaluation of the studied carbon capture systems
4.5.1 Specifications for hybrid models
Parametric studies have been performed for the standalone membrane and MEA technologies to optimize the operating conditions for them. However, no parametric studies were particularly conducted for the two hybrid systems developed in this thesis. It is assumed that the optimal

4 Retrofitting of carbon capture systems into a coal-fired power plant
93
specification obtained for each standalone capture system through parametric studies is also the optimal specification for the corresponding section of each standalone capture system in the hybrid systems. The ground for such an assumption is that the hybrid models are essentially comprised of a MEA system and a gas permeation membrane system (single-stage or cascaded). On account of this fact, the membrane or MEA section in the hybrid systems are configured with the same optimized specifications used for the standalone carbon capture technologies. In doing so, repetitive simulation can be avoided. However, how to distribute the CO2 capture task between the membrane and MEA sections inside the two hybrid models still need to be further analyzed.
With respect to the Hybrid D1 system, according to the Equation 3.14 (see Section 3.6), the capture rate of each section should be higher than 90 % so that an overall capture rate of 90 % can be achieved. In this study, a capture rate of 95 % is given to each section in the Hybrid D1 system so that a total capture rate of 90 % can be achieved.
Regarding the model Hybrid D2, Equation 3.18 is used to determine the two sections’ respective capture rates. It is found that the distribution is mostly decided by the capture rate of the first-stage membrane. It is already known that the reboiler duty of the MEA system will increase dramatically when the CO2 concentration is less than 20 mol% (see Figure 4.11). Hence, it is better to select a capture rate for the first-stage membrane which can lead to a CO2 fraction being above 20 mol% in the retentate gas. Nevertheless, as indicated in Figure 4.24, the CO2 fraction in the retentate gas can never reach 20 mol%. Particularly, the CO2 fraction in the retentate gas will drop to below 10 mol% when the capture rate surpasses 30 %, as a result of which, the specific reboiler duty will increase considerably (see Figure 4.11). Based on this trait of the Polyactive® membrane, the first-stage membrane module is given a capture rate of 30 %. In the meantime, the second-stage membrane module is configured to guarantee a desired CO2 purity (95 mol%) in the final permeate gas. The rest of the CO2 is dealt with by the MEA section in the Hybrid D2 system. In the end, an overall capture rate of 90 % is achieved.
Based on the derived formulas for the calculation of the CO2 capture rates for the hybrid systems (see Equation 3.14 and 3.18) in Chapter 3, the distribution of the CO2 capture responsibility between the membrane and MEA sections inside the two hybrid systems is tabulated in Table 4.9.
Table 4.9 Summary of the CO2 capture rate distribution inside the hybrid capture systems
Capture system
Hybrid D1 Hybrid D2
CCRmem CCRMEA CCRtot =
CCRmem x CCRMEA CCRmem CCRMEA
CCRtot = CCRmem + CCRMEA - CCRmem x CCRMEA
Capture rate [%]
95 95 90 27.5 86 90

4.5 Technical evaluation of the studied carbon capture systems
94
4.5.2 Comparison of the studied carbon capture systems
A selection of important simulation results for the four analyzed capture models is demonstrated in Table 4.10 for comparison. For all the capture systems, 90 % of the CO2 in the flue gas are captured, which is equivalent to 378 tCO2/h captured.
Table 4.10 Technical results for the carbon capture systems
Parameter Unit
Capture model
Cascaded membrane
MEA Hybrid D1 Hybrid D2
Capture rate % 90 90 90 90
Auxiliary power MWe 112.1 11.1 63.4 26.2
CO2 compression
MWe 44.9 36.8 36.9 37.8
Auxiliary thermal energy
GJ/h 168.5 / / 3.2
Reboiler duty MWth 413.4 402.4 289.2
Mass flow of steam for reboiler
kg/s / 188.8 183.5 132.1
Specific reboiler duty
GJ/tCO2 / 3.94 3.82 3.98
Specific electricity demand
MWhe/tCO2 0.42 0.35 0.5 0.31
Membrane area 106 m2 0.45 / 4.2 0.34
Absorber diameter
m / 16 12 14
Stripper diameter
m / 12 12 10
Pressure of outlet flow
bar 1 1.8 1.8 1.8
Temperature of outlet flow
ºC 25 40 40 40

4 Retrofitting of carbon capture systems into a coal-fired power plant
95
0123456789
1011121314151617
Cascadedmembrane
MEA Hybrid D1 Hybrid D2
Eff
icie
ncy
pen
alty
[%-p
ts]
It is found that the cascaded membrane system is mostly in need of electric energy while the MEA system requires the least electric energy for auxiliary equipment. Of the three models that have the MEA technology as an integral part, the steam demand of the Hybrid D2 system ranks the lowest as the capture task is partly undertaken by the membrane section. Due to this fact, the pressure control valve does not need to be activated for steam extraction, avoiding extra power loss over the valve (see Section 4.3.4). Although the Hybrid D1 system has the lowest specific reboiler duty, the membrane area required by this system is much larger than other systems.
The efficiency penalties caused by the four capture systems are compared as well (see Figure 4.27). Note that the energy consumption of the compression process has also been included. It is apparent that the Hybrid D1 system causes the highest efficiency penalty (15 %-pts). The system causing the second highest penalty is the cascaded membrane system, which leads to a penalty of 13 %-pts. In contrast to the Hybrid D1 system, the Hybrid D2 system results in the least efficiency penalty (9.7%-pts), lower than that of the standalone MEA system (10.9 %-pts)
Figure 4.27 Comparison of efficiency penalties between different capture models
With the capture rate fixed at 90 %, the cascaded membrane system turns out consuming more energy than the MEA technology. This is mainly because of the large energy consumption demanded by the compressors in this system. However, the required membrane area is much reduced even compared to the case study for the cascaded membrane system with a 70 % capture rate by Zhao et al. [31]
It should be noted that the cascaded membrane system also requires thermal energy for the inter-heating in the turbo-expanders (see Table 4.10). However, the thermal energy demand seems to not draw any attention in some studies wherein the turbo-expanders are also used [31, 32]. Also, in the present study, the efficiency penalty caused by the thermal energy demand in the cascaded membrane has not been taken into account. Therefore, this issue will be

4.5 Technical evaluation of the studied carbon capture systems
96
addressed next to figure out how impactful the thermal energy demand in the cascaded membrane system can be.
Like providing the steam for the MEA system, steam is extracted from steam turbines and delivered to the cascaded membrane system. Considering the fact that the outlet temperature of the inter-heater for the turbo-expander is set at 80 ºC, the point G on the turbines is the best option (see Table 4.7). According to the calculation, 21 kg/s of steam needs to be extracted from this location to provide a heating demand of 168.5 GJ/h (see Table 4.10). As a result, an additional power drop of 10 MWe was witnessed and, consequently, the efficiency penalty caused by the cascaded membrane system rises from 13 to 13.8 %-pts.
� Key fact 9: The thermal energy demand for the inter-heating in the cascaded membrane system has a pronounced impact on the efficiency penalty and therefore cannot be neglected.
4.5.3 Part load behavior
The efficiency penalties caused by the CO2 capture systems at full load have been shown in the last section. In this section, the part load behaviors of the reference power plant with the CO2 capture systems are to be investigated. To carry out this research, the complete power plant model including the flue gas path and the water-steam cycle introduced in the previous section was used. The sliding-pressure control was used for the part load operation of the reference power plant. Since the Hybrid D1 system causes a far higher efficiency penalty than the other capture systems, it is excluded for the part-load investigation.
In EBSILON®, a controller was used to vary the load from 100 to 40 % of nominal gross output. As mentioned above, the simulation of the part load operation was run in the off-design model. According to the calculated results, the input heat value in the combustion chamber changes to match the output of the steam turbine as the load is varied. In principle, the change of the load would lead to an unstable state of coal combustion. Also, the pressure of the live steam drops as the load is decreased in the sliding pressure operation. Consequently, the efficiency of the power plant decreases as the load is reduced. The values of the input heat and efficiency are shown in Table 4.11. What should be noted here is that the capture rates for all capture systems were still fixed at 90 %.
Table 4.11 Input heat values and the efficiencies of the power plant at different loads
Load (%) 40 50 60 70 80 90 100
Heat value (MWth) 516 635 751 867 982 1098 1210
Efficiency (%) 42.0 43.3 44.2 44.8 45.3 45.6 45.9

4 Retrofitting of carbon capture systems into a coal-fired power plant
97
0.8
0.84
0.88
0.92
0.96
1
40 50 60 70 80 90 100
Nor
mal
ized
cha
ract
eris
tic v
alue
Load [%]
By changing the output of the power plant model, simulation results regarding the properties of the flue gases at different loads were. However, the simulation results at part loads cannot be validated because the reference data of the power plant in literature is only provided for full load operation by literature [187]. Hence, to get a more accurate prediction, the simulation results of the flue gas at different loads were not directly used for the capture systems in Aspen®. Instead, they were used to build up the correlations between the parameters at the part and full loads. For this purpose, they were first normalized with the simulation results at full load as a baseline to generate the characteristic values for the relevant parameters at different loads. In doing so, characteristic curves for parameters can be plotted, which represent predictive models for calculating parameters at part loads based on the full load data.
Taking the CO2 concentration in the flue gas, for instance, its characteristic curve is shown in Figure 4.28. Given the characteristic, the CO2 concentrations at different loads were calculated by multiplying the reference data from literature (see Table 4.3) by the normalized value on the characteristic curve. As a result, the CO2 concentrations in the flue gas under different loads are derived based on the given reference data (see Figure 4.29).
Figure 4.28 Normalized values of CO2 concentration in the flue gas at different loads
It can be seen from Figure 4.29 that the CO2 fraction drops from 13.5 to 11.4 mol % as the load is reduced from 100 to 40 %. This is because the excess air ratio is increased to offset the decreased combustion efficiency as the load is reduced. As a result, the CO2 fraction is diluted by additional air in the flue gas.
The same approach was used for other gas components as well as the flow rate of the flue gas under different loads. In particular, owing to the decreased input heat value in the combustion chamber, the flue gas flow rate becomes smaller with as the load is reduced (see Figure 4.30).

4.5 Technical evaluation of the studied carbon capture systems
98
10.00
10.50
11.00
11.50
12.00
12.50
13.00
13.50
14.00
40 50 60 70 80 90 100
CO
2co
ncen
trat
ion
[mol
%]
Load [%]
0
10
20
30
40
50
60
70
80
40 50 60 70 80 90 100
Flue
gas
flow
rat
e [1
03 km
ol/h
]
Load [%]
Figure 4.29 CO2 concentration as a function of the load of the reference power plant
Figure 4.30 Flue gas flow rate as a function of the load of the reference power plant
In Figure 4.31, the efficiencies of the power plant equipped with the cascaded membrane, MEA, and Hybrid D2 systems are plotted, respectively, against the varied load. The efficiency without CO2 capture is also added as a reference case. It is clear that the efficiencies in all the cases decline with similar slopes as the load is reduced from 100 to 40 %. Of the three capture systems, power plant with the Hybrid D2 system has shown the highest efficiency at each load although it is only marginally higher than in the case of the MEA system.

4 Retrofitting of carbon capture systems into a coal-fired power plant
99
20.0
25.0
30.0
35.0
40.0
45.0
50.0
40 50 60 70 80 90 100
Eff
icie
ncy
[%]
Load [%]
Reference
w/ MEA
w/ Cascaded
membrane
w/ Hybrid D2
8.0
9.0
10.0
11.0
12.0
13.0
14.0
15.0
16.0
17.0
40 50 60 70 80 90 100
Eff
icie
ncy
pena
lty [%
-pts
]
Load [%]
Cascaded
membrane
MEA
Hybrid D2
Figure 4.31 Efficiency of the power plant as a function of load
The efficiency penalties caused by the three capture systems are displayed in Figure 4.32. Apparently, the penalties entailed by all the capture systems become greater as the load decreases. In addition, it is found that the ranking of the capture systems concerning the efficiency penalties does not change over the varied load. That is to say, the Hybrid D2 system causes the least efficiency penalty than the other two systems over the entire range of load.
Figure 4.32 Efficiency penalties caused by the CO2 capture systems as a function of load
In comparison to the MEA and Hyrbid D2 systems, the cascaded membrane system leads to the highest penalty at each load. The penalty caused by the cascaded membrane system jumps from 12.8 to 15.8 %-pts when the load drops to 40 %. In comparison, neither of the efficiency penalties caused by the MEA and Hybrid D2 systems surpasses 13 %-pts at the load of 40 %. It

4.6 Pinch analysis and waste heat integration
100
is also observed that the difference between the penalties caused by the MEA and Hybrid D2 systems becomes smaller as the load decreases.
� Key fact 10: Greater efficiency penalty is witnessed when the carbon capture system is operated at part load.
4.6 Pinch analysis and waste heat integration
In this section, the pinch analysis [189], with the assistance of the Aspen Energy Analyzer (AEA), is performed to utilize the waste heat exhausted from the capture systems and optimize the heat exchanger network (HEN) in an attempt to decrease the efficiency penalties.
4.6.1 Analysis of the potential for waste heat integration
First, the potential for utilizing the waste heat from the cascaded membrane, MEA, Hybrid D1, and Hybrid D2 systems are examined, respectively. The properties of the process streams in the capture systems in Aspen Plus® can be directly transferred to AEA. The composite curves of the four capture models are plotted in Figure 4.33, Figure 4.34, Figure 4.35, and Figure 4.36, respectively. In these plots, the red curves stand for the hot streams which exhaust heat while the blue curves stand for the cold streams which require heating. The minimum temperature difference for heat exchange is assumed to be 10 ºC. In the following sections, the respective potential for waste heat
Potential of the cascaded membrane system
It has discussed in Section 4.5.2 that the cascaded membrane system also requires external thermal energy input. According to the analysis in Section 4.5.2, an additional efficiency penalty of 0.8 %-pts is caused by the thermal energy demand. Nevertheless, according to the pinch analysis for the cascaded membrane system (see Figure 4.33), the capture system ideally does not need any heating utility while discharges 613 GJ/h waste heat to the cooling system. This means that the waste heat generated within the system is sufficient to provide for its own thermal energy demand.
According to the optimized HEN design for the cascaded membrane system in AEA (see Figure G. 1 in Appendix G), 168.6 GJ/h of the waste heat generated from the compressors and vacuum pumps can be used to accomplish the inter-heating task for the turbo-expanders. Thus, no steam is necessary to be imported. Nonetheless, the saving of the heating comes at the cost of an increased area of heat exchanger. As a result of the HEN optimization, the total area of heat exchangers in the cascaded membrane system has increased from 0.25 to 0.31 million m2. In spite of the reduced energy consumption, the increased capital cost must be taken into account for cost estimation. This modification also applies to the membrane section in the Hybrid D2 model.

4 Retrofitting of carbon capture systems into a coal-fired power plant
101
� Key fact 11: With waste heat integration, the cascaded membrane system is in no need of external steam.
Figure 4.33 Composite curves of the cascaded membrane system
Potential of the MEA system
The composite curves for the pinch analysis of the MEA system are shown in Figure 4.34. It is revealed by the energy target of pinch analysis that no heat exchange can occur between the process streams due to the fact the cold composite curve has a higher average temperature than the hot stream composite curve. As discussed in the previous sections, the heating utility comes from the extracted steam and a cooling utility of 1706 GJ/h is required.
Potential of the Hybrid D1 system
Since the Hybrid D1 causes the highest efficiency penalty, it is very interesting to check the energy-saving potential for this system by heat integration. Figure 4.35 shows that an area exists wherein part of the hot stream composite curve has higher temperature than the cold stream curve. Nevertheless, only very little amount of waste can be utilized above 120 °C owing to the negligible enthalpy change in the temperature window.
Potential of the Hybrid D2 system
Similarly, as shown in Figure 4.36, the Hybrid D2 system discharges 1538 GJ/h waste heat but little of them can be utilized inside the capture system itself due to the restriction of the temperature.
Apparently, the four capture systems except the cascaded membrane system have little potential for waste heat integration internally. Consequently, a considerable amount of waste heat is discharged from them as well as the CO2 compression trains. The amount of waste heat

4.6 Pinch analysis and waste heat integration
102
from the capture systems and corresponding compression trains are summarized in Table 4.12. Naturally, it is of great interest to investigate if the waste heat has the possibility of becoming the heating utility for the feed water stream in the water-steam cycle of the power plant. Therefore, the integration of the waste heat into the waster-steam cycle is to be examined in the following section.
Figure 4.34 Composite curves of the MEA system
Figure 4.35 Composite curves of the Hybrid D1 system
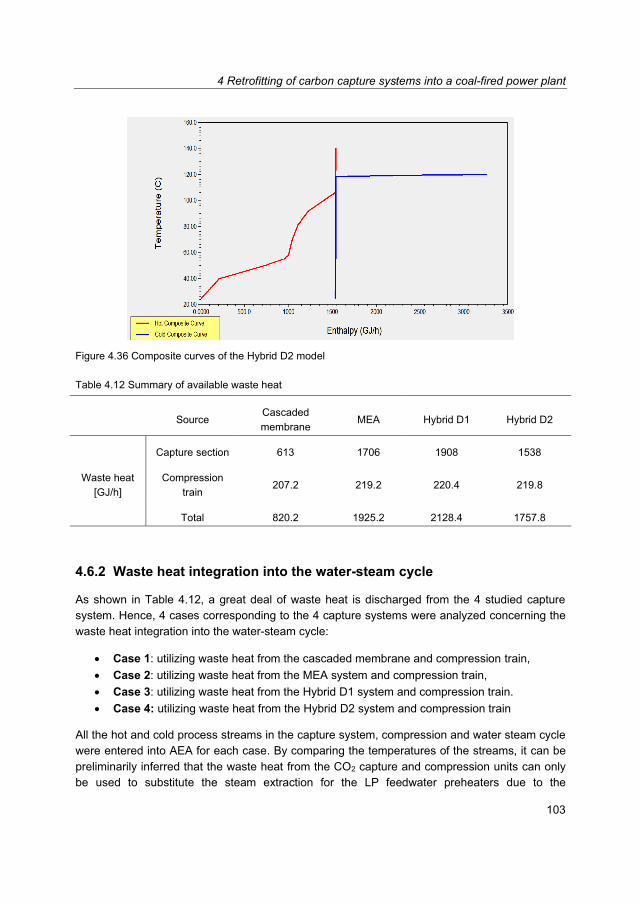
4 Retrofitting of carbon capture systems into a coal-fired power plant
103
Figure 4.36 Composite curves of the Hybrid D2 model Table 4.12 Summary of available waste heat
Source
Cascaded membrane
MEA Hybrid D1 Hybrid D2
Waste heat [GJ/h]
Capture section 613 1706 1908 1538
Compression train
207.2 219.2 220.4 219.8
Total 820.2 1925.2 2128.4 1757.8
4.6.2 Waste heat integration into the water-steam cycle
As shown in Table 4.12, a great deal of waste heat is discharged from the 4 studied capture system. Hence, 4 cases corresponding to the 4 capture systems were analyzed concerning the waste heat integration into the water-steam cycle:
� Case 1: utilizing waste heat from the cascaded membrane and compression train, � Case 2: utilizing waste heat from the MEA system and compression train, � Case 3: utilizing waste heat from the Hybrid D1 system and compression train. � Case 4: utilizing waste heat from the Hybrid D2 system and compression train
All the hot and cold process streams in the capture system, compression and water steam cycle were entered into AEA for each case. By comparing the temperatures of the streams, it can be preliminarily inferred that the waste heat from the CO2 capture and compression units can only be used to substitute the steam extraction for the LP feedwater preheaters due to the
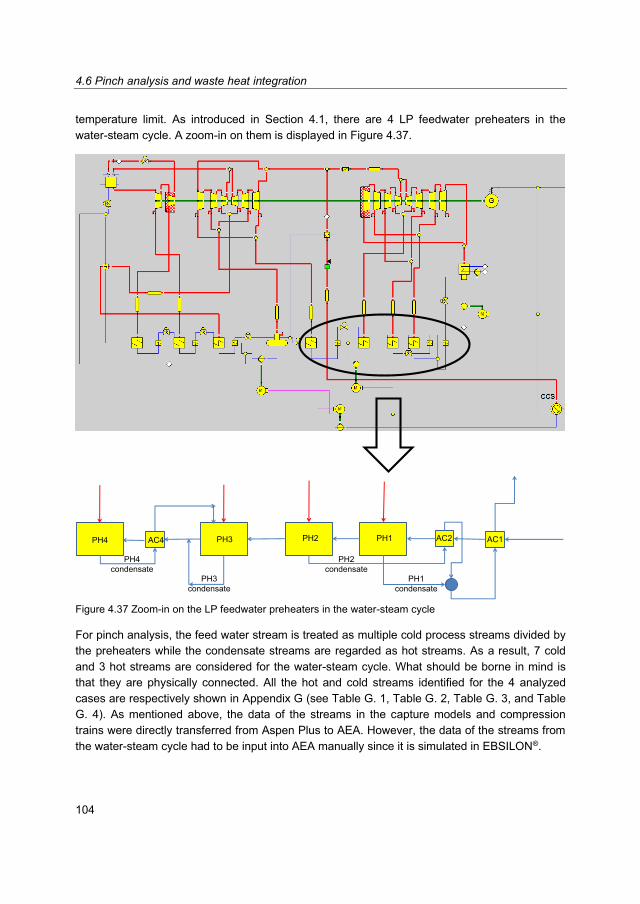
4.6 Pinch analysis and waste heat integration
104
PH4
PH4condensate
AC4 PH3
PH3condensate
PH2
PH2condensate
PH1
PH1condensate
AC2 AC1
temperature limit. As introduced in Section 4.1, there are 4 LP feedwater preheaters in the water-steam cycle. A zoom-in on them is displayed in Figure 4.37.
Figure 4.37 Zoom-in on the LP feedwater preheaters in the water-steam cycle
For pinch analysis, the feed water stream is treated as multiple cold process streams divided by the preheaters while the condensate streams are regarded as hot streams. As a result, 7 cold and 3 hot streams are considered for the water-steam cycle. What should be borne in mind is that they are physically connected. All the hot and cold streams identified for the 4 analyzed cases are respectively shown in Appendix G (see Table G. 1, Table G. 2, Table G. 3, and Table G. 4). As mentioned above, the data of the streams in the capture models and compression trains were directly transferred from Aspen Plus to AEA. However, the data of the streams from the water-steam cycle had to be input into AEA manually since it is simulated in EBSILON®.

4 Retrofitting of carbon capture systems into a coal-fired power plant
105
PH4
PH4condensate
AC4 PH3
PH3condensate
PH2
PH2condensate
PH1
PH1condensate
AC2 AC1
12.1 GJ/h87.8 GJ/h83.7 GJ/h
Given all the streams, AEA can generate energy targets based on the ideal HEN designs for the three cases. However, some constraints must be imposed to take into account some realistic requirements, which will inevitably compromise the ideal designs. For instance, the process streams are not allowed to be split to avoid the sophistication of piping instrumentation. Also, it is worth noting that, as seen in Figure 4.37, the condensate streams are used to heat streams in the aftercoolers, i.e. some of the process streams are interconnected by default. Therefore, to reflect this default design, the condensate streams are forbidden to connect to their upstream cold streams. Additionally, the temperature increase of the cooling water is limited to 5 ºC (18-23 ºC). The temperature difference at the pinch point is set at 10 ºC. Under the given conditions, pinch analyses were performed in AEA to generate HEN designs for the utilization of the waste heat. The detailed HEN diagrams for the three cases are displayed in Figure G. 2, Figure G. 3, Figure G. 4, and Figure G. 5, respectively. In these diagrams, the hot and cold utilities have been removed so as to exhibit clear graphs. The red dots represent the energy supply from the heating utility while the blue dots represent the heat exchange with the cooling utility. The grey dots and lines stand for the heat exchanges between the process streams.
As a matter of fact, AEA would recommend multiple possible HEN designs in some cases. In the present study, the recommended HEN designs with the lowest annualized total costs are chosen. What should be noted here is that the costs in AEA are estimated using default cost indices, which are not exactly in line with the cost model used in this thesis. Therefore, the cost values are only used to select the optimal HEN designs but not used as the economic results for this thesis. The total cost estimated in AEA for a HEN comprises the capital cost (heat exchanger), heating utility cost, and cooling utility cost. Like the internal HEN optimization for the cascaded membrane system, additional heat exchangers (increased capital costs) are also unavoidable for accomplishing the heat integration in this section. Nonetheless, the costs for utility can be decreased to achieve a lower total cost. On account of the HEN diagrams, the viable locations in the water-steam cycle for the 4 cases are presented in Figure 4.38, Figure 4.39, Figure 4.40, and Figure 4.41, respectively. Furthermore, under each figure lies a table that compares the steam extraction for the LP preheaters before and after the heat integration (see Table 4.13, Table 4.14, Table 4.15, and Table 4.16).
Case 1: Cascaded membrane – CO2 compression train – Preheaters
Figure 4.38 Utilization of the waste heat from the cascaded membrane system and CO2 compression

4.6 Pinch analysis and waste heat integration
106
PH4
PH4condensate
AC4 PH3
PH3condensate
PH2
PH2condensate
PH1
PH1condensate
AC2 AC1
28 GJ/h61.9 GJ/h53 GJ/h
PH4
PH4condensate
AC4 PH3
PH3condensate
PH2
PH2condensate
PH1
PH1condensate
AC2 AC1
29.8 GJ/h64.8 GJ/h55.4 GJ/h17 GJ/h
Table 4.13 Effects of the heat integration for the cascaded membrane system
PH1 PH2 PH3 PH4
Mass flow of steam [kg/s]
w/o HI 11.7 21.8 18.4 9.3
w/ HI 1.1 11.7 18.4 9.3
Electric energy recovered [MWe] 5.8
Case 2: MEA – Compression train – Preheaters
Figure 4.39 Utilization of the waste heat from the MEA system and CO2 compression Table 4.14 Effects of the heat integration for the MEA system
PH1 PH2 PH3 PH4
Mass flow of steam [kg/s]
w/o HI 3.5 7.5 6.2 5.6
w/ HI 1.5 0.6 0.1 5.0
Electric energy recovered [MWe] 5.4
Case 3: Hybrid D1 – Compression train – Preheaters:
Figure 4.40 Utilization of the waste heat from the Hybrid D1 system and CO2 compression train

4 Retrofitting of carbon capture systems into a coal-fired power plant
107
PH4
PH4condensate
AC4 PH3
PH3condensate
PH2
PH2condensate
PH1
PH1condensate
AC2 AC1
7.1 GJ/h47.2 GJ/h94.8 GJ/h62.9 GJ/h
Table 4.15 Effects of the heat integration for the Hybrid D1 system
PH1 PH2 PH3 PH4
Mass flow of steam [kg/s]
w/o HI 3.7 7.9 6.5 5.5
w/ HI 1.7 0.8 0.3 3.1
Electric energy recovered [MWe] 7.0
Case 4: Hybrid D2 – Compression train – Preheaters:
Figure 4.41 Utilizing waste heat from the Hybrid D2 system and CO2 compression Table 4.16 Effects of the heat integration for the Hybrid D2 system
PH1 PH2 PH3 PH4
Mass flow of steam [kg/s]
w/o HI 6 11.7 9.5 4.8
w/ HI 1.8 0.8 2.1 4.2
Electric energy recovered [MWe] 6.7
It can be seen that the heat integrations lead to decreased mass flows of steam demanded by the LP preheaters. Consequently, the outputs of the power plant have increased by 5.8, 5.4, 7.0, and 6.7 MWe, respectively, in the four cases.
The efficiency penalties caused by the capture systems before and after the heat integrations are plotted in a bar chart (see Figure 4.42). The Hybrid D2 system has seen the largest drop of the efficiency penalty (0.55 %-pts) whereas the cascaded membrane system has shown the least decrease of the efficiency penalty of 0.2 %-pts. This is mainly because the membrane separation process discharges less heat compared with the MEA technology. Besides, it is evident that waste heat integration does not change the fact that the Hybrid D1 system causes a higher efficiency penalty than the other three systems.

4.7 Economic evaluation
108
Figure 4.42 Efficiency penalties before and after heat integration
Despite the reduced efficiency penalty with waste heat integration, increased capital costs are apparently inevitable for the addition of heat exchangers. The added heat exchanger areas for the four analyzed cases are displayed in Table 4.17.
Table 4.17 Additional heat exchanger areas for the waste heat integration
Case 1 Case 2 Case 3 Case 4
Added area [m2] 308969 25875 22560 28022
� Key fact 12: The waste heat integration reduces the efficiency penalty caused by the capture systems at the cost of additional heat exchangers.
4.7 Economic evaluation
4.7.1 Cost estimation basis
In this section, economic analysis is conducted. As mentioned above, the carbon capture systems are integrated into an existing coal-fired power plant (retrofitting case). Hence, the reference power plant is assumed to be built in 2011 and retrofitted for CCS in 2016. The CAPEX, OPEX, and CO2 avoidance costs for deploying the CO2 capture systems are estimated using the cost model introduced in Chapter 3.
In addition to the cost model for the CO2 capture system developed by the author of the present study, a cost model for the reference power plant developed by Friebe, M. [190] was also used.
0
2
4
6
8
10
12
14
16
18
Cascaded
membrane
MEA Hybrid D1 Hybrid D2
Eff
icie
ncy
pena
lty [%
-pts
]w/o HI
w/ HI

4 Retrofitting of carbon capture systems into a coal-fired power plant
109
The two cost models are combined to calculate the LCOE of the power plant equipped with carbon capture.
The assumptions for the power plant cost model are listed in Table 4.18. Since the reference power plant is an existing plant, only the consumables such as coal and cooling water price in the power plant cost model are updated to 2016 €. Without carbon capture, the LCOE of the power plant is 5.36 cent/kWh according to the model. It should be emphasized that the economic analyses are performed without considering the waste heat integration into the water-steam cycle, which is discussed in the last section. Only the internal waste heat integration inside the capture system, e.g. the cascaded membrane system, is considered. This is because the applicability of the integration across different multiple sites needs to be further evaluated in practice. Moreover, the increased costs of heat exchangers for the internal waste heat integration in the cascaded membrane system have also been considered for economic analysis. Nevertheless, even though the Hybrid D2 system has a similar set-up (intercooling for expanders) for internal heat integration, very little heating demand for the expanders are required (see in Table 4.10). Hence, the increased costs of the heat exchangers for this system are neglected.
Table 4.18 Assumptions and cost parameters for the power plant cost model
Parameter Unit Value
Operating hour h/yr 7800
Coal price (2016) €/t 67 [191]
Starting year of operation / 2011
Lifetime year 35
4.7.2 Overview of equipment costs
First, the purchased equipment costs for the cascaded membrane, MEA, Hybrid D1, and Hybrid D2 systems were estimated using the method introduced in Section 3.5. The results for the four capture systems are displayed in Figure 4.43, Figure 4.44, Figure 4.45, and Figure 4.46, respectively. Concerning the cascaded membrane separation system, the total equipment cost is € 75.9 M. The largest investment is on the gas permeation membrane, including membrane material and container, which in total accounts for 46.2 % of the total cost. The compressors and heat exchangers also contribute largely to the total cost.
As can be seen in Figure 4.44, the total equipment cost for the MEA system is € 43 M. The largest contributor to the total cost is the capital cost of the absorber, being € 17.1 M. The absorber and stripper together constitute nearly 56 % of the total equipment cost. This is caused by the fact that a large volume of the flue gas from the power plant is coped with by the MEA system.

4.7 Economic evaluation
110
0.0 10.0 20.0 30.0 40.0 50.0 60.0 70.0 80.0
Membrane
Membrane container
Knock drum
Turbo-expander
Heat exchanger
Vacuum pump
Compressor
Scrubber
Water pump
Total
Purchased equipment cost [million €]
0 5 10 15 20 25 30 35 40 45 50
Absorber
Stripper (incl. reboiler)
Scrubber
Fan
MEA wash scrubber
Overhead condenser
Heat exchanger
Pumps
Total
Purchased equipment cost [million €]
Figure 4.43 Purchased equipment costs for the cascaded membrane separation system
Figure 4.44 Purchased equipment costs for the MEA system
The Hybrid D1 system requires a much larger equipment cost (€ 300.4 M) owing to the very large required membrane area of 4.2 million m2 (see Table 4.10). The costs of the membrane material and its container combined make up 88 % of the total purchased equipment cost.

4 Retrofitting of carbon capture systems into a coal-fired power plant
111
0 10 20 30 40 50 60 70 80
Membrane
Membrane container
Knock drum
Turbo-expander
Vacuum pump
Compressor
Absorber
Stripper (incl.reboiler)
Scrubber
Fan
MEA wash scrubber
Overhead condenser
Heat exchanger
Pump
Total
Purchased equipment cost [million €]
0 50 100 150 200 250 300 350
Membrane
Membrane container
Vacuum pump
Absorber
Stripper (incl.reboiler)
Scrubber
Fan
MEA wash scrubber
Overhead condenser
Heat exchanger
Pump
Total
Purchases equipment cost [million €]
Figure 4.45 Purchased equipment costs for the Hybrid D1 system
Figure 4.46 Purchased equipment costs for the Hybrid D2 system
With respect to the Hybrid D2 system, it is noticed that the individual costs on the absorber and membrane are lower than that in the respective standalone technologies. This is because the membrane and MEA sections in the hybrid system deal with less flue gas than in the standalone

4.7 Economic evaluation
112
technologies. Despite this fact, the Hybrid D2 system turns out to still have a higher total equipment cost (€ 68.6 M) than the MEA system. However, it is lower than the equipment cost of the cascaded membrane separation system. In the Hybrid D2 system, the costs of the membrane and its container are the largest investment (€ 27.1 M), which make up 39.5 % of the total cost.
4.7.3 CAPEX, OPEX and CO2 avoidance cost
Given the equipment costs, the CAPEX and OPEX for each capture system were calculated using the cost model for the carbon capture system. The breakdowns of the CAPEXs and OPEXs are presented in Appendix I.1. Note that the calculation of CAPEX for the membrane material was performed independently of the other components. This is because the membrane has a different lifetime (5 years) than the CCS project lifetime of 25 years (see Table 3.14). As a result, different annuity factors were used to calculate the annualized capital costs of membrane. The results of annual capital costs, OPEXs and annual costs of the CO2 compression trains are illustrated in Table 4.19.
Table 4.19 Summary of economic results
Unit
Cascaded membrane
MEA Hybrid D1 Hybrid D2
Capture rate [%] 90 90 90 90
Annualized capital cost
[M€/yr] 31.2 17.1 140.7 29.7
O&M cost [M€/yr] 21.6 24.8 55.9 25.8
Compression [M€/yr] 13 11 11 12
Total annual cost [M€/yr] 66 53 207.1 67
Net output [MWe] 398 424 367 438
LCOE [cent/kWh] 9.59 8.59 15.1 8.57
By adding the annual cost of each capture system on the top of the cost of the reference power plant, the LCOE with carbon capture is generated. It can be seen in Table 4.19 that the Hybrid D1 system has the highest annual investment cost and also leads to the highest LCOE (15.1 cent/kWh). Thus, it can be concluded at this stage that the Hybrid D1 system is neither technically nor economically feasible as compared to the other capture systems. The annual cost of the Hybrid D2 system (67 M€/yr) is similar to that of the cascaded membrane system (66 M€/yr), higher than that of the MEA system (53 M€/yr). However, due to highest net power

4 Retrofitting of carbon capture systems into a coal-fired power plant
113
0
20
40
60
80
100
120
140
160
Cascadedmembrane
MEA Hybrid D1 Hybrid D2
Co
st [
€/t
CO
2]
CO₂ avoidance cost CO₂ capture cost
output, the deployment of the Hybrid D2 system the lowest LCOE with CCS (8.57 cent/kWh). The MEA system leads to a very similar LCOE of 8.59 cent/kWh. While the cascaded membrane system causes the LCOE to increase to 9.59 cent/kWh, which is the second highest LCOE of the four capture systems.
The CO2 capture and avoidance costs are displayed in Figure 4.47 in red & blue bars, respectively. The CO2 avoidance and capture costs are estimated to be 65.1 and 44.6 €/tCO2, respectively, when the power plant is equipped with the cascaded membrane system. The two cost values for the MEA system are 49.1 and 36.1 €/tCO2, respectively. It is interesting to notice that the CO2 avoidance cost of the Hybrid D2 system, being 48.8 €/tCO2, is slightly lower than that of the MEA system, whereas the capture cost of the Hybrid D2 system (37.2 €/tCO2) is slightly higher than that of the MEA system. This is because the Hybrid D2 system causes less efficiency penalty. Unsurprisingly, the Hybrid D1 system leads to the highest CO2 avoidance cost (148.3 €/tCO2), which is much higher than that of the other systems. Therefore, this system will not be discussed in the following sections.
� Key fact 13: Hybrid D1 system is neither technically nor economically efficient
Figure 4.47 CO2 capture and avoidance costs
4.7.4 Comparison with published results
Some published economic results regarding the application of the MEA and membrane-based CO2 capture technologies in power plants have been summarized in Section 2.3 and 2.5, respectively. These results can be used for comparison with the results obtained in this study. However, some facts should be drawn attention to:
1. The technical and economic parameters and assumptions vary in these studies (CO2 capture rate, net power output, project lifetime, etc.);

4.7 Economic evaluation
114
2. Economic results from different studies are presented in different currencies or different years.
Hence, only the published results gained under similar research conditions (power output, capture rate, etc.) were chosen for comparison and still, the differences should be highlighted. Moreover, all the published economic results were updated to 2016 € to stay in accordance with the present study. A selection of published technical and economic results of the MEA and cascaded membrane separation system are presented Table 4.20 and Table 4.21, respectively.
Table 4.20 Comparison of the present study with published results of the MEA technology
Source Present study Abu-
Zahra et al. [109]
NZEC [110]
Li et al. [113]
IEA [112]
Capture system
Cascaded membrane
MEA Hybrid D2 MEA
Year of cost data
2016 2004 2009 2013 2010
Region Germany EU China US OECD
Capture rate [%]
90 90 90 85 90
Net output w/o CCS [MWe]
555 575 574 560 Average
Efficiency penalty [%-pts]
13 10.9 9.7 14 12.4 10.6 N/A
Re-evaluation of economics on the basis of 2016 (€)
LCOE w/o CCS
[cent/kWh] 5.36 5.36 5.36 3.83 3.83 6.19 5.85
LCOE w/ CCS [cent/kWh]
9.56 8.59 8.57 7.00 7.23 11.25 9.48
Relative increase in LCOE [%]
78.4 60.3 59.9 82.8 88.9 81.9 62.1
Cost of CO2 avoided [€/tCO2]
63.9 49.1 48.8 47.9 46.1 74.3 51.4
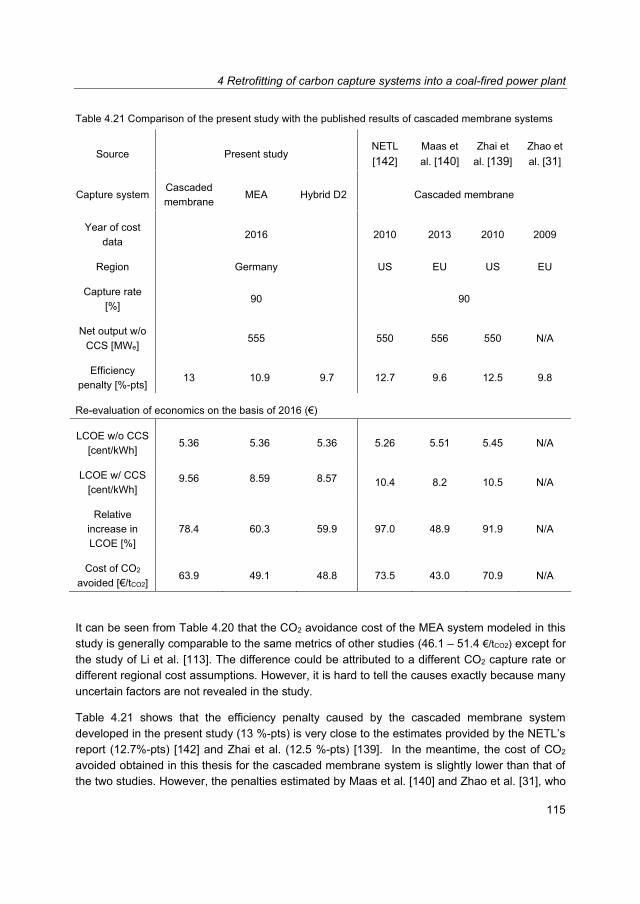
4 Retrofitting of carbon capture systems into a coal-fired power plant
115
Table 4.21 Comparison of the present study with the published results of cascaded membrane systems
Source Present study NETL [142]
Maas et al. [140]
Zhai et al. [139]
Zhao et al. [31]
Capture system Cascaded membrane
MEA Hybrid D2 Cascaded membrane
Year of cost data
2016 2010 2013 2010 2009
Region Germany US EU US EU
Capture rate [%]
90 90
Net output w/o CCS [MWe]
555 550 556 550 N/A
Efficiency penalty [%-pts]
13 10.9 9.7 12.7 9.6 12.5 9.8
Re-evaluation of economics on the basis of 2016 (€)
LCOE w/o CCS [cent/kWh]
5.36 5.36 5.36 5.26 5.51 5.45 N/A
LCOE w/ CCS [cent/kWh]
9.56 8.59 8.57 10.4 8.2 10.5 N/A
Relative increase in LCOE [%]
78.4 60.3 59.9 97.0 48.9 91.9 N/A
Cost of CO2 avoided [€/tCO2]
63.9 49.1 48.8 73.5 43.0 70.9 N/A
It can be seen from Table 4.20 that the CO2 avoidance cost of the MEA system modeled in this study is generally comparable to the same metrics of other studies (46.1 – 51.4 €/tCO2) except for the study of Li et al. [113]. The difference could be attributed to a different CO2 capture rate or different regional cost assumptions. However, it is hard to tell the causes exactly because many uncertain factors are not revealed in the study.
Table 4.21 shows that the efficiency penalty caused by the cascaded membrane system developed in the present study (13 %-pts) is very close to the estimates provided by the NETL’s report (12.7%-pts) [142] and Zhai et al. (12.5 %-pts) [139]. In the meantime, the cost of CO2 avoided obtained in this thesis for the cascaded membrane system is slightly lower than that of the two studies. However, the penalties estimated by Maas et al. [140] and Zhao et al. [31], who

4.7 Economic evaluation
116
also simulated the Polyactive® membrane and used a similar system configuration, are lower than the results obtained in this study. Both studies have shown less than 10 %-pts efficiency penalties for the cascaded membrane system. As a result, the CO2 avoidance cost estimated by Maas et al. [140] is much lower than other sources as well as the present study. Again, it is almost impossible to explain why the differences exist without looking into their actual simulation. One of the causes is likely to be the different specifications for the pressure-changing equipment. For instance, mechanical efficiency of 85 % and the polytropic process is configured for compressors and vacuum pumps in the present study whereas more ideal conditions might be specified in the studies of Maas et al. [140] and Zhao et al. [31].
All in all, the simulation results for the MEA and cascaded membrane systems modeled in the present study are in line with some other studies. However, there are also some studies that exhibit different technical and economic results. It is difficult to explain the causes behind the discrepancies since not all details of the simulations are displayed in those studies.
4.7.5 Sensitivity analysis
Previously, only the economic results under the default conditions (base case) of the CO2 capture systems (see Table 3.14 and Table 4.18) are displayed. Sensitivity analysis is also indispensable in order to examine how some significant parameters can affect the economic results. Particularly, high uncertainty exists in the economic assumptions for the membrane. In this section, the influences of the parameters including plant operation time, membrane price, and membrane lifetime are investigated.
Influences of the operation time
The yearly operation time of the power plant with carbon capture is first examined. The sensitivity of the annual cost of a carbon capture system, as well as the LCOE with carbon capture to this factor, are shown in Figure 4.48 and Figure 4.49, respectively. A constant total operating hour for the membrane is assumed, which is equivalent to the value in the base case (5 year x 7800 h/year = 39000 h). Therefore, for the sensitivity analysis, the membrane lifetime in year will also change according to the yearly operation time.
Figure 4.48 shows how the annual cost of each capture system changes as the operation hour increases. The operation time was varied from 3000 to 8000 hours/year. It is obvious that longer operation time would lead to higher annual costs for all the capture systems. However, the causes for the increase in investment costs are distinct for the MEA and membrane technologies. For the MEA system, more costs are invested in the consumables, especially for the MEA make-up.
As for the membrane, the membrane lifetime (year-based) decreases as the operation time rises given a constant durable operating hour. As a result, the replacement of the membrane becomes more frequent and the annuity factor for cost calculation is larger. Therefore, the annual cost for the cascaded membrane system also increases with longer operation time. As a
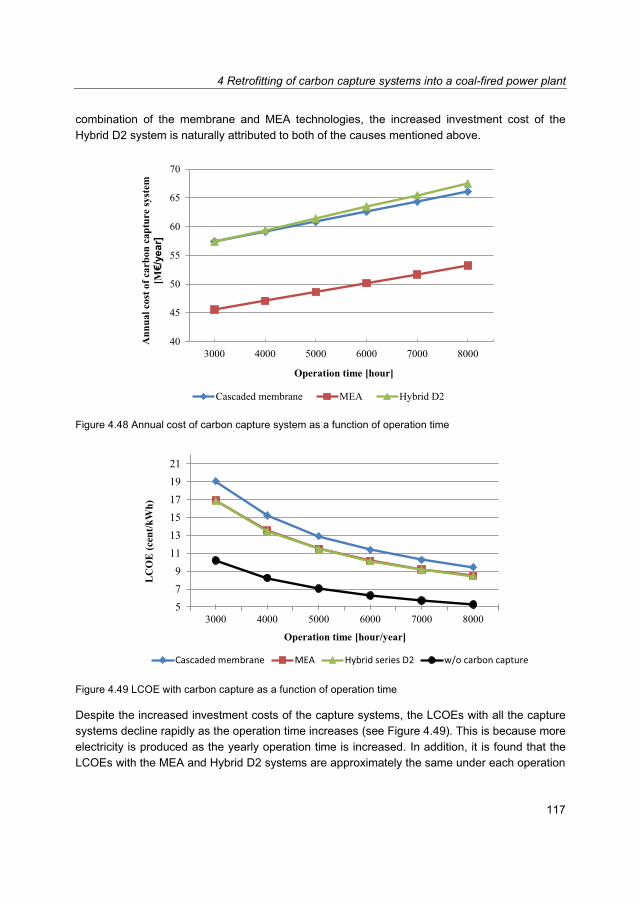
4 Retrofitting of carbon capture systems into a coal-fired power plant
117
5
7
9
11
13
15
17
19
21
3000 4000 5000 6000 7000 8000
LC
OE
(cen
t/kW
h)
Operation time [hour/year]
Cascaded membrane MEA Hybrid series D2 w/o carbon capture
combination of the membrane and MEA technologies, the increased investment cost of the Hybrid D2 system is naturally attributed to both of the causes mentioned above.
Figure 4.48 Annual cost of carbon capture system as a function of operation time
Figure 4.49 LCOE with carbon capture as a function of operation time
Despite the increased investment costs of the capture systems, the LCOEs with all the capture systems decline rapidly as the operation time increases (see Figure 4.49). This is because more electricity is produced as the yearly operation time is increased. In addition, it is found that the LCOEs with the MEA and Hybrid D2 systems are approximately the same under each operation
40
45
50
55
60
65
70
3000 4000 5000 6000 7000 8000
Ann
ual c
ost o
f car
bon
capt
ure
syst
em[M
€/ye
ar]
Operation time [hour]
Cascaded membrane MEA Hybrid D2

4.7 Economic evaluation
118
8.00
8.40
8.80
9.20
9.60
10.00
10 20 30 40 50 60
LC
OE
[cen
t/kW
h]
Membrane price [€/m2]
Cascaded membrane MEA Hybrid D2
time. In comparison to the reference plant without carbon capture (black curve), LCOEs with three capture systems are all higher than that without over the studied range of operation time.
� Key fact 14: Longer operation time will lead to higher investment cost on a carbon capture system but eventually a lower LCOE for the power plant.
Influences of the membrane price
In the base case, the membrane price of Polyactive® is assumed to be 50 €/m2. However, there is currently no commercial price for this membrane. Hence, the price of the membrane is another factor that is examined for its impacts on the annual cost of a CO2 capture system. The membrane price was varied from 10 to 60 €/m2, with a step of 5 €/m2. The results are plotted in Figure 4.50. Naturally, the LCOE of the power plant with the MEA system is not affected by the varied membrane price.
It is observed that the LCOE in the case with the cascaded membrane separation system is higher than that of the other two systems over the whole range of membrane price. An extreme case in which the membrane price was set at was also investigated. It is found that even in the case where the membrane price was set to be 0 €/m2, the LCOE with the cascaded membrane system is still the highest of the three capture systems. This is mostly due to the fact that the cascaded membrane system causes very a high efficiency penalty so that decreasing membrane price singly is not enough to reduce LCOE significantly. A large amount of cost is spent on the compressors and heat exchangers (see Figure 4.43). Concerning the Hybrid D2 system, it is revealed that the LCOE with this system equipped is lower than in the case with the MEA system as long as the membrane price is equivalent to or less than 50 €/m2, producing the lowest LCOE of the three capture systems.
Figure 4.50 LCOE as a function of membrane price

4 Retrofitting of carbon capture systems into a coal-fired power plant
119
8.00
8.50
9.00
9.50
10.00
10.50
11.00
11.50
1 2 3 4 5 6
LCO
E [c
ent/k
Wh]
Membrane lifetime [year]
Cascaded membrane MEA Hybrid D2
� Key fact 15: The Hybrid D2 system is more cost-efficient than the two standalone capture technologies when the membrane price is equivalent to or below 50 €/m2.
Influences of membrane lifetime
In addition to the price of the membrane, the impact of the membrane lifetime on LCOE is also investigated. The membrane lifetime was varied from 1 to 6 years and the results are displayed in Figure 4.51. It is found that the LCOEs for the cascaded membrane and Hybrid D2 systems decrease dramatically when the lifetime is prolonged from 1 to 3 years. Afterward, the decreasing rates of the LCOE curves are much slower. Particularly, the LCOE for the Hybrid D2 system, which barely changes when the membrane lifetime is greater than 4 years, is very close to that for the MEA system. Simply speaking, extending the membrane lifetime to be longer than 4 years is unnecessary in terms of decreasing the LCOE.
Figure 4.51 LCOE as a function of membrane lifetime
� Key fact 16: The influence of the membrane lifetime on LCOE is insignificant when the lifetime is over 4 years.
4.7.6 Breakeven CO2 emission allowance price
The economic results obtained in the previous section have not taken the CO2 allowance (CO2 tax) into consideration. In this section, the CO2 allowance price under the framework of the EU Emission Trading Scheme (EU ETS) is considered on the power plant to examine its influences. Simply put, the reference power plant needs to pay for the emitted CO2 with the CO2 allowance price. The allowance price was varied from 0 to 70 €/tCO2 and the LCOE for each capture system was calculated accordingly. The LCOE for the power plant without CCS was also calculated for comparison. The results are shown in Figure 4.52.

4.7 Economic evaluation
120
3
4
5
6
7
8
9
10
11
0 10 20 30 40 50 60 70
Lev
eliz
ed C
ost o
f Ele
ctri
city
[c
ent/k
Wh]
CO2 allowance price [€/tCO2]
w/o carbon capture
Cascaded membrane
MEA
Hybrid D2
Figure 4.52 LCOE as a function of the CO2 allowance price
Apparently, without CO2 tax, the LCOE of the power plant without carbon capture is much lower than in the cases with the CO2 capture systems. The LCOE of the reference power plant without CO2 capture is 5.36 cent/kWh while the LCOEs for other cases are all above 8 cents/kWh.
As the CO2 allowance price is increased, the gaps become smaller and, meanwhile, the curve of the case without carbon capture intersects with other curves. Readings at these intersected points are called the breakeven CO2 allowance price and LCOE. The breakeven values are tabulated in Table 4.22. It is found that not until the CO2 allowance price mounts to 48.6 and 49 €/tCO2 will the Hybrid D2 and MEA systems, respectively, become economically feasible. As for the cascaded membrane system, the CO2 allowance price must reach 65 €/tCO2 so as to make this technology applicable.
Table 4.22 Breakeven CO2 allowance price and LCOE
Cascaded membrane MEA Hybrid D2
Breakeven LCOE [cents/kWh] 10.24 9.07 9.03
Breakeven CO2 allowance
[€/tCO2] 65.0 49.0 48.6

4 Retrofitting of carbon capture systems into a coal-fired power plant
121
4.8 Discussion
4.8.1 Hybrid D1 vs Hybrid D2: lessons learned for hybrid membrane/MEA system design
After the technical and economic analysis, it has been concluded that the Hybrid D1 is neither a technically nor an economically attractive design. In comparison, the other hybrid design, i.e. Hybrid D2 system, yields the lowest LCOE and the highest net power output when the power plant is equipped with carbon capture. It is of great interest to discuss and analyze what factors lead to such differences and what lessons can be learned with respect to the hybrid system design.
As stated in Section 3.3, the single-stage membrane module in the Hybrid D1 system essentially functions as a CO2 enricher for the MEA section. According to the parametric study, increasing the inlet CO2 concentration is indeed able to reduce the specific reboiler duty for the MEA system (see Figure 4.11). Specifically, the specific reboiler duty of the Hybrid D1 system is lower than that of the MEA system by 0.12 GJ/tCO2 (see Table 4.10). The demand for steam has also dropped from 188.8 to 183.8 kg/s compared with the standalone MEA system. On the contrary, in the Hybrid D2 system, the MEA section deals with the CO2-diluted retentate gas from the membrane section. Due to this fact, the specific reboiler duty in the Hybrid D2 system is (3.98 GJ/tCO2) higher than that of the standalone MEA system (3.94 GJ/tCO2). Apparently, a lower specific reboiler duty has not led to lower energy consumption for Hybrid D1 system.
To better analyze the causes, the breakdowns of the total reboiler duty for the standalone MEA system and the MEA sections in the two hybrid systems are displayed in Table 4.23. Furthermore, the specific electricity demand for each section in the hybrid systems is also tabulated in Table 4.24.
Table 4.23 Breakdown of the total reboiler duty
Total reboiler
duty [GJ/h]
= Specific reboiler
duty [GJ/tCO2]
x Amount of CO2
captured [tCO2/h]
Standalone MEA 1489 3.94 378
MEA section in Hybrid D1
1444 3.82 378
MEA section in Hybrid D2
1043 3.98 262

4.8 Discussion
122
Table 4.24 Breakdown of the specific electricity demand into capture sections
Specific electric energy [MWhe/tCO2] (excl. compression)
MEA section Membrane section
Standalone MEA 0.25 N/A
Cascaded membrane N/A 0.32
Hybrid D1 0.24 0.16
Hybrid D2 0.16 0.05
It can be seen from Table 4.23 that the amount of CO2 dealt with by the MEA section in the Hybrid D1 system is the same as the standalone MEA system (378 tCO2/h). This is because the membrane and MEA sections in the Hybrid D1 system are arranged in a series manner. All the captured CO2 is still eventually separated in the MEA section. Also, because of the series arrangement, a sectional capture rate (95 %), which is higher than the overall capture rate (90 %), must be imposed on each section. This directly entails soaring membrane area (4.2 million m2) and electricity demand (0.16 MWhe/tCO2) for the membrane section in the Hybrid D1 system. As said earlier, the membrane section is configured to enhance the performance of the MEA technology. Nonetheless, the consequence of enhancement is that the specific electricity demand of the MEA section in the Hybrid D1 system is only marginally lower than that of the standalone MEA system (see Table 4.24). Not to mention the much increased capital cost of the membrane.
In comparison, the membrane section in the Hybrid D2 system shares the capture responsibility with the MEA section instead of ‘working’ for it. The total amount of CO2 captured in the Hybrid D2 system is still 378 tCO2/h. However, only 262 tCO2/h is dealt with by the MEA section and the capture task for the remaining 116 t/h of CO2 is undertaken by the membrane section. As a result, the total reboiler duty of the Hybrid D2 system becomes 446 GJ/h lower than that of the standalone MEA system in spite of its highest specific reboiler duty (see Table 4.23). Apparently, the reduction of the reboiler duty in the Hybrid D2 system is due to the decreased amount of CO2 dealt with by the MEA section. The electricity demand for the membrane section in the Hybrid D2 turns out to be less than one-third of the electricity demand of the membrane section in the Hybrid D1 system. As discussed in Section 4.5.1, the capture rate for the MEA section in the Hybrid D2 system is adjusted based on the pre-determined capture rate imposed on the membrane section to avoid significant increases in the membrane area and energy consumption. In this sense, the MEA section is actually designed to complement the capture task for the membrane section.
Conclusion 1: Given the current property of Polyactive® membrane, the main principle of designing a hybrid membrane/MEA system should be utilizing the MEA technology to
4 Retrofitting of carbon capture systems into a coal-fired power plant
123
complement the gas permeation technology (Hybrid D2) rather than using the membrane to boost the performance of the MEA technology (Hybrid D1).
4.8.2 Hybrid D2 vs standalone membrane and MEA technologies
As discussed above, the Hybrid D2 system is the winner of the two hybrid designs. It is also interesting to compare it to the two standalone capture technologies (cascade membrane and MEA systems).
It has been revealed that the cascaded membrane system is the second most energy-consuming and costly system, next to the Hybrid D1 system, of the 4 studied carbon capture systems (see Figure 4.27). A specific electricity demand of 0.42 MWhe/tCO2 is required and, consequently, an efficiency penalty of 13 %-pts is caused for the power plant. Moreover, as shown in Section 4.7, the CO2 avoidance cost of the cascaded membrane system is around 30 % higher than that of the MEA system. The sensitivity analysis shows that simply decreasing the price or extending the lifetime of the Polyactive® membrane cannot change the situation (see Figure 4.50). This result is to some extent in line with the discussion made by the author in Chapter 2 (see Section 2.8).
Conclusion 2: The large capital cost and energy consumption of the cascaded membrane system (Polyactive®) make it impossible to replace the MEA system for CO2 capture from power plants in the current commercial market.
As far as economics is concerned, the Hybrid D2 system is basically on a par with the MEA system in the base case. No big differences exist between the two systems in terms of LCOE and CO2 avoidance cost. However, technically speaking, the Hybrid D2 is essentially a more energy-efficient system. This is because the Hybrid D2 system consumes less specific electricity (0.31 MWhe/tCO2) than the MEA system (0.35 MWhe/tCO2) given the same CO2 capture rate (see Table 4.10). As a result, 14.4 MWe of power is saved when the power plant is equipped with the Hybrid D2 instead of the MEA system. As a matter of fact, the advantage of energy-saving is not reflected directly in the economic results in the present study. This is because the net power output of the power plant is not kept constant at the designed value (555 MWe) when the CO2 capture systems are equipped. Had a constant net output is required for the power plant, more fuels are needed to make up for the power loss caused by the MEA system than for the Hybrid D2 system. More CO2 will be generated if fossil fuels are used. The fact that the Hybrid D2 system has a higher CO2 capture cost but a lower CO2 avoidance cost than the MEA system is also proof to the statement.
Furthermore, as displayed in Figure 4.50, the power plant equipped with the Hybrid D2 system is actually capable of providing cheaper electricity than the MEA system as long as the price of Polyactive® membrane drops to below 50 €/m2.
Conclusion 3: The Hybrid D2 system is a more energy-efficient system than the standalone cascaded membrane and MEA systems. In the meantime, the economic competitiveness of the hybrid system is subject to the membrane price.

4.9 Summary
124
4.9 Summary
In this chapter, the 4 carbon capture models introduced in the last chapter are deployed in a retrofitted coal-fired power plant. The simulation model of the reference power plant, including the water-steam cycle and fuel/flue gas route, is presented in Section 4.1.
In Section 4.2, the specifications are optimized for the MEA system via a parametric study given the boundary condition of the reference power plant. Also, the steam extraction location is determined to be the IP/LP crossover pipe. Furthermore, the impacts of the integration of the MEA system into the power plant are investigated and the results are shown in Section 4.3. In order to guarantee that the steam extraction operation is flexible, a pressure control valve is found necessary to be placed in between the extraction point and the inlet of the LP turbine to maintain the pressure at the extraction point. It is revealed that the floating pressure at the extraction point is a more energy-efficient option. Given the same boundary condition, a parametric study has also been done for the membrane-based separation systems and the results are shown in Section 4.4. The study is performed for both the single-stage and cascaded membrane systems in order to better understand the characteristic of the Polyactive® membrane as well as to provide design reference for the hybrid capture systems.
In Section 4.5, the technical results of the four CO2 capture systems are compared. Due to the fact that the two hybrid capture systems are essentially comprised of the MEA and membrane technologies, no parametric studies were particularly conducted for the hybrid systems. The optimized configurations for the standalone MEA and membrane-based systems are directly given to corresponding sections in the hybrid systems. It is found that the Hybrid D1 and cascaded membrane system lead to the highest (15.6%-pts) and second highest (13 %-pts) efficiency penalties for the power plant, respectively. Meanwhile, the Hybrid D2 system results in the least efficiency penalty (9.7 %-pts). The part load behaviors of the carbon capture systems are also investigated in this chapter.
In Section 4.6, pinch analysis was used to analyze the potential for utilizing the waste heat from the CO2 capture and compression systems to preheat the feed water in the water-steam cycle. The waste heat integration has proven to be able to save electricity of 5.8, 5.4, 7.0 and 6.7 MWe for the cascaded membrane, MEA, Hybrid D1, and Hybrid D2 systems, respectively. However, such integration leads to more complex heat exchanger networks and higher capital costs are foreseeable.
Economic analyses are presented in Section 4.7. The Hybrid D1 system results in the highest CO2 avoidance cost (148.3 €/tCO2). The second highest CO2 avoidance cost (65.1 €/tCO2) occurs when the cascaded membrane system is installed. The Hybrid D2 system exhibits the lowest CO2 avoidance cost (48.8 €/tCO2) although the CO2 avoidance cost for the standalone MEA system is only slightly higher (49.1 €/tCO2). A series of sensitivity analyses were conducted in this section as well.

4 Retrofitting of carbon capture systems into a coal-fired power plant
125
Discussions concerning the results obtained in this chapter have been made in Section 4.8. All in all, some key conclusions are highlighted as follows:
� A higher efficiency penalty is induced when a carbon capture system is operated at part load. � Thermal energy demand for the cascaded membrane system cannot be neglected but can
be provided internally via waste heat integration. � Under the research condition set in the present study, decreasing the unit price or
prolonging the lifetime of the Polyactive® membrane cannot change the fact that the cascaded membrane system is more energy-consuming and expensive than the traditional MEA technology
� The Hybrid D1 system is neither a technically nor an economically attractive design in comparison to the standalone membrane or MEA technology.
� The Hybrid D2 system is a more energy-efficient design as compared to the standalone membrane or MEA technology and can also be more cost-effective when the membrane price is equivalent to or below
� The principle of designing a hybrid membrane/MEA system should be utilizing the MEA technology to complement the gas permeation technology rather than using the membrane to boost the performance of the MEA technology.

4.9 Summary
126

127
5 Deployment of carbon capture systems in a greenfield iron and steel plant
In this chapter, the applications of the cascaded membrane, MEA, and Hybrid D2 systems are extended to the iron and steel industry. The Hybrid D1 system has been ruled out for further research for its undesirable performances observed in the last chapter. The other three capture systems are implemented in a hypothetical reference iron and steel plant for carbon capture. Section 5.1 gives an introduction to the iron and steel plant. Information relevant to CO2 emissions and the energy flow in the plant is analyzed. In Section 5.2, the carbon capture strategy and the methods for the energy supply to the capture systems are discussed. The technical and economic results for CO2 capture in the reference iron & steel plant are presented in Section 5.3 and 5.4, respectively. Finally, a discussion with regard to the obtained results is made in Section 5.5.
5.1 Reference integrated iron and steel plant
5.1.1 General considerations and key assumptions
Detailed data from any real steel plants are classified as ‘competition data’ and thus not publicly available. Therefore, a conceptual integrated steel mill [116], which has been comprehensively investigated by IEAGHG is chosen as the reference plant for this study. Featuring a typical modern integrated steel mill in Western Europe, the base case study presented in the CCS study report of IEAGHG provides a very solid baseline for studying the feasibility of any kind of carbon capture technologies in the iron and steel plant [116]. Data regarding the operation of the plant as well as the flue gas characteristics are provided in detail. The reference iron & steel plant is assumed to be located in the coastal region of Western Europe. It produces 4 million tons of Hot Rolled Coil (HRC) every year. Information about the plant is displayed in Table 5.1.
Table 5.1 Characteristics of the reference iron and steel plant [116].
Parameter Unit Value
HRC production capacity Mt/year 4
Thermal energy consumption GJ/tHRC 21.3
Electric energy consumption kWh/tHRC 172.1
CO2 emission Mt/y 8.38
Plant lifetime year 25
The following unit processes are included inside the boundary limit:
� Coke plant

5.1 Reference integrated iron and steel plant
128
� Sinter plant � Blast furnace and hot stove (iron making) � Basic oxygen furnace (steel making) � Lime plant � Continuous casting � Reheating furnace � Hot rolling mill � Air separation unit (oxygen plant) � Power plant
Additionally, some assumptions and considerations that are the same as in the IEAGHG report [116] are used:
� Only one type of steel product is produced: Hot Rolled Coil (HRC) � Balanced electricity production: electricity produced by the captive power plant is
exactly enough to support the operation of the whole plant. � Natural gas access: the plant is accessible to natural gas supply to supplement energy. � Off-gas distribution:
� Coke oven gas (COG) would supply fuel to: � coke plant � sinter plant � hot stoves � lime kiln � reheating furnace
� Blast furnace gas (BFG) would supply fuel to: � hot stoves � power plant
� Basic oxygen furnace gas (BOFG) would supply fuel to the power plant � Steady-state: All exhaust gases are continuous and concentrations are stable
It should also be noted that according to the IEAGHG report [116, pp. B-7], typical European integrated steel mills usually do not own lime, oxygen and power plants. The products from these plants are normally purchased over fence. However, they are considered to be inside the fence in this study in order to simplify the accounting of direct CO2 emissions.
5.1.2 CO2 emissions
The general production process and major point sources of CO2 emissions in the reference iron and steel plant are illustrated in Figure 5.1. It can be seen that the CO2 emissions generated in the reference steel plant are mainly emitted at six points:
� Coke plant � Sinter plant

5 Deployment of carbon capture systems in a greenfield iron and steel plant
129
� Hot stove � Lime plant � Reheating & rolling process � Power plant
It should be noted that there is still a small amount of CO2 (83 kg/tHRC) that is emitted from other locations. These CO2 emissions are either diffuse emissions or assumed to be flared directly as defined in the IEAGHG report [116]. Hence, they are not taken into account for the CO2 capture study. Nonetheless, they are included for the calculation of the total amount of CO2 avoided for the whole plant.
Figure 5.1 Production process and CO2 emission sources in the reference iron and steel plant [116].
The compositions of the flue gases from the aforementioned six units are presented in Table 5.2. The CO2 in the flue gases are exhausted directly to the environment (direct CO2 emissions). Of the six points, the flue gas from the sinter plant has the largest volume flow rate. However, the CO2 fraction in this flue gas is only 4.81 vol%. Similarly, the CO2 fraction in the flue gas from the reheating and rolling process only accounts for 4.6 vol%. Contaminants in the flue gases (SOx, NOx, dust, etc.) have already been reduced by onsite flue gas purification equipment (SCR, FGD, etc) [116]. The remaining contents of these impurities are also shown in Table 5.2. Other pollutants such as chlorides are likely to exist as well but not reported in the IEAGHG report. Moreover, the wet scrubbers implemented in the studied capture models are capable of further ridding flue gases of pollutants (see Figure 3.1 and Figure 3.7). Therefore, the acid gases and dust were neglected for capture simulation just as in the power plant.

5.1 Reference integrated iron and steel plant
130
Table 5.2 Characteristics of the flue gases in the reference iron and steel plant [116]
Variable Unit Power plant
Lime plant Reheating & rolling
Hot stove Sinter plant
Coke oven
Mass flow(wet)
Mt/y 10.66 1.01 3.13 4.39 1.81 3.47
Vol. flow rate
Nm3/s 240 24 81 98 337 87
Pressure bar 1.03 1.03 1.03 1.11 1.03 1.03
Temperature °C 150 130 500 140 120 250
Composition
CO2 vol% 26.43 19.41 4.6 27.3 4.81 14.77
O2 vol% 0.71 7.77 7.2 0.8 14.9 5
N2 vol% 65.88 60.24 71.86 65.52 72.65 69.47
H2O vol% 6.98 12.58 16.34 6.38 6.9 10.76
CO vol% / / / / 0.74 /
SOx mg/Nm3 10 10 10 10 300 10
NOx mg/Nm3 60 30 500 60 200 280
Dust mg/Nm3 < 5 < 5 < 5 < 5 < 5 < 5
The share of the CO2 emission on a weight basis for each production unit is plotted in a pie chart (see Figure 5.2). It is observed that nearly half of the CO2 emissions come from the power plant. Comparatively, the sinter plant accounts for much smaller CO2 emission (14 wt%) despite its largest flow rate of flue gas.
In addition to the flue gases, there also exist off-gases (also known as process gases) that are generated from some of the units but not emitted directly to the environment. They contain CO2 as well as combustible gases and therefore sent to other units to be combusted as fuels. Basically, the off-gases are generated in three units, i.e. coke oven, blast furnace, and oxygen furnace. Their respective destinations have been given in the last section (see Figure 5.1).
The characteristics of these off-gases are displayed in Table 5.3. As compared to the direct CO2 emissions from the flue gases, the potential CO2 emissions from the off-gases are usually called indirect CO2 emissions [115].

5 Deployment of carbon capture systems in a greenfield iron and steel plant
131
9%
14%
21%
3%4%
49%
Coke oven
Sinter plant
Hot stove
Reheating &rollingLime plant
Power plant
Figure 5.2 Weight percent of CO2 emissions from different units in the iron and steel plant Table 5.3 Characteristics of the off-gases [116]
Unit Off-gas
COG BFG BOFG
CH4 vol.% 23.04 0 0
H2 vol.% 59.53 3.63 0
CO2 vol.% 0.96 22.1 2.64
CO vol.% 3.84 22.34 14.44
O2 vol.% 0.19 0 56.92
N2 vol.% 5.76 48.77 13.83
H2O vol.% 3.98 3.15 12.6
Other vol.% 2.69 0 0
Pressure Bar 1.11 1.11 1.11
temperature °C 29 25 50
5.1.3 Energy flow in the iron and steel plant
In a modern integration iron and steel plant, a very complicated energy flow network exists as a result of the intermediate products and energy delivery between the production units. The energy flows inside the reference iron and steel plant without CCS were first analyzed in order to figure out if there is available energy for the CO2 capture systems. A schematic diagram of
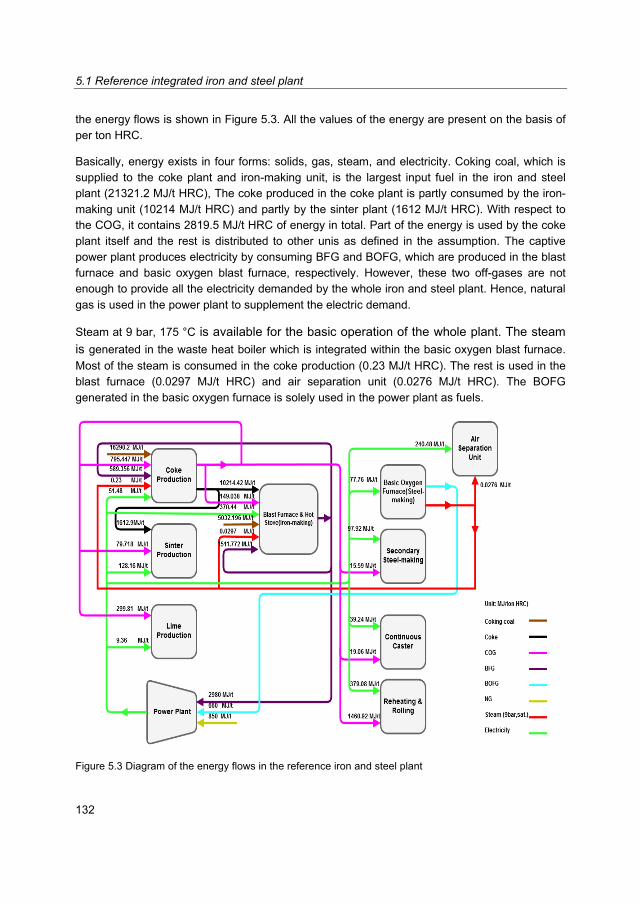
5.1 Reference integrated iron and steel plant
132
the energy flows is shown in Figure 5.3. All the values of the energy are present on the basis of per ton HRC.
Basically, energy exists in four forms: solids, gas, steam, and electricity. Coking coal, which is supplied to the coke plant and iron-making unit, is the largest input fuel in the iron and steel plant (21321.2 MJ/t HRC), The coke produced in the coke plant is partly consumed by the iron-making unit (10214 MJ/t HRC) and partly by the sinter plant (1612 MJ/t HRC). With respect to the COG, it contains 2819.5 MJ/t HRC of energy in total. Part of the energy is used by the coke plant itself and the rest is distributed to other unis as defined in the assumption. The captive power plant produces electricity by consuming BFG and BOFG, which are produced in the blast furnace and basic oxygen blast furnace, respectively. However, these two off-gases are not enough to provide all the electricity demanded by the whole iron and steel plant. Hence, natural gas is used in the power plant to supplement the electric demand.
Steam at 9 bar, 175 °C is available for the basic operation of the whole plant. The steam is generated in the waste heat boiler which is integrated within the basic oxygen blast furnace. Most of the steam is consumed in the coke production (0.23 MJ/t HRC). The rest is used in the blast furnace (0.0297 MJ/t HRC) and air separation unit (0.0276 MJ/t HRC). The BOFG generated in the basic oxygen furnace is solely used in the power plant as fuels.
Figure 5.3 Diagram of the energy flows in the reference iron and steel plant

5 Deployment of carbon capture systems in a greenfield iron and steel plant
133
5.1.4 Discussion
Comparing Figure 5.3 with Figure 5.1, it can be found that most of the CO2 emissions in the iron and steel plant are, directly or indirectly, related to the treatment processes of raw materials. Most of the carbon footprints can be traced back to those fundamental production processes, such as coke and lime production. In addition, the use of natural gas also contributes to the total CO2 emission. Nevertheless, according to the specific energy consumption, it can be concluded that the CO2 from the natural gas only accounts for a small part of the total CO2 emission (only 850 MJ of natural gas for 1 ton HRC is required). Moreover, it can be seen from Figure 5.3 that the reference iron & steel plant has a highly self-sufficient energy network design and thus no surplus energy can be provided to any additional equipment.
� Key fact 1: Most of the CO2 emissions derive from the raw material treatment processes, i.e. process-related CO2 emissions.
� Key fact 2: A modern integrated steel mill has a highly integrated energy network.
5.2 Design basis for carbon capture
5.2.1 CO2 capture strategy
As discussed in the last section, the CO2 emissions generated in the iron and steel plant can be divided into two groups: direct and indirect emissions. Comparing the flue gases with the off-gases, we can find that the CO2 fractions in the flue gases are generally higher. Furthermore, the present study is conducted with the principle of not breaking the original energy network of the reference plant. Therefore, the CO2 capture only aims at the direct CO2 emissions in the iron and steel plant.
That being said, it is found that not all direct emission point sources are appropriate for CO2 capture. According to the parametric studies done for the CO2 capture systems in Chapter 4, the energy demands of CO2 capture systems rise significantly when CO2 concentrations in flue gases enter the low-concentration area (< 20 mol%). Note that the CO2 fractions in the flue gases of the sinter plant and reheating & rolling process are less than 5 vol%. Therefore, the two points of emissions are pre-excluded for carbon capture deployment. One consequence of this capture strategy is that 17 wt.% of the total CO2 emissions in the flue gases is directly emitted from the sinter plant and reheating & rolling process to the environment (see Figure 5.2). In this capture scenario, 71% of the total CO2 emission from the iron and steel plant is to be captured had no additional CO2 emissions are generated.
� Key fact 3: Not all point sources of CO2 emissions in the steel plant are appropriate for deploying post-combustion capture systems.
Obviously, unlike the coal-fired power plant discussed in the last chapter, multiple point sources of CO2 emissions exist in the iron and steel plant. Moreover, these point sources are spread across a large area in the plant. How to deploy carbon capture systems in this situation is also a

5.2 Design basis for carbon capture
134
crucial part of the capture strategy. Ho and Wiley proposed three options for capturing CO2 from the multiple point sources of CO2 emissions [115, p. 749]:
1. Treating gases individually: deploying a carbon capture system at each one of the emission points;
2. Centralized capture: directing all the gases to one location and capturing the mixed gas with one single capture system;
3. Grouping point sources: dividing the multiple emission points into several groups and for each group, one capture system is deployed.
According to Ho and Wiley [115], every option has pros and cons and thus should be evaluated site-specifically when it comes to actual deployment. For an early-stage examination of carbon capture for the iron & steel plant, the goal of this work is to have an insight into the feature of carbon capture for each point source. Apparently, only the first option can provide the results that reflect the impacts of individual point sources on energy consumption and cost.
� Key fact 4: Strategy of treating each point source individually is adopted in this work.
5.2.2 Energy supply for the CO2 capture systems
Equipped with the CO2 capture systems, the iron and steel plant will inevitably demand additional electricity and/or steam. As discussed above, the electricity and steam produced by the reference plant are exactly sufficient to maintain the original operation of the iron and steel plant. Hence, additional sources of steam and electricity must be added to support the operation of the CO2 capture systems. In this study, a base case for the energy supply to the capture systems is defined as:
� Steam: a newly built steam generation unit � Electricity: purchased from the grid
An additional steam generation plant consuming natural gas is assumed to be built to provide steam for the CO2 capture systems. The electricity required by the CO2 capture systems is assumed to be purchased from the grid. In doing so, the original energy supply chain in the reference iron and steel plant will not be intervened and thus no modifications are required to be made to those existing units.
Steam generation plant (SGP)
For the steam generation plant, a natural gas boiler was simulated in EBSILON® and its schematic is displayed in Figure 5.4. In the model, a combustion chamber and steam generator blocks are used to represent the boiler as a water tube boiler (low-pressure boiler), which delivers live steam at 3 bar, 135 °C. This steam quality is specified to meet the steam demand of the reboiler of the MEA capture system (2.7 bar, 130 °C) while assuming a 10 % pressure drop and a 5 °C temperature drop. A heat consumer component block is used to function as a reboiler of the MEA system. Based on the calculated heat reboiler duty, an internal ‘controller’
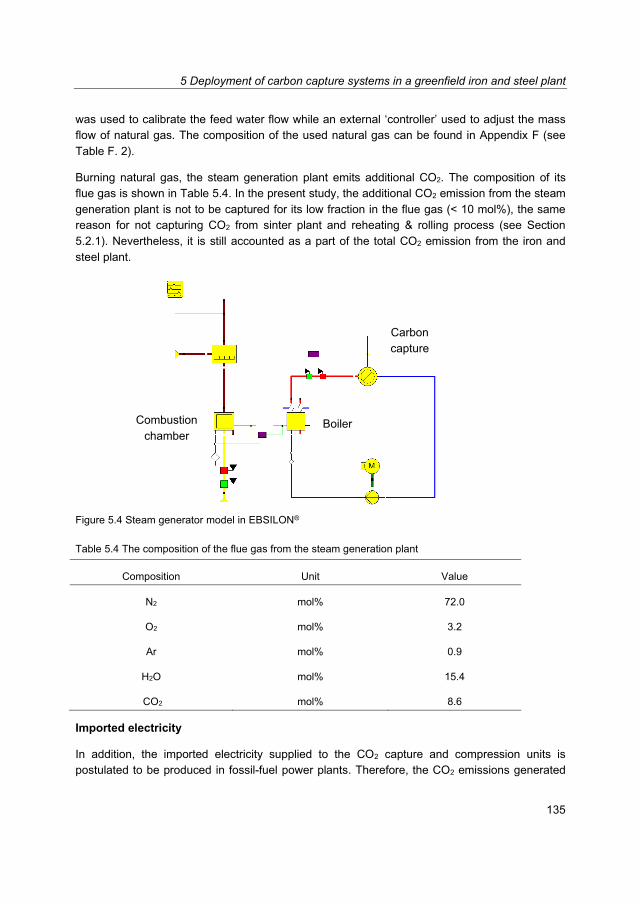
5 Deployment of carbon capture systems in a greenfield iron and steel plant
135
was used to calibrate the feed water flow while an external ‘controller’ used to adjust the mass flow of natural gas. The composition of the used natural gas can be found in Appendix F (see Table F. 2).
Burning natural gas, the steam generation plant emits additional CO2. The composition of its flue gas is shown in Table 5.4. In the present study, the additional CO2 emission from the steam generation plant is not to be captured for its low fraction in the flue gas (< 10 mol%), the same reason for not capturing CO2 from sinter plant and reheating & rolling process (see Section 5.2.1). Nevertheless, it is still accounted as a part of the total CO2 emission from the iron and steel plant.
Figure 5.4 Steam generator model in EBSILON®
Table 5.4 The composition of the flue gas from the steam generation plant
Composition Unit Value
N2 mol% 72.0
O2 mol% 3.2
Ar mol% 0.9
H2O mol% 15.4
CO2 mol% 8.6
Imported electricity
In addition, the imported electricity supplied to the CO2 capture and compression units is postulated to be produced in fossil-fuel power plants. Therefore, the CO2 emissions generated
Combustion chamber
Carbon capture
Boiler

5.2 Design basis for carbon capture
136
by producing the imported electricity is also accounted as part of the CO2 emissions from the iron steel plant. An emission factor of 523 kg CO2/MWhe [192] is used for the accounting of CO2 emissions
5.2.3 Boundary of the carbon capture analysis
Having determined the CO2 capture target, strategy and energy supply approach, the overall capture scenarios and boundary of the techno-economic analysis for carbon capture in the reference iron and steel plant are summarized and displayed (see Figure 5.5). As discussed previously, four CO2 emission point sources, i.e. coke production, hot stove, lime production, and power plant are targeted. Specifically, three scenarios, corresponding to the three capture systems (cascaded membrane, MEA, and Hybrid D2 systems), are deployed at the four point sources, respectively.
Figure 5.5 The boundary of techno-economic analysis for carbon capture in the reference plant

5 Deployment of carbon capture systems in a greenfield iron and steel plant
137
0.0
50.0
100.0
150.0
200.0
250.0
Cascaded membrane MEA Hybrid D2
Ele
ctri
city
dem
and
[MW
e]
Power plant
Hot stove
Coke oven
Lime plant
Compression train 1
Compression train 2
Total demand
At each point source, a CO2 capture unit is implemented. In addition, two CO2 compression trains are used to compress a large amount of CO2 captured. Each of the compression trains receives gases from two of the four capture units as shown in Figure 5.5. The compression train 1 is responsible for compressing the CO2 captured from the power plant and lime production process while the compression train 2 deals with the CO2 captured from the hot stove and coke production process. The techno-economic analysis in the chapter only focuses on the CO2 capture and compression units, as well as the added steam generation unit. The production processes of other units stay unchanged. The space requirement for the installed capture units, compression trains, and steam plants are not assessed in the present study.
5.3 Technical analysis for carbon capture
This section presents the technical results of the three studies scenarios. As mentioned above, it is important to examine the performances of the CO2 capture systems for each emission point source. Therefore, the energy consumption of the CO2 capture systems at each target unit is presented. The geometric results concerning absorber & stripper diameters and membrane area are displayed in Appendix J.1 (see Table J. 1).
5.3.1 Energy consumption
Electricity demand
The electricity demand of the three capture systems for each emission point source is displayed in Figure 5.6. It is not surprising to find that the cascaded membrane system consumes more electricity than the other two systems for each emission point source since electricity is the only form of energy demanded by this system.
Figure 5.6 Electricity demand for CO2 capture and compression

5.3 Technical analysis for carbon capture
138
0
100
200
300
400
500
600
700
800
Cascaded membrane MEA Hybrid D2
The
rmal
ene
rg y
dem
and
[MW
th]
Power plant
Hot stove
Coke oven
Lime plant
Total heat demand
In total, the cascaded membrane capture system and compression require 217 MWe of electricity while the Hybrid D2 system plus compression process consumes 105 MWe. Only 76 MWe is required by the MEA system and compression trains.
Thermal energy demand
In Figure 5.7, the thermal energy consumption of the three capture systems is compared. Since heat integration is also conducted for the cascaded membrane units as described in Section 4.6.1, no thermal energy is required for them in the steel plant either. By contrast, the MEA system is the largest consumer of thermal energy, which requires totally 703 MWth of heat for MEA regeneration. The demand for the Hybrid D2 system for thermal energy is 461 MWth.
Figure 5.7 Thermal energy demand for CO2 capture
As far as the four emission sources are concerned, the energy demand is apparently related to the amount of CO2 emissions. The power plant has the largest demand for electricity or thermal energy regardless of the type of capture system applied. This is due to the largest amount of CO2 in its flue gases as shown in Figure 5.2.
The specific reboiler duty and electricity demand for each capture system and each point source of emission are tabulated in Table 5.5. Generally, the specific reboiler duties at the emission sources of the Hybrid D2 system are lower than that of the standalone MEA system except for the hot stove. As discussed in Chapter 4, this is a result of varied flow rates and CO2 concentrations combined. In addition, the overall specific electricity consumption of the cascaded membrane system is nearly three times as much as that of the MEA system while twice as much as that of the Hybrid D2 system.

5 Deployment of carbon capture systems in a greenfield iron and steel plant
139
Table 5.5 Specific reboiler duty and electricity demand
Emission sources
Unit Cascaded membrane
MEA Hybrid D2
Specific reboiler duty
Power plant
GJ/tCO2
/ 3.74 3.69
Hot stove / 3.58 3.63
Coke oven / 3.93 3.82
Lime plant / 3.54 3.51
Specific electricity demand
Power plant
MWhe/tCO2
0.17 0.02 0.05
Hot stove 0.17 0.005 0.05
Coke oven 0.24 0.03 0.05
Lime plant 0.22 0.01 0.05
Compression train 1
0.11 0.09 0.09
Compression train 2
0.11 0.09 0.09
Total 0.29 0.10 0.14
5.3.2 CO2 captured and avoided
The additional CO2 emissions from the steam generation plant and imported electricity for each type of capture system are tabulated in Table 5.6.
Table 5.6 Additional CO2 generated due to the imported electricity and steam generator
Unit Cascaded membrane
MEA Hybrid D2
Additional CO2
emission from SGP
Mt/y / 2.38 1.56
Additional CO2 from imported
electricity Mt/y 0.9 0.3 0.4
Total Mt/y 0.9 2.7 2.0
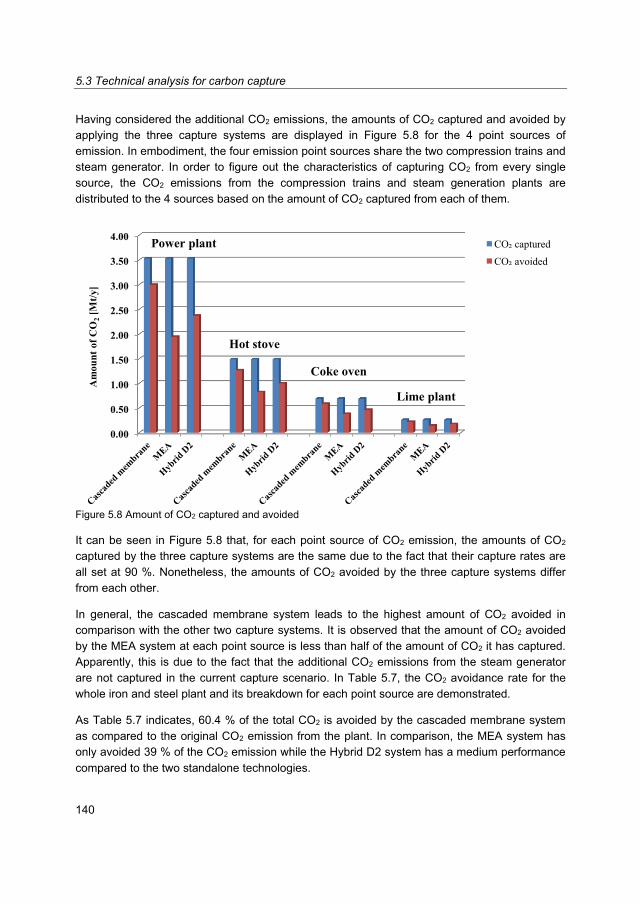
5.3 Technical analysis for carbon capture
140
0.00
0.50
1.00
1.50
2.00
2.50
3.00
3.50
4.00
Am
ount
of C
O2
[Mt/y
]
CO₂ captured
CO₂ avoided
Power plant
Hot stove
Coke oven
Lime plant
Having considered the additional CO2 emissions, the amounts of CO2 captured and avoided by applying the three capture systems are displayed in Figure 5.8 for the 4 point sources of emission. In embodiment, the four emission point sources share the two compression trains and steam generator. In order to figure out the characteristics of capturing CO2 from every single source, the CO2 emissions from the compression trains and steam generation plants are distributed to the 4 sources based on the amount of CO2 captured from each of them.
Figure 5.8 Amount of CO2 captured and avoided
It can be seen in Figure 5.8 that, for each point source of CO2 emission, the amounts of CO2 captured by the three capture systems are the same due to the fact that their capture rates are all set at 90 %. Nonetheless, the amounts of CO2 avoided by the three capture systems differ from each other.
In general, the cascaded membrane system leads to the highest amount of CO2 avoided in comparison with the other two capture systems. It is observed that the amount of CO2 avoided by the MEA system at each point source is less than half of the amount of CO2 it has captured. Apparently, this is due to the fact that the additional CO2 emissions from the steam generator are not captured in the current capture scenario. In Table 5.7, the CO2 avoidance rate for the whole iron and steel plant and its breakdown for each point source are demonstrated.
As Table 5.7 indicates, 60.4 % of the total CO2 is avoided by the cascaded membrane system as compared to the original CO2 emission from the plant. In comparison, the MEA system has only avoided 39 % of the CO2 emission while the Hybrid D2 system has a medium performance compared to the two standalone technologies.

5 Deployment of carbon capture systems in a greenfield iron and steel plant
141
With respect to each emission point source, the largest part of CO2 is avoided at the power plant. The hot stove is the second largest source for CO2 avoidance. The coke and lime productions combined only contribute 9.6, 6.2 and 7.5 % to the total rates of CO2 avoided by the cascaded membrane, MEA and Hybrid D2 systems, respectively.
Table 5.7 CO2 capture and avoidance rates
Emission source
Unit Cascaded membrane
MEA Hybrid D2
CO2 avoidance rate
Power plant
%
35.7 23.1 28.0
Hot stove 15.1 9.7 11.8
Coke oven 7.0 4.5 5.5
Lime plant 2.6 1.7 2.0
Total 60.4 39.0 47.3
5.3.3 Sensitivity analysis
As shown in the last section, the amounts of CO2 avoided by the capture systems are, as compared to the amounts of CO2 captured, undermined by the additional CO2 emissions owing to the use of imported electricity and steam generation plant. Hence, the CO2 emissions induced by the deployment of the steam generation plant and the imported electricity were varied to examine the impacts.
Sensitivity of the CO2 avoidance rate to the CO2 emission factor of the imported electricity
As defined in Section 5.2.2, the imported electricity is assumed to be produced in coal-fired power plants and an emission factor of 523 kg/MWhe is used in the base case. For the sensitivity analysis, the factor was varied by + 30 and - 30 %, respectively, for the three capture systems to check what the impacts on the CO2 avoidance rate would be. Moreover, a case assuming zero CO2 emissions from the imported electricity, which simulates a situation where carbon-free fuels are used, is considered as well. The results are displayed in Figure 5.9.
Naturally, increasing the emission factor would reduce the CO2 avoidance rates for all the three capture systems and vice versa. Due to the fact that the cascaded membrane system has the highest demand for electricity as shown in Figure 5.6, varying the emission factor apparently has larger impacts on this system than the other two. When carbon-free fuels are used, the CO2 avoidance rate would rise from 60.4% in the base case to 71%. Meanwhile, the CO2 avoidance rates of the MEA and Hybrid D2 systems would rise by 3.8 % and 5.2% as compared to the base case, respectively.
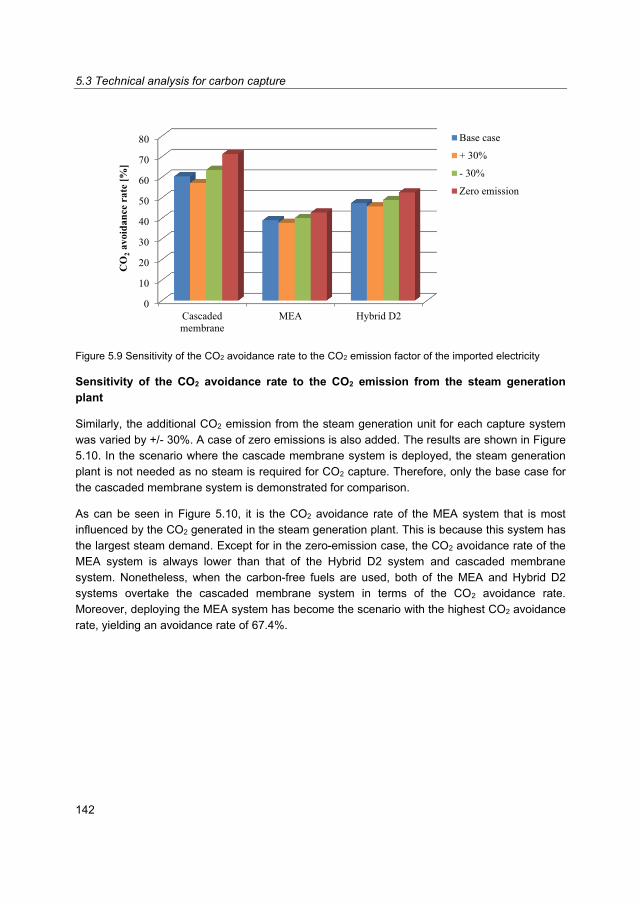
5.3 Technical analysis for carbon capture
142
0
10
20
30
40
50
60
70
80
Cascaded
membrane
MEA Hybrid D2
CO
2av
oida
nce
rate
[%]
Base case
+ 30%
- 30%
Zero emission
Figure 5.9 Sensitivity of the CO2 avoidance rate to the CO2 emission factor of the imported electricity
Sensitivity of the CO2 avoidance rate to the CO2 emission from the steam generation plant
Similarly, the additional CO2 emission from the steam generation unit for each capture system was varied by +/- 30%. A case of zero emissions is also added. The results are shown in Figure 5.10. In the scenario where the cascade membrane system is deployed, the steam generation plant is not needed as no steam is required for CO2 capture. Therefore, only the base case for the cascaded membrane system is demonstrated for comparison.
As can be seen in Figure 5.10, it is the CO2 avoidance rate of the MEA system that is most influenced by the CO2 generated in the steam generation plant. This is because this system has the largest steam demand. Except for in the zero-emission case, the CO2 avoidance rate of the MEA system is always lower than that of the Hybrid D2 system and cascaded membrane system. Nonetheless, when the carbon-free fuels are used, both of the MEA and Hybrid D2 systems overtake the cascaded membrane system in terms of the CO2 avoidance rate. Moreover, deploying the MEA system has become the scenario with the highest CO2 avoidance rate, yielding an avoidance rate of 67.4%.

5 Deployment of carbon capture systems in a greenfield iron and steel plant
143
0
10
20
30
40
50
60
70
Cascaded
membrane
MEA Hybrid D2
CO
2av
oida
nce
rate
[%]
Base case
+ 30%
-30%
Zero emission
Figure 5.10 Sensitivity of the CO2 avoidance rate to the CO2 emissions from the SGU
5.4 Economic analysis
5.4.1 Cost estimation basis
In the IEAGHG report [116], the studied conceptual iron and steel plant was assumed to be built in the year 2010 and the cost of HRC was estimated on the basis of this year. Given the fact that the production process is interfered with by carbon capture, the cost of HRC without CCS for the report was directly escalated to 2016 € using CEPCI. This study only estimates the cost of carbon capture and the incremental cost of HRC due to the deployment of carbon capture. The total HRC cost with carbon capture is estimated by adding the incremental cost of HRC on the top of the basic HRC cost without carbon capture. The general basis for the economic analysis for the iron and steel plant is displayed in Table 5.8. CO2 allowance price is not considered at this stage.
Table 5.8 The assumptions and cost parameters for the reference iron and steel plant
Parameter Unit Value
Operating hour h/year 8000
Year of construction / 2016
Lifetime year 25
Cost of HRC (2016) €/t 509.7
Price of imported electricity €/kWh 0.088
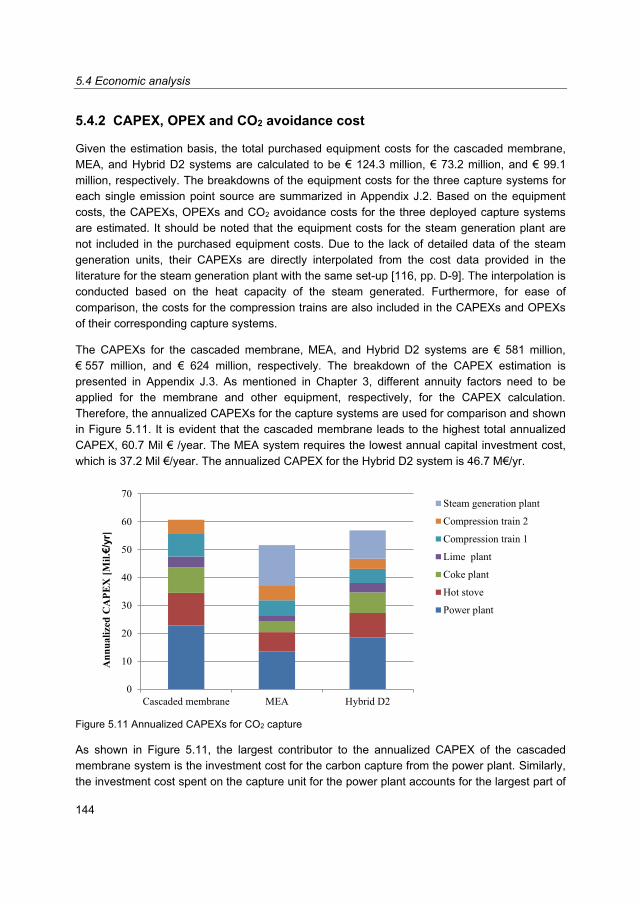
5.4 Economic analysis
144
0
10
20
30
40
50
60
70
Cascaded membrane MEA Hybrid D2
Ann
ualiz
ed C
APE
X [M
il.€/
yr]
Steam generation plant
Compression train 2
Compression train 1
Lime plant
Coke plant
Hot stove
Power plant
5.4.2 CAPEX, OPEX and CO2 avoidance cost
Given the estimation basis, the total purchased equipment costs for the cascaded membrane, MEA, and Hybrid D2 systems are calculated to be € 124.3 million, € 73.2 million, and € 99.1 million, respectively. The breakdowns of the equipment costs for the three capture systems for each single emission point source are summarized in Appendix J.2. Based on the equipment costs, the CAPEXs, OPEXs and CO2 avoidance costs for the three deployed capture systems are estimated. It should be noted that the equipment costs for the steam generation plant are not included in the purchased equipment costs. Due to the lack of detailed data of the steam generation units, their CAPEXs are directly interpolated from the cost data provided in the literature for the steam generation plant with the same set-up [116, pp. D-9]. The interpolation is conducted based on the heat capacity of the steam generated. Furthermore, for ease of comparison, the costs for the compression trains are also included in the CAPEXs and OPEXs of their corresponding capture systems.
The CAPEXs for the cascaded membrane, MEA, and Hybrid D2 systems are € 581 million, € 557 million, and € 624 million, respectively. The breakdown of the CAPEX estimation is presented in Appendix J.3. As mentioned in Chapter 3, different annuity factors need to be applied for the membrane and other equipment, respectively, for the CAPEX calculation. Therefore, the annualized CAPEXs for the capture systems are used for comparison and shown in Figure 5.11. It is evident that the cascaded membrane leads to the highest total annualized CAPEX, 60.7 Mil € /year. The MEA system requires the lowest annual capital investment cost, which is 37.2 Mil €/year. The annualized CAPEX for the Hybrid D2 system is 46.7 M€/yr.
Figure 5.11 Annualized CAPEXs for CO2 capture
As shown in Figure 5.11, the largest contributor to the annualized CAPEX of the cascaded membrane system is the investment cost for the carbon capture from the power plant. Similarly, the investment cost spent on the capture unit for the power plant accounts for the largest part of
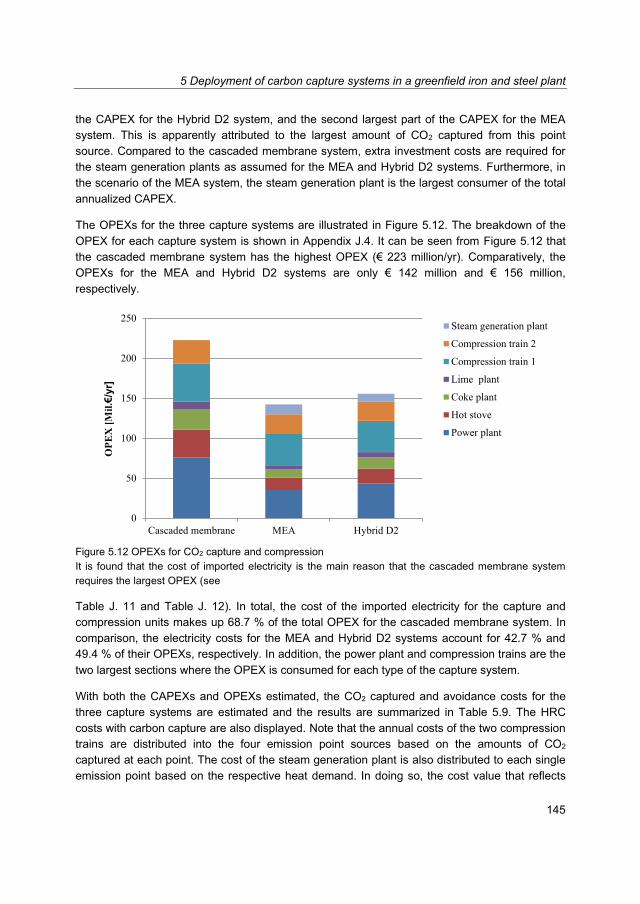
5 Deployment of carbon capture systems in a greenfield iron and steel plant
145
0
50
100
150
200
250
Cascaded membrane MEA Hybrid D2
OPE
X [M
il.€/
yr]
Steam generation plant
Compression train 2
Compression train 1
Lime plant
Coke plant
Hot stove
Power plant
the CAPEX for the Hybrid D2 system, and the second largest part of the CAPEX for the MEA system. This is apparently attributed to the largest amount of CO2 captured from this point source. Compared to the cascaded membrane system, extra investment costs are required for the steam generation plants as assumed for the MEA and Hybrid D2 systems. Furthermore, in the scenario of the MEA system, the steam generation plant is the largest consumer of the total annualized CAPEX.
The OPEXs for the three capture systems are illustrated in Figure 5.12. The breakdown of the OPEX for each capture system is shown in Appendix J.4. It can be seen from Figure 5.12 that the cascaded membrane system has the highest OPEX (€ 223 million/yr). Comparatively, the OPEXs for the MEA and Hybrid D2 systems are only € 142 million and € 156 million, respectively.
Figure 5.12 OPEXs for CO2 capture and compression It is found that the cost of imported electricity is the main reason that the cascaded membrane system requires the largest OPEX (see
Table J. 11 and Table J. 12). In total, the cost of the imported electricity for the capture and compression units makes up 68.7 % of the total OPEX for the cascaded membrane system. In comparison, the electricity costs for the MEA and Hybrid D2 systems account for 42.7 % and 49.4 % of their OPEXs, respectively. In addition, the power plant and compression trains are the two largest sections where the OPEX is consumed for each type of the capture system.
With both the CAPEXs and OPEXs estimated, the CO2 captured and avoidance costs for the three capture systems are estimated and the results are summarized in Table 5.9. The HRC costs with carbon capture are also displayed. Note that the annual costs of the two compression trains are distributed into the four emission point sources based on the amounts of CO2 captured at each point. The cost of the steam generation plant is also distributed to each single emission point based on the respective heat demand. In doing so, the cost value that reflects

5.4 Economic analysis
146
the cost estimation for a complete capture & compression process can be displayed for each point source.
Table 5.9 CO2 capture, avoidance and HRC costs CO2 capture & compression
&steam generation
Emission source
Total annual costs CO2 capture
costs CO2 avoidance costs HRC
cost Increase of HRC cost*
Unit M €/year €/tCO2 €/tCO2 €/tHRC %
Cascaded membrane
Power plant 151 42.8 50.6 547.5 7
Hot stove 70 46.7 55.4 527.1 3
Coke oven 45 65.2 77.4 521.0 2
Lime plant 17.3 67.2 78.8 514.0 1
Overall 283 47.4 56.1 581 14
MEA
Power plant 106.5 30.1 55.2 536.3 5
Hot stove 49.4 33.0 60.2 522.0 2
Coke oven 27.7 40.2 72.8 516.6 1
Lime plant 10.8 42.1 77.4 512.4 1
Overall 194.4 32.5 59.5 558.3 9
Hybrid D2
Power plant 116.0 32.8 49.4 538.7 6
Hot stove 51.5 34.4 52.0 522.5 3
Coke oven 32.6 47.3 70.8 517.8 2
Lime plant 13.8 53.6 81.2 513.1 1
Overall 213.9 35.8 53.9 563.1 10
*HRC cost w/o carbon capture: 509.7 €/tHRC
As shown in Table 5.9, the largest annual cost (283 M€/yr) is required by the cascaded membrane system. As a result, the implementation of the cascaded membrane system will lead to the highest HRC cost increase (14 %). The MEA system requires the lowest annual cost (194.4 M€/yr) and thus results in the lowest HRC cost increase (9 %). Nevertheless, due to the fact that the CO2 avoidance rate of the MEA system is lower than that of the cascaded membrane system (see Table 5.7), the cascaded membrane ends up having a lower CO2 avoidance cost (56.1 €/tCO2) than the MEA system (59.5 €/tCO2). The lowest CO2 avoidance cost is exhibited by the Hybrid D2 system, which is 53.9 €/tCO2. Nevertheless, the differences

5 Deployment of carbon capture systems in a greenfield iron and steel plant
147
between the CO2 avoidances costs of different capture systems are in fact not significant considering the anticipated uncertainty of the costing method (see Section 3.6).
In addition to the comparison made between different capture systems, it is also interesting to compare the cost values between different emission point sources. Evidently, the deployment of carbon capture for the power plant will lead to the highest increase of HRC cost for each capture system. This is attributed to a larger amount of CO2 emitted for this point source (see Figure 5.8) and, consequently, the largest CAPEX and OPEX are required. Nonetheless, it is observed that implementing carbon capture for the power plant leads to the lowest CO2 avoidance cost in comparison to the other three emission sources, regardless of the type of capture system implemented. Moreover, comparing Figure 5.2 with Table 5.9 can lead to a finding that the point source with a higher CO2 weight ratio generally results in a lower CO2
avoidance cost.
In other words, the ranking of CO2 avoidance costs of the 4 point sources is not affected by the type of capture technology used but decided by the characteristics of the emissions sources (power plant < hot stove < coke oven < lime plant). Therefore, when deploying carbon capture for all point sources is not possible, a decision can be made according to the rank of CO2 avoidance cost.
5.4.3 Comparison with published results
Some results from other studies regarding the techno-economic evaluation of post-combustion carbon capture have been review in Chapter 2. The results obtained in this chapter of this work are compared with some of the published results (see Table 5.10). Based on the same criteria used in the last chapter, the economic results are re-evaluated on the basis of 2016 €. Specifically, the studies of Ho et al. [58] and IEAGHG [116] are selected for comparison due to the similar research conditions and scopes. Despite this, differences concerning the capture scenario as well as the steam & electricity supply strategy are still existent. As mentioned in Chapter 2, as of now, no publications have yet been found on a holistic techno-economic study for CO2 capture in the iron and steel industry using membrane-based technology. The two selected studies, for instance, have only investigated the MEA-based chemical absorption process due to the maturity of this technology.
As displayed in Table 5.10, the estimated CO2 avoidance costs gained by Ho et al. [58] are similar to the estimate attained in this work for the MEA system, with the estimates of Ho et al. being a bit lower. Also, the cascaded membrane system exhibits a higher CO2 avoidance cost than the results of Ho et al. [58] but only with marginal differences. It is particularly interesting to compare the results between the present study and the IEAGHG report since the investigated iron & steel plants are the same. It can be seen that all the CO2 avoidance costs for the capture systems obtained in this work are lower than the cost values from the report of IEAGHG [116].

5.4 Economic analysis
148
Table 5.10 Comparison of the present study with literature
Literature source
The present study Ho et al. [58] IEAGHG [116]
Case Cascaded membrane
MEA Hybrid D2 Case 1 Case 1-
extended Case 2
EOP-L1
EOP-L2
Capture technology
membrane MEA Membrane
+MEA MEA MEA MEA MEA MEA
Emission source
Power plant, hot stove, coke oven, lime plant
All direct
emission sources
Power plant, hot
stove, coke oven, sinter plant
Blast Furnace
Steam plant, hot
stove,
Steam plant, hot
stove. Coke oven, lime plant
Year of cost data
2016(€) 2010(AU$) 2010(US$)
Region Germany Australia Western Europe
CO2 avoidance rate [%]
60.4 39 47.3 85 80 32 50.2 60.3
Discount rate [%]
8 8 8 7 7 7 10 10
Steam supply
Newly built steam plant CHP plant fitted with CCS Newly built steam plant
Electricity supply
Purchased from grid CHP plant fitted with CCS Captive power
plant
Re-evaluation (2016 €)
HRC cost w/o CCS
[€/t] 509.7 509.7 509.7 / / / 509.7 509.7
HRC cost w/ CCS [€/t]
581 558.3 563.1 / / / 578.1 600.2
Cost of CO2 avoided [€/t]
56.1 59.5 53.9 56.1 52.8 50.2 65.3 71.9

5 Deployment of carbon capture systems in a greenfield iron and steel plant
149
470
520
570
620
670
720
0 20 40 60 80 100
HR
C c
ost [
€/t]
CO2 allowance price [€/tCO2]
Reference case (w/o CCS)
Cascaded membrane
MEA
Hybrid D2
Various causes can lead to differences between studies. They can be attributed to the different regional pricings, assumed discount rates, etc. More importantly, it can be noticed that the CO2 avoidance rates are not kept the same in the compared cases. Two major facts are found to result in the varied CO2 avoidance rates: 1) different CO2 capture strategies (distinct point sources are targeted); 2) different options for electricity & steam supply, which are clearly displayed in Table 5.10.
With all the differences mentioned above combined, it is almost impossible to compare the results of this work to that of other studies. Therefore, the comparison should be focused on the comparison inside this thesis, especially when it comes to the comparison between different carbon capture systems.
5.4.4 Breakeven CO2 allowance price
In this section, the CO2 allowance scheme is assumed to be imposed on the steel industry and its influence is examined. The CO2 allowance price was varied from 0 to 100 €/tCO2 to see how the HRC costs would change, respectively, when different capture systems are implemented (see Figure 5.13).
As a result, the cost of HRC without carbon capture is lower than that with carbon capture when no CO2 allowance price is charged. As the CO2 allowance price rises, the iron and steel plant with carbon capture gradually becomes more cost-effective. Different breakeven CO2 allowance prices for the three capture systems are attained and displayed in Table 5.11. What should be noted is that the price of the purchased electricity will also change if the same CO2 tax is imposed on the power sector at the same time. Nevertheless, to simplify the analysis, this situation is not considered for the present work.
Figure 5.13 HRC cost as a function of the CO2 allowance price

5.4 Economic analysis
150
Table 5.11 Breakeven HRC cost and CO2 allowance price
Cascaded membrane MEA Hybrid D2
Breakeven HRC [€/tHRC] 628.4 634.2 622.4
Breakeven CO2 allowance price
[€/tCO2] 56.1 59.5 53.9
As displayed in Figure 5.13, the MEA system in the iron & steel plant will not be economically feasible unless the CO2 allowance price has reached 59.5 €/tCO2, which is the highest of all. The breakeven CO2 allowance prices for the cascaded membrane and Hybrid D2 systems are 56.1 and 53.9 €/tCO2, respectively. Nevertheless, there is no telling which system has higher breakeven allowance price considering the expected uncertainty of cost estimates.
5.4.5 Sensitivity of the CO2 avoidance cost to the source of the steam
As discussed above, the current scenario of steam supply considered for this study, i.e. building a new steam generation plant, significantly reduces the CO2 avoidance rate since the CO2 emitted from this unit is not captured in the current capture scenario. Therefore, another approach for the steam supply is examined in this section. It is assumed that the steam usage for the carbon capture systems is also imported. Specifically, the steam (at 131 ºC, saturated) is assumed to be purchased from a nearby coal CHP power plant. The price and the CO2 emission factor are interpolated based on the cost and climate impact of steam provided in the CEMCAP framework [160]. As a result, a steam price of 11.6 €/MWhth and a CO2 emission factor of 173 kgCO2/MWhth are used in the new scenario
As a result of importing both electricity and steam from external sources for carbon capture, the CO2 generated from the imported resources have varied for the MEA and Hybrid D2 systems as compared to the previous scenario. The corresponding CO2 avoidance rates are tabulated in Table 5.12.
Table 5.12 Additional CO2 emission and CO2 avoidance rates with imported electricity and steam
Unit Cascaded membrane
MEA Hybrid D2
Total additional CO2 emission
Mt/y 0.9 1.2 1.0
CO2 avoidance rate
% 60.4 55.8 58.3
Comparing Table 5.12 with Table 5.6, we can find that the additional CO2 emissions generated for providing energy for the MEA and Hybrid D2 systems become less when the steam is

5 Deployment of carbon capture systems in a greenfield iron and steel plant
151
0
10
20
30
40
50
60
Cascaded
membrane
MEA Hybrid D2
CO
2av
oida
nce c
ost [
€/t]
Steam generation
plant
Imported steam
imported instead of being produced from an onsite steam generation plant. Consequently, the CO2 avoidance rates for the MEA and Hybrid D2 system have increased from 39 % to 55.8 % and 47.3 % to 58.3 %, respectively.
The CO2 avoidance costs under the two scenarios of steam supply are displayed in Figure 5.14. The CO2 avoidance cost for the cascaded membrane system is not influenced since it does not require steam supply. For the MEA and Hybrid D2 systems, the CO2 avoidance costs are reduced from 59.5 to 42.5 €/tCO2 and 53.9 to 44 €/tCO2, respectively, when the steam supply option is changed from steam generation plant to imported steam. Besides, the MEA system benefits most from this change of steam supply as this system has the highest demand for steam. Its CO2 avoidance cost has decreased by 29 %. In comparison, the CO2 avoidance cost for the Hybrid D2 system has dropped by approximately 18 %. Under the scenario of importing steam, the MEA system becomes the most cost-effective option of the three capture systems.
;
Figure 5.14 Comparison of CO2 avoidance costs with two steam supply methods
5.5 Discussion
5.5.1 Impacts of steam supply strategies on carbon capture in the iron & steel plant
As displayed above, the MEA system exhibits the lowest ratio of CO2 avoidance when the steam supplied to the carbon capture systems is from an onsite steam generation plant (natural gas-based). Only 39 % of the total CO2 emission from the iron & steel plant is avoided (see Table 5.7). The MEA system also exhibits the highest CO2 avoidance cost (59.5 €/tCO2) as compared to the other analyzed capture systems (see Table 5.9). The CO2 avoidance cost for the cascaded membrane system is 56.1 €/tCO2. Meanwhile, the Hybrid D2 system results in the lowest CO2 avoidance cost (53.9 €/tCO2). As discussed in Section 5.4.2, there are in fact no significant differences in the CO2 avoidance costs between the capture systems considering the

5.5 Discussion
152
uncertainty of the costing method. The differences get more noticeable only when the steam supply method has been changed.
According to the sensitivity analysis conducted in Section 5.4.5, different steam supply options have significant impacts on economic evaluation. When the steam is imported from a coal CHP power plant instead of being generated from a newly-built onsite steam generation plant, the MEA system has turned from the system with the highest CO2 avoidance cost to the system with the lowest CO2 avoidance cost of the three analyzed systems (see Figure 5.14). In comparison to the scenario of onsite steam plant, the CO2 avoidance costs for the MEA and Hybrid D2 systems have dropped by 29 and 18%, respectively, when the steam supply option is altered. On this occasion, the MEA and Hybrid D2 systems are out of question superior to the cascaded membrane system in terms of economics. Nevertheless, the difference of CO2
avoidance costs between the MEA and Hybrid D2 systems is small.
The sensitivity analysis shows that the steam supply strategy is a vital factor in determining the economic feasibility of a certain carbon system. Therefore, the evaluation of a carbon capture system for a steelmaking plant should take the availability of steam into account.
Conclusion 1: Selection of a proper carbon capture system for a specific iron & steel plant is in part subject to steam supply strategy.
It should be noted that the additional costs for the transport and storage of imported steam are not estimated in the present study. The additional costs in this regard may vary depending on how far the source of imported steam (a nearby coal CHP plant is assumed in the present work) is from the iron & steel plant. According to Anantharaman et al. [160], an onsite natural gas-based boiler is generally more expensive than imported steam. This statement is in accordance with the result of the sensitivity analysis performed in Section 5.4.5. On the other hand, however, it is also stated by Anantharaman et al. [160] that an onsite gas boiler is more flexible in terms of the capacity of the available steam even and, moreover, it is not always probable to import steam from power plants.
In addition to the steam supply scenarios considered in this chapter, the IEAGHG report also proposes to replace the low-pressure steam boiler with a natural gas CHP plant [116]. It is stated that a reduction of 12-14 % of the CO2 avoidance cost for the MEA system can be achieved when a new CHP plant is built as compared to a newly built onsite steam generation plant [116, p. D28]. However, the reduction is still smaller than that brought by importing steam.
Apparently, distinct steam supply strategies lead to different technical and cost estimates. Although not all scenarios have been examined, a general finding can be concluded:

5 Deployment of carbon capture systems in a greenfield iron and steel plant
153
Conclusion 2: An onsite source of the steam supply in an iron & steel plant is more expensive than importing steam from external sources but able to provide required steam more flexibly and stably.
5.5.2 CO2 avoidance cost & breakeven CO2 allowance price
Note that, in Figure 5.13, there are also intersections between the curves of the three capture systems, which is not seen for the capture systems deployed in the power plant (see Figure 4.52). The cause for this phenomenon is that the studied capture systems have the same CO2 avoidance rates in the power plant but different ones in the iron & steel plant.
It can be seen from Figure 5.13 that the MEA system, which leads to the lowest HRC cost and lowest CO2 avoidance ratio, overtakes the cascaded membrane and Hybrid D2 systems with respect to the HRC cost as the CO2 allowance price increases. The cascaded membrane system, which has the largest CO2 avoidance rate, leads to the highest HRC cost at zero CO2 allowance price but becomes the most economical option when the CO2 allowance price is above 70.9 €/tCO2. Meanwhile, the MEA system, which still avoids the lowest ratio of CO2 emission, has resulted in the highest HRC cost. Apparently, capture systems with higher CO2 avoidance ratios benefit more from the increase of the CO2 allowance price.
Conclusion 3: The carbon capture system capable of avoiding a higher ratio of CO2 will gain more economic advantages as the CO2 allowance price increases.
In both the reference power plant and iron & steel plant, the CO2 avoidance costs and breakeven CO2 allowance prices for the studied capture systems have been calculated. It is found that, for each capture system, its CO2 avoidance cost is identical to its breakeven CO2 allowance price. Maas et al. [140] mentioned that the CO2 avoidance cost correlates with the breakeven allowance price but did not clearly clarify the correlation.
There exists a clear explanation for this finding. The breakeven CO2 allowance price for a carbon capture system is reached when the extra expenditure, which a plant without carbon capture spends to buy CO2 emission allowance, is identical to the investment cost for the plant to deploy the carbon capture system. Naturally, only when the CO2 allowance price equals the CO2 avoidance cost of a certain carbon capture system can the capture system become economically feasible.
Conclusion 4: The CO2 avoidance cost is equivalent to the breakeven CO2 allowance price

5.5 Discussion
154
5.5.3 Carbon capture in the reference power plant vs iron & steel plant
Three CO2 capture systems, i.e. the cascaded membrane, MEA, and Hybrid D2 systems, have been deployed in both a reference power plant (see Chapter 4) and a reference iron & steel plant (see Chapter 5). It would be of great interest to make a comparison between the performances of the capture systems in the power plant and iron & steel plant.
In the power plant, the Hybrid D2 system has a lower CO2 avoidance cost (48.8 €/tCO2) than that of the cascaded membrane system (65.1 €/tCO2). However, the Hybrid D2 system does not show obvious advantage over the standalone MEA system (49.1 €/tCO2) with regard to economics. It has been concluded in Section 4.8.2 that the economic competitiveness of the Hybrid D2 system is dependent on the membrane price. With respect to the iron & steel plant, insignificant differences in the CO2 avoidance costs are seen between the three capture systems (MEA system: 59.5 €/tCO2, cascaded membrane system: 57.4 €/tCO2, Hybrid D2 systems: 53.9 €/tCO2).
The cost results themselves denote that the Hybrid D2 system has potential for being more economically feasible than the standalone capture technologies in both plants. Nevertheless, grounds for such statement disappear when the uncertainty of the cost model is taken into account. In spite of this, the economic results still demonstrate that the Hybrid D2 system can be a competitive option as compared to the standalone MEA and membrane technologies. A more accurate cost model is therefore in need to conduct higher classes of cost estimation.
Conclusion 4: Hybrid D2 system is potentially a more economically feasible system than the standalone carbon capture technologies (membrane and MEA) in both the reference power plant and iron & steel plant. However, cost estimation with higher accuracy is needed to examine it.
Having compared the overall CO2 avoidance costs of different capture systems deployed in the iron & steel plant, it is also necessary to take a closer look at the CO2 avoidance cost for each point source of CO2 emission. Interestingly, it is found in Table 5.9 that although the Hybrid D2 system shows the lowest overall CO2 avoidance cost, this system does not result in the lowest avoidance cost for every single source of emission. The lowest CO2 avoidance cost for capturing CO2 from the lime plant is achieved by implementing the MEA system at this site (see Table 5.9). Moreover, the CO2 avoidance cost of the MEA system for the coke oven is also smaller than that of the cascaded membrane system in spite of the fact that the cascaded membrane system exhibits a lower overall CO2 avoidance cost. This suggests that the multiple sources of CO2 emissions in an iron & steel plant can be dealt with by different carbon capture technologies in order to lower the overall CO2 avoidance cost.
Conclusion 5: In an iron & steel plant, it is not necessary to use only one type of carbon capture technology to deal with all sources of CO2 emission. From an economic point of view,

5 Deployment of carbon capture systems in a greenfield iron and steel plant
155
the selection of carbon capture technology should be conducted for each source of CO2 emission.
5.6 Summary
In this chapter, the applications of post-combustion carbon capture systems are extended to a reference iron & steel plant. Three capture systems (cascaded membrane, MEA, and Hybrid D2 systems) are analyzed. Especially, comprehensive techno-economic analyses have for the first time been performed for the cascaded membrane and Hybrid D2 system in an iron & steel plant.
In Section 5.1, the basic information of the reference iron & steel plant is introduced and some assumptions for carbon capture research are made. In addition, the characteristics of the multiple point sources of CO2 emission in the iron & steel plant are demonstrated. It has been found that raw material treatment processes are the main sources of CO2 emission.
Section 5.2 discusses the strategy for deploying the carbon capture systems. It is decided to deploy one capture system to deal with each point source of emission individually. Concerning the energy supply for the capture systems, a new steam generation plant is assumed to be built to provide steam while the electricity is imported from the grid in the base scenario.
The technical and economic evaluations are then carried out for the capture systems and the results are presented in Section 5.3 and 5.4, respectively. It suggests that the CO2 avoidance costs for the Discussions concerning the results are made in Section 5.5 and some key conclusions are drawn as follows:
� The selection of the carbon capture system for a specific iron & steel plants is partly subject to steam supply strategy.
� An onsite source of the steam supply in an iron & steel plant is more expensive than importing steam from outside sources but able to provide required steam flexibly and stably.
� The Hybrid D2 system exhibits potential economic advantages over the standalone capture technologies (membrane & MEA) in both the reference power plant and iron & steel plant. However, it should be further examined using cost models with higher accuracy.
� The carbon capture system capable of avoiding a higher ratio of CO2 will gain more economic advantages as the CO2 allowance price increases in the iron & steel plant.
� The CO2 avoidance cost equals the breakeven CO2 allowance price � In an iron & steel plant, it is not necessary to use only one type of carbon capture
technology to deal with all sources of CO2 emission. From an economic point of view, the selection of carbon capture technology should be conducted for each source of CO2 emission.

5.6 Summary
156

157
6 Summary This chapter restates the scope and objectives of this thesis, illustrates the approach of the study, summarizes the simulation results, and, finally, highlights the key conclusions of this work.
6.1 Scope and objectives
Post-combustion carbon capture technologies are found to be indispensable for reducing global CO2 emissions from large emissions sources (e.g. coal-fired power plants and steelmaking industry). However, the benchmark post-combustion carbon capture technology, i.e. the MEA-based chemical absorption technology, has shown to be rather energy-intensive. Meanwhile, the performance of the gas permeation membrane-based separation technology, which is one of the emerging carbon capture technologies, has also been found to be restricted by the membrane properties, especially when it is designed to be applied in industrial-scale plants.
Under this background, the present study is focused, on the one hand, on developing hybrid membrane/MEA capture systems instead of trying to seek breakthroughs in standalone carbon capture technologies. In doing so, this study endeavors to push forward the applicability of post-combustion carbon capture technologies. On the other hand, the study of post-combustion carbon capture in the steelmaking industry has been found to be insufficient as compared to the power sector. Therefore, another target of the present study is to fill the research gap for the techno-economic assessment of the post-combustion carbon capture in the steelmaking industry and, in particular, for the membrane-based and hybrid membrane/MEA carbon capture systems.
6.2 Approach
Model development
Two types of hybrid membrane/MEA capture systems (Hybrid D1 and D2) were developed using a commercial simulation tool, Aspen Plus®. In addition, two standalone carbon capture technologies, i.e. the cascaded membrane and MEA systems, were modeled as reference capture systems. The Polyactive® membrane was selected as the investigated membrane material for the membrane-based CO2 separation systems. A costing model based on the discounted cash flow approach was built for estimating the costs for deploying carbon capture systems.
Deployment of carbon capture in a coal-fired power plant
First, the carbon capture systems were deployed in a reference coal-fired power plant. To better understand the interactions between the power plant and carbon capture systems, a power plant model consisting of a water-steam cycle and a fuel/flue gas route was built up in EBSILON® Professional. The power plant model was designed to run under Design mode at full load and under Off-Design mode at part load or with carbon capture equipped.

6.3 Results of carbon capture deployment
158
Given the boundary condition set by the power plant, parametric studies were first performed for the MEA and membrane-based carbon capture systems in an attempt to, on the one hand, understand the characteristics of the two standalone technologies and, on the other hand, optimize the system specifications. The specifications for the two hybrid systems were also optimized under the assumption that the optimal specifications for the standalone carbon capture technologies (membrane & MEA) can be directly applied to the corresponding section of them in the hybrid systems.
With the optimized specifications configured, the following points are addressed for technical analysis:
� Determination of the steam extraction location for the MEA technology; � Efficiency penalties caused by the analyzed carbon capture systems; � Performances of the carbon capture systems at part load operation of the power plant; � Waste heat integration using pinch analysis.
Finally, economic analysis was conducted for the deployment of carbon capture in the reference power plant. Sensitivity analyses were carried out to examine the effects of some parameters on the economic performances of the capture systems. Crucial cost metrics including LCOE and CO2 avoidance cost are used to compare the capture systems to each other.
Deployment of carbon capture in a reference iron & steel plant
Then, the applications of the carbon capture systems were extended to a reference iron & steel plant. Given the basic information of the iron & steel, the existing point sources of CO2 emission, as well as their characteristics, were analyzed. Based on the characteristics of the emission sources and capture systems, some point sources of CO2 emission suitable for post-combustion carbon capture were selected. Also, the energy network inside the iron & steel plant was investigated so as to decide the energy supply (electricity & steam) strategy for the capture & compression units. After the specific CO2 capture and energy supply strategies have been decided, techno-economic analysis was carried out to test the performances of the studied post-combustion carbon capture systems. Additionally, the steam supply strategy was varied to investigate its impacts on the CO2 avoidance costs of the analyzed capture systems.
6.3 Results of carbon capture deployment
Some key results are obtained when the 4 carbon capture systems modeled in the present study were deployed in a reference coal-fired power plant and a reference iron & steel plant, respectively.
6.3.1 Deployment in a coal-fired power plant
Through parametric studies, the characteristics of the MEA and membrane-based have been better comprehended:

6 Summary
159
MEA system:
� There exists an optimal CO2 lean loading that can lead to the least specific reboiler duty � The reduction of the specific reboiler duty of the MEA system is insignificant when the
CO2 fraction in the flue gas is higher than 40 mol%. � The crossover pipe between the intermediate and low-pressure turbines is found to the
optimal option for steam extraction for the present study. � A pressure control scenario that allows for a floating backpressure of the IP turbine is
more energy-efficient than the fixed pressure scenario. However, this approach will lead to a power shift between the IP and LP turbines.
Membrane-based separation system:
� For the single-stage membrane system, the CO2 fraction in the permeate gas is always higher than 40 mol% when the capture rate is varied between 10 and 95 %.
� The cascaded membrane system gives a better performance at a lower temperature in terms of energy consumption
� Higher content of H2O in the flue gas is beneficial to CO2 transport through the membrane. However, the enhanced CO2 transport comes at the cost of lower CO2 purity in the permeate gas and higher energy consumption.
The technical analysis for the 4 capture systems shows that the Hybrid D1 system results in the highest efficiency penalty (15.6 %-pts) while the Hybrid D2 system leads to the lowest (9.7 %-pts) when a CO2 capture rate of 90 % was specified. In addition, under the same circumstances, the cascaded membrane system has also been found to cause a higher efficiency penalty than the MEA system. Additionally, it has been observed that higher efficiency penalties are caused when the capture systems are operated at part loads,
Another important finding associated with the cascaded membrane system is that the steam demand for the inter-heating in between the turbo-expanders cannot be neglected as in some other studies. According to the simulation result, an additional efficiency penalty of 0.8 %-pts will be entailed if the steam is also extracted from the steam turbines. Nonetheless, the study of waste heat integration reveals that the exhaust heat inside the cascaded membrane system is actually sufficient to provide the thermal energy required by the inter-heating process.
Furthermore, according to the pinch analysis, the exhaust heat from all of the 4 capture systems has turned out to be able to be utilized for preheating the feedwater in the water-steam cycle. With the waste heat integration, the net output of the power plant increases by 5.8, 5.4, 7.0, and 6.4 MWe when the power plant is equipped with the cascaded membrane, MEA, Hybrid D1, and Hybrid D2 systems, respectively. Nevertheless, it should be noted that the reduction of the efficiency penalty by utilizing the waste cost comes at the cost of increased number of heat exchangers and more sophisticated HEN.

6.3 Results of carbon capture deployment
160
The economic results show that the Hybrid D2 system leads to the smallest increase of LCOE when the power plant is equipped with the capture system (5.36 to 8.57 cent/kWh). The MEA system appears to result in a similar LCOE (8.59 cent/kWh), which is only marginally higher than that of the Hybrid D2 system. The cascaded membrane system leads to the second highest LCOE (9.59 cent/kWh) after the highest LCOE (15.1 cent/kWh) caused by the Hybrid D1 system. Moreover, sensitivity analyses indicate that simply decreasing the price or extending the lifetime of the Polyactive® membrane is unable to make the cascaded membrane system more cost-competitive than the MEA or Hybrid D2 system.
Finally, the CO2 allowance scheme was assumed to be imposed on the power plant. According to the calculation, the CO2 allowance price must reach 65, 49, and 48.6 €/tCO2 to render the cascaded membrane, MEA, and Hybrid D2 systems, respectively, economically viable as compared to the power plant without carbon capture.
6.3.2 Deployment in an iron & steel plant
The existing point sources of CO2 emissions and energy network of the plant were first screened and examined. Some major facts were unveiled:
� Not all point sources of CO2 emissions in the steel plant are appropriate for deploying post-combustion capture systems considering the CO2 fractions in the flue gases.
� The reference iron & steel plant has a highly integrated energy use network.
Based on the two findings, 4 out of 6 major point sources of CO2 emissions were chosen to be equipped with carbon capture systems. The steam was assumed to be generated in a newly built onsite steam generation plant whereas the electricity to be imported from the grid. Hence, a natural gas boiler was simulated in EBSILON® Professional.
With respect to the capture strategy, it was decided to treat each single point source individually, i.e. deploying a single capture system at each point source. This strategy is serving the purpose of better understanding the character of each CO2 emission source for deploying carbon capture. Two CO2 compression trains were implemented to deal with the CO2 streams from the 4 emission sources, with each compression train handling CO2 streams. The cascaded membrane, MEA, and Hybrid D2 systems were deployed in the iron & steel plant, respectively. The Hybrid D1 was excluded for deployment in the iron & steel plant because its flawed design has been unveiled in the power plant.
The technical analysis shows that the cascaded membrane system exhibits the highest total electricity demand, which is 217 MWe, while the demands for the MEA and Hybrid D2 systems are 76.3 and 105 MWe, respectively. With respect to the steam demand, the cascaded membrane system with internal waste heat integration does not need any supply of steam. The largest amount of steam demand was seen on the MEA system, which requires 703 MWth. In comparison, the Hybrid D2 system has a thermal energy demand of 461 MWth.

6 Summary
161
Due to the fact that the onsite steam generation plant also generates CO2, which was not designed to be captured in this work because of the low CO2 concentration, the three analyzed capture systems led to different CO2 avoidance rates. The cascaded membrane, MEA, and Hybrid D2 systems are able to avoid CO2 emission from the reference iron & steel plant by 60.4, 39, and 47.3 %, respectively. Then, it was postulated that renewable energy is used to produce electricity or steam for the capture systems. As a result, the respective CO2 avoidance rates of the cascaded membrane, MEA, and Hybrid D2 systems increase to 71, 42.8, and 52.6 %, respectively, when the imported electricity is produced using zero-emission fuels. When the steam was assumed to be produced from zero-emission fuels, the CO2 avoidance rate of the cascaded membrane system stays unchanged while the avoidance rates of the MEA and Hybrid D2 systems increase to 67.4 and 66 %, respectively.
Economic analysis indicates that the MEA system exhibits the highest CO2 avoidance cost (59.5 €/tCO2). The second highest CO2 avoidance cost is seen on the cascaded membrane system (56.1 €/tCO2). The Hybrid D2 system, which shows the lowest CO2 avoidance cost in the power plant, also exhibits the lowest avoidance cost (53.9 €/tCO2) when it is deployed in the steel plant. The differences between the avoidance costs of different capture systems are insignificant considering the uncertainty of the cost model. A comparison was also made between the 4 point sources of emission. It is discovered that, in general, the point source with a higher CO2 weight ratio generally results in a lower CO2 avoidance cost although higher CAPEX & OPEX and, consequently, a higher HRC cost are inevitable when carbon capture is implemented at the point source. The CO2 tax was assumed to be charged for the iron & steel plant, too. It is found that the breakeven CO2 allowance price for a certain carbon capture system is actually equivalent to the CO2 avoidance cost for the system.
Lastly, the steam supply strategy was varied from building an onsite steam generation plant to importing steam from a nearby coal CHP plant in order to investigate its impacts. It turns out that the alternative strategy leads to higher CO2 avoidance rates for the MEA and Hybrid D2 system. Moreover, the CO2 avoidance costs for the two systems decrease from 59.5 to 42.5 €/tCO2 and 53.9 to 44 €/tCO2, respectively.
6.4 Conclusions and contributions
With the key results summarized above, some conclusions can be drawn:
� Given the current property of the Polyactive® membrane, the main principle of designing a hybrid membrane/MEA system should be utilizing the MEA technology to complement the gas permeation technology (Hybrid D2) rather than using the membrane to boost the performance of the MEA technology (Hybrid D1).
� The thermal energy demand of the cascaded membrane system has a pronounced effect on the efficiency penalty. Nevertheless, it can be provided by internal heat integration at the cost of increased investment in heat exchanger.

6.4 Conclusions and contributions
162
� The large capital cost and energy consumption of the cascaded membrane system (Polyactive®) make it impossible to replace the MEA system for CO2 capture from power plants in the current commercial market.
� In an iron & steel plant, the selection of a carbon capture system is partly subject to the steam supply strategy.
� An onsite source of steam supply for carbon capture in an iron & steel plant is more expensive than importing steam from outside sources but able to provide required steam flexibly and stably.
� The capture system capable of avoiding a higher ratio of CO2 will gain more economic advantages as the CO2 allowance price increases.
� In an iron & steel plant, it is not necessary to use only one type of carbon capture technology to deal with all sources of CO2 emission. From an economic point of view, the selection of carbon capture technology should be conducted for each source of CO2 emission.
� The Hybrid D2 system has potential for resulting in a lower CO2 avoidance cost than the standalone carbon capture technologies (membrane and MEA) for application in both the power sector and steelmaking industry. Nevertheless, cost estimation with higher accuracy is in need to examine it.
Based on the findings enumerated above, hybrid membrane/MEA systems are proven capable of being more cost-effective than the standalone MEA and membrane-based technologies if designed in a proper manner. Moreover, the in-depth techno-economic analysis for the cascaded membrane and Hybrid D2 systems have revealed the impacts of post-combustion carbon capture systems on an iron & steel plant.
This thesis is the first study that has concluded a basic principle for the design of hybrid membrane/MEA carbon capture systems, which can be regarded as a reference for other researchers. In addition, a holistic techno-economic analysis was for the first time carried out for evaluating the feasibility of the cascaded membrane system and a new hybrid membrane/MEA system in the steelmaking industry.

Appendix A Definition
163
Appendix A Definition
A.1 Definition of CO2 loading
The CO2 loading in the MEA-based chemical absorption system is defined as the ratio of the CO2 mole fraction to the MEA mole fraction:
� #� ��&�jI�
A.2 Definition of CO2 capture rate
����{�| # {� |98�W�� {� |}""W R 400�
A.3 Definition of m value for amine solution
��{����=>?�7�����A| # � ��* ���*$�� ���*�&&�� R 4000��$& ��4��$�&�� ��4��*$� ��f��$�&�� R 43

Appendix A Definition
164

Appendix B MEA model in Aspen Plus®
165
Appendix B MEA model in Aspen Plus®
B.1 MEA scrubbing model
Figure B. 1 Flowsheet diagram of the MEA-based scrubbing system in Aspen Plus
COOLER3

Appendix B MEA model in Aspen Plus®
166
B.2 Other initial specifications of the MEA model Table B. 1 Other initial specifications of the MEA model
MEA solution
MEA [wt%] 30
CO2 loading [mol CO2/mol MEA] 0.28
Pressure [bar] 1.05
Auxiliary
ΔT in RLHX [ºC] 10
Discharge pressure of the lean loading pump [bar] 4
Discharge pressure of the rich loading pump [bar] 5
Reboiler temperature [ºC] 120
Discharge temperature of OHC [ºC] 40
Discharge temperature of washing section [ºC] 40
B.3 Detailed information on the MEA model Table B. 2 Blocks in the MEA model and economic consideration
Block Type Economic Analysis
BLOWER Fan Yes
PRECOOL Scrubber Yes, as one equipment
PRESCRUB
ABSORBER Absorber Yes
COOLER1 Scrubber Yes, as one equipment
FLASH1
RICHPUMP Pump Yes
RLHX Heat Exchanger Yes
STRIPPER Stripper Yes

Appendix B MEA model in Aspen Plus®
167
Table B.2 continued
COOLER2 Condenser Yes, as one equipment
FLASH2
LEANPUMP Pump Yes
HEATER2 Cooler Yes
MIXER1 Mixer No
SPLIT Separator No
WATPUMP Pump Yes
B.4 Convergence sequence Table B. 3 Redefined convergence sequence for the MEA model
Loop-return Block type Block
Unit operation BLOWER
Unit operation PRECOOL
Unit operation PRESCRUB
Begin Convergence CV-1
Unit operation LASTHEAT
Begin Convergence CV-2
Unit operation ABSORBER
Unit operation COOLER1
Unit operation FLASH1
Return to Convergence CV-2
Unit operation RICHPUMP
Begin Convergence CV-3
Unit operation RLHX
Begin Convergence CV-4

Appendix B MEA model in Aspen Plus®
168
Table B.3 continued
Unit operation STRIPPER
Unit operation COOLER2
Unit operation FLASH2
Return to Convergence CV-4
Unit operation LEANPUMP
Return to Convergence CV-3
Unit operation HEATER2
Unit operation MIXER1
Return to Convergence CV-1
B.5 Calculation of MEA regeneration thermal energy
Heat of CO2 absorption (�����-���)
Gibbs-Helmholtz equation is used to represent the heat of CO2 absorption [193]
W�9�S%�W�X��
# H �._Z^-�S%* ����������������������������������� (B.1)
Partial pressure of CO2 [66]
lnpCO2=cpco2,0 + cpco2,1/T + cpco2,2α + cpco2,3α/T + cpco2,4α2 + cpco2,5α2/T + cpco2,6α3 + cpco2,7α3/T + cpco2,8α4�������������������������������������������������������������������������������������������������������������������������������������������������������������������������(B.2)�B.1 and B.2 combined:
Δhabs,CO2 = -R (cpco2,1 + cpco2,3α + cpco2,5α2 + cpco2,7α3 ) (B.3)
Heat capacity of CO2 loaded solution (Cp,L) [193]
Cp,L= cCp,0 + cCp,1t + cCp,2t2 + cCp,3α + cCp,4α2 + cCp,5 ��jI�+ cCp,6 ��jI� + cCp,7tα + cCp,8t ��jI� + cCp,9α ��jI� + cCp,10tα ��jI� (B.4)
Heat of the vaporization of H2O
Δhvap,H2O ≈ 40 kJ/mol [66]
The coefficients used for Equation B.3 and B.4 are summarized in Table B. 4 and Table B. 5.

Appendix B MEA model in Aspen Plus®
169
B.6 CO2 solubility Table B. 4 Coefficients to determine CO2 solubility
Applicable range
T [ºC] 25-120
α [mol MEA/kg H2O] 0.03-0.58
F ��-0 22,53
F ��-4 -7904
F ��-� 105
F ��-f -16810
F ��-¡ -286,4
F ��-¢ 26480
F ��-£ 381,7
F ��-¤ 8295
F ��-3 -257,4

Appendix B MEA model in Aspen Plus®
170
B.7 CO2 heat capacity Table B. 5 Coefficients to determine CO2 heat capacity [193, 194]
Applicable range
��MEA [mol MEA/kg H2O] 1.8-1.9
T [ºC] 40-120
α [mol CO2/mol MEA] 0-0.583
cCp,0 4.294e+03
cCp,1 -1.859
cCp,2 2.575e-03
cCp,3 -7.819e+02
cCp,4 6.536e+02
cCp,5 -1.124e+02
cCp,6 4.746
cCp,7 8,181e-01
cCp,8 -5.364e+01
cCp,9 -1.909e-01

Appendix C Cascaded membrane system
171
Appendix C Cascaded membrane system
C.1 Model of the cascaded membrane system in Aspen Plus®
Figure C. 1 Flowsheet of the cascaded membrane system in Aspen Plus®
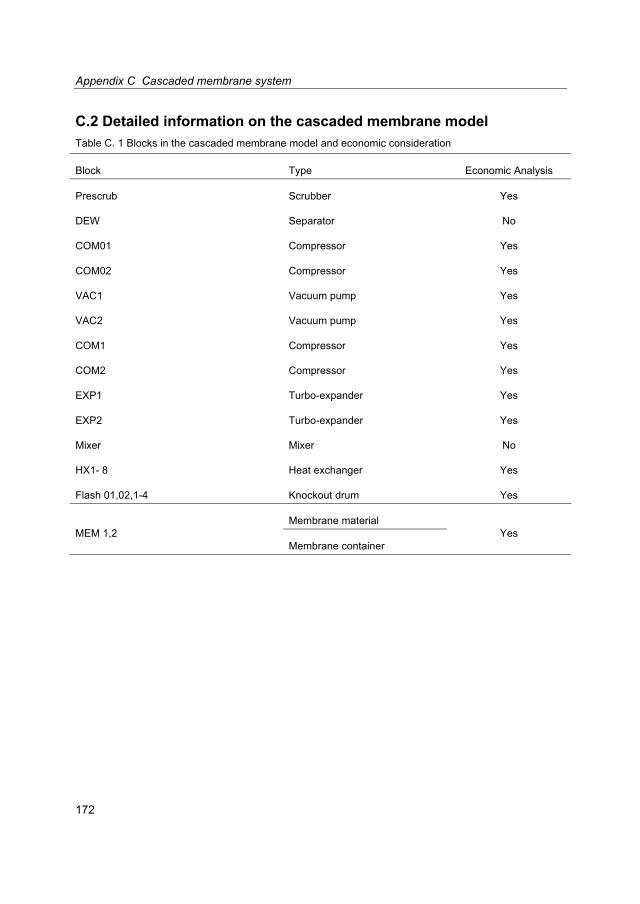
Appendix C Cascaded membrane system
172
C.2 Detailed information on the cascaded membrane model Table C. 1 Blocks in the cascaded membrane model and economic consideration
Block Type Economic Analysis
Prescrub Scrubber Yes
DEW Separator No
COM01 Compressor Yes
COM02 Compressor Yes
VAC1 Vacuum pump Yes
VAC2 Vacuum pump Yes
COM1 Compressor Yes
COM2 Compressor Yes
EXP1 Turbo-expander Yes
EXP2 Turbo-expander Yes
Mixer Mixer No
HX1- 8 Heat exchanger Yes
Flash 01,02,1-4 Knockout drum Yes
MEM 1,2 Membrane material
Yes Membrane container

Appendix D Hybrid model design
173
Appendix D Hybrid model design
D.1 Hybrid model D1
Figure D. 1 Flowsheet of the hybrid capture model design 1 in Aspen Plus®
COOLER3
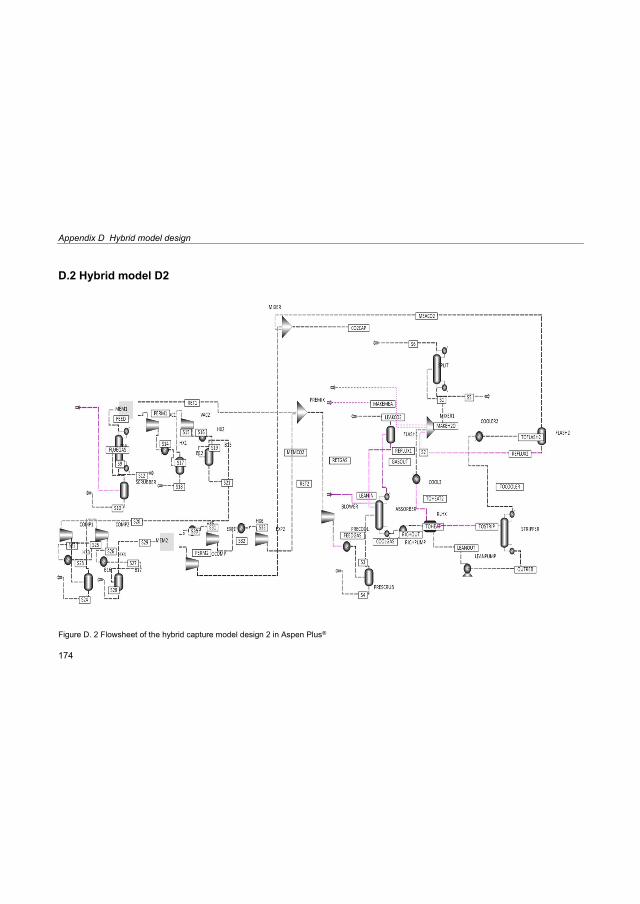
Appendix D Hybrid model design
174
D.2 Hybrid model D2
Figure D. 2 Flowsheet of the hybrid capture model design 2 in Aspen Plus®

Appendix E Power plant
175
Appendix E Power plant
E.1 Information of hard coal Table E. 1 Elemental analysis of Klein Kopje
Element Fraction [%]
C 65.5
H 3.5
O 7.4
N 1.5
S 0.6
Ash 14.2
Moisture 7.3
NCV [MJ/kg] 25

Appendix E Power plant
176
E.2 Characteristics of the steam generator
Figure E. 1 Characteristics of the steam generator
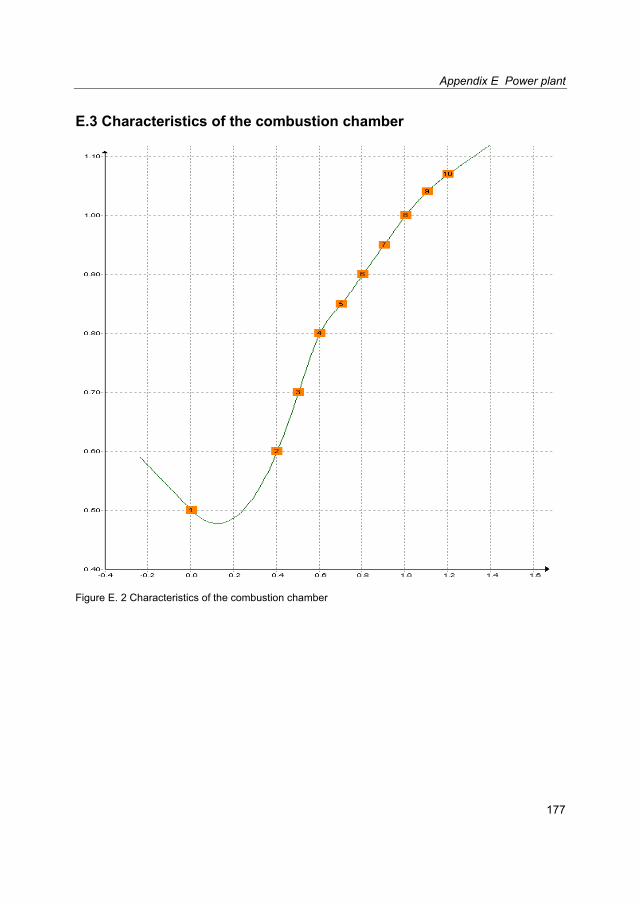
Appendix E Power plant
177
E.3 Characteristics of the combustion chamber
Figure E. 2 Characteristics of the combustion chamber

Appendix E Power plant
178
E.4 Characteristics of the steam turbine
Figure E. 3 Characteristics of the steam turbine
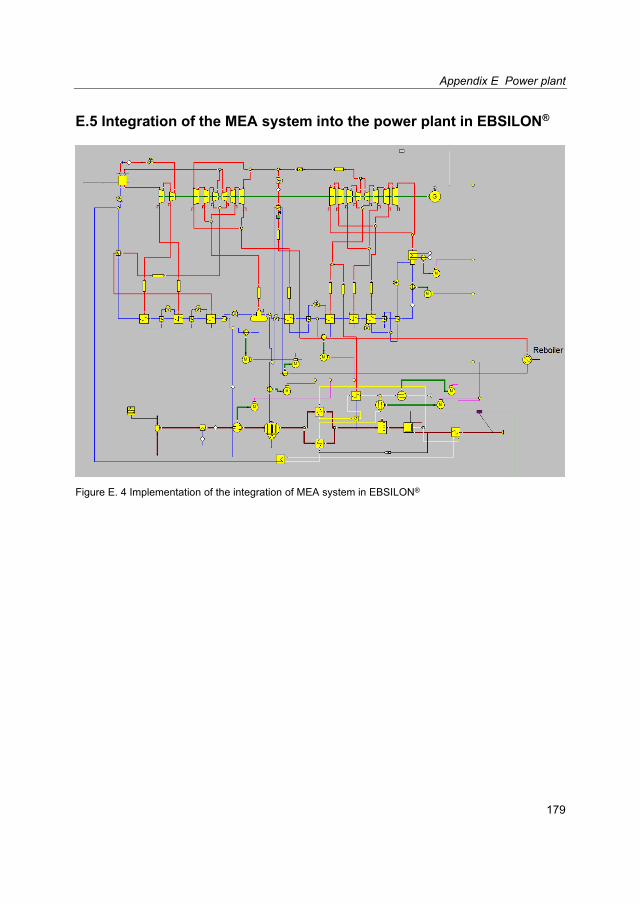
Appendix E Power plant
179
E.5 Integration of the MEA system into the power plant in EBSILON®
Figure E. 4 Implementation of the integration of MEA system in EBSILON®

Appendix E Power plant
180

Appendix F Reference iron & steel plant
181
Appendix F Reference iron & steel plant
F.1 Raw materials and products Table F. 1 Raw Materials, products, by-products, intermediate products, waste Materials, off-gases and utilities of the reference plant [116]
Raw materials Salable
Product and by¥products
Intermediate products Waste material
Industrial gases and off¥
gases Utilities
Iron Ore Fines Hot Rolled Coil Coke BF Sludge Blast Furnace Gas (BFG) Steam
Iron Ore Pellets Crude Tar Sinter de¥S Slag
Basic Oxygen Furnace Gas
(BOFG) Electricity
Lump Iron Ore Benzole Lime BOS Slag Coke Oven Gas (COG) Water
Coking Coal Sulphur Hot Metal LM Slag Oxygen -
PCI Coal Granulated BF Slag Liquid Steel - Nitrogen -
Fluxes BOS Slag Slab - Argon -
External Scrap Argon - - - -
Ferro Alloys & Aluminium - - - - -
Natural Gas - - - - -

Appendix F Reference iron & steel plant
182
F.2 Characteristic of the available natural gas Table F. 2 Characteristic of the natural gas [116]
Composition Unit (dry basis) Value
CH4 vol.% 83.9
C2H6 vol.% 9.2
C3H8 vol.% 3.3
C4H10 vol.% 1.2
C5H12 vol.% 0.2
CO2 vol.% 1.8
N2 vol.% 0.4
LHV MJ/Nm3 40.64

Appendix G HEN optimization for carbon capture in the power plant
183
Appendix G HEN optimization for carbon capture in the power plant
G.1 Pinch analysis for MEA-CO2 compression-LP preheaters Table G. 1 Process streams for pinch analysis
Stream Type Inlet T
[ºC] Outlet T
[ºC] Heat flow
[GJ/h]
MEA system
Prescrub cooling Hot 57 40 210.5
Cooler3 cooling Hot 60.5 40 451.6
Cooler1 cooling Hot 64.9 40 525.1
Cooler2 cooling Hot 102.3 40 518.7
CO2 compression unit
Stage1 cooling Hot 131.3 30 49.6
Stage2 cooling Hot 119.9 30 34.5
Stage3 cooling Hot 122.1 30 38.2
Stage4 cooling Hot 126.6 30 100.1
Feed water
PH1 heating Cold 37.5 58.8 93.3
PH2 heating Cold 58.8 99.4 178.7
PH3 heating Cold 99.4 134.2 154.9
AC1 heating Cold 31.3 34.3 12.1
AC2 heating Cold 34.3 37.5 14.3
AC4 heating Cold 134.5 134.9 2.1
PH1 condensate Hot 60.2 36.3 12.1
PH2 condensate Hot 61.8 59.3 14.3
PH4 condensate Hot 153.9 139.6 2.1

Appendix G HEN optimization for carbon capture in the power plant
184
G.2 Pinch analysis for membrane-CO2 compression-LP preheaters Table G. 2 Process streams for pinch analysis
Stream Type Inlet T
[ºC] Outlet T
[ºC] Heat flow
[GJ/h]
Cascaded membrane system
Prescrub cooling Hot 50 25 314.8
HX1 cooling Hot 97.4 25 139.8
HX2 cooling Hot 97.4 25 145.3
HX3 cooling Hot 139.4 25 63.8
HX4 cooling Hot 139.5 25 65.22
HX5 cooling Hot 88.4 25 44.1
HX6 cooling Hot 88.5 25 39.3
HX7 heating Cold 25 80 86.4
HX8 heating Cold 27.6 80 82.1
CO2 compression unit
Stage1 cooling Hot 127.9 30 35.1
Stage2 cooling Hot 135.0 30 41.8
Stage3 cooling Hot 137.9 30 44.4
Stage4 cooling Hot 143.5 30 103.0
Feed water
PH1 heating Cold 37.5 58.8 93.3
PH2 heating Cold 58.8 99.4 178.7
PH3 heating Cold 99.4 134.2 154.9
AC1 heating Cold 31.3 34.3 12.1
AC2 heating Cold 34.3 37.5 14.3
AC4 heating Cold 134.5 134.9 2.1
PH1 condensate Hot 60.2 36.3 12.1

Appendix G HEN optimization for carbon capture in the power plant
185
Table G.2 continued
PH2 condensate Hot 61.8 59.3 14.3
PH4 condensate Hot 153.9 139.6 2.1
G.3 Pinch analysis for Hybrid D1-CO2 compression-LP preheaters Table G. 3 Process streams for pinch analysis
Stream Type Inlet T
[ºC] Outlet T
[ºC] Heat flow
[GJ/h]
Hybrid D1
Presrub cooling Hot 50 25 314.7
HX1 cooling Hot 152.8 25 91.4
HX2 cooling Hot 152.8 25 91.5
HX3 cooling Hot 85 25 10.6
Flash1/Cooler1cooling Hot 67.8 40 159.1
Cooler2 cooling Hot 101.6 40 490.9
Cooler3 cooling Hot 75.8 40 760.4
CO2 compression train
Stage1 cooling Hot 123.8 30 48.0
Stage2 cooling Hot 120.6 30 34.7
Stage3 cooling Hot 123.7 30 39.3
Stage4 cooling Hot 128.0 30 98.4
Feed water
PH1 heating Cold 28.3 44.2 29.8
PH2 heating Cold 44.2 78.8 64.8
PH3 heating Cold 78.8 108.1 55.4
PH4 heating Cold 108.9 130.9 46
AC1 heating Cold 24.3 26.0 3.0

Appendix G HEN optimization for carbon capture in the power plant
186
Table G.3 continued
AC2 heating Cold 26.0 28.3 4.4
AC4 heating Cold 108.2 108.9 1.5
PH1 condensate Hot 45.0 26.1 2.9
PH2 condensate Hot 45.0 42.0 1.5
PH4 condensate Hot 132.8 119.8 1.5
G.4 Pinch analysis for Hybrid D2-CO2 compression-LP preheaters Table G. 4 Process streams for pinch analysis
Stream Type Inlet T
[ºC] Outlet T
[ºC] Heat flow
[GJ/h]
Hybrid D2
Presrub cooling Hot 50 25 314.7
HX1 cooling Hot 139.9 25 17.0
HX2 cooling Hot 140 25 24.4
HX3 cooling Hot 85 25 10.6
HX4 cooling Hot 85 25 9.5
HX5 heating Cold 25 80 1.7
HX6 heating Cold 30.7 80 1.5
Flash1/Cooler1cooling Hot 58.2 40 302.2
Cooler2 cooling Hot 106 40 560.2
Cooler3 cooling Hot 55.5 40 306.3
CO2 compression unit
Stage1 cooling Hot 141.3 30 53.1
Stage2 cooling Hot 120 30 37.1
Stage3 cooling Hot 122 30 41
Stage4 cooling Hot 126.5 30 56.6
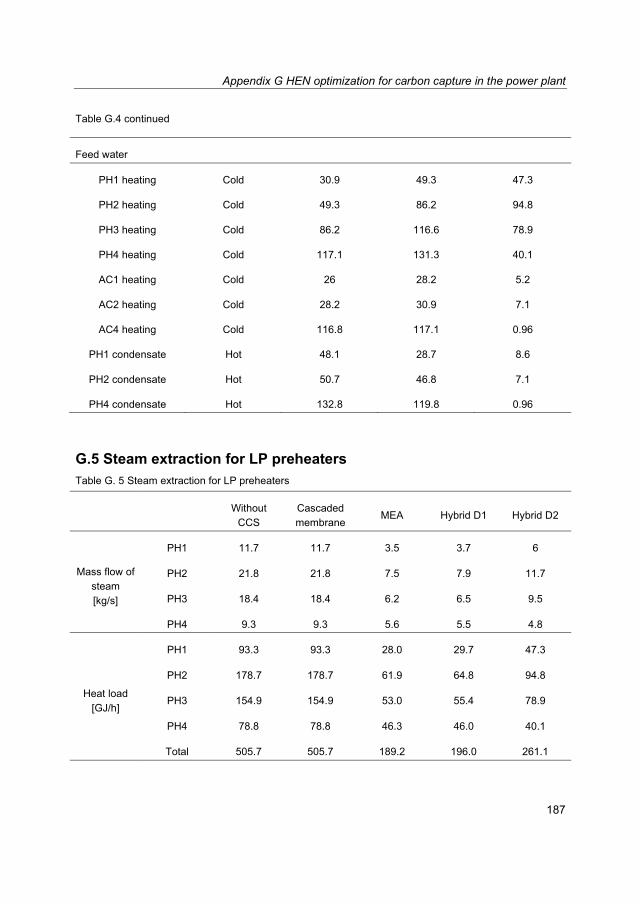
Appendix G HEN optimization for carbon capture in the power plant
187
Table G.4 continued
Feed water
PH1 heating Cold 30.9 49.3 47.3
PH2 heating Cold 49.3 86.2 94.8
PH3 heating Cold 86.2 116.6 78.9
PH4 heating Cold 117.1 131.3 40.1
AC1 heating Cold 26 28.2 5.2
AC2 heating Cold 28.2 30.9 7.1
AC4 heating Cold 116.8 117.1 0.96
PH1 condensate Hot 48.1 28.7 8.6
PH2 condensate Hot 50.7 46.8 7.1
PH4 condensate Hot 132.8 119.8 0.96
G.5 Steam extraction for LP preheaters Table G. 5 Steam extraction for LP preheaters
Without
CCS Cascaded membrane
MEA Hybrid D1 Hybrid D2
Mass flow of steam [kg/s]
PH1 11.7 11.7 3.5 3.7 6
PH2 21.8 21.8 7.5 7.9 11.7
PH3 18.4 18.4 6.2 6.5 9.5
PH4 9.3 9.3 5.6 5.5 4.8
Heat load [GJ/h]
PH1 93.3 93.3 28.0 29.7 47.3
PH2 178.7 178.7 61.9 64.8 94.8
PH3 154.9 154.9 53.0 55.4 78.9
PH4 78.8 78.8 46.3 46.0 40.1
Total 505.7 505.7 189.2 196.0 261.1

Appendix G HEN optimization for carbon capture in the power plant
188
G.6 Optimized HEN for the standalone cascaded membrane system
Figure G. 1 Optimized HEN for the standalone cascaded membrane system

Appendix G HEN optimization for carbon capture in the power plant
189
G.7 HEN for cascaded membrane-CO2 compression-feed water
Figure G. 2 HEN design for heat integration of the cascaded membrane system, CO2 compression train and LP preheaters

Appendix G HEN optimization for carbon capture in the power plant
190
G.8 HEN for MEA-CO2 compression-feed water
Figure G. 3 HEN design for heat integration of the MEA system, CO2 compression train and LP preheaters

Appendix G HEN optimization for carbon capture in the power plant
191
G.9 HEN for Hybrid D1 – CO2 compression – feed water
Figure G. 4 HEN design for integration of the Hybrid D1 system, CO2 compression train and LP preheaters

Appendix G HEN optimization for carbon capture in the power plant
192
G.10 HEN for Hybrid D2 – CO2 compression – feed water
Figure G. 5 HEN design for integration of the Hybrid D2 system, CO2 compression train and LP preheaters

Appendix H Costing method
193
Appendix H Costing method
H.1 Sizing of separation vessels
Towler and Sinnott have provided a series of formulas to estimate the sizes of gas-liquid separators [177, pp. 769-770]. The diameter of a vessel ¦� is calculated according to:
�¦� # § ¨�©Nª��^-N
(H.1)
, where «� is the vapor flowrate and �¬'-� the settling velocity for vapor droplets. The settling velocity for knockout drums�¬'-W is estimated as
�¬'-W # 010¤§�®¯�®°®°
(H.2)
, while the settling velocity for scrubber (�¬'-�) is estimated based on the following equation:
�¬'-� # �H014¤4u � 01�¤u H 010¡¤�§�®¯�®°®°
(H.3)
, where ±! and ±� are the liquid and vapor flow density, respectively. And u is the tray sizing for which 0.5 m is used.
The vessel height � is determined as
� # �¦� � 01¡� � ²! (H.4)
, wherein the liquid depth ²! can be estimated as
²! # ¨�©¯ ³S¯�ª�´N% (H.5)
, where «! is the liquid flowrate, �.�!W the hold-up time in the vessel. The value of �.�!W is assumed to be 5 mins for all vessels.
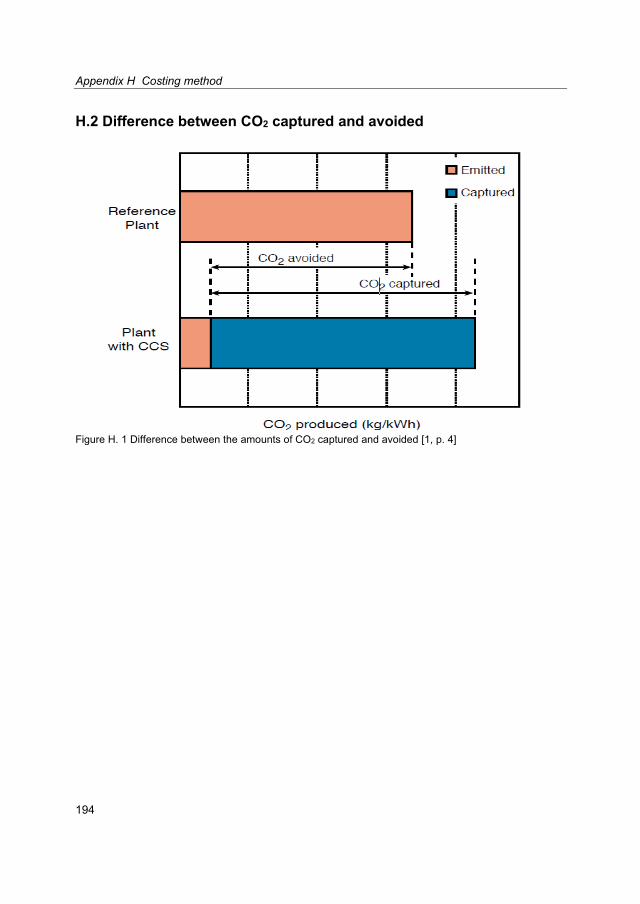
Appendix H Costing method
194
H.2 Difference between CO2 captured and avoided
Figure H. 1 Difference between the amounts of CO2 captured and avoided [1, p. 4]

Appendix H Costing method
195
H.3 Classification of cost estimate Table H. 1 Classification of cost estimate [177, p. 311, 186]
Type Estimate class of
AACE Basis Purpose Accuracy
Order of magnitude estimate
Class 5
Based on similar processes, no
design information required
Concept screening
± 30 – 50 %
Preliminary estimate
Class 4 Based on limited
cost data and design details
Study or feasibility
± 30 %
Definitive estimate Class 3
Piping & instrumentation
diagram and approximate sizes
of equipment
Budget authorization
± 10 – 15 %
Detailed estimate Class 2 Detailed information
of completed designs
Control or bid ± 5 – 10 %
Check estimate Class 1
Based on a completed design
and concluded negotiations on
procurement
Check or bid ± 5 – 10 %

Appendix H Costing method
196

Appendix I Economic analysis for carbon capture in the reference power plant
197
Appendix I Economic analysis for carbon capture in the reference power plant
I.1 Breakdown of CAPEX & OPEX Table I. 1 Breakdown of the CAPEX of the MEA system
Percentage of PEC Used [%]
Cost [M€]
Direct Cost
Purchased Equipment 100 43
Installation 53 22.7
Instrumentation and Control 20 8.6
Piping 40 17.2
Electrical 11 4.7
Building and Services 10 4.3
Yard Improvements 10 4.3
Service Facilities 20 8.6
Land 5 2.1
Indirect cost
Engineering 10 4.3
Construction Expenses 10 4.3
Contractor’s Fee 0.5 0.2
Project & Process Contingency 17 7.3
Fixed Capital Investment (FCI)
131.6
Percentage of FCI used [%]
Working Investment 15 19.7
Start-up + MEA 10 13.2
Total capital investment 164.5

Appendix I Economic analysis for carbon capture in the reference power plant
198
Table I. 2 Breakdown of the OPEX for the MEA system
Percentage or cost parameter used
Cost (M€/yr)
Variable Cost
Cooling Water 0.15 €/m3 1.95
MEA Makeup 1kg/tCO2 6.7
Fixed Cost
Local Taxes 2 % 2.6
Insurance 1 % 1.3
Maintenance (M) 4 % 5.3
Operating Labor (OL) 2 shifts, 45 €/h/shift 0.7
Supervision and Support Labor (S) 30 % 0.2
Operating Supplies 15 % 0.8
Laboratory Charges 10 % 0.07
Plant Overhead Cost 60 % 3.7
General Expenses
Administrative Cost 15 % 0.1
Distribution and Marketing 0.5 % 0.12
R & D Cost 5 % 1.24
Total operating cost
24.8
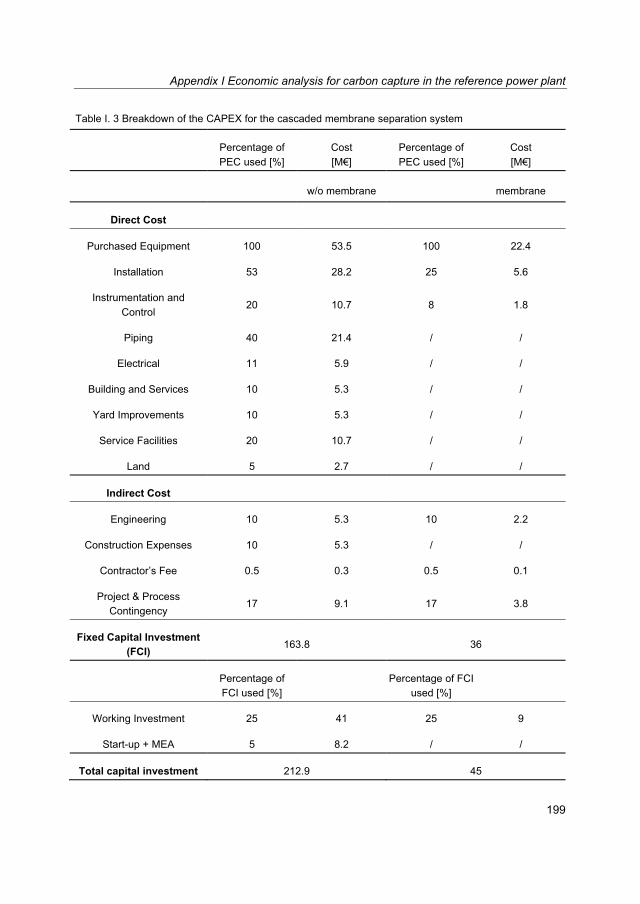
Appendix I Economic analysis for carbon capture in the reference power plant
199
Table I. 3 Breakdown of the CAPEX for the cascaded membrane separation system
Percentage of PEC used [%]
Cost [M€]
Percentage of PEC used [%]
Cost [M€]
w/o membrane membrane
Direct Cost
Purchased Equipment 100 53.5 100 22.4
Installation 53 28.2 25 5.6
Instrumentation and Control
20 10.7 8 1.8
Piping 40 21.4 / /
Electrical 11 5.9 / /
Building and Services 10 5.3 / /
Yard Improvements 10 5.3 / /
Service Facilities 20 10.7 / /
Land 5 2.7 / /
Indirect Cost
Engineering 10 5.3 10 2.2
Construction Expenses 10 5.3 / /
Contractor’s Fee 0.5 0.3 0.5 0.1
Project & Process Contingency
17 9.1 17 3.8
Fixed Capital Investment (FCI) 163.8 36
Percentage of FCI used [%]
Percentage of FCI
used [%]
Working Investment 25 41 25 9
Start-up + MEA 5 8.2 / /
Total capital investment 212.9 45

Appendix I Economic analysis for carbon capture in the reference power plant
200
Table I. 4 Breakdown of the OPEX for the cascaded membrane separation system
Percentage or cost parameter used
Cost (M€/yr)
Variable Cost
Cooling Water 0.15 €/m3 0.57
Fixed Cost
Local Taxes 2 % 3.8
Insurance 1 % 1.9
Maintenance (M) 4 % 6.1
Operating Labor (OL) 2 shifts, 45 €/h/shift 0.7
Supervision and Support Labor (S) 30 % 0.21
Operating Supplies 15 % 0.92
Laboratory Charges 10 % 0.07
Plant Overhead Cost 60 % 4.4
General Expenses
Administrative Cost 15 % 0.11
Distribution and Marketing 0.5 % 0.1
R & D Cost 5 % 1.01
Total operating cost
20.2

Appendix I Economic analysis for carbon capture in the reference power plant
201
Table I. 5 Breakdown of the CAPEX for the Hybrid D1 system
Percentage of PEC used [%]
Cost [M€]
Percentage of PEC used [%]
Cost [M€]
w/o membrane membrane
Direct Cost
Purchased Equipment 100 89.3 100 211.1
Installation 53 47.1 25 52.8
Instrumentation and Control
20 17.9 8 16.9
Piping 40 35.7 / /
Electrical 11 9.8 / /
Building and Services 10 8.9 / /
Yard Improvements 10 8.9 / /
Service Facilities 20 17.9 / /
Land 5 4.5 / /
Indirect Cost
Engineering 10 8.9 10 21.1
Construction Expenses 10 8.9 / /
Contractor’s Fee 0.5 0.4 0.5 1.1
Project & Process Contingency
17 15.2 17 35.9
Fixed Capital Investment (FCI) 273.4 338.9
Percentage of FCI used [%]
Percentage of FCI
used [%]
Working Investment 25 68.4 25 33.9
Start-up + MEA 5 13.7 / /
Total capital investment 394.9 414.2

Appendix I Economic analysis for carbon capture in the reference power plant
202
Table I. 6 Breakdown of the OPEX for the Hybrid D1 system
Percentage or cost parameter used
Cost (M€/yr)
Variable Cost
Cooling Water 0.15 €/m3 1.6
MEA make-up 1 kg/tCO2 6.7
Fixed Cost
Local Taxes 2 % 12.3
Insurance 1 % 6.1
Maintenance (M) 4 % 14.2
Operating Labor (OL) 2 shifts, 45 €/h/shift 0.7
Supervision and Support Labor (S) 30 % 0.21
Operating Supplies 15 % 1.64
Laboratory Charges 10 % 0.07
Plant Overhead Cost 60 % 9.1
General Expenses
Administrative Cost 15 % 0.11
Distribution and Marketing 0.5 % 0.28
R & D Cost 5 % 2.8
Total operating cost
55.9

Appendix I Economic analysis for carbon capture in the reference power plant
203
Table I. 7 Breakdown of the CAPEX for the Hybrid D2 system
Percentage of PEC used [%]
Cost [M€]
Percentage of PEC used [%]
Cost [M€]
w/o membrane membrane
Direct Cost
Purchased Equipment 100 51.5 100 17.1
Installation 53 27.2 25 4.3
Instrumentation and Control
20 10.3 8 1.4
Piping 40 20.6 / /
Electrical 11 5.7 / /
Building and Services 10 5.1 / /
Yard Improvements 10 5.1 / /
Service Facilities 20 10.3 / /
Land 5 2.6 / /
Indirect Cost
Engineering 10 5.1 10 1.7
Construction Expenses 10 5.1 / /
Contractor’s Fee 0.5 0.3 0.5 0.1
Project & Process Contingency
17 8.8 17 2.9
Fixed Capital Investment (FCI)
157.7 27.5
Percentage of FCI used [%]
Percentage of FCI
used [%]
Working Investment 25 38.1 25 2.8
Start-up + MEA 5 7.6 / /
Total capital investment 205 30.3
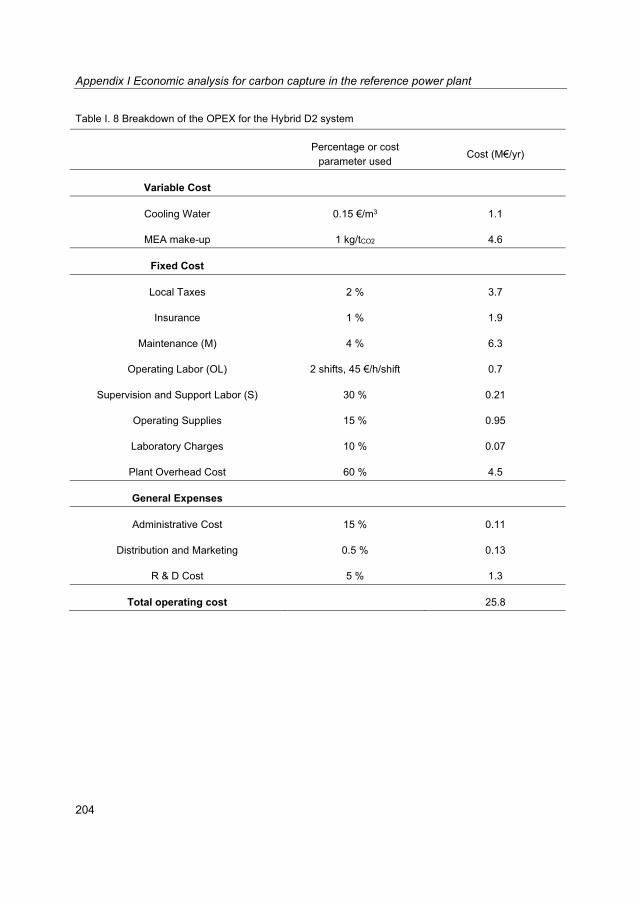
Appendix I Economic analysis for carbon capture in the reference power plant
204
Table I. 8 Breakdown of the OPEX for the Hybrid D2 system
Percentage or cost parameter used
Cost (M€/yr)
Variable Cost
Cooling Water 0.15 €/m3 1.1
MEA make-up 1 kg/tCO2 4.6
Fixed Cost
Local Taxes 2 % 3.7
Insurance 1 % 1.9
Maintenance (M) 4 % 6.3
Operating Labor (OL) 2 shifts, 45 €/h/shift 0.7
Supervision and Support Labor (S) 30 % 0.21
Operating Supplies 15 % 0.95
Laboratory Charges 10 % 0.07
Plant Overhead Cost 60 % 4.5
General Expenses
Administrative Cost 15 % 0.11
Distribution and Marketing 0.5 % 0.13
R & D Cost 5 % 1.3
Total operating cost
25.8

Appendix I Economic analysis for carbon capture in the reference power plant
205
I.2 Material, pressure and temperature factors Table I. 9 Material, pressure and temperature factors for the MEA system
Equipment Material kj kl kJ
BLOWER Stainless Steel (high grade) 3.4 1 1
PRESCRUB Stainless Steel (low grade) 2.1 1 1
ABSORBER Stainless Steel (high grade) 3.2 1 1
FLASH1 Stainless Steel (low grade) 2.1 1 1
RICHPUMP Stainless Steel (high grade) 3.4 1 1
LEANPUMP Stainless Steel (low grade) 2.1 1 1
RLHX Stainless Steel (low grade) 2.9 1 1
STRIPPER Stainless Steel (high grade) 3.2 1 1
STRIPPER REBOILER Stainless Steel (low grade) 2.9 1 1
FLASH2 Stainless Steel (low grade) 2.9 1 1
Water pump Stainless Steel (low grade) 2.1 1 1
COOLER3 Stainless Steel (low grade) 2.9 1 1
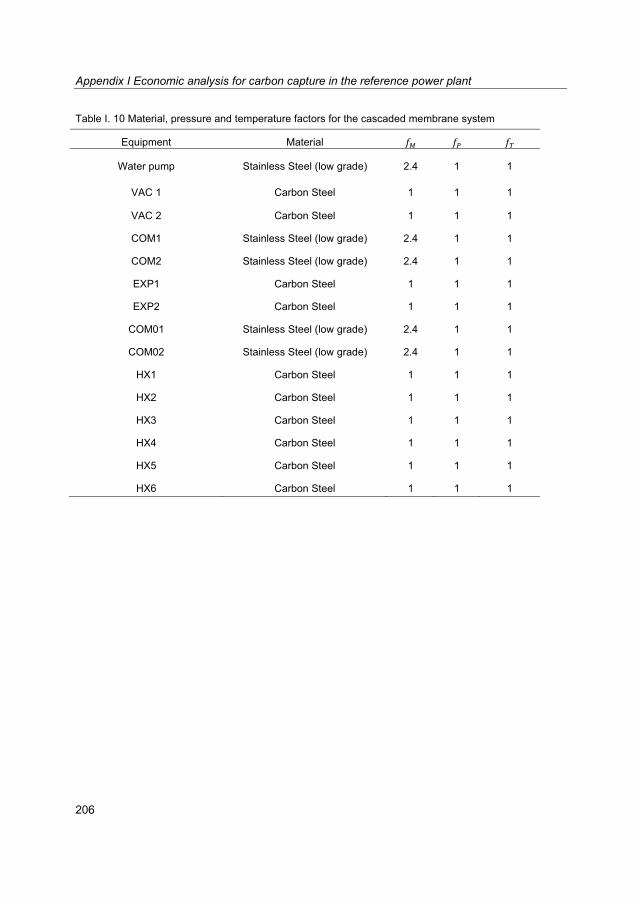
Appendix I Economic analysis for carbon capture in the reference power plant
206
Table I. 10 Material, pressure and temperature factors for the cascaded membrane system
Equipment Material kj kl kJ
Water pump Stainless Steel (low grade) 2.4 1 1
VAC 1 Carbon Steel 1 1 1
VAC 2 Carbon Steel 1 1 1
COM1 Stainless Steel (low grade) 2.4 1 1
COM2 Stainless Steel (low grade) 2.4 1 1
EXP1 Carbon Steel 1 1 1
EXP2 Carbon Steel 1 1 1
COM01 Stainless Steel (low grade) 2.4 1 1
COM02 Stainless Steel (low grade) 2.4 1 1
HX1 Carbon Steel 1 1 1
HX2 Carbon Steel 1 1 1
HX3 Carbon Steel 1 1 1
HX4 Carbon Steel 1 1 1
HX5 Carbon Steel 1 1 1
HX6 Carbon Steel 1 1 1

Appendix J Economic analysis for carbon capture in the reference iron & steel plant
207
Appendix J Economic analysis for carbon capture in the reference iron & steel plant
J.1 Geometric results of the capture systems Table J. 1 Geometric results of important components of capture systems
Emission sources Unit Cascaded
membrane MEA Hybrid D2
Absorber diameter
Power plant
m
/ 13 12
Hot stove / 12 8
Coke production / 7 8
Lime production / 6 6
Stripper diameter
Power plant
m
/ 12 9.6
Hot stove / 7.5 6.3
Coke production / 5.4 4.4
Lime production / 3.4 2.6
Membrane area
Power plant
Mil. m2
0.24 / 0.17
Hot stove 0.1 / 0.06
Coke production 0.09 / 0.07
Lime production 0.02 / 0.02
Total 0.45 / 0.32
J.2 Overview of the equipment costs Table J. 2 Equipment costs for cascaded membrane system (million €)
Equipment Emission source
Power plant Hot Stove Coke Plant Lime Plant
Cooling Water Pump 0.67 0.4 0.34 0.18
VAC 1 0.34 0.23 0.19 0.12
VAC 2 0.34 0.23 0.19 0.12
COM1 1.46 0.97 0.80 0.47

Appendix J Economic analysis for carbon capture in the reference iron & steel plant
208
Table J.2 continued
COM2 1.45 0.97 0.79 0.47
EXP1 0.52 0.49 0.48 0.34
EXP2 0.52 0.49 0.48 0.34
COM01 2.48 1.65 1.50 0.83
COM02 2.48 1.65 1.50 0.83
HX1 2.23 1.19 1.05 0.44
HX2 1.78 0.95 0.85 0.35
HX3 2.37 1.31 0.95 0.44
HX4 1.54 0.85 0.64 0.29
HX5 1.17 0.65 0.46 0.22
HX6 0.9 0.49 0.36 0.17
HX7 0.9 0.5 0.47 0.2
HX8 1.27 0.7 0.67 0.4
Additional heat exchanger (HEN optimization)
1.35 1.12 0.94 0.3
Prescrub (SCRUBBER) 4.9 2.33 2.26 0.77
Flash 1 5.34 0.00 0.26 0.00
Flash 2 3.59 3.86 0.6 0.11
Flash 3 1.09 0.55 0.16 0.04
Flash 4 0.63 0.19 0.1 0.03
MEM1&2 12 4.86 4.32 1.11
MEM Frame1&2 8.65 4.59 4.01 1.58
Total PEC 60 31 23.3 10

Appendix J Economic analysis for carbon capture in the reference iron & steel plant
209
Table J. 3 Equipment costs for the MEA system (million €)
Equipment Emission source
Power plant Hot Stove Coke Plant Lime Plant
Blower 1.66 0 1.06 0.29
Rich Pump 0.97 0.68 0.47 0.22
Lean Pump 0.35 0.21 0.15 0.08
Overhead condenser 0.41 0.23 0.14 0.07
Cooler3 0.75 0.40 0.26 0.12
RLHX 2.62 1.47 0.97 0.47
Pre-Scrubber 3.89 1.62 1.62 0.62
Flash 1 8.23 1.91 1.71 0.25
Stripper 6.7 2.96 1.36 0.63
Absorber 10.57 8.81 2.73 1.98
Cooling Water Pump 1.52 0.91 0.72 0.37
Total PEC 37.7 19.2 11.2 5.1
Table J. 4 Equipment costs for the Hybrid D2 system (million €)
Equipment Emission source
Power plant Hot Stove Coke Plant Lime Plant
Blower 1.23 0.67 0.52 0.22
Rich Pump 0.68 0.42 0.29 0.18
Lean Pump 0.27 0.17 0.12 0.06
Overhead condenser 0.33 0.18 0.11 0.05
Cooler3 0.59 0.31 0.05 0.03
RLHX 2.39 1.25 0.87 0.41
Flash1 3.28 1.5 1.43 0.5

Appendix J Economic analysis for carbon capture in the reference iron & steel plant
210
Table J.4 continued
Stripper 4.65 3.15 1.63 0.53
Absorber 8.81 3.62 3.62 1.98
Cooling Water Pump 1.28 0.58 0.38 1.05
VAC 1 0.20 0.14 0.11 0.07
VAC 2 0.20 0.14 0.11 0.07
COM1 0.83 0.56 0.42 0.26
COM2 0.82 0.55 0.42 0.25
EXP1 0.01 0.004 0.01 0.002
EXP2 0.01 0.004 0.01 0.002
PROCOMP 0.20 0.05 0.03 0.02
HX1 1.12 0.6 0.39 0.19
HX2 0.72 0.39 0.24 0.12
HX3 0.53 0.29 0.18 0.09
HX4 0.42 0.22 0.14 0.07
HX5 0.04 0.01 0.03 0.01
HX6 0.06 0.02 0.04 0.01
Prescrub (SCRUBBER) 4.47 2 1.71 0.64
Flash 1 0 0 0 0.00
Flash 2 0.2 0.06 0.03 0.01
Flash 3 0.13 0.04 0.02 0.01
Flash 4 0.08 0.03 0.02 0.01
MEM1&2 8.29 2.97 3.26 0.78
MEM Frame1&2 6.29 3.14 3.14 1.2
Total PEC 48 23 19.3 8.8

Appendix J Economic analysis for carbon capture in the reference iron & steel plant
211
Table J. 5 Equipment costs for the CO2 compression trains (million €)
Cascaded membrane
MEA Hybrid D2
Train 1 Train 2 Train 1 Train 2 Train 1 Train 2
Cooling Water Pump 0.59 0.43 0.57 0.42 0.53 0.43
Compressor 1 1.83 1.42 1.69 1.31 1.74 1.36
Compressor 2 1.91 1.48 1.80 1.40 1.80 1.41
Compressor 3 2.36 1.82 2.19 1.70 2.18 1.71
Compressor 4 3.37 2.60 2.99 2.32 2.99 2.34
Cooler 1 1.88 1.29 1.73 0.88 1.78 1.23
Cooler 2 1.40 0.95 1.31 0.91 1.29 0.90
Cooler 3 1.28 0.88 1.22 0.95 1.20 0.84
Cooler 4 2.53 1.75 3.28 1.94 2.21 1.54
Flash 1 0.00 0.00 0.56 0.25 0.26 0.13
Flash 2 0.17 0.09 0.26 4.63 0.13 0.07
Flash 3 0.00 0.00 0.06 0.03 0.00 0.00
Total 16.7 12.3 17.1 16.3 15.6 11.5
J.3 CAPEX Table J. 6 Cost parameters for CAPEX estimation
Percentage of PEC used [%]
Cascaded membrane MEA Hybrid D2 Compression
train
excl.
membrane only
membrane
excl. membrane
only membrane
Direct Cost
Purchased Equipment 100 100 100 100 100 100
Installation 53 25 53 53 25 40

Appendix J Economic analysis for carbon capture in the reference iron & steel plant
212
Table J.6 continued
Instrumentation and Control
20 8 20 20 8 20
Piping 40 0 40 40 0 40
Electrical 11 0 11 11 0 11
Building and Services 10 0 10 10 0 10
Yard Improvements 10 0 10 10 0 10
Service Facilities 20 0 20 20 0 20
Land 5 0 5 5 0 4
Indirect Cost
Engineering 10 10 10 10 10 10
Construction Expenses 10 0 10 10 0 10
Contractor’s Fee 0.5 0.5 0.5 0.5 0.5 0.5
Project & Process Contingency
17 17 17 17 17 17
Fixed Capital Investment (FCI)
Percentage of FCI used [%]
FCI 100 100 100 100 100 100
Working Investment 15 10 15 15 10 12
Start-up + MEA 10 0 10 10 0 8

Appendix J Economic analysis for carbon capture in the reference iron & steel plant
213
Table J. 7 CAPEX data for the cascaded membrane system (million €)
Total Direct Cost
Total Indirect Costs
Fixed Capital Investment
(FCI)
Working Invest-ment
Start-up cost + MEA
cost
Total Capital Investment (CAPEX)
Powe-r
plant
excl. membr-
ane 126 17.6 143.6 35.9 7.2 186.7
only membra
-ne 16 3.3 19.3 1.9 0 21.2
Hot stove
excl. membra
-ne 69.1 9.6 78.7 19.7 3.9 102.3
only membra
ne 6.5 1.3 7.8 0.8 0.00 8.6
Coke plant
excl. membra
ne 52.4 7.3 59.7 14.9 3.0 77.6
only membra
ne 5.7 1.2 6.9 0.7 0 7.6
Lime Plant
excl. membra
ne 23.5 3.3 26.8 6.7 1.3 34.8
only membra
ne 1.5 0.30 1.8 0.2 0 2.0
Compression train 1
57.2 7.4 64.5 7.7 5.2 86.1
Compression train 2
39.5 5.4 44.9 5.4 3.6 53.9
Total 581

Appendix J Economic analysis for carbon capture in the reference iron & steel plant
214
Table J. 8 CAPEX for the MEA system (million €)
Total Direct Cost
Total Indirect Costs
Fixed Capital Investment
(FCI)
Working Invest-ment
Start-up cost + MEA cost
Total Capital Investment (CAPEX)
Power plant 103 14.4 117.3 17.6 11.7 146.7
Hot Stove 52.9 7.4 60.3 9 6 75.3
Coke Plant 30.9 4.3 35.2 5.3 3.5 44
Lime Plant 14.1 2 16 2.4 1.6 20.1
Compression train 1
43.6 6.4 50 6 4 60
Compression train 2
41.6 6.1 47.7 5.7 3.8 57.3
Steam generation
plant 153.6
Total 557
Table J. 9 CAPEX for the Hybrid D2 system (million €)
Total Direct Cost
Total Indirect Costs
Fixed Capital Investment
(FCI)
Working Investme
nt
Start-up cost + MEA
cost
Total Capital Investment (CAPEX)
Powe-r plant
excl. membr
ane 106.8 14.9 121.7 30.4 6.1 211.3
only membr
ane 11 2.3 13.3 1.3 0 14.6
Hot stove
excl. membr
ane 54 7.5 61.5 15.4 3.1 80
only membr
ane 4 0.8 4.8 0.5 0.00 5.2
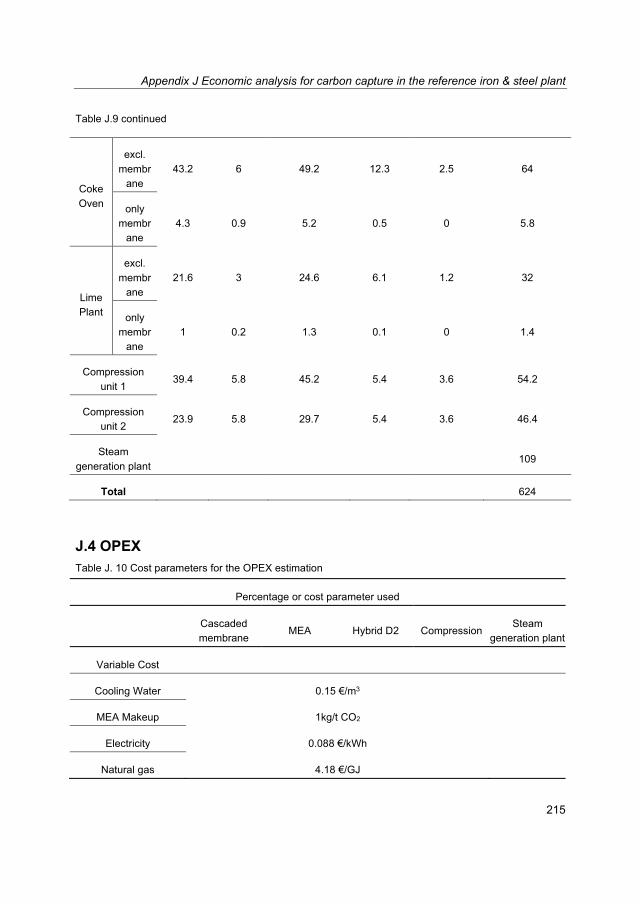
Appendix J Economic analysis for carbon capture in the reference iron & steel plant
215
Table J.9 continued
Coke Oven
excl. membr
ane 43.2 6 49.2 12.3 2.5 64
only membr
ane 4.3 0.9 5.2 0.5 0 5.8
Lime Plant
excl. membr
ane 21.6 3 24.6 6.1 1.2 32
only membr
ane 1 0.2 1.3 0.1 0 1.4
Compression unit 1
39.4 5.8 45.2 5.4 3.6 54.2
Compression unit 2
23.9 5.8 29.7 5.4 3.6 46.4
Steam generation plant
109
Total 624
J.4 OPEX Table J. 10 Cost parameters for the OPEX estimation
Percentage or cost parameter used
Cascaded membrane
MEA Hybrid D2 Compression Steam
generation plant
Variable Cost
Cooling Water 0.15 €/m3
MEA Makeup 1kg/t CO2
Electricity 0.088 €/kWh
Natural gas 4.18 €/GJ

Appendix J Economic analysis for carbon capture in the reference iron & steel plant
216
Table 10 continued
Fixed Cost
Local Taxes 2 % 1 % CAPEX
Insurance 1 % 1 % CAPEX
Maintenance (M) 4 % 2.5 % CAPEX
Operating Labor (OL) 2 shifts,
45 €/h/shift 2 shifts,
45 €/h/shift
Supervision and Support Labor (S)
30 % 30 %
Operating Supplies 15 % 15 %
Laboratory Charges 10 % 10 %
Plant Overhead Cost 60 % 60 %
General Expenses
Administrative Cost 15 % 15 %
Distribution and Marketing
0.5 % 0.5 %
R & D Cost 5 % 5 %
Table J. 11 OPEX data for the capture systems (million €/yr)
Production Cost
Cascaded membrane MEA Hybrid D2
Power plant
Hot Stove
Coke Plant
Lime Plant
Power plant
Hot Stove
Coke Plant
Lime Plant
Power plant
Hot Stove
Coke Plant
Lime Plant
Variable cost
Cooling water
0.55 0.21 0.25 0.06 3.33 1.35 0.83 0.25 2.55 0.92 0.94 0.08
MEA make-up
0 0 0 0 8.0 3.4 1.6 0.6 5.9 2.3 1.1 0.4

Appendix J Economic analysis for carbon capture in the reference iron & steel plant
217
Table J.11 continued
Electricity 54.5 22.7 15.4 4.7 8.5 2.0 2.6 0.4 18.5 6.2 3.2 1.1
Fixed cost
Local taxes 3.3 1.7 1.7 0.6 2.4 1.2 0.7 0.5 2.7 1.3 1.1 0.5
Insurance 1.6 0.9 0.8 0.3 1.2 0.6 0.4 0.2 1.4 0.7 0.5 0.3
Maintenance (M)
5.9 3.2 3.2 1.1 4.7 2.4 1.4 0.6 5.0 2. 2.6 1.3
Operating labor (OL)
0.7 0.7 0.7 0.7 0.7 0.7 0.7 0.7 0.7 0.7 0.7 0.7
Supervision and support
labor (S) 0.2 0.2 0.2 0.2 0.2 0.2 0.2 0.2 0.2 0.2 0.2 0.2
Operating supplies
0.9 0.5 0.5 0.2 0.7 0.4 0.2 0.1 0.7 0.4 0.4 0.2
Laboratory charges
0.07 0.07 0.07 0.07 0.07 0.07 0.07 0.07 0.07 0.07 0.07 0.07
Plant Overhead
Cost 4.1 2.5 2.5 1.2 3.4 2.0 1.4 1.0 3.6 2.1 2.2 1.3
General Expenses
Administrative Costs
0.11 0.11 0.11 0.11 0.11 0.11 0.11 0.11 0.11 0.11 0.11 0.11
Distribution and
marketing 0.38 0.17 0.13 0.05 0.18 0.08 0.05 0.02 0.21 0.09 0.07 0.03
R&D cost 3.8 1.7 1.4 0.5 0.8 0.8 0.6 0.2 2.1 0.9 0.7 0.3
Total operating
cost (OPEX) 76.7 35.0 25 9.8 35.2 15.3 10.8 4.8 43.7 18.4 13.8
6.7
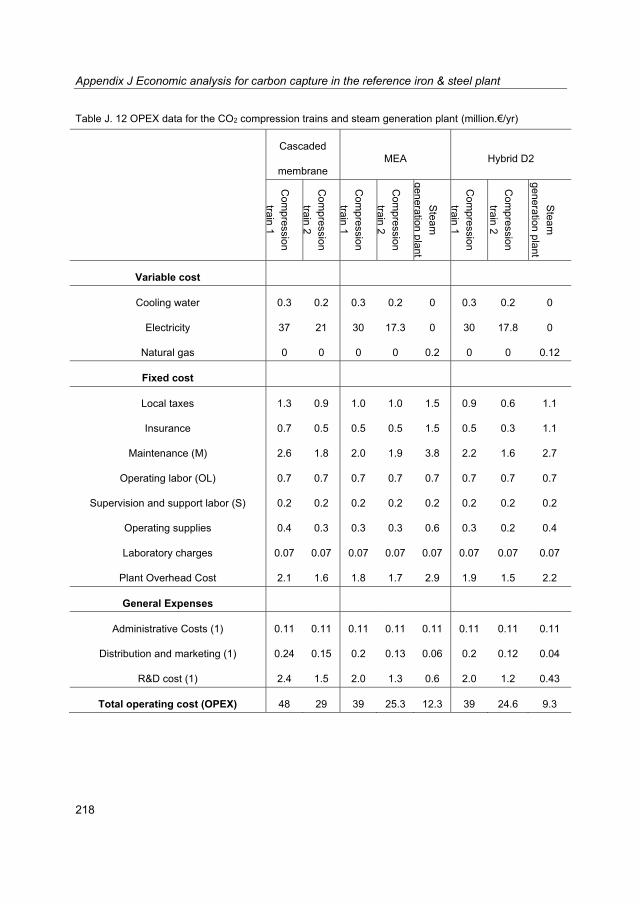
Appendix J Economic analysis for carbon capture in the reference iron & steel plant
218
Table J. 12 OPEX data for the CO2 compression trains and steam generation plant (million.€/yr)
Cascaded
membrane MEA Hybrid D2
Com
pression train 1
Com
pression train 2
Com
pression train 1
Com
pression train 2
Steam
generation plant
Com
pression train 1
Com
pression train 2
Steam
generation plant
Variable cost
Cooling water 0.3 0.2 0.3 0.2 0 0.3 0.2 0
Electricity 37 21 30 17.3 0 30 17.8 0
Natural gas 0 0 0 0 0.2 0 0 0.12
Fixed cost
Local taxes 1.3 0.9 1.0 1.0 1.5 0.9 0.6 1.1
Insurance 0.7 0.5 0.5 0.5 1.5 0.5 0.3 1.1
Maintenance (M) 2.6 1.8 2.0 1.9 3.8 2.2 1.6 2.7
Operating labor (OL) 0.7 0.7 0.7 0.7 0.7 0.7 0.7 0.7
Supervision and support labor (S) 0.2 0.2 0.2 0.2 0.2 0.2 0.2 0.2
Operating supplies 0.4 0.3 0.3 0.3 0.6 0.3 0.2 0.4
Laboratory charges 0.07 0.07 0.07 0.07 0.07 0.07 0.07 0.07
Plant Overhead Cost 2.1 1.6 1.8 1.7 2.9 1.9 1.5 2.2
General Expenses
Administrative Costs (1) 0.11 0.11 0.11 0.11 0.11 0.11 0.11 0.11
Distribution and marketing (1) 0.24 0.15 0.2 0.13 0.06 0.2 0.12 0.04
R&D cost (1) 2.4 1.5 2.0 1.3 0.6 2.0 1.2 0.43
Total operating cost (OPEX) 48 29 39 25.3 12.3 39 24.6 9.3

References
219
References [1] IPCC. IPCC Special Report on Carbon Dioxide Capture and Storage. New York, USA,
2005.
[2] IEA. CO2 Emissions Statistics. https://www.iea.org/statistics/co2emissions. Last accessed 13.11.2019.
[3] IEA. Iron and Steel Technology Roadmap. https://www.iea.org/reports/iron-and-steel-technology-roadmap. Last accessed 12.10.2020.2020.
[4] IEA. World energy outlook 2017 - Executive summary. 2017.
[5] Merkel, T. C., et al. Power plant post-combustion carbon dioxide capture: An opportunity for membranes. Journal of Membrane Science 2010; 359: pp.126-139.
[6] IEA. World energy outlook 2018 - Executive summary. 2018.
[7] Worldsteel. Energy use in the steel industry.2017.
[8] Otto, A., et al. Power-to-Steel: Reducing CO2 through the Integration of Renewable Energy and Hydrogen into the German Steel Industry. Energies 2017; 10: p.451.
[9] IPCC. Global warming of 1.5 °C. Switzerland, 2018.
[10] Rogelj, J., et al. Energy system transformations for limiting end-of-century warming to below 1.5 °C. Nature Climate Change 2015; 5: p.519.
[11] Bui, M., et al. Carbon capture and storage (CCS): the way forward. Energy & Environmental Science 2018; 11: pp.1062-1176.
[12] Kriegler, E., et al. Is atmospheric carbon dioxide removal a game changer for climate change mitigation? Climatic Change 2013; 118: pp.45-57.
[13] Bauer, N., et al. Global energy sector emission reductions and bioenergy use: overview of the bioenergy demand phase of the EMF-33 model comparison. Climatic Change 2018.
[14] Vögele, S., et al. Germany’s “No” to carbon capture and storage: Just a question of lacking acceptance? Applied Energy 2018; 214: pp.205-218.
[15] Muradov, N., Liberating energy from carbon : introduction to decarbonization. Springer: New York, 2014; Vol. 22, p 433 S.
[16] Bender, M., et al. Coupled Production of Steel and Chemicals. Chemie Ingenieur Technik 2018; 90: pp.1-25.
[17] Deerberg, G., et al. The Project Carbon2Chem®. Chemie Ingenieur Technik 2018.
[18] Schemme, S., et al. Power-to-fuel as a key to sustainable transport systems – An analysis of diesel fuels produced from CO2 and renewable electricity. Fuel 2017; 205: pp.198-221.
[19] Figueroa, J. D., et al. Advances in CO2 capture technology—The U.S. Department of Energy's Carbon Sequestration Program. International Journal of Greenhouse Gas Control 2008; 2: pp.9-20.
References
220
[20] Stolten, D. Efficient Carbon Capture for Coal Power Plants. Chemical Engineering & Technology 2012; 35.
[21] Rochelle, G. T. Amine Scrubbing for CO2 Capture. Science 2009; 325: pp.1652-1654.
[22] Zapantis;, A., et al. Policy prorities to incentivise the large scale deployment of CCS. Global CCS Institute: 2019.
[23] Alie, C., et al. Simulation of CO2 capture using MEA scrubbing: a flowsheet decomposition method. Energy Conversion and Management 2005; 46: pp.475-487.
[24] Harlick, P. J. E.; Tezel, F. H. Adsorption of carbon dioxide, methane and nitrogen: pure and binary mixture adsorption for ZSM-5 with SiO2/Al2O3 ratio of 280. Separation and Purification Technology 2003; 33: pp.199-210.
[25] Palomar, J., et al. Understanding the Physical Absorption of CO2 in Ionic Liquids Using the COSMO-RS Method. Industrial & Engineering Chemistry Research 2011; 50: pp.3452-3463.
[26] Ban, Z. H., et al. Physical Absorption of CO2 Capture: A Review. Advanced Materials Research 2014; 917: pp.134-143.
[27] Sanpasertparnich, T., et al. CO2 absorption in an absorber column with a series intercooler circuits. Energy Procedia 2011; 4: pp.1676-1682.
[28] Jung, J., et al., Advanced CO2 Capture Process Using MEA Scrubbing: Configuration of a Split Flow and Phase Separation Heat Exchanger. In Energy Procedia, 2013; Vol. 37, pp 1778-1784.
[29] Ding, J., et al. Optimization of Stripping Piperazine with Variable Rich Loading. Energy Procedia 2014; 63: pp.1842-1853.
[30] Le Moullec, Y.; Kanniche, M. Optimization of MEA based post combustion CO2 capture process: Flowsheeting and energetic integration. Energy Procedia 2011; 4: pp.1303-1309.
[31] Zhao, L., et al. Multi-stage gas separation membrane processes used in post-combustion capture: Energetic and economic analyses. Journal of membrane science 2010; 359: pp.160-172.
[32] Low, B. T., et al. A parametric study of the impact of membrane materials and process operating conditions on carbon capture from humidified flue gas. Journal of Membrane Science 2013; 431: pp.139-155.
[33] Roussanaly, S., et al. A Systematic Method for Membrane CO2 Capture Modeling and Analysis. Energy Procedia 2014; 63: pp.217-224.
[34] Robeson, L. M. Correlation of separation factor versus permeability for polymeric membranes. Journal of Membrane Science 1991; 62: pp.165-185.
[35] Powell, C. E.; Qiao, G. G. Polymeric CO2/N2 gas separation membranes for the capture of carbon dioxide from power plant flue gases. Journal of Membrane Science 2006; 279: pp.1-49.
[36] Dushyant Shekhawat, D. R. L., Henry W. Pennline. A Review of Carbon Dioxide Selective Membranes A Topical Report. 2003.

References
221
[37] Massood Ramezan; Skone, T. J. Carbon Dioxide Capture from Existing Coal-Fired Power Plants U.S. Department of Energy-National Energy Technology Laboratory, : Novemer, 2007.
[38] Rao, A. B.; Rubin, E. S. A Technical, Economic, and Environmental Assessment of Amine-Based CO2 Capture Technology for Power Plant Greenhouse Gas Control. Environmental Science & Technology 2002; 36: pp.4467-4475.
[39] Oexmann, J., et al. Post-combustion CO2 capture from coal-fired power plants: Preliminary evaluation of an integrated chemical absorption process with piperazine-promoted potassium carbonate. International Journal of Greenhouse Gas Control 2008; 2: pp.539-552.
[40] Leeson, D., et al. A Techno-economic analysis and systematic review of carbon capture and storage (CCS) applied to the iron and steel, cement, oil refining and pulp and paper industries, as well as other high purity sources. International Journal of Greenhouse Gas Control 2017; 61: pp.71-84.
[41] Arasto, A., et al. Costs and Potential of Carbon Capture and Storage at an Integrated Steel Mill. Energy Procedia 2013; 37: pp.7117-7124.
[42] Arasto, A., et al. Post-combustion capture of CO2 at an integrated steel mill – Part I: Technical concept analysis. International Journal of Greenhouse Gas Control 2013; 16: pp.271-277.
[43] Ho, M. T., et al. Comparison of MEA capture cost for low CO2 emissions sources in Australia. International Journal of Greenhouse Gas Control 2011; 5: pp.49-60.
[44] He, X. A review of material development in the field of carbon capture and the application of membrane-based processes in power plants and energy-intensive industries. Energy, Sustainability and Society 2018; 8: p.34.
[45] Tian, S., et al. Inherent potential of steelmaking to contribute to decarbonisation targets via industrial carbon capture and storage. Nat Commun 2018; 9: p.4422.
[46] Markewitz, P., et al. Worldwide innovations in the development of carbon capture technologies and the utilization of CO2. Energy & Environmental Science 2012; 5: p.7281.
[47] Wang, M., et al. Post-combustion CO2 Capture with Chemical Absorption: A State-of-the-art Review. Chemical Engineering Research and Design 2011; 89: pp.1609-1624.
[48] Yu, C.-H. A Review of CO2 Capture by Absorption and Adsorption. Aerosol and Air Quality Research 2012.
[49] Leung, D. Y. C., et al. An overview of current status of carbon dioxide capture and storage technologies. Renewable and Sustainable Energy Reviews 2014; 39: pp.426-443.
[50] Boundary Dam Carbon Capture Project. https://www.saskpower.com/our-power-future/infrastructure-projects/carbon-capture-and-storage/boundary-dam-carbon-capture-project. Last accessed 02.09.2019.
[51] (DOE), D. o. E. Petra Nova - W.A. Parish Project, Office of Fossil Energy. https://www.energy.gov/fe/petra-nova-wa-parish-project. Last accessed 03.09.2019.

References
222
[52] Power, R. CO2 Scrubbing - Ultra-modern climate protection for coal-fired power plants.
[53] Radgen, P., et al. Lessons Learned from the Operation of a 70 Tonne per Day Post Combustion Pilot Plant at the Coal Fired Power Plant in Wilhelmshaven, Germany. Energy Procedia 2014; 63: pp.1585-1594.
[54] Projects, F. E.ON Kraftwerke Carbon Capture Technology Demonstration Plant. https://www.fluor.com/projects/carbon-capture-plant-design-build. Last accessed 02.09.2019.
[55] MIT. Wilhelmshaven Station Fact Sheet: Carbon Dioxide Capture and Storage Project. https://sequestration.mit.edu/tools/projects/wilhelmshaven.html. Last accessed 02.09.2019.
[56] Luis, P., et al. Recent developments in membrane-based technologies for CO2 capture. Progress in Energy and Combustion Science 2012; 38: pp.419-448.
[57] Santos, S. Overview of the Current State and Development of CO2 Capture Technologies in the Ironmaking Process International Energy Agency (IEA): Paris, Frane, 2013.
[58] Ho, M. T., et al. Comparison of CO2 capture economics for iron and steel mills. International Journal of Greenhouse Gas Control 2013; 19: pp.145-159.
[59] Chung, W., et al. Design and evaluation of CO2 capture plants for the steelmaking industry by means of amine scrubbing and membrane separation. International Journal of Greenhouse Gas Control 2018; 74: pp.259-270.
[60] Pérez-Fortes, M., et al. CO2 Capture and Utilization in Cement and Iron and Steel Industries. Energy Procedia 2014; 63: pp.6534-6543.
[61] Perrin, N., et al. Oxycombustion for Carbon Capture on Coal Power Plants and Industrial Processes: Advantages, Innovative Solutions and Key Projects. Energy Procedia 2013; 37: pp.1389-1404.
[62] Nuber, D., et al. Circored fine ore direct reduction - The future of modern electric steelmaking. Millennium Steel 2006 2006; 126: pp.47-51.
[63] Roger, B. R. Process for separating acidic gases. 1930.
[64] Booras, G. S.; Smelser, S. C. An engineering and economic evaluation of CO2 removal from fossil-fuel-fired power plants. Energy 1991; 16: pp.1295-1305.
[65] Lucquiaud, M.; Gibbins, J. Retrofitting CO2 capture ready fossil plants with post-combustion capture. Part 1: Requirements for supercritical pulverized coal plants using solvent-based flue gas scrubbing. Proceedings of the Institution of Mechanical Engineers, Part A: Journal of Power and Energy 2009; 223: pp.213-226.
[66] Oexmann, J. Post-Combustion CO2 Capture: Energetic Evaluation of Chemical Absorption Processes in Coal-Fired Steam Power Plants. Ph.D. thesis, Technischen Universität Hamburg Harburg, 2011.
[67] MacDowell, N., et al. An overview of CO2 capture technologies. Energy & Environmental Science 2010; 3: pp.1645-1669.

References
223
[68] Lv, B., et al. Mechanisms of CO2 Capture into Monoethanolamine Solution with Different CO2 Loading during the Absorption/Desorption Processes. Environmental Science & Technology 2015; 49: pp.10728-10735.
[69] Caplow, M. Kinetics of carbamate formation and breakdown. Journal of the American Chemical Society 1968; 90: pp.6795-6803.
[70] Blauwhoff, P. M. M., et al. A study on the reaction between CO2 and alkanolamines in aqueous solutions. Chemical Engineering Science 1984; 39: pp.207-225.
[71] Jou, F.-Y., et al. The solubility of CO2 in a 30 mass percent monoethanolamine solution. The Canadian Journal of Chemical Engineering 1995; 73: pp.140-147.
[72] Aspentech. Rate-Based Model of the CO2 Capture Process by MEA using Aspen Plus. Aspen Technology, I.
[73] Abu-Zahra, M. R. M., et al. Experimental verification of Equilibrium-Stage and Rate-Based Simulations. International Journal of Enhanced Research in Science Technology & Engineering Dec. 2012; 1.
[74] Peng, J., et al. A Comparison of Steady-State Equilibrium and Rate-Based Models for Packed Reactive Distillation Columns. Industrial & Engineering Chemistry Research 2002; 41: pp.2735-2744.
[75] Zhang, Y., et al. Rate-Based Process Modeling Study of CO2 Capture with Aqueous Monoethanolamine Solution. Industrial & Engineering Chemistry Research 2009; 48: pp.9233-9246.
[76] Morsi, B. I.; Basha, O. M. Mass Transfer in Multiphase Systems. 2015.
[77] Lewis, W. K.; Whitman, W. G. Principles of Gas Absorption. Industrial and Engineering Chemistry 1924; 16: pp.1215-1220.
[78] Asprion, N. Nonequilibrium Rate-Based Simulation of Reactive Systems: Simulation Model, Heat Transfer, and Influence of Film Discretization. Industrial & Engineering Chemistry Research 2006; 45: pp.2054-2069.
[79] Kaufmann, R. S., Fick's law. In Geochemistry, Springer Netherlands: Dordrecht, 1998; pp 245-246.
[80] Otto, A. Chemische Absorption von CO2 aus fossil befeuerten kraftwerken mittels Monoethanolamin. Universitaet zu Koeln, 2011.
[81] Oexmann, J., et al. Post-combustion CO2 capture: chemical absorption processes in coal-fired steam power plants. Greenhouse Gases: Science and Technology 2012; 2: pp.80-98.
[82] Abu-Zahra, M. R. M., et al. CO2 capture from power plants: Part I. A parametric study of the technical performance based on monoethanolamine. International Journal of Greenhouse Gas Control 2007; 1: pp.37-46.
[83] Chowdhury, M. H. M. Simulation, Design and Optimization of Membrane Gas Separation, Chemical Absorption and Hybrid Processes for CO2 Capture. UWSpace, 2012.
[84] Luis, P. Use of monoethanolamine (MEA) for CO2 capture in a global scenario: Consequences and alternatives. Desalination 2016; 380: pp.93-99.
References
224
[85] Dugas, R. E. Carbon Dioxide Absorption, Desorption, and Diffusion in Aqueous Piperazine and Monoethanolamine. The University of Texas at Austin, Austin,Texas, USA, 2009.
[86] Fisher, K. S., et al. Advanced Amine Solvent Formulations and Process Integration for Near-Term CO2 Capture Success Department of Energy/National Energy Technology Center: 2007.
[87] Nwaoha, C., et al. Heat duty, heat of absorption, sensible heat and heat of vaporization of 2–Amino–2–Methyl–1–Propanol (AMP), Piperazine (PZ) and Monoethanolamine (MEA) tri–solvent blend for carbon dioxide (CO2) capture. Chemical Engineering Science 2017; 170: pp.26-35.
[88] Husebye, J., et al. Techno Economic Evaluation of Amine based CO2 Capture: Impact of CO2 Concentration and Steam Supply. Energy Procedia 2012; 23: pp.381-390.
[89] Le Moullec, Y., et al. Process modifications for solvent-based post-combustion CO2 capture. International Journal of Greenhouse Gas Control 2014; 31: pp.96-112.
[90] IEAGHG. Retrofitting CO2 Capture to Existing Power Plants. 2011.
[91] Singh, D., et al. Techno-economic study of CO2 capture from an existing coal-fired power plant: MEA scrubbing vs. O2/CO2 recycle combustion. Energy Conversion and Management 2003; 44: pp.3073-3091.
[92] Oyenekan, B. A.; Rochelle, G. T. Energy Performance of Stripper Configurations for CO2 Capture by Aqueous Amines. Industrial & Engineering Chemistry Research 2006; 45: pp.2457-2464.
[93] Lucquiaud, M.; Gibbins, J. On the integration of CO2 capture with coal-fired power plants: A methodology to assess and optimise solvent-based post-combustion capture systems. Chemical Engineering Research and Design 2011; 89: pp.1553-1571.
[94] Pfaff, I., et al. Optimised integration of post-combustion CO2 capture process in greenfield power plants. Energy 2010; 35: pp.4030-4041.
[95] IEAGHG. Improvement in Power Generation with Post-Combustion Capture of CO2. 2004.
[96] Romeo, L. M., et al. Designing a supercritical steam cycle to integrate the energy requirements of CO2 amine scrubbing. International Journal of Greenhouse Gas Control 2008; 2: pp.563-570.
[97] Alie, C. F. CO2 Capture With MEA: Integrating the Absorption Process and Steam Cycle of an Existing Coal-Fired Power Plant. Ph.D. thesis, University of Waterloo, 2004.
[98] Gibbins, J. R.; Crane, R. I. Scope for reductions in the cost of CO2 capture using flue gas scrubbing with amine solvents. Proceedings of the Institution of Mechanical Engineers, Part A: Journal of Power and Energy 2004; 218: pp.231-239.
[99] Stankewitz, C.; Fahlenkamp, H. Integration of a subsequent CO2 scrubbing in the coal-fired power plant process. Energy Procedia 2011; 4: pp.1395-1402.
[100] Cifre, P. G., et al. Integration of a chemical process model in a power plant modelling tool for the simulation of an amine based CO2 scrubber. Fuel 2009; 88: pp.2481-2488.

References
225
[101] Sanpasertparnich, T., et al. Integration of post-combustion capture and storage into a pulverized coal-fired power plant. International Journal of Greenhouse Gas Control 2010; 4: pp.499-510.
[102] Romeo, L. M., et al. Integration of power plant and amine scrubbing to reduce CO2 capture costs. Applied Thermal Engineering 2008; 28: pp.1039-1046.
[103] Hanak, D. P., et al. Heat integration and exergy analysis for a supercritical high-ash coal-fired power plant integrated with a post-combustion carbon capture process. Fuel 2014; 134: pp.126-139.
[104] Harkin, T., et al. Reducing the energy penalty of CO2 capture and compression using pinch analysis. Journal of Cleaner Production 2010; 18: pp.857-866.
[105] Leng, W., et al. Pinch Analysis for Integration of Coal-fired Power Plants with Carbon Capture. 2010.
[106] Rubin, E. S., et al. Cost and performance of fossil fuel power plants with CO2 capture and storage. Energy Policy 2007; 35: pp.4444-4454.
[107] Rubin, E. S., et al. The cost of CO2 capture and storage. International Journal of Greenhouse Gas Control 2015; 40: pp.378-400.
[108] Roeder, V.; Kather, A. Part Load Behaviour of Power Plants with a Retrofitted Post-combustion CO2 Capture Process. Energy Procedia 2014; 51: pp.207-216.
[109] Abu-Zahra, M. R. M., et al. CO2 capture from power plants: Part II. A parametric study of the economical performance based on mono-ethanolamine. International Journal of Greenhouse Gas Control 2007; 1: pp.135-142.
[110] NZEC. Carbon Dioxide Capture from Coal-Fired Power Plants in China. Summary Report for NZEC Work Package 3. 2009.
[111] Dave, N., et al. Post-combustion capture of CO2 from coal-fired power plants in China and Australia: An experience based cost comparison. Energy Procedia 2011; 4: pp.1869-1877.
[112] Finkenrath, M. Cost and Performance of Carbon Dioxide Capture from Power Genenration. International Energy Agency: 2011.
[113] Li, K., et al. Systematic study of aqueous monoethanolamine (MEA)-based CO2 capture process: Techno-economic assessment of the MEA process and its improvements. Applied Energy 2016; 165: pp.648-659.
[114] Tsupari, E., et al. Post-combustion capture of CO2 at an integrated steel mill – Part II: Economic feasibility. International Journal of Greenhouse Gas Control 2013; 16: pp.278-286.
[115] Ho, M.; Wiley, D., Liquid absorbent-based post-combustion CO2 capture in industrial processes. In Absorption-Based Post-combustion Capture of Carbon Dioxide, Elsevier: 2016; pp 711-756.
[116] IEAGHG. Iron and steel CCS study (Techno-economics integrated steel mill). 2013.
[117] Luhr, S. Konzeption von Membranmodulen zur effizienten Abtrennung von Kohlendioxid aus Gasgemischen. Ph.D. thesis, RWTH Aachen, 2016.

References
226
[118] Hägg, M.-B., Membranes in Gas Separation. In Handbook of Membrane Separations, CRC Press: 2008; pp 65-106.
[119] Alexander Stern, S. Polymers for gas separations: the next decade. Journal of Membrane Science 1994; 94: pp.1-65.
[120] Blume, I. H., NL), Pinnau, Ingo (Austin, TX) Composite membrane, method of preparation and use. 1990.
[121] Yave, W., et al. Nanostructured membrane material designed for carbon dioxide separation. Journal of Membrane Science 2010; 350: pp.124-129.
[122] Hussain, A.; Hägg, M.-B. A feasibility study of CO2 capture from flue gas by a facilitated transport membrane. Journal of Membrane Science 2010; 359: pp.140-148.
[123] Ramasubramanian, K.; Ho, W. S. W. Recent developments on membranes for post-combustion carbon capture. Current Opinion in Chemical Engineering 2011; 1: pp.47-54.
[124] Robeson, L. M. The upper bound revisited. Journal of Membrane Science 2008; 320: pp.390-400.
[125] Franz, J., et al. Investigating the influence of sweep gas on CO2/N2 membranes for post-combustion capture. International Journal of Greenhouse Gas Control 2013; 13: pp.180-190.
[126] Zhao, L., et al. Comparative Investigation of Polymer Membranes for Post-combustion Capture. Energy Procedia 2013; 37: pp.1125-1134.
[127] Torsten Brinkmanna, et al., Post-combustion processes employing polymeric membranes. In International Conference on Energy Process Engineering Efficient Carbon Capture for Coal Power Plants, Proceeding: Frankfurt/Main, Germany, June 20-22, 2011.
[128] Zhao, L., et al. Cascaded Membrane Processes for Post-Combustion CO2 Capture. http://processnet.org/processnet_media/11_00h_Zhao-p-1722.pdf. Last accessed 2019.02.11.
[129] Microdyn Nadir. http://www.microdyn-nadir.com/fileadmin/user_upload/downloads/catalogue.pdf. Last accessed 07.09.2016.
[130] Esposito, E., et al. Pebax®/PAN hollow fiber membranes for CO2/CH4 separation. Chemical Engineering and Processing: Process Intensification 2015; 94: pp.53-61.
[131] Borsig membrane technology. Membrane technology for processes and environment.
[132] Mulder, M., Basic Principles of Membrane Technology. 2nd ed.; Kluwer Academic: 1996.
[133] Zhao, L., et al. A parametric study of CO2/N2 gas separation membrane processes for post-combustion capture. Journal of Membrane Science 2008; 325: pp.284-294.
[134] Ho, M. T., et al. Reducing the Cost of CO2 Capture from Flue Gases Using Membrane Technology. Industrial & Engineering Chemistry Research 2008; 47: pp.1562-1568.
[135] Haiqing Lin, T. M., Richard Baker, The Membrane Solution to Global Warming. In Sixth Annual Conference on Carbon Capture & Sequestration, Pittsburgh, PA, 2007.
References
227
[136] Casale, D. Developing a multi-stage membrane system for CO2 separation in postcombustion process. Master's thesis, 2011.
[137] Baker, R. W., et al. Gas separation process using membranes with permeate sweep to remove CO2 from combustion gases. PCT/US2009/002874, 2011.
[138] Zhao, L., et al. Cascaded Membrane Processes for Post-Combustion CO2 Capture. Chemical Engineering & Technology 2012; 35: pp.489-496.
[139] Zhai, H.; Rubin, E. S. Techno-economic assessment of polymer membrane systems for postcombustion carbon capture at coal-fired power plants. Environ Sci Technol 2013; 47: pp.3006-3014.
[140] Maas, P., et al. Energetic and economic evaluation of membrane-based carbon capture routes for power plant processes. International Journal of Greenhouse Gas Control 2016; 44: pp.124-139.
[141] Roussanaly, S., et al. Membrane properties required for post-combustion CO2 capture at coal-fired power plants. Journal of Membrane Science 2016; 511: pp.250-264.
[142] NETL. IECM Technical Documentation: Membrane-based CO2 Capture Systems for Coal-fired Power Plants. 2012.
[143] Hägg, M.-B., Gas Permeation Unit (GPU). In Encyclopedia of Membranes, Drioli, E.; Giorno, L., Eds. Springer Berlin Heidelberg: Berlin, Heidelberg, 2016; pp 849-849.
[144] Lie, J. A., et al. Optimization of a membrane process for CO2 capture in the steelmaking industry. International Journal of Greenhouse Gas Control 2007; 1: pp.309-317.
[145] Freeman, B., et al. Hybrid Membrane-absorption CO2 Capture Process. Energy Procedia 2014; 63: pp.605-613.
[146] NETL. Bench-Scale Development of a Hybrid Membrane-Absorption CO2 Capture Process. https://www.netl.doe.gov/File%20Library/Unassigned/FE0013118.pdf. Last accessed 19.09.2016.
[147] University of Kentucky. A Solvent/Membrane Hybrid Post-combustion CO2 Capture Process for Existing Coal-Fired Power Plants. http://www.caer.uky.edu/factsheets/completed-projects/Power_Liu_LiquidMembrane11-26-08_3-9-09.pdf. Last accessed 19.09.2016.
[148] Scholes, C. A., et al. Cost competitive membrane—cryogenic post-combustion carbon capture. International Journal of Greenhouse Gas Control 2013; 17: pp.341-348.
[149] Zhao, L., et al. Investigation of a hybrid system for post-combustion capture. Energy Procedia 2014; 63: pp.1756-1772.
[150] Belaissaoui, B., et al. Hybrid membrane cryogenic process for post-combustion CO2 capture. Journal of Membrane Science 2012; 415–416: pp.424-434.
[151] S.Rubin;, E.; B.Rao, A. A technical, economic and environmental assessment of amine-based CO2 capture technology for power plant greenhouse gas technology. Report 2002. Carnegie Mellon University. Carnegie Mellon University: Pittsburgh, 2002.
[152] Rubin, E. S., et al. A proposed methodology for CO2 capture and storage cost estimates. International Journal of Greenhouse Gas Control 2013; 17: pp.488-503.

References
228
[153] Rubin, E. S. Understanding the pitfalls of CCS cost estimates. International Journal of Greenhouse Gas Control 2012; 10: pp.181-190.
[154] Rubin, E. S.; Zhai, H. The Cost of Carbon Capture and Storage for Natural Gas Combined Cycle Power Plants. Environmental Science & Technology 2012; 46: pp.3076-3084.
[155] Rao, A. B., et al. Evaluation of potential cost reductions from improved amine-based CO2 capture systems. Energy Policy 2006; 34: pp.3765-3772.
[156] Zhai, H.; Rubin, E. S. The Effects of Membrane-based CO2 Capture System on Pulverized Coal Power Plant Performance and Cost. Energy Procedia 2013; 37: pp.1117-1124.
[157] Rao, A. B.; Rubin, E. S. Identifying Cost-Effective CO2 Control Levels for Amine-Based CO2 Capture Systems. Industrial & Engineering Chemistry Research 2006; 45: pp.2421-2429.
[158] Chou, V., et al. Eliminating the Derate of Carbon Capture Retrofits. DOE/NETL: United States, 2016-05-31, 2016.
[159] CAESAR, P. D 4.9 European best practice guidelines for assessment of CO2 capture technologies. 2011.
[160] Anantharaman, R., Berstad, David, Cinti, Giovanni, De Lena, Edoardo, Gatti, Manuele, Hoppe, Helmut, Voldsund, Mari. . CEMCAP framework for comparative techno-economic analysis of CO2 capture from cement plants - D3.2 (Version Revision 2). Zenodo, 2018.
[161] IEAGHG. Toward a common method of cost estimation for CO2 capture and storage at fossil fuel power plats. 2013.
[162] Austgen, D. M., et al. Model of vapor-liquid equilibria for aqueous acid gas-alkanolamine systems using the electrolyte-NRTL equation. Industrial & Engineering Chemistry Research 1989; 28: pp.1060-1073.
[163] H. HIKITA, et al. The Kinetics of Reactions of Carbon Dioxide with Monoethanolamine, Diethanolamine and Triethanolamine by a Rapid Mixing Method Chemical Engineering Journal 1977; 13: pp.7-12.
[164] Onda, K., et al. MASS TRANSFER COEFFICIENTS BETWEEN GAS AND LIQUID PHASES IN PACKED COLUMNS. Journal of Chemical Engineering of Japan 1968; 1: pp.56-62.
[165] Stichlmair, J., et al. General model for prediction of pressure drop and capacity of countercurrent gas/liquid packed columns. Gas Separation & Purification 1989; 3: pp.19-28.
[166] L. Bravo, J., et al., Mass Transfer in Gauze Packing. 1985; Vol. 64, p 91-95.
[167] Newman, S. A., et al., Thermodynamics of Aqueous Systems with Industrial Applications. AMERICAN CHEMICAL SOCIETY: 1980; Vol. 133, p 788.
[168] Edwards, T. J., et al. Vapor-liquid equilibria in multicomponent aqueous solutions of volatile weak electrolytes. AIChE Journal 1978; 24: pp.966-976.

References
229
[169] G Bates, R.; D Pinching, G., Acidic Dissociation Constant and Related Thermodynamic Quantities for Monoethanolammonium Ion in Water From 0 to 50 oC. 1960; Vol. 64A.
[170] Pinsent, B. R. W., et al. The kinetics of combination of carbon dioxide with hydroxide ions. Transactions of the Faraday Society 1956; 52: pp.1512-1520.
[171] Yave, W., et al. Design, synthesis, characterization and optimization of PTT-b-PEO copolymers: A new membrane material for CO2 separation. Journal of Membrane Science 2010; 362: pp.407-416.
[172] Yave, W., et al. CO2-Philic Polymer Membrane with Extremely High Separation Performance. Macromolecules 2010; 43: pp.326-333.
[173] Group, A. E. W. Building Capacity for CO2 Capture and Storage in the APEC Region - A Training manual for policy makers and practioners. 2009.
[174] Peters, M. S.; Timmerhaus, K. D., Plant Design and Economics for Chemical Engineers. Fourth Edition ed.; McGraw-Hill: 1991.
[175] Engineering, C. CEPCI Updates: January 2018 (prelim.) and December 2017 (final). http://www.chemengonline.com/cepci-updates-january-2018-prelim-and-december-2017-final. Last accessed 2019.03.14.
[176] Smith, R., Chemical Process Design and Integration. 2nd ed.; John Wiley & Sons Ltd: 2005.
[177] Towler, G.; Sinnott, R. K., Chemical Engineering Design: Principles, Practice and Economics of Plant and Process Design. Elsevier Science & Technology: 2012.
[178] Turton, R., et al., Analysis, Synthesis, and Design of Chemical Processes. Third Edition ed.; PRETICE HALL: 2008.
[179] Van Der Sluijs, J. P., et al. Feasibility of polymer membranes for carbon dioxide recovery from flue gases. Energy Conversion and Management 1992; 33: pp.429-436.
[180] IEAGHG. Assessment of Emerging CO2 Capture Technologies and Their Potential to Reduce Costs. 2014.
[181] IEAGHG. Post Combustion CO2 Capture Scale-up Study. 2013.
[182] OFX. www.ofx.com/en-au/forex-news/historical-exchange-rates/yearly-average-rates/. Last accessed 28.08.2019.
[183] IEA. Outlook for Natural Gas - Excerpt from World Energy Outlook 2017. 2018.
[184] BMWi. Industriestrompreiskomponenten. https://www.bmwi.de/Redaktion/DE/Infografiken/Alt/industrie-energieintensive-industrien-strompreise.html. Last accessed 2018.05.24.
[185] Reddy, S., et al., Fluor’s Econamine FG PlusSM Technology For CO2 Capture at Coal-fired Power Plants. In Power Plant Air Pollutant Control "Mega" Symposium, Baltimore, 2008.
[186] International, A. COST ESTIMATE CLASSIFICATION SYSTEM – AS APPLIED IN ENGINEERING, PROCUREMENT, AND CONSTRUCTION FOR THE PROCESS INDUSTRIES. 2016.

References
230
[187] Konzeptstudie Referenzkraftwerk Nordrhein-Westfalen (RKW NRW). VGB Power Teche.V: Essen, Germany, 2004.
[188] Stodola, A. A., Steam and gas turbines : with a supplement on The prospects of thermal prime mover. McGraw-Hill book company, inc: 1927.
[189] Kemp, I. C., Pinch Analysis and Process Integration : A User Guide on Process Integration for the Efficient Use of Energy. Ed.: 2nd ed. Oxford : Butterworth-Heinemann. 2007: 2007.
[190] Friebe, M. Ökonomische Untersuchung eines membranbasierten Oxyfuel Prozesses. Bachelor thesis, RWTH Aachen, 2012.
[191] BAFA. Drittlandskohlepreis. http://www.bafa.de/DE/Energie/Rohstoffe/Drittlandskohlepreis/drittlandskohlepreis_node.html. Last accessed 2019.01.18.
[192] Umweltbundesamt. Strom- und Wärmeversorgung in Zahlen. https://www.umweltbundesamt.de/themen/klima-energie/energieversorgung/strom-waermeversorgung-in-zahlen?sprungmarke=Strommix#Kraftwerke. Last accessed 11.06.2019.
[193] Hilliard, M. D. A predictive thermodynamic model for an aqueous blend of potassium carbonate, piperazine, and monoethanolamine for carbon dioxide capture from flue gas. Ph.D. thesis, University of Texas, Austin, TX, USA, 2008.
[194] Weiland, R. H., et al. Heat Capacity of Aqueous Monoethanolamine, Diethanolamine, N-Methyldiethanolamine, and N-Methyldiethanolamine-Based Blends with Carbon Dioxide. Journal of Chemical & Engineering Data 1997; 42: pp.1004-1006.

Schriften des Forschungszentrums Jülich Reihe Energie & Umwelt / Energy & Environment
Band / Volume 520 Characterization of Root System Architectures from Field Root Sampling Methods S. Morandage (2020), xxii, 157 pp ISBN: 978-3-95806-511-6 Band / Volume 521 Generation Lulls from the Future Potential of Wind and Solar Energy in Europe D. S. Ryberg (2020), xxvii, 398 pp ISBN: 978-3-95806-513-0 Band / Volume 522 Towards a Generalized Framework for the Analysis of Solar Cell Performance based on the Principle of Detailed Balance B. J. Blank (2020), iv, 142 pp ISBN: 978-3-95806-514-7 Band / Volume 523 A Robust Design of a Renewable European Energy System Encompassing a Hydrogen Infrastructure D. G. Çağlayan (2020), xxii, 312 pp ISBN: 978-3-95806-516-1 Band / Volume 524 Control and Optimization of a Lorentz Force Based Actuator System for External Flow M. F. Seidler (2020), xii, 136 pp ISBN: 978-3-95806-518-5 Band / Volume 525 ETV Online Tagung 2020 Industrielle Groß- und Hochtemperaturwärmepumpen im Energiesystem D. Stolten, G. Markowz (Hrsg.) (2020), ca. 71 pp ISBN: 978-3-95806-519-2 Band / Volume 526 Atmospheric Trace Gas Measurements Using Chemical Ionisation Time-of-Flight Mass Spectrometry Y. Li (2020), xi, 110 pp ISBN: 978-3-95806-520-8 Band / Volume 527 Uranium accumulation in agricultural soils as derived from long-term phosphorus fertilizer applications Y. Sun (2020), XII, 136 pp ISBN: 978-3-95806-521-5

Schriften des Forschungszentrums Jülich Reihe Energie & Umwelt / Energy & Environment
Band / Volume 528 Entwicklung von Schutzschichten für nicht-oxidische Faserverbundwerkstoffe M. Wolf (2021), VI, 150, 2 pp ISBN: 978-3-95806-524-6 Band / Volume 529 Mechanical reliability and oxygen permeation of Ce0.8Gd0.2O2-δ-FeCo2O4 dual phase membranes F. Zeng (2021), IV, VI, 222 pp ISBN: 978-3-95806-527-7 Band / Volume 530 Capacitance-Based Methods to Study Charge Transport and Recombination in Organic Solar Cells I. Zonno (2021), vi, 153 pp ISBN: 978-3-95806-528-4 Band / Volume 531 Einflüsse von Klimavariabilität und -wandel auf Ausbau und Erzeugung im Europäischen Stromsystem F. P. Gotzens (2021), XXIII, 231 pp ISBN: 978-3-95806-530-7 Band / Volume 532 Weltweite Infrastruktur zur Wasserstoffbereitstellung auf Basis erneuerbarer Energien P.-M. Heuser (2021), VII, 231 pp ISBN: 978-3-95806-531-4 Band / Volume 533 Mechanische Eigenschaften von katalysatorbeschichteten Membranen für die Polymer-Elektrolyt-Membran Elektrolyse E. Borgardt (2021), viii, 181 pp ISBN: 978-3-95806-533-8 Band / Volume 534 Techno-economic Assessment of Hybrid Post-combustion Carbon Capture Systems in Coal-fired Power Plants and Steel Plants Y. Wang (2021), IV, xx, 230 pp ISBN: 978-3-95806-545-1
Weitere Schriften des Verlags im Forschungszentrum Jülich unter http://wwwzb1.fz-juelich.de/verlagextern1/index.asp


Energie & Umwelt / Energy & EnvironmentBand / Volume 534ISBN 978-3-95806-545-1
Energie & Umwelt / Energy & EnvironmentBand / Volume 534ISBN 978-3-95806-545-1
Techno-economic Assessment of Hybrid Post-combustion Carbon Capture Systems in Coal-fired Power Plants and Steel PlantsYuan Wang
534
Ener
gie
& Um
wel
tEn
ergy
& E
nvir
onm
ent
Tech
no-e
cono
mic
Ass
essm
ent o
f Hyb
rid P
ost-
com
bust
ion
Car
bon
C
aptu
re S
yste
ms
in C
oal-
fired
Pow
er P
lant
s an
d St
eel P
lant
sYu
an W
ang