5.5 a comparison of model produced maximum and …
TRANSCRIPT

5.5 A COMPARISON OF MODEL PRODUCED MAXIMUM AND MINIMUM TEMPERATURE TRENDS WITH OBSERVED TRENDS FOR THE 20TH AND 21ST CENTURIES
David R. Easterling, Byron Gleason, and Russell S. Vose
NOAA National Climatic Data Center, Asheville, NC
Ronald J. Stouffer NOAA Geophysical Fluid Dynamics Laboratory, Princeton, NJ
1. INTRODUCTION The globally averaged annual temperature has increased approximately 0.7oC over the 20th century, and research has shown that most of this increase is due to a greater increase in daily minimum temperatures than in daily maximum temperatures, resulting in a decrease in the diurnal temperature range (Easterling et al. 1997, Vose et al. 2005). As global climate models have improved in their ability to simulate the observed changes in globally averaged annual temperatures over the 20th century, one question is how well these models simulate observed changes in maximum and minimum temperatures and the diurnal temperature range (max/min/DTR) for the same period. This paper examines simulated changes in maximum and minimum temperatures for the 20th century using estimates of many of the observed radiative forcing changes, natural and human and compares these temperature changes to observed changes from Vose et al. (2005). Additionally simulated changes in max/min/DTR for the 21st century are also examined for two forcing scenarios, the A2 and B1 scenarios from the Intergovernmental Panel on Climate Change (IPCC) Fourth Assessment Report (AR4). Lastly, a number of specific locations are chosen to examine the model produced diurnal cycle of temperature compared to the observed diurnal cycle for each four-month season (DJF, MAM, JJA, SON).
Trend values for the model simulations were calculated using the Kendall-Theil (K-T, Kendall 1975, Theil 1950) median of all pairwise slopes non-parametric slope estimator. The K-T method has the advantages of being free of assumptions of any distribution and is a slope estimate that is robust to outliers. * Corresponding author address: David R. Easterling, NOAA National Climatic Data Center, 151 Patton Avenue, Asheville, NC 28801; e-mail: [email protected].
2. MODEL SIMULATIONS The model simulations used in this study are from the Geophysical Fluid Dynamics Laboratory (GFDL) Climate Model 2.1 (CM2.1) produced for the IPCC AR4. Three simulations are examined: 1) 20th century observed forcing; 2) the Special Report on Emissions Scenarios (SRES) A2 (high equivalent CO2 increase in the 21st century); and 3) SRES B1 (increase to approximately 800 ppmv equivalent CO2 by the end of the 21st century). The CO2 increase and aerosol changes for both the A2 and B1 scenarios are shown in Figures 1 and 2. 3. OBSERVED CHANGES IN MAXIMUM AND
MINIMUM TEMPERATURE AND THE DTR The results shown in Figures 3 and 4 are from Vose et al. (2005) and show that the observed change in max/min/DTR for the 1950-2004 period is comparable to previous work (Easterling et al. 1997) where the globally averaged minimum continues to increase at a faster rate than the maximum temperature resulting in a decrease in the DTR. The trend in the global maximum temperature is approximately 1 .4oC/Century and the minimum temperature has a trend of 2.0oC/Century with a DTR trend of 0.6oC/Century (see Table 1) over the last half of the 20th century. 4. SIMULATED CHANGES FOR THE 20TH
CENTURY
The globally averaged temperature for the model simulated climate of the 20th century (not shown) shows a good correspondence with the shape of the observed global temperature curve (not shown), with the increase in the first part of the 20th century, then slight decrease in the middle part, and rapid increase in the last third. The globally averaged time series for the maximum and minimum temperature and DTR from the model simulation for the period 1950-2000 (20C3M, in Figure 5), roughly coincides with the analysis by

Vose et al. (2005). The trend for the maximum and minimum temperatures and the DTR for each model simulation and those from the observed record are shown in Table 1. Comparison of the observed record results with the simulation for the second half of the 20th century shows that, although the model simulation shows more warming in the minimum temperature than maximum resulting in a decrease in the DTR, the model shows much less change (about a factor of 5 smaller) in each of these three values than has been observed. Furthermore, for the seasonal results, the observed record shows the greatest changes in the DJF season followed by the MAM, JJA, then SON seasons. But the model shows the largest changes in temperature the MAM season, then the SON season, with the DJF being third. 5. SIMULATED 21ST CENTURY CHANGES
Model results from two forcing scenarios (A2 and B1) are shown in Figures 5 and 6. The results for the B1 scenario show the globally averaged minimum temperature increases at a slightly greater rate than the maximum temperature with the minimum increasing about 1.5oC and the maximum increasing about 1.3oC by 2100. The DTR shows an initial decrease in the early part of the 21st century, but by about 2035 the DTR appears to level out with no real trend through the end of the century. Maps of the trends show that both the annual maximum and annual minimum show the greatest warming at the high latitudes of the Northern Hemisphere (NH) and no land areas show any cooling. However, both the maximum and minimum show some ocean areas with cooling, including the northern Atlantic, just south of Greenland, and oceanic areas just north of Antarctica. The map of trends for the DTR show most areas with decreases, but some continental areas show very strong increases (e.g. interior South America, South Africa, middle East and Australia).
The results for the A2 (high CO2 increase) scenario show much stronger warming than the B1 scenario in both the globally averaged maximum and minimum temperature by 2100. The increase in minimum temperature is 3.47oC and the increase in the maximum is 3.25oC. The DTR shows a decrease that appears to accelerate in the latter half of the 21st century. The maps of trends show the largest increases in both maximum and minimum temperature in the high latitudes, but the interiors of all land masses
show strong warming in both. Also, the trend maps show one small area of cooling in the northern Atlantic just south of Greenland. The spatial pattern of changes on the DTR trend map is similar to that for the B1 scenario, but the changes are much stronger for the A2 simulation, most likely due to both the different equivalent CO2 increases and different aerosol concentration changes between the two scenarios. 6. DIURNAL CYCLE OF TEMPERATURE
Figure 7 show examples of the diurnal cycle of temperature for five locations from both the model simulated last decade of the 20th century and observed values from the same period. The model simulation and the observations are from 3-hourly values at 0, 3, 6, 9, 12, 15, 18 and 21 GMT, then both are converted to LST for plotting.
The plot for Fairbanks, AK shows what appears to be a smaller amplitude in the model simulated diurnal cycle than the observed, and the model maximum and minimum are occurring earlier in the day than in the observed. For Sydney, Australia there is also a decreased amplitude from the model, but it appears the maximum and minimum temperatures occur at similar times as the observations. Manila and Buenos Aires, however, show model simulated amplitudes larger than observed, and the model simulated maximum and minimum temperatures occurring earlier in the day compared to observed. Lastly, Chicago shows a pattern similar to Fairbanks and Sydney with a slightly smaller amplitude produced by the model, with the maximum and minimum temperatures occurring earlier in the diurnal cycle than in the observations. 7. SUMMARY AND CONCLUSIONS
Model simulations from the GFDL CM2.1 are used to examine the trends in maximum and minimum temperature and the DTR. Results from the simulation for the latter half of the 20th century compared to the observed record show the model producing less warming in both maximum and minimum temperature and a much smaller decrease in the DTR. Furthermore, seasonal trends for the simulation are largest for the MAM season compared to the DJF season for the observations. The reasons for the model errors are unclear. This model does not parameterize the so-called indirect aerosol effect, which influences the cloud brightness and lifetimes.

Since the increased nighttime warming is thought to be associated with increases in cloudiness, the absence of this forcing in the model runs could help explain the model-observational differences. Furthermore, examining the model produced diurnal cycle of temperature shows what appears to be an offset of maximum and minimum temperatures with both the maximum and minimum occurring earlier in the day than observed for a number of the locations examined. The model produced amplitude of the diurnal cycle for many locations also appears to be damped somewhat when compared to observations.
The two simulations for the 21st century, the A2 (high equivalent CO2 increase) and B1 (increase to approximately doubling by 2100) also show more warming in the minimum temperature compared to the maximum temperature resulting in a continued decrease in the DTR. However, the B1 scenario shows a rate of warming over that 21st century that is less than has been observed for the second half of the 20th century. Furthermore, even the A2 scenario with an approximate quadrupling of equivalent CO2 by 2100 shows warming that is only about 1.75 times greater in the annual minimum than observed. But the A2 does show a much larger rate of warming in the maximum temperature than observed. This relative lack of warming with such a large equivalent CO2 increase is likely due, in part, to the large aerosol forcing increase through most of the 21st century in the A2 scenario. In general, for all three model simulations, the DTR trend is much smaller than the observed trend due to the maximum and minimum temperature trends being much closer than the observed trends. 8. ACKNOWLEDGEMENTS
This work was supported by the U.S. Department of Energy, Office of Biological and Environmental Research under Interagency Agreement DE--AI02-96ER62276 and the NOAA Office of Global Programs, Climate Change Data and Detection Element. 9. REFERENCES Easterling, D.R., B. Horton P.D. Jones, T.C. Peterson, T.R. Karl, M.J. Salinger, D. Parker, V. Razuvayev, N. Plummer, P. Jamason, and C.K. Folland, 1997: Maximum and minimum temperature trends for the globe, Science, V.
277, 364-367. Kendall, M.G., 1975, Rank Correlation Methods, 4th edition: Charles Griffin, London. 202 p. Theil, H., 1950. A rank-invariant method of linear and polynomial regression analysis, 1, 2, and 3: Ned. Akad. Wentsch Proc., 53, 386-392, 521 -525, and 1397-1412. Vose, R.S., D. R. Easterling and B. Gleason, 2005: Maximum and minimum temperature trends for the globe: an update through 2004, Geophys. Res. Letts, in press.

Figure 1: Equivalent atmospheric Co2 concentration for the SRES scenario members.
Figure 2: Annual mean sulfate aerosol burdens for the SRES scenario members.

Figure 3: Time series of observed globally averaged maximum and minimum temperature and diurnal temperature range (DTR) for 1950-2004. From Vose and Easterling (2005).

Figure 4: Observed trends in average annual maximum and minimum temperature and DTR for the 1950-2004 period. From Vose et al. (2005).

Figure 5: Time series of globally averaged maximum and minimum temperature and diurnal temperature range (DTR) for the three model simulations. Calculated from land areas only for comparison with observed patterns. Trend lines (red) are significant at 95% confidence level using the K-T method (I would put the 20th century stuff in the left column).

Figure 6: Trends in average annual maximum and minimum temperature and the DTR from three model simulations from the GFDL CM2.1 for the A2 and B 1 forcing scenarios and observed forcing for the latter half of the 20th century.

Figure 7: Diurnal cycle of surface air temperature for five locations around the world from both observed and model simulated 3 hourly values, both from the last decade of the 20th century.

Figure 7: Continued

Figure 7: Continued.
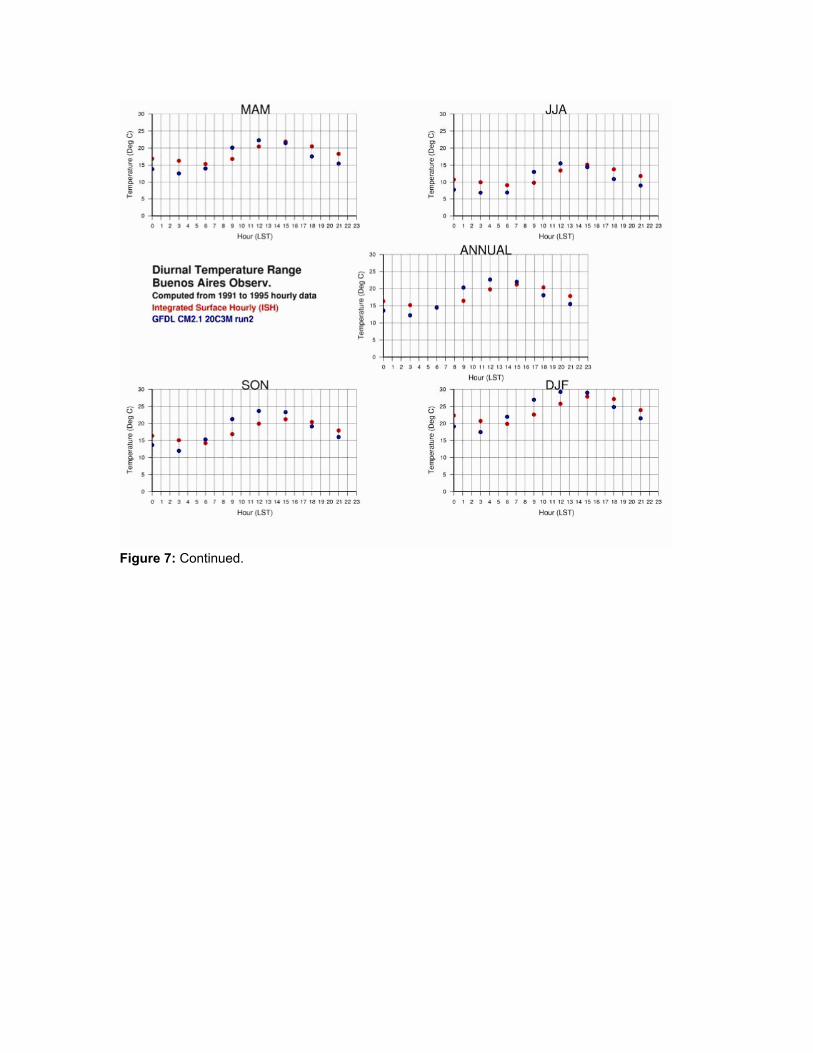
Figure 7: Continued.

Figure 7: Continued.

Table 1: Trends in deg C/century for each 3-month season and Annual for globally averaged maximum and minimum temperature and DTR from each model simulation and observations. All trends except the JJA DTR trend for the B1 scenario (in bold) are statistically significant at the 0.05 level. The 20th century trends are for the 1950-2000 period, the A2 and B1 scenarios are for 2001-2 100. The observed trends are for the 1950-2004 period from Vose et al. (2005). DJF MAM JJA SON Annual A2 Max 3.78 3.12 2.60 3.45 3.25 A2 Min 4.07 3.40 2.74 3.70 3.47 A2 DTR -0.28 -0.21 -0.13 -0.25 -0.22 B1 Max 1.73 1.60 1.16 1.66 1.53 B1 Min 1.85 1.62 1.17 1.76 1.60 B1 DTR -0.10 -0.05 -0.01 -0.11 -0.06 20th Cent. Max 1.11 1.19 0.78 1.22 1.03 20th Cent. Min 1.25 1.36 1.01 1.34 1.20 20th Cent. DTR -0.14 -0.16 -0.19 -0.14 -0.16 Observed Max 1.83 1.69 1.20 0.97 1.41 Observed Min 2.66 2.23 1.61 1.68 2.04 Observed DTR -0.90 -0.56 -0.42 -0.76 -0.66