6. gas turbine performance - engsoft power lab - … · 2015-05-18 · 950.24%. steam turbine -10...
TRANSCRIPT

Combined Cycle Power Plants 6. Gas Turbine Performance 1 / 101
HIoPE
6. Gas Turbine Performance
Condenser
(heat out)
T
s
Topping cycle
Bottoming cycle
Combustion
(heat In)
Stack
(heat
out)

Combined Cycle Power Plants 6. Gas Turbine Performance 2 / 101
HIoPE
The gas turbine is a standardized machine, and can be used under widely different ambient conditions.
Manufacturers quote gas turbine performances at ISO ambient conditions of 15C(59F), 1.013 bar (14.7
psia), and 60% relative humidity.
Gas turbine performance is mainly governed by pressure ratio, turbine inlet temperature, and efficiency of
each parts.
The performance of gas turbine is affected by its inlet and exit conditions. The most important items are
pressure and temperature. Ambient weather conditions are the most obvious changes.
Since the gas turbine is an air-breathing machine, its performance is changed by anything that affects the
density and/or mass flow rate of air intake to the compressor.
A smaller weight of air requires a smaller weight of fuel to mix with, and the mixture then produces less
power when burned.
Most peak power enhancement opportunities exists in the topping cycle.
In general, however, performance enhancements to the gas turbines will carry with them an increase in
bottoming cycle performance due to an associated increase in gas turbine exhaust energy.
Duct firing within HRSG is an exceptional performance enhancement occurred in the bottoming cycle.
Generals

Combined Cycle Power Plants 6. Gas Turbine Performance 3 / 101
HIoPE
Factors to be considered individually
Is there a need for peak power production with
premium paid for the resulting power?
Does peak power demand occur on hot days
(summer peaking) only?
Is there a need to compensate the power
reduction continuously during summer period?
Is frequency support required?
Solutions for power augmentation
Supplementary firing in HRSG
Steam / water injection
GT peak load firing
GT inlet air cooling
Factors Affecting GT Performance
Combined Cycle Power Plants 6. Gas Turbine Performance 4 / 101
HIoPE
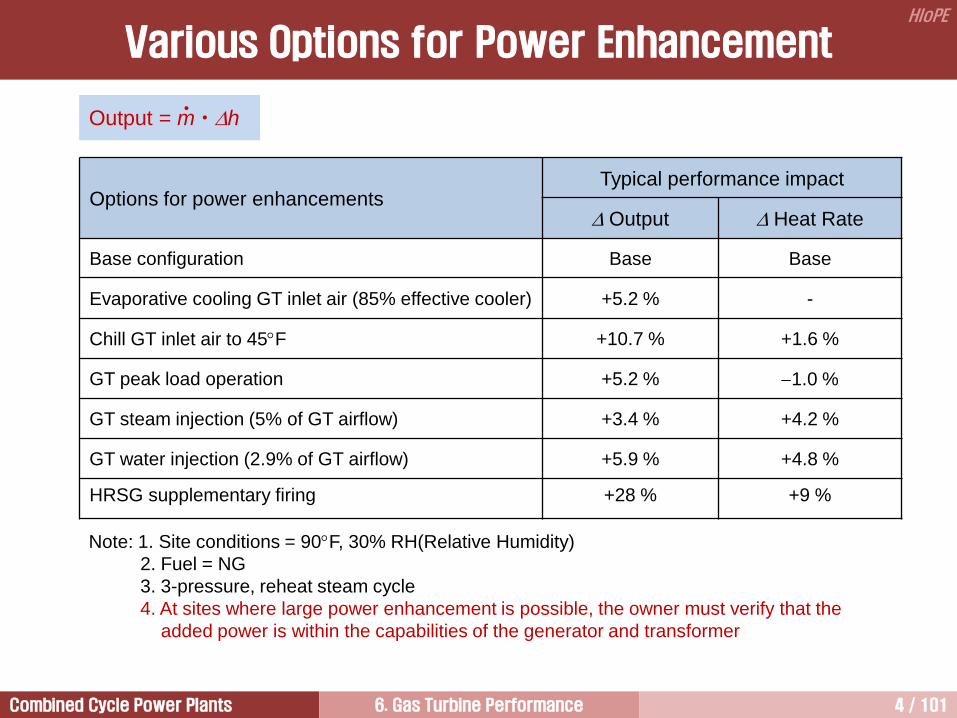
Options for power enhancements Typical performance impact
Output Heat Rate
Base configuration Base Base
Evaporative cooling GT inlet air (85% effective cooler) +5.2 % -
Chill GT inlet air to 45F +10.7 % +1.6 %
GT peak load operation +5.2 % 1.0 %
GT steam injection (5% of GT airflow) +3.4 % +4.2 %
GT water injection (2.9% of GT airflow) +5.9 % +4.8 %
HRSG supplementary firing +28 % +9 %
Note: 1. Site conditions = 90F, 30% RH(Relative Humidity)
2. Fuel = NG
3. 3-pressure, reheat steam cycle
4. At sites where large power enhancement is possible, the owner must verify that the
added power is within the capabilities of the generator and transformer
Output = m h •
Various Options for Power Enhancement

Combined Cycle Power Plants 6. Gas Turbine Performance 5 / 101
HIoPE
Typical Gas Turbine Sensors/Effectors Source: GE

Combined Cycle Power Plants 6. Gas Turbine Performance 6 / 101
HIoPE
1. Ambient Temperature [1/7]
Because gas turbines are constant-
volume-flow engines, they are very
sensitive to changing ambient
temperature and pressure.
The output and thermal efficiency of the
gas turbines decrease as air
temperature increases. This is because
an air density decreases as the ambient
air temperature increases, thus the
mass flow rate of air decreases because
industrial gas turbines running at
constant speed are constant volume
flow machines.
The thermal efficiency decreases as the
air temperature increases. This is
because compressor driving power
increases as the air temperature
increase. In addition, heat transfer
efficiency of the blade cooling system
decreases as the air temperature
increases. Thus, more cooling air is
needed as the air temperature increases.
Perc
ent
desig
n
130
120
110
100
90
80
70 0 20 40 60 80 100 120 F
-18 -7 4 16 27 38 49 C
Compressor inlet temperature

Combined Cycle Power Plants 6. Gas Turbine Performance 7 / 101
HIoPE
The specific power consumed by the compressor increases
proportional to the inlet air temperature (in K) without a
corresponding increase in the turbine output.
The exhaust gas temperature increases as the inlet air
temperature increases because the turbine pressure ratio is
reduced, although the gas turbine inlet temperature remains
constant. This is the main reason for that the gas turbine
output and efficiency decrease while the ambient air
temperature increases.
However, the effect on the performance of the combined cycle
is somewhat less because a higher exhaust gas temperature
improves the performance of the steam cycle.
1
1
1,
CPR
TCw
C
op
C
1. Ambient Temperature [2/7]
T
s
1
2
3
4
1
2
3
4

Combined Cycle Power Plants 6. Gas Turbine Performance 8 / 101
HIoPE
Rela
tive e
ffic
iency,
%
Gas turbine
100
0
Air temperature, C
105
95
10 20 30 40 -10
Based on constant
condenser pressure
Steam turbine
Combined cycle
An increase in the inlet air temperature has a
slightly positive effect on the efficiency of the
combined cycle plant, while other ambient
conditions as well as condenser pressure
remain constant.
Because the increased gas turbine exhaust gas
temperature improves the efficiency of the
steam process, it more than compensates for
the reduced efficiency of the gas turbine unit.
According to the open literature, with each one-
degree temperature increase above 30°C, power
output of the gas turbines drops by 0.50%–
1.02% while efficiency drops by approximately
0.24%. Steam turbine power output and
efficiency are not significantly changed by
changing air temperature, while net CCGT power
output drops by 0.3%–0.6% and net efficiency
drops by approximately 0.01% per degree above
30°C.
Effect on Combined Cycle Efficiency
Source: Kehlhofer et al., 2009
1. Ambient Temperature [3/7]

Combined Cycle Power Plants 6. Gas Turbine Performance 9 / 101
HIoPE
Com
bin
ed c
ycle
effic
iency,
%
Ambient air temperature, K
Effect on Combined Cycle Efficiency
1. Ambient Temperature [4/7]

Combined Cycle Power Plants 6. Gas Turbine Performance 10 / 101
HIoPE
Net efficiency of a combined cycle power plant as a function of river water temperature.
1. Ambient Temperature [5/7]

Combined Cycle Power Plants 6. Gas Turbine Performance 11 / 101
HIoPE
Rela
tive p
ow
er
outp
ut, %
Gas turbine
100
0
Air temperature, C
120
90
10 20 30 40 -10
Based on constant
condenser pressure
110
The power output of the combined cycle
decreases as the inlet air temperature
increases.
In a combined cycle plant, gas turbines
contribute approximately two-thirds of the
power production, while the steam turbine
contributes the remaining one-third.
The combined cycle power output curve is
dominated by the gas turbine output curve, and
it is expected that changes in air temperature
will have more significant impact on plant
power output than changes in water
temperature.
The power output of the combined cycle is
affected differently from the efficiency because
change in mass flow of inlet air and exhaust
gases are more dominant than the exhaust gas
temperature.
Effect of Ambient Temperature on Combined Cycle Output
Source: Kehlhofer et al., 2009
1. Ambient Temperature [6/7]

Combined Cycle Power Plants 6. Gas Turbine Performance 12 / 101
HIoPE
When the ambient temperature is low, gas turbine output and HRSG steam production are increased above
plant rating point.
Condenser (exhaust) pressure directly influenced by ambient air or cooling water temperature.
Condenser pressure is expected to be lowest at low ambient air / cooling water temperature, and exhaust
annulus velocity will be the highest.
1. Ambient Temperature [7/7]
Combined Cycle Power Plants 6. Gas Turbine Performance 13 / 101
HIoPE
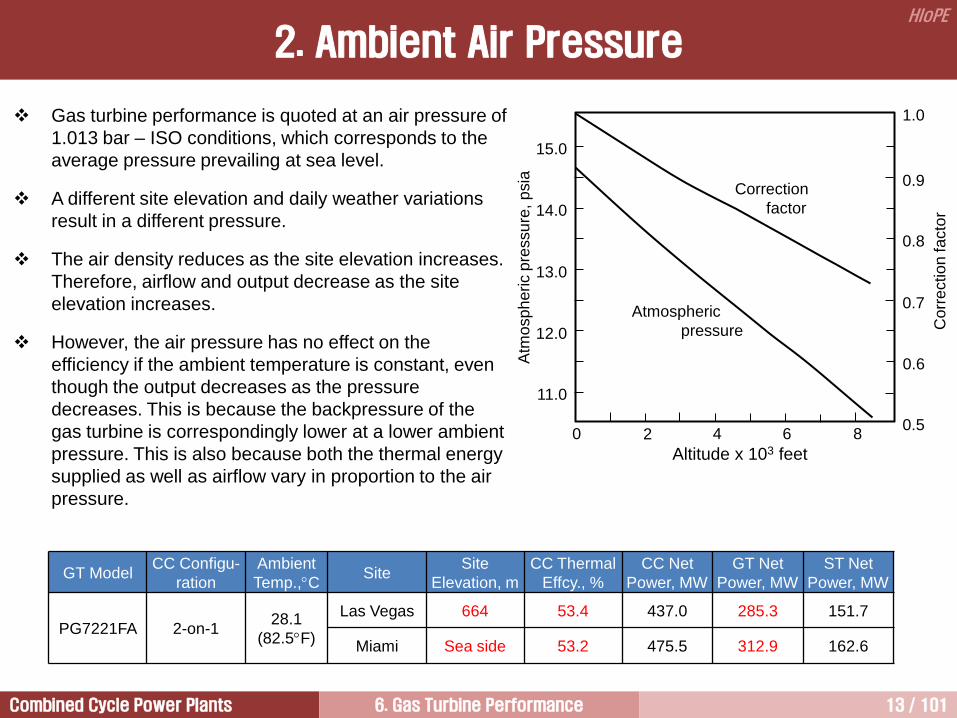
Gas turbine performance is quoted at an air pressure of
1.013 bar – ISO conditions, which corresponds to the
average pressure prevailing at sea level.
A different site elevation and daily weather variations
result in a different pressure.
The air density reduces as the site elevation increases.
Therefore, airflow and output decrease as the site
elevation increases.
However, the air pressure has no effect on the
efficiency if the ambient temperature is constant, even
though the output decreases as the pressure
decreases. This is because the backpressure of the
gas turbine is correspondingly lower at a lower ambient
pressure. This is also because both the thermal energy
supplied as well as airflow vary in proportion to the air
pressure.
Altitude x 103 feet
2 0 4 6 8 0.5
0.6
0.7
0.8
0.9
1.0
Correction
factor
Atmospheric
pressure
11.0
12.0
13.0
14.0
15.0
Corr
ectio
n fa
cto
r
Atm
osp
heric p
ressu
re, p
sia
2. Ambient Air Pressure
GT Model CC Configu-
ration
Ambient
Temp.,C Site
Site
Elevation, m
CC Thermal
Effcy., %
CC Net
Power, MW
GT Net
Power, MW
ST Net
Power, MW
PG7221FA 2-on-1 28.1
(82.5F)
Las Vegas 664 53.4 437.0 285.3 151.7
Miami Sea side 53.2 475.5 312.9 162.6

Combined Cycle Power Plants 6. Gas Turbine Performance 14 / 101
HIoPE
400 0 800 1200 1600
Combined
cycle output
Elevation above sea level, m
75
85
100 R
ela
tive p
ow
er
outp
ut, %
95
90
80
70 2000 2400
75
85
100
95
90
80
70
Rela
tive a
ir p
ressure
, %
Air pressure
2. Ambient Air Pressure
Effect of Air Pressure on Combined Cycle Output

Combined Cycle Power Plants 6. Gas Turbine Performance 15 / 101
HIoPE
Humid air is less dense than dry air.
In the past, this effect was thought to be too small to
be considered.
However, as the size of gas turbine increases, this
effect become important.
Steam or water injection for NOx control makes this
effect more significance.
3. Humidity
Specific humidity (kg water vapor/kg dry air)
ISO specific humidity
0.0064
60% RH
1.008
0.996
Co
rre
ctio
n f
acto
r
0.01 0 0.02 0.03
1.006
1.004
1.002
1
0.998
0.994
1.010

Combined Cycle Power Plants 6. Gas Turbine Performance 16 / 101
HIoPE
4. Inlet & Exhaust Pressure Drop [1/6]
Inlet filter
Evaporative cooler or chiller
Anti-icing system
Silencer (The large frontal areas of the
compressors reduce the inlet velocities, thus
reducing air noise)

Combined Cycle Power Plants 6. Gas Turbine Performance 17 / 101
HIoPE
Hot-end drive Cold-end drive
• In the hot-end drive configuration, the output shaft
extends out the rear of the turbine.
• The designer is faced with many constraints, such
as output shaft length, high EGT, exhaust duct
turbulence, pressure drop, and maintenance
accessibility.
• Insufficient attention to any of these details, in the
design process, often results in power loss,
vibration, shaft or coupling failures, and increased
down-time for maintenance.
• This configuration is difficult to service as the
assembly must be fitted through the exhaust duct.
• In the cold-end drive configuration, the output shaft
extends out the front of the compressor.
• The single disadvantage is that the compressor
inlet must be configured to accommodate output
shaft.
• The inlet duct must be turbulent free and provide
uniform, vortex free, flow over the all operating
range.
• Inlet turbulence may induce surge in the
compressor resulting in complete destruction of the
unit.
MS7001E, GE MS7001F, GE
4. Inlet & Exhaust Pressure Drop [2/6]

Combined Cycle Power Plants 6. Gas Turbine Performance 18 / 101
HIoPE
A similar cost evaluation determines the optimum point that
dirty air filters, which have higher pressure losses, should
be changed out.
Inlet Pressure Drop
Inlet pressure drop is a function of the inlet air system design and cleanliness of the inlet air filters.
Lower inlet air pressure losses can be achieved by designing for lower inlet air velocities through the filter,
silencer, and duct.
The improved operating performance associated with a lower inlet air velocity design must be evaluated
against the associated higher capital cost.
4. Inlet & Exhaust Pressure Drop [3/6]
Inlet pressure prop, in.H2O
Corr
ectio
n fa
cto
r
0 1 2 3 4 5 6 7 8 9 10 0.96
0.97
0.98
0.99
1.00
1.01
1.02

Combined Cycle Power Plants 6. Gas Turbine Performance 19 / 101
HIoPE
Self-cleaning filters were developed in the 1970s and now account for 90% of the new systems.
It combines high-efficiency filters, which can collect even small particles smaller than 1 m, and low
maintenance.
The design pressure drop of a new and clean filter bank is normally on the order of 2 mbar. The approach
velocity of air upstream of the filter surface is approximately 3 m/s.
When pressure drop builds up to a predetermined level (3~4 in.H2O = 7.5~10 mbar), the filter is cleaned by a
brief back-pulse of air, either extracted from the gas turbine compressor, or derived from an auxiliary source.
A filter compartment includes many filter elements (about 1,200 for 7FA), only a few of which are cleaned at
any given time; so the airflow to the gas turbine is not disturbed by the cleaning process.
A single cleaning cycle is usually completed in 20~30 minutes.
The filter elements are replaced when they begin to show signs of deterioration caused by heat and
ultraviolet rays, or when the cleaning is not effective any more.
It is impossible to keep the compressor completely clean and usually fouling occurs in the compressor. The
fouling that results causes losses in output and efficiency.
Two types of compressor cleaning can be used to help recover those losses, on-line washing and off-line
washing.
Self-Cleaning Filters
4. Inlet & Exhaust Pressure Drop [4/6]
Combined Cycle Power Plants 6. Gas Turbine Performance 20 / 101
HIoPE
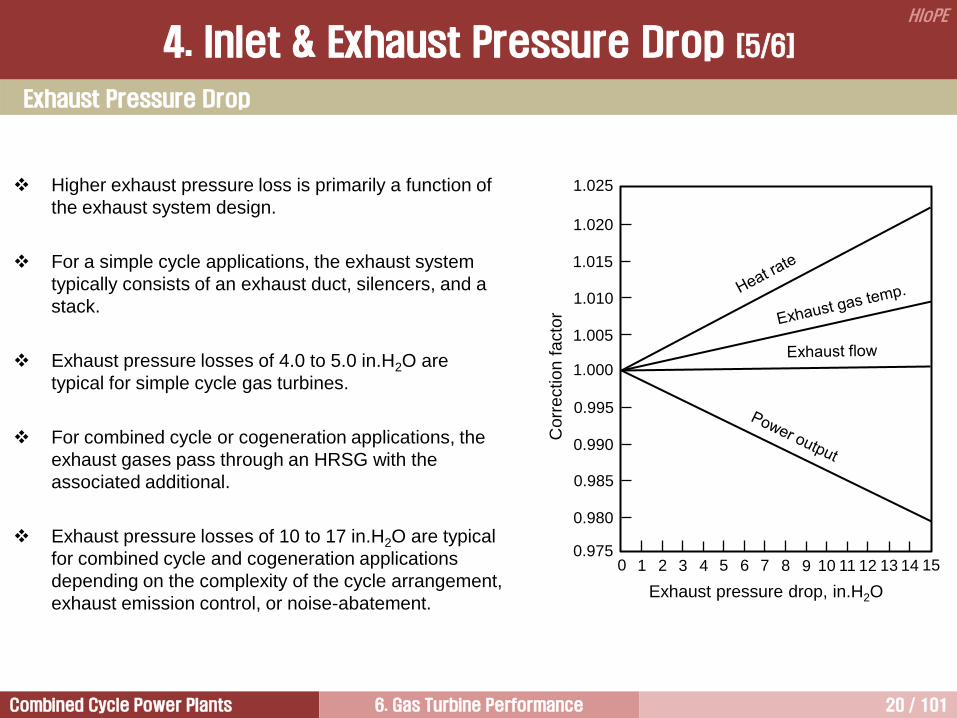
Exhaust pressure drop, in.H2O
Co
rre
ctio
n f
acto
r 1
1.020
1.015
1.010
1.005
0.995
0.990
0.985
0.980
2 3 4 5 6 7 8 9 10 11 12 13 14 0 15
1.025
1.000
0.975
Higher exhaust pressure loss is primarily a function of
the exhaust system design.
For a simple cycle applications, the exhaust system
typically consists of an exhaust duct, silencers, and a
stack.
Exhaust pressure losses of 4.0 to 5.0 in.H2O are
typical for simple cycle gas turbines.
For combined cycle or cogeneration applications, the
exhaust gases pass through an HRSG with the
associated additional.
Exhaust pressure losses of 10 to 17 in.H2O are typical
for combined cycle and cogeneration applications
depending on the complexity of the cycle arrangement,
exhaust emission control, or noise-abatement.
Exhaust Pressure Drop
4. Inlet & Exhaust Pressure Drop [5/6]

Combined Cycle Power Plants 6. Gas Turbine Performance 21 / 101
HIoPE
4.0 in.H2O (10 mbar) Inlet pressure drop produces:
1.42% Power output loss
0.45% Heat rate increase
1.1C Exhaust temperature increase
4.0 in.H2O (10 mbar) Exhaust pressure drop produces:
0.42% Power output loss
0.42% Heat rate increase
1.1C Exhaust temperature increase
Inserting air filter, silencer, evaporative coolers or chillers into the inlet or heat recovery devices in the
exhaust causes pressure losses in the system.
The effects of these pressure losses are unique to each gas turbine models. This is because the amount of
pressure drop at the exit of compressor is pressure drop at the inlet times pressure ratio.
Hot-end drive has not been used since the cold-end drive type gas turbines have developed.
HRSG flue gas draft losses: approximately 25 mbar, 35 mbar if catalysts are required.
Hot-end drive (“E” technology)
MS7001EA 기준
4. Inlet & Exhaust Pressure Drop [6/6]

Combined Cycle Power Plants 6. Gas Turbine Performance 22 / 101
HIoPE
Fuel affects combined cycle performance in a variety of ways.
Output of the gas turbine can be defined as the product of mass flow, specific heat, and temperature
differential across the turbine. Here, specific heat (Cp) means that the heat energy in the combustion
products.
The mass flow in this equation is the sum of compressor air flow and fuel flow.
Natural gas (methane) produces nearly 2% higher output than does distillate oil. This is because of the
higher specific heat in the combustion products of natural gas, resulting from the higher water vapor content
produced by the higher hydrogen/carbon ratio of methane. This effect is noted even though the mass flow of
natural gas is lower than that of distillate oil. Here the effects of specific heat were greater than and in
opposition to the effects of mass flow rate.
Model Fuel ISO base rati
ng, kW
Heat rate,
Btu/kWh
Exhaust flow,
kg/hr x10-3
EGT,
℃
Pressure
ratio
PG7251FB
N.G. 184,400 9,245 1613 623 18.4
D.O. 177,700 9,975 1677 569 18.7
5. Fuel [1/7]
4343 TTcmhhmW pTTT

Combined Cycle Power Plants 6. Gas Turbine Performance 23 / 101
HIoPE
C + O2 = CO2 + 33.9 MJ/kg
H2 + 1/2O2 = H2O(water) + 143.0 MJ/kg (HHV)
H2 + 1/2O2 = H2O(vapor) + 120.6 MJ/kg (LHV)
S + O2 = SO2 + 9.28 MJ/kg
5. Fuel [2/7]

Combined Cycle Power Plants 6. Gas Turbine Performance 24 / 101
HIoPE
The Composition of Natural Gases
The composition on a molar basis of natural gases is as follows:
The average heat content of natural gas is 1,030 Btu/ft3 on an HHV basis and 930 Btu/ft3 on
an LHV basis – about a 10% difference.
Composition, mol% A B C D E F
Methane
Ethane
Propane
Isobutane
Normal butane
Isopentane
Normal pentane
Hexane
Nitrogen
Carbon dioxide
Hydrogen sulphide
Heating value, Btu/ft3
95.0
1.9
0.5
0.5
0.1
0.1
0.1
0.1
1.5
0.2
0.0
?
94.3
2.1
0.4
0.0
0.2
0.0
0.0
0.0
0.0
0.0
2.8
1010
72.3
5.9
2.7
0.2
0.3
0.0
0.2
0.0
0.0
17.8
0.1
934
88.9
6.3
1.8
0.1
0.2
0.0
0.0
0.0
0.0
2.2
0.1
1071
75.4
6.4
3.6
0.6
1.0
0.2
0.1
0.0
0.0
12.0
0.1
1044
85.6
7.8
1.4
0.1
0.0
0.1
0.0
0.0
0.0
4.7
0.2
1051
5. Fuel [3/7]

Combined Cycle Power Plants 6. Gas Turbine Performance 25 / 101
HIoPE
Plant output and efficiency can be reduced when the fuels containing higher sulfur content are used. This is
because higher stack gas temperature is required to prevent condensation of corrosive sulfuric acid.
Plant output and efficiency can be reduced when the ash bearing fuels (crude oil, residual oil, blends, or
heavy distillate) are used because of fouling occurred in gas turbine and HRSG.
Heavy fuels normally cannot be ignited for gas turbine startup; therefore a startup and shutdown fuel, usually
light distillate, is needed with its own storage, forwarding system, and fuel changeover equipment.
The LHV of the fuel is important because it defines the mass flow of fuel supplied to the gas turbine.
The lower the LHV, the higher the mass flow of fuel required to provide a certain chemical heat input,
normally resulting in a higher power output and efficiency. However, there is no clear relationship between
fuel lower heating value and output.
This is why low BTU gases can result in high power outputs if they are supplied at the pressure required by
the gas turbine.
This effect is noted even though the mass flow of methane is lower than the mass flow of distillate fuel.
Here the effects of specific heat were greater than that of mass flow.
5. Fuel [4/7]

Combined Cycle Power Plants 6. Gas Turbine Performance 26 / 101
HIoPE
Degradation in CCPP after 8,000 hours of operation
Clean fuel Heavy or crude oil
Plant output, % 0.8~1.5 4.0~5.5
Plant efficiency, % 0.5~0.8 1.5~1.9
Ash deposition
on turbine
vanes
5. Fuel [5/7]

Combined Cycle Power Plants 6. Gas Turbine Performance 27 / 101
HIoPE
Hot corrosion of blades Burned turbine blades
In the past, corrosion is one of the major causes of gas turbine failures.
Corrosion problems have been eliminated by the use of advanced materials and coating.
Whenever heavy fuels are used, particularly those containing vanadium or sodium, it is necessary to use
additives or treat the fuel to prevent high-temperature corrosion.
The additives commonly used are based on magnesium, chromium, or silicon.
5. Fuel [6/7]

Combined Cycle Power Plants 6. Gas Turbine Performance 28 / 101
HIoPE
As the amount of inert gas is increased, the decrease in
LHV will provide an increase in output.
This is the major impact of IGCC type fuels that have
large amounts of inert gas in the fuel.
This mass flow addition, which is not compressed by the
gas turbine’s compressor, increase the turbine output.
Effects of Fuel Heat Value on Output
5. Fuel [7/7]

Combined Cycle Power Plants 6. Gas Turbine Performance 29 / 101
HIoPE
One way of improving the cycle efficiency is to
raise the apparent LHV (LHV + sensible heat) of
the fuel by preheating it with hot water from the
IP economizer of the HRSG.
Heated fuel gas gives higher turbine efficiency
because of the reduced fuel flow required to
raise the total gas temperature to firing
temperature.
Fuel heating will result in slightly lower gas
turbine output (almost negligible) because of the
incremental volume flow decrease.
The reduction in combined cycle output is
typically greater than simple cycle output
because energy that would otherwise be used to
make steam.
Actual combined cycle output and efficiency
changes are dependent on fuel temperature rise
and cycle design.
For combined cycle applications, fuel
temperatures on the order of 150 to 230°C
(300~450°F) are generally economically optimal.
6. Fuel Heating [1/2]
G
Fuel gas
ST
Condenser
G
Air
Stack gas
HRSG

Combined Cycle Power Plants 6. Gas Turbine Performance 30 / 101
HIoPE
Provided the fuel constituents are acceptable, fuel temperatures can potentially be increased up to
approximately 370°C(700°F) before carbon deposits begin to form on heat transfer surfaces.
Typical F-class three-pressure reheat systems use water from the intermediate pressure economizer to
heat the fuel to approximately 185°C (365°F). Under this conditions, efficiency gains of approximately 0.3
points can be expected for units with no stack temperature limitations.
Another factor is the gas supply pressure, depended on the combustor design and the gas turbine pressure
ratio.
If the gas turbine pressure ratio is high, a gas compressor may be required to increase fuel pressure. In this
case, the temperature of the fuel is increased in proportion to the pressure ratio and the benefit of gas
preheater will be reduced. In this case, the efficiency improvement is too slight to justify the additional
investment in the water/gas heat exchanger, HRSG surface, and piping.
It is important to ensure that the fuel does not enter the steam system because maximum steam
temperatures are typically above the auto ignition temperature for gas fuels.
For a system utilizing a direct water-to-fuel heat exchangers, the water pressure is maintained above the
fuel pressure so that any leakage takes place in the fuel system.
Additional system design and operation requirements ensure that the fuel does not enter the steam system
during periods when the water system is not pressurized.
6. Fuel Heating [2/2]

Combined Cycle Power Plants 6. Gas Turbine Performance 31 / 101
HIoPE
Compressor Inlet Temperature
Options for power
enhancements
Performance impact
Output Heat
rate
Base configuration Base Base
Evaporative cooling GT inlet air
(85% effective cooler) +5.2 % -
Chill GT inlet air to 45F +10.7 % +1.6 %
GT peak load operation +5.2 % 1.0 %
GT steam injection (5% of GT
airflow) +3.4 % +4.2 %
GT water injection (2.9% of GT
airflow) +5.9 % +4.8 %
HRSG supplementary firing +28 % +9 %
Note: 1. Site conditions = 90F, 30% RH(Relative Humidity)
2. Fuel = NG
3. 3-pressure, reheat steam cycle
7. Steam Injection [1/6]
Effects of Steam Injection on Output and Heat Rate [MS7001EA]

Combined Cycle Power Plants 6. Gas Turbine Performance 32 / 101
HIoPE
7. Steam Injection [2/6]
Source: Kehlhofer et al., 2009.
Rela
tive p
ow
er
outp
ut, %
Water or steam/fuel ratio,
114
Rela
tive
effic
iency,
%
112
110
108
106
104
102
100
98
96
94 0.5 1.0 1.5
Hot water injection (150C)
0.0
The steam is extracted from the steam turbine.
Cold water (15C) from the makeup water line.
Hot water (150C) at the outlet of the economizer.
Power output increases with
water/steam injection because
of increased mass flow rate.
Water injection has a greater
effect than steam because
steam turbine output is
decreased with steam injection.
Efficiency of the combined cycle
plant is decreased in both cases;
however, less so by steam than
by water, because steam brings
more internal energy to the
combustor.
Hotter water less reduce the
efficiency than cold one.
[ Effect of water and steam injection on relative combined-cycle power
output and efficiency versus water or steam/fuel ratio (with TIT = constant) ]

Combined Cycle Power Plants 6. Gas Turbine Performance 33 / 101
HIoPE
Diluent injection is accomplished by admitting water or steam in the cap area or head-end of the
combustion liner to reduce the peak flame temperature.
Actually, this has been used for NOx control to meet environmental regulation.
The mass flow passing through the gas turbine increase with the amount of water or steam injection.
Increased mass flow produces higher power output.
Generally, the amount of water is limited to the amount required to meet the NOx abatement in order to
minimize operating cost and impact on inspection intervals.
When steam is injected for power augmentation, it can be introduced into the compressor discharge casing
of the gas turbine as well as combustor.
Normally, gas turbines are designed to allow up to 5% of the compressor airflow for steam injection.
Steam must contain 50F(28C) superheat and be at pressures comparable to fuel gas pressures (at least
40 bar above the compressor discharge).
The way steam is injected must be done very carefully so as to avoid compressor surge.
Gas turbine output and heat rate increase 3.4% and 4.2% respectively, by the steam injection of 5% of the
compressor airflow.
Water or steam injection for emission control or power augmentation can impact parts lives and
maintenance intervals.
7. Steam Injection [3/6]

Combined Cycle Power Plants 6. Gas Turbine Performance 34 / 101
HIoPE
Wet control 3% steam injection
TF = 2020F(1104C)
Load ratio = 1.10
3% steam injection
TF = 1994F(1090C)
Load ratio = 1.08
0% steam injection
TF = 2020F(1104C)
Load ratio = 1.0
EG
T, F
Compressor discharge pressure, psig
Dry control
The wet control maintains
constant TF
[ Steam injection for 25 ppm NOx ]
EGT Control Curve – MS7001EA GER-3620K
7. Steam Injection [4/6]

Combined Cycle Power Plants 6. Gas Turbine Performance 35 / 101
HIoPE
The control system on most base load
applications reduces firing temperature as
water or steam is injected. This is known as
dry control curve operation.
The dry control curve operation counters
the effect of higher heat transfer on the gas
side, and results in no net impact on bucket
life.
This is the standard configuration for all gas
turbines, both with and without water or
steam injection.
Dry control
On some installations, however, the control system is
designed to maintain firing temperature constant with
water or steam injection level. This is known as wet
control curve operation.
The wet control curve operation results in additional unit
output, but decreases parts life.
Units controlled in this way are generally in peaking
applications where annual operating hours are low or
where operators have determined that reduced parts
lives are justified by the power advantage.
Wet control
An additional factor associated with water or steam injection relates to the higher aerodynamic loading on
the turbine components that results for the injected water increasing cycle pressure ratio.
This additional loading can increase the downstream deflection rate of the second- and third-stage nozzles,
which would reduce repair interval for those components.
7. Steam Injection [5/6]

Combined Cycle Power Plants 6. Gas Turbine Performance 36 / 101
HIoPE
Steam/water injection increases metal temperature of hot-gas-path components in the case
of constant firing temperature operation.
• Water affects gas transport properties:
k – thermal conductivity
Cp – specific heat
– viscosity
• This increases heat transfer coefficient, which increases metal temperature and
decreases bucket life
Example (MS7001EA 1st stage bucket):
• 3% steam injection (25 ppm NOx)
• h = +4% (heat transfer coefficient)
• Tmetal = +15F (8C)
• Life = – 33%
GER-3620K
7. Steam Injection [6/6]

Combined Cycle Power Plants 6. Gas Turbine Performance 37 / 101
HIoPE
In some gas turbine applications, it may be desirable to
extract air from the compressor.
In general, up to 5% of the compressor airflow can be
extracted from the compressor discharge casing without
modification to casings or on-base piping.
Air extraction between 6% and 20% may be possible,
depending on the machine and combustor, with some
modification to the casings, piping and controls.
Air extractions above 20% will require extensive
modification to the turbine casing and unit configuration.
As a rule of thumb, every 1% in air extraction results in a
2% loss in power. Ambient temperature %
Effect
on o
utp
ut
C
F 120 0 20 40 60 80 100
0 -7 4 16 27 38 49
100
80
60
40
20
0
-20
-40
-60
% E
ffect
on h
eat
rate
20%
15%
10%
5%
5%
10%
15%
20%
8. Air Extraction
Effects of Air Extraction on Output and Heat Rate

Combined Cycle Power Plants 6. Gas Turbine Performance 38 / 101
HIoPE
9. Inlet Air Cooling [1/29]
Roughly, 1C temperature decrease corresponds to a combined cycle power increase of about +0.4 to
0.5% and overall efficiency remains more or less same.
Compressor
Fuel gas
pre-heater
Turbine
Fuel oil
Fuel gas
compressor
Fuel oil
treatment
Fuel gas
Water
Evaporative
cooler
or
chiller
Wet compression
(Overspray)
Compressor
washing
Fuel additives
Water
(NOx reduction,
power augmentation)
Cooling air
cooler
Air
Air filter
Drain
Water
Steam
Water
Inlet Fogger
(spray cooler)

Combined Cycle Power Plants 6. Gas Turbine Performance 39 / 101
HIoPE
상대습도(relative humidity): 공기중에 있는 수증기의 양과 그 때의 온도에서 공기중에 최대로 포함할 수 있는 수증기의 양을 백분율로 표현한 값.
건구온도(dry bulb temperature): 일반 온도계 측정한 온도.
습구온도(wet bulb temperature): 온도계 아래 부분 동그란 구면을 거즈로 감싸고 거즈의 한쪽 끝을 물이 담긴 그릇에 넣어 그릇에서 빨아올린 물이 끊임없이 온도계의 구면에서 증발하도록 한 상태에서 측정한 온도. 물이 증발하면서 기화열을 빼앗아 가기 때문에 건구온도보다 더 낮은 온도를 나타냄.
공기중의 습도가 낮으면 물이 더 많이 증발할 수 있어서 열을 더 많이 빼앗아 가기 때문에 건구와 습구온도 차이가 더 커짐.
일반적으로 건구온도와 습구온도 차이에 의해서 습도를 계산.
습도 계산표가 있어서 건구온도와 습구온도를 알면 그 때의 습도를 찾을 수 있음. 대부분 습도 계산표를 이용하여 습도 확인.
[ 습구온도계 ]
건구온도 vs. 습구온도
9. Inlet Air Cooling [2/29]

Combined Cycle Power Plants 6. Gas Turbine Performance 40 / 101
HIoPE
For applications where significant power demand and highest electricity prices occur during the hot summer,
a gas turbine air inlet cooling system is a useful option for increasing power output.
Inlet air cooling increases output because the mass flow rate of air passing through the compressor
increases as air temperature decreases.
A decrease in the inlet dry-bulb temperature by 10F(5.6C) will normally result in around 2.7% power
increase of a combined cycle using heavy-duty gas turbines.
The output of the simple-cycle gas turbines is also increased by the same amount.
There are three basic systems currently available for inlet air cooling.
• The first and perhaps the most widely used system is evaporative cooler. Evaporative coolers use the
high efficiency evaporative media for the evaporation of water to decrease the gas turbine inlet air
temperature.
• The second one is a fogger system, also called as spray cooler. This is classified as evaporative cooling.
• The third system employs various ways to chill the inlet air. In this system, the coolant (usually chilled
water) flows through a heat exchanger located in the inlet duct to remove heat from the inlet air.
Evaporative cooling is limited by the wet-bulb temperature.
Chilling, however, can cool the inlet air to temperature that are lower than the wet-bulb temperature, thus
providing additional output, although chilling is much more expensive.
Depending on the combustion and control system, evaporative cooling may reduce NOx emissions; however,
this is very little because of current dry low NOx technology.
9. Inlet Air Cooling [3/29]

Combined Cycle Power Plants 6. Gas Turbine Performance 41 / 101
HIoPE
High efficiency evaporative media
Evaporative Cooler (Wetted Honeycomb Evaporative Coolers)
9. Inlet Air Cooling [4/29]

Combined Cycle Power Plants 6. Gas Turbine Performance 42 / 101
HIoPE
Evaporative Cooler (Wetted Honeycomb Evaporative Coolers)
Conventional evaporative coolers use a wetted honeycomb type medium to maximize evaporative surface
area and the cooling effectiveness.
The medium for gas turbines is typically 12 inches thick and covers the entire cross-section of the filter
house or the inlet air duct.
The pressure drop caused by evaporative media and droplet eliminator is 1 in.H2O.
9. Inlet Air Cooling [5/29]

Combined Cycle Power Plants 6. Gas Turbine Performance 43 / 101
HIoPE
The plant output and efficiency decrease due to this pressure drop of about 1.5 to 3 mbar..
The reduction in gas turbine and combined cycle output is 0.35% and 0.3%, respectively.
A controller is provided to prevent operation of the evaporative cooler system below 60F(15.6C).
Icing could form if the system is allowed to operate below this temperature.
The whole system must be deactivated and drained to avoid damage to the water tank and piping if the
ambient temperature is expected to fall below freezing.
Evaporative cooling is a cost-effective method to recover capacity during periods of high temperature and
low or moderate relative humidity.
Evaporative cooling works on the principle of reducing the temperature of an air stream through water
evaporation.
The process of converting the water into a vapor state requires energy.
This energy is drawn from the air stream. The result is cooler, denser air.
There are limitations that must be considered for each site condition. The key design parameters are the wet
and dry bulb temperature and the allowable load limits for the generator and the transformer.
At sites where large reductions in the compressor inlet temperature are possible, the owner must verify that
the added power is within the capabilities of the generator and transformer.
Evaporative Cooler (Wetted Honeycomb Evaporative Coolers)
9. Inlet Air Cooling [6/29]

Combined Cycle Power Plants 6. Gas Turbine Performance 44 / 101
HIoPE
Theoretically, the lowest temperature that can be achieved by adding water to the air is equal to the ambient
wet-bulb temperature.
Practically, however, this level of cooling is difficult to achieve.
The actual temperature drop realized is a function of both the equipment design and atmospheric conditions.
Other factors being constant, the effectiveness of an evaporative cooling system depends on the surface
area of water exposed to the air stream and the residence time.
T means air temperature. Subscripts 1 and 2 refer to inlet and exit of the cooler, respectively. Subscripts DB
and WB refer to ‘dry bulb’ and ‘wet bulb’, respectively.
Temperature drop of the compressor inlet air is proportional to the difference between wet and dry bulb
temperature. If the effectiveness is 85%, the temperature drop is
The effectiveness of evaporative cooler is typically 85% and of foggers somewhat higher at 90 to 95%.
WBDB
DBDB
TT
TTessEffectivenCooler
,2,1
,2,1
Evaporative Cooler - Theory
WBDB TTdropeTemperatur ,2,185.0
9. Inlet Air Cooling [7/29]

Combined Cycle Power Plants 6. Gas Turbine Performance 45 / 101
HIoPE
[Solution]
The corresponding wet-bulb
temperature is 70F.
T = 0.85(100-70) = 25F (14C)
[Example 9.1]
Ambient temperature is 100F (37.8C)
and relative humidity is 20%. Calculate
the temperature drop through the cooler.
The effectiveness of the evaporation
system is 85%.
Psychrometric Chart [건습계 차트]
Water
Evaporated
Degrees Cooled
Dry Bulb Temperature
9. Inlet Air Cooling [8/29]

Combined Cycle Power Plants 6. Gas Turbine Performance 46 / 101
HIoPE
Roughly, 1C temperature decrease corresponds to a
combined cycle power increase of about 0.4 to 0.5% and
overall efficiency remains more or less same.
The exact increase in power available from a particular gas
turbine as a result of evaporative cooling depends on the
machine model and site altitude, as well as on the ambient
temperature and humidity.
However, the chart given in the figure can be used to get the
power increase from evaporative cooling.
As would be anticipated, power increase is greatest in hot, dry
weather.
Evaporative cooling is limited to ambient temperatures (15C)
and above (compressor inlet temperature >7.2C) because of
the potential for icing the compressor.
An evaporative cooling does only make sense at locations
with humidity below 70 to 80%.
Evaporative Cooler
9. Inlet Air Cooling [9/29]

Combined Cycle Power Plants 6. Gas Turbine Performance 47 / 101
HIoPE
Gas turbines have been used foggers, also called as spray coolers, since mid-1980s.
These systems atomize the supply of water into billions of tiny droplets.
The droplets require a certain amount of residence time in the air stream to evaporate. The size of droplet
plays an important role in determining the surface area of water exposed to the airstream and, therefore, to
the speed of evaporation.
The water droplets should be atomized to less than 20 m in foggers.
Fogger
Demineralized water is used
to reduce compressor fouling
or nozzle plugging. However,
it necessitates the use of a
high grade stainless steel for
all wetted parts.
9. Inlet Air Cooling [10/29]

Combined Cycle Power Plants 6. Gas Turbine Performance 48 / 101
HIoPE
Fogger
9. Inlet Air Cooling [11/29]

Combined Cycle Power Plants 6. Gas Turbine Performance 49 / 101
HIoPE
Fogger - EPRI Spray Nozzle Array
A typical spray-impingement
fog nozzle
Nozzle fog spray pattern
9. Inlet Air Cooling [12/29]
Combined Cycle Power Plants 6. Gas Turbine Performance 50 / 101
HIoPE
Two methods are used for water atomization.
The first relies on compressor air in the nozzles to atomize the water.
The second uses a high pressure pump to force the water through a small orifice.
Air-atomized nozzles require less water pressure.
However, they result in low power output due to the air extraction from the gas turbine. An air-atomized
system using compressor discharge air would reduce the power output 1.3% (EPRI, TR-104612).
The typical air-to-water mass ratio is 0.6 (volume ratio is 500).
Some high-pressure pumps use swirlers to break the water into small droplets.
Other force the water on an impingement pin to generate the same effect.
A typical high-pressure pumped fog system has an operating pressure of between 1000 and 3000 psi (6.8
and 20.4 MPa).
In contrast to evaporative coolers, fogging systems have a negligible pressure drop and are ideal for
retrofitting.
Fogger
9. Inlet Air Cooling [13/29]

Combined Cycle Power Plants 6. Gas Turbine Performance 51 / 101
HIoPE
Careful application of these systems is
essential, because condensation or
carryover of water can be causes of severe
compressor fouling and performance
degradation.
These systems generally are followed by
moisture separators or coalescing pads to
reduce the possibility of moisture carryover.
More spray flow was removed (~70%) by the
Large Droplet Eliminator than was originally
anticipated (~58%) in the EPRI test (TR-
108057).
Normally, water droplets are agglomerated
by turbulent fluctuations and become large
droplets.
Analysis of the drain water gives some
beneficial air scrubbing effects when the
spray cooler is operating.
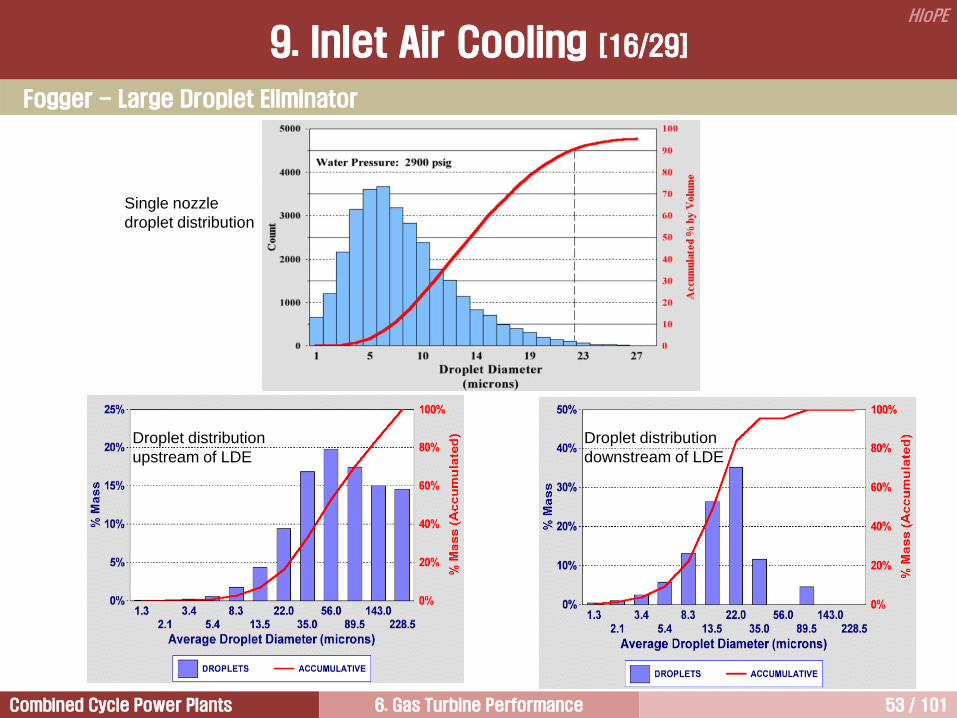
Fogger - Large Droplet Eliminator
A large droplet eliminator (LDE) is installed in the in the inlet
housing downstream of the spray nozzle array to remove
large water droplets from the air stream. The modules are
manufactured using polypropylene with sine curve shaped
vanes.
9. Inlet Air Cooling [14/29]

Combined Cycle Power Plants 6. Gas Turbine Performance 52 / 101
HIoPE
dp =
4 m
10 m
20 m
40 m
Fogger - Large Droplet Eliminator
9. Inlet Air Cooling [15/29]
Combined Cycle Power Plants 6. Gas Turbine Performance 53 / 101
HIoPE
Fogger - Large Droplet Eliminator
Droplet distribution
upstream of LDE
Droplet distribution
downstream of LDE
Single nozzle
droplet distribution
9. Inlet Air Cooling [16/29]

Combined Cycle Power Plants 6. Gas Turbine Performance 54 / 101
HIoPE
The power increase from evaporative cooling is about 3.5% for every 10F (5.6C) of cooling.
Evaporative cooling is limited by the difference between the dry bulb and wet bulb temperatures.
If sufficient water can be introduced into the air such that the air becomes fully saturated, the air
temperature will be reduced to the wet bulb temperature.
The amount of cooling is limited by the potential for icing as the air flow speeds up in the bellmouth and the
static air temperature drops.
The icing limit is engine dependent but typically varies from 40F to 50F.
Fogger - Summary of ERPI Test Results
9. Inlet Air Cooling [17/29]

Combined Cycle Power Plants 6. Gas Turbine Performance 55 / 101
HIoPE
Evaporative cooler Fogger (spray cooler)
Advantages
• Water quality requirements are less
severe than fogger system.
• Simple and reliable.
• More operating experience.
• Gas turbine inlet pressure drop is lower
than that of evaporative cooler and
provides increased output.
• Higher effectiveness.
• Potential for lower uprate costs and faster
installation time due to reduced duct
modifications compared to evaporative
cooler.
Disadvantages
• Uprates frequently require substantial
duct modifications.
• Higher gas turbine inlet pressure drop
than fogger system degrades output and
efficiency when not in use.
• Lower cooling effectiveness.
• Requires demineralized water.
• Higher parasitic load than evaporative
cooler for high-pressure pumped systems.
• Lower power increase for air-atomized
systems.
• Controls are more complex.
Evaporative Cooling
9. Inlet Air Cooling [18/29]

Combined Cycle Power Plants 6. Gas Turbine Performance 56 / 101
HIoPE
There are two types of inlet chilling systems, direct chillers and thermal storage.
Liquefied natural gas (LNG) systems use the cooling generated by the vaporization of liquefied gas in the
fuel supply.
Thermal storage systems use off-peak power to store thermal energy in the form of ice.
During peak power periods, the ice is used to perform inlet chilling.
Direct chilling systems use mechanical or absorption chillers.
All these options can be installed in new plants or retrofitted in older plants.
The chilling achieved by using cooling coils depends on the design of the equipment and ambient
conditions.
Unlike evaporative coolers, cooling coils are capable of lowering the temperature below the wet-bulb
temperature.
The capacity of the inlet chilling device, the compressor’s acceptable temperature and humidity limits, and
the effectiveness of the coils limit actual reduction in temperature.
Chiller
9. Inlet Air Cooling [19/29]

Combined Cycle Power Plants 6. Gas Turbine Performance 57 / 101
HIoPE
Figure illustrates a typical cooling process
from an ambient dry-bulb temperature of
100F(37.8C) and 20% relative humidity.
The initial cooling process follows a line of
constant specific humidity.
As the air approaches saturation,
condensation starts to occur.
Additional cooling results in further
condensation.
Mist eliminator should be installed
downstream of coils to prevent condensed
water from entering the gas turbine.
The air can be cooled below the ambient
wet-bulb temperature.
However, the compressor inlet temperature
should be higher than 45F(7.2C) with a
relative humidity of 95%.
Icing will form at lower temperature,
resulting in possible equipment damage.
Chiller
Water
Evaporated
Degrees Cooled
Dry Bulb Temperature
Evaporative
Cooling
Process
Specific
Humidity
9. Inlet Air Cooling [20/29]

Combined Cycle Power Plants 6. Gas Turbine Performance 58 / 101
HIoPE
Chiller
9. Inlet Air Cooling [21/29]

Combined Cycle Power Plants 6. Gas Turbine Performance 59 / 101
HIoPE
Chiller
F-Class gas turbine inlet filter house, showing
installation of chiller coils. Coil manifolds are the
vertical pipes along side the filter house. This filter
house is “passively balanced” with a third “reverse
return manifold”.
Filter houses for chilling applications are much
larger than standard models. A larger “face area”
keeps pressure drop across the coils low. This filter
house also has a symmetrical transition duct that
improves the airflow across the coils.
The fogger systems react to the ambient weather conditions, being limited to the spread between DB and
WB. However, chiller systems break through the WB and dew-point barriers that would limit fogger systems.
The power output enhancement associated with chiller systems can be nearly twice that of the fogger
systems. In addition, temperature of the inlet air can be as constant as possible using chiller systems.
9. Inlet Air Cooling [22/29]

Combined Cycle Power Plants 6. Gas Turbine Performance 60 / 101
HIoPE
Case Inlet air
cooling
GT output,
kW (each)
Total duct
burner fuel
input,
MMBtu/hr
(LHV)
ST output,
kW (gross)
Auxiliary
power, kW
Net plant
output, kW
Each GT fuel
input,
MMBtu/hr
(LHV)
Net plant
heat rate,
Btu/kWh
(LHV)
1 None 147207 0.000 169942 12173 452183 1440.373 6371
2 Fogger 159850 0.000 174642 12489 481853 1531.400 6356
3 Chiller 173833 0.000 178055 19799 505922 1632.324 6453
4 None 147185 654.636 252408 16575 530203 1440.300 6668
5 Fogger 159831 635.466 254283 16839 557106 1531.337 6638
6 Chiller 173813 619.586 255761 24071 579316 1632.256 6705
7 Chiller 164800 0.000 175366 15918 489048 1565.722 6403
• Model: STAG207FA
• Simulation software: GTPro & GTMaster
• Ambient conditions: 95F (35C), 40% RH
• Effectiveness of fogging system: 95%
• The chiller cools the inlet air temperature down to 50F (10C)
Summary for Performance Simulation Results
Source: T.C. Tillman, PowerGen International 2003
9. Inlet Air Cooling [23/29]

Combined Cycle Power Plants 6. Gas Turbine Performance 61 / 101
HIoPE
Case Inlet air
cooling
Duct
firing
Net plant
output, kW
Incremental output,
kW
Reference
cost, M$
Incremental
cost (to Case 1),
M$
Unit cost,
$/kW
1 None No 452183 212.4 470
2 Fogger No 481853 29670 6.6% 215.1 2.7 446
3 Chiller No 505922 53739 11.9% 225.3 12.9 445
4 None Yes 530203 78020 17.3% 229.5 17.1 433
5 Fogger Yes 557106 104923 23.2% 231.5 19.0 416
6 Chiller Yes 579316 127133 28.1% 239.9 27.5 414
• All cost figures are provided by Thermoflow’s PEACE costing module.
• This software uses the plant configuration as provided by GTPro.
Summary for Capital Cost Simulation Results
Source: T.C. Tillman, PowerGen International 2003
9. Inlet Air Cooling [24/29]

Combined Cycle Power Plants 6. Gas Turbine Performance 62 / 101
HIoPE
Comparison of Fogger and Inlet Chiller
Inlet Chiller
Fogger
No Augmentation GT: PG7221FA
Site: Las Vegas (Dry Weather Condition)
Peak Load Operation (Simple Cycle)
TR-1005039 (EPRI)
GT Model CC Configu-
ration
Ambient
Temp.,C Site
Site
Elevation, m
CC Thermal
Effcy., %
CC Net
Power, MW
GT Net
Power, MW
ST Net
Power, MW
PG7221FA 2-on-1 28.1
(82.5F)
Las Vegas 664 53.4 437.0 285.3 151.7
Miami Sea side 53.2 475.5 312.9 162.6
9. Inlet Air Cooling [25/29]

Combined Cycle Power Plants 6. Gas Turbine Performance 63 / 101
HIoPE
Comparison of Fogger and Inlet Chiller
Inlet Chiller
Fogger
No Augmentation
GT: PG7221FA
Site: Miami (Humid Weather Condition)
Peak Load Operation (Simple Cycle)
TR-1005039 (EPRI)
GT Model CC Configu-
ration
Ambient
Temp.,C Site
Site
Elevation, m
CC Thermal
Effcy., %
CC Net
Power, MW
GT Net
Power, MW
ST Net
Power, MW
PG7221FA 2-on-1 28.1
(82.5F)
Las Vegas 664 53.4 437.0 285.3 151.7
Miami Sea side 53.2 475.5 312.9 162.6
9. Inlet Air Cooling [26/29]

Combined Cycle Power Plants 6. Gas Turbine Performance 64 / 101
HIoPE
Comparison of Fogger and Inlet Chiller
Combined Cycle Output
Site: Las Vegas (Dry Weather Condition)
Inlet Chiller
Fogger
No Augmentation
GT Model CC Configu-
ration
Ambient
Temp.,C Site
Site
Elevation, m
CC Thermal
Effcy., %
CC Net
Power, MW
GT Net
Power, MW
ST Net
Power, MW
PG7221FA 2-on-1 28.1
(82.5F)
Las Vegas 664 53.4 437.0 285.3 151.7
Miami Sea side 53.2 475.5 312.9 162.6
TR-1005039 (EPRI)
9. Inlet Air Cooling [27/29]

Combined Cycle Power Plants 6. Gas Turbine Performance 65 / 101
HIoPE
Comparison of Fogger and Inlet Chiller TR-1005039 (EPRI)
Combined Cycle Output
Site: Miami (Humid Weather Condition)
Inlet Chiller
Fogger
No Augmentation
GT Model CC Configu-
ration
Ambient
Temp.,C Site
Site
Elevation, m
CC Thermal
Effcy., %
CC Net
Power, MW
GT Net
Power, MW
ST Net
Power, MW
PG7221FA 2-on-1 28.1
(82.5F)
Las Vegas 664 53.4 437.0 285.3 151.7
Miami Sea side 53.2 475.5 312.9 162.6
9. Inlet Air Cooling [28/29]

Combined Cycle Power Plants 6. Gas Turbine Performance 66 / 101
HIoPE
9. Inlet Air Cooling [29/29]

Combined Cycle Power Plants 6. Gas Turbine Performance 67 / 101
HIoPE
Compressor Turbine
Wet compression (Overspray )
Water
Evaporative
cooler
or
chiller
Wet compression
(Overspray)
Compressor
washing
Cooling air
cooler
Air
Air filter
Drain
Water
Steam
Water
Inlet Fogger
(spray cooler)
• Wet compression is defined as the excess spray beyond
that which is required to completely saturate the air.
• As an extension of the fogger system, water droplets are
allowed to enter the compressor and evaporation takes
place within the compressor.
• Droplets are evaporated inside the compressor to give
evaporative intercooling effect.
• Wet compression is also called as high fogging, over
spray, over-fogging system, and are usually in operation
together with a fogging or evaporation cooling system.
10. Wet Compression [1/11]

Combined Cycle Power Plants 6. Gas Turbine Performance 68 / 101
HIoPE
LM6000 Sprint
Wet compression (Overspray)
• The power increase resulting from overspray is about
5% for every 1% overspray (overspray water mass is
expressed as a percentage of inlet air mass).
• The amount of overspray will depend on ambient
conditions.
10. Wet Compression [2/11]
Source: GER-3620K

Combined Cycle Power Plants 6. Gas Turbine Performance 69 / 101
HIoPE
When water droplets enter the compressor, the process is
called as wet compression or overspray.
There are two methods of overspray. One is spraying
more water droplets into the inlet air stream than can be
evaporative with given ambient conditions. The other is
installing a separate fogger system (two-stage
evaporative cooler, also called as two-zone system)
downstream of the acoustic silencers to spray water
directly into the compressor inlet.
The airstream carries unevaporated fog droplets into the
compressor section. Then, they are evaporated in the
compressor because higher temperatures in the
compressor increase moisture-holding capacity of air.
When the water droplets evaporate, the compressed air
becomes cooler and denser.
This increases total mass flow of air through the gas
turbine and reduces the compressor work. Therefore, gas
turbine output increases.
As the compressor discharge temperature decreases
when the overspray system is operated, more fuel is
required to achieve a given TIT. In this case, the increase
of power output is greater than the increase of fuel
consumed resulting in a net decrease in overall heat rate.
Source: TR-108057 (EPRI)
10. Wet Compression [3/11]

Combined Cycle Power Plants 6. Gas Turbine Performance 70 / 101
HIoPE
There is one possible drawback to wet compression; if water droplets are too large, there is potential for
liquid-impaction erosion of compressor blades.
For this reason, spray droplet diameter should be less than 20 m.
EPRI has recommended that droplets on the order of 10 microns in diameter or smaller are desirable to
evaporate quickly, follow streamlines, minimize wall wetting and minimize erosion.
Evaporation of the water droplets inside the compressor provides continuous cooling of the air thus leading
to a reduction in the compressor work and compressor discharge temperature for a given pressure ratio.
The maximum desirable ratio of water-to-air flow is limited by compressor surge or stall and combustor
efficiency. A coating of liquid on the airfoil surfaces will change the blade path geometry and the related
position of the surge line.
The spray of untreated water will results in fouling on the airfoil surfaces. This, in turn, leads to a change in
airfoil geometry and the position of the surge line.
It has been estimated that an overspray limit of 0.5% of the air flow appears reasonable without reducing the
surge margin. The effect of this amount of injection on a W501AB is estimated to reduce the compressor
power, increase the turbine output, and results in a net output increase of 4.8%, based on 100F dry bulb
and 80F saturated air inlet conditions. (from TR-104612, EPRI)
The wet compression system should be operated at or above 50F because of the formation of ice.
10. Wet Compression [4/11]

Combined Cycle Power Plants 6. Gas Turbine Performance 71 / 101
HIoPE
Experimental investigation has shown that overspray into an axial compressor can reduce compressor work,
reduce the compressor discharge temperature, increase output power, and reduce NOx emissions.
The benefits of overspray are greatest when complete evaporation is achieved as soon as possible in the
compressor.
The cooling air temperatures often limit the firing temperature to achieve the desired hot section parts life.
The spraying of water adds mass flow and increase the specific heat, so the actual compression power
reduction is somewhat offset by these effects.
Issues of concern are the potential for erosion for the compressor blade and the reduced stall margin.
The use of very fine droplets that are less than 3 microns is diameter has been shown to reduce erosion to a
negligible rate.
The maximum amount of water sprayed to saturate the air throughout the compressor is nearly 10% of the
air flow. However, it is affected by many factors, such as ambient conditions, compressor surge margin,
compressor blade incidence angle, and choking condition of the 1st stage turbine nozzle.
The estimated heat rate changes for simple cycles are small and increase slightly for combined cycle.
The increase of power with fogging or evaporative cooling depends on ambient conditions. However, the wet
compression power increase is nearly independent of ambient humidity and temperature.
Source: TR-1005039 (EPRI)
10. Wet Compression [5/11]
Combined Cycle Power Plants 6. Gas Turbine Performance 72 / 101
HIoPE
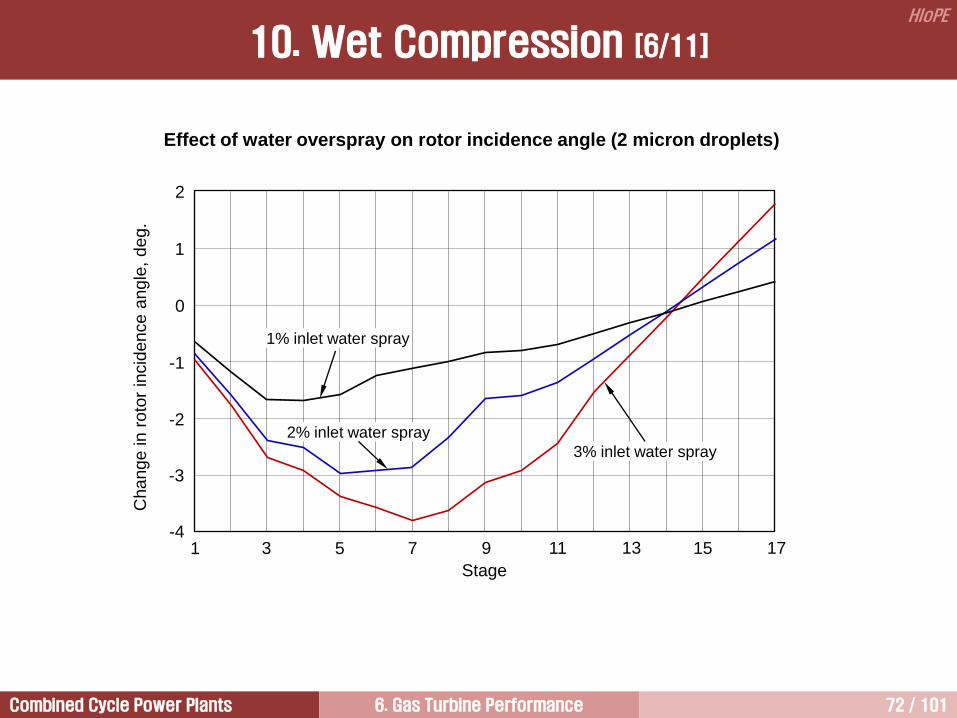
1 5
1
0
-1
-2
-3
Stage
Change in r
oto
r in
cid
ence a
ngle
, deg.
-4 3 9 7 13 11 17 15
2
1% inlet water spray
2% inlet water spray
3% inlet water spray
Effect of water overspray on rotor incidence angle (2 micron droplets)
10. Wet Compression [6/11]

Combined Cycle Power Plants 6. Gas Turbine Performance 73 / 101
HIoPE
Change in s
tato
r in
cid
ence a
ngle
, deg.
1 5
2
0
-2
-4
-6
Stage
-8 3 9 7 13 11 17 15
4
1% inlet water spray
2% inlet water spray
3% inlet water spray
10
8
6
Effect of water ovesrpray on stator incidence angle (2 micron droplets)
10. Wet Compression [7/11]
Combined Cycle Power Plants 6. Gas Turbine Performance 74 / 101
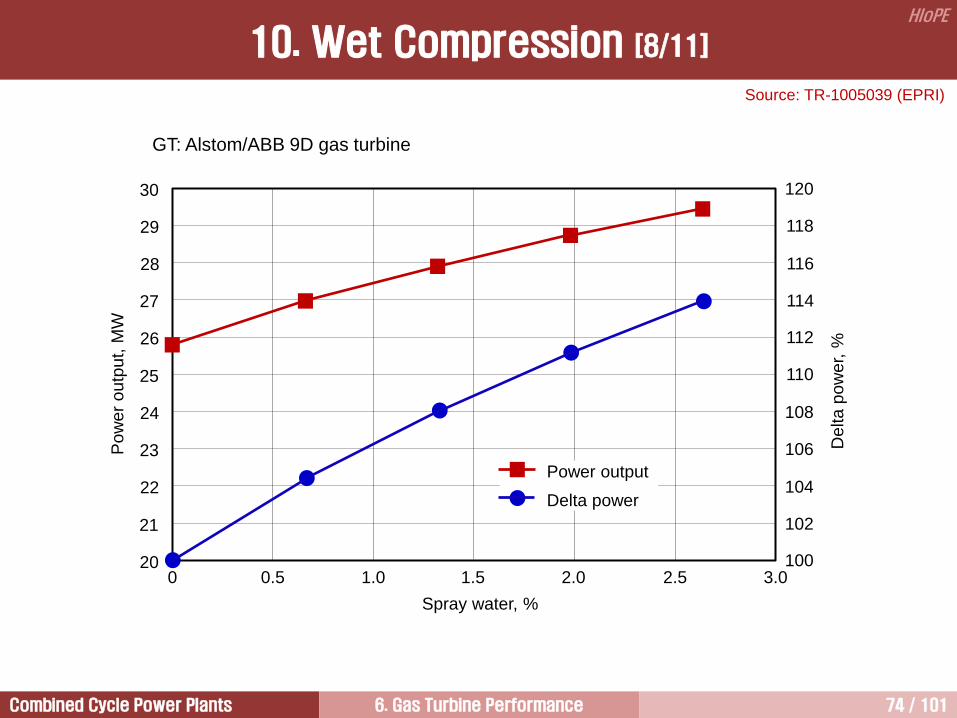
HIoPE
Power output
Delta power
Spray water, %
Pow
er
outp
ut, M
W
De
lta
pow
er, %
30
29
28
27
26
25
24
23
22
21
20 0 0.5 1.0 1.5 2.0 2.5 3.0
120
118
116
114
112
110
108
106
104
102
100
GT: Alstom/ABB 9D gas turbine
10. Wet Compression [8/11]
Source: TR-1005039 (EPRI)

Combined Cycle Power Plants 6. Gas Turbine Performance 75 / 101
HIoPE
Base load
75% load
50% load
Spray water, %
NO
x,
g/G
J
240
220
200
180
160
140
120
100
80
60 0 0.5 1.0 1.5 2.0 2.5 3.0
GT: Alstom/ABB 9D gas turbine
10. Wet Compression [9/11]
Source: TR-1005039 (EPRI)

Combined Cycle Power Plants 6. Gas Turbine Performance 76 / 101
HIoPE
Comparison of Prediction and Measurement of Inlet Air Cooling
Base Load Power
50 55 60 65 70 75 80
Base + NOx WI 62.2 MW Evaporative cooling
6.3 MW (10.2%)
Overspray
1.8 MW (2.9%)
Max WI
2.9 MW (4.7%)
Pe
ak g
en
era
tor
ratin
g
Peak Load Power
Peak + NOx WI 67.7 MW Evaporative cooling
6.5 MW (10.2%)
Max WI
3.1 MW (4.6%)
Overspray
2.0 MW (3%)
(A) Predicted
[97F(36C),
34% RH]
GT Model: MS7001E
Evaporative cooling
3.2 MW
(B) Predicted
[97F(36C),
34% RH]
Overspray
1.25 MW (C) Predicted
[New and
clean compressor,
Ambient conditions
are not given]
Evaporative cooling
3.5 MW
Overspray
0.75 MW (D) Measured
[Ambient
conditions are not
given]
Power Output, MW
10. Wet Compression [10/11]
Source: TR-108057 (EPRI)

Combined Cycle Power Plants 6. Gas Turbine Performance 77 / 101
HIoPE
[ Frame 7FA R0 compressor blade leading edge liquid droplet erosion ]
Water droplets will cause leading edge erosion on the first few stages of the compressor.
This erosion, if sufficiently developed, may lead to blade failure.
Additionally, the rounded leading edge surface lowers the compressor efficiency and unit performance.
Utilization of inlet fogging or evaporative cooling may also introduce water carry-over or water ingestion into
the compressor, resulting in water droplet erosion.
Although the design intent of evaporative coolers and inlet foggers should be to fully vaporize all cooling
water prior to its ingestion into the compressor, evidence suggests that, on systems that were not properly
commissioned, the water may not be fully vaporized.
10. Wet Compression [11/11]

Combined Cycle Power Plants 6. Gas Turbine Performance 78 / 101
HIoPE
11. Supercharging [1/3]
Ducted fan-motor set (plan view)

Combined Cycle Power Plants 6. Gas Turbine Performance 79 / 101
HIoPE
External motor drive (Plan View)
11. Supercharging [2/3]

Combined Cycle Power Plants 6. Gas Turbine Performance 80 / 101
HIoPE
TR-1005039 (EPRI)
Supercharging rounds out the technologies based on inlet air conditioning such that the inlet temperature,
humidity and pressure may be controlled.
An electric motor-driven fan (or blower) strategically located in the GT inlet air flow path increases the inlet
pressure at the axial compressor scroll.
A temperature rise accompanies the pressure rise, so after-cooling is desirable to capture the maximum
benefit of the pressure rise.
Evaporative cooling is also beneficial in reducing the fan power, but this is considered a separate technology.
The motor, fan and after-cooler ensemble constitute the supercharger.
During the late 1960s, Westinghouse offered their W301 gas turbine with supercharging.
The W301 was offered in a fully fired combined cycle configuration, so the supercharger blower was also
used for operating the furnace and steam turbine when the CT was not operating.
The Westinghouse performance data was modeled with SCAAD (Strategic Capacity Analysis and Design)
software developed for EPRI.
11. Supercharging [3/3]

Combined Cycle Power Plants 6. Gas Turbine Performance 81 / 101
HIoPE
Some gas turbine models can be operated at a higher firing temperature than their base rating.
This is called peak firing. During the peak firing operation, both simple-cycle and combined-cycle output will
increase.
Peak firing is available to get 3~10% higher output than the output at base load.
Normally, thermal efficiency of the plant is increased during peak firing of gas turbine because of higher
firing temperatures.
This mode of operation results in a shorter inspection interval and increased maintenance.
Despite this penalty, operating at elevated peak firing temperatures for short periods is cost-effective way
for power gain without any additional peripheral equipment.
“Peaking” at 110% rating will increase maintenance costs by a factor of 3 relative to base-load operation at
rated capacity, for any given period.
For an MS7001EA turbine, each hour of operation at peak load firing temperature (+100F/56C) is the
same, from a bucket parts life standpoint, as six hours of operation at base load.
12. Peak Firing [1/2]

Combined Cycle Power Plants 6. Gas Turbine Performance 82 / 101
HIoPE
Maintenance Factor
E-class
F-class E-class
peak rating
life factor 6x
0 50 100 150
Firing temperature, F
Ma
inte
na
nce
fa
cto
r
100
10
6
0
12. Peak Firing [2/2]

Combined Cycle Power Plants 6. Gas Turbine Performance 83 / 101
HIoPE
13. Part Load Operation
Load, % 30 40 50 60 70 80 90 100
65
60
75
70
85
80
95
90
100

Combined Cycle Power Plants 6. Gas Turbine Performance 84 / 101
HIoPE
It can be used to increase steam turbine capacity by
as much as 100%.
This will increase plant capacity by about 33%.
Cogeneration of power and process steam is usually
the incentive for HRSG supplementary firing.
14. Supplementary Firing in HRSG
There is a small performance penalty when operating unfired compared to operating a unit designed without
supplementary firing, and the magnitude of this performance penalty is directly proportional to the amount of
supplementary firing built into the combined-cycle plant.
The performance penalty is due to two factors: unfired operation results in lower steam flows and pressures
and, thus, lower steam turbine efficiency; also, the pumps, auxiliary equipment and generator are sized for
higher loads.
Operating unfired results in comparatively higher parasitic loads compared to a unit designed solely for
unfired operation.
Normally, thermal
efficiency of the plant is
decreased during HRSG
supplementary firing.

Combined Cycle Power Plants 6. Gas Turbine Performance 85 / 101
HIoPE
The end pressure of steam expansion in the turbine is determined by the steam saturation
temperature depending on the cooling water temperature and heat transfer conditions on the
condenser tubes.
15. Cooling Water Temperature [1/2]
T
s
2
p4’
1
1
2
3
a b
4
p4
a
4
Combined Cycle Power Plants 6. Gas Turbine Performance 86 / 101
HIoPE
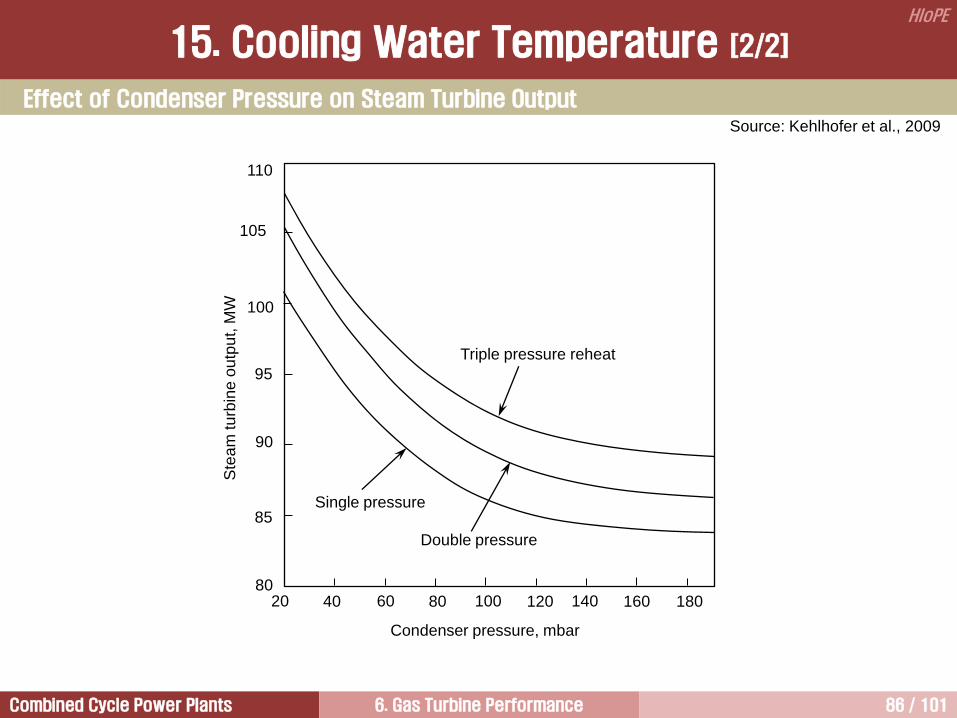
15. Cooling Water Temperature [2/2]
Effect of Condenser Pressure on Steam Turbine Output
110
105
100
95
90
85
80
20 40 60 80 100 120 140 160 180
Condenser pressure, mbar
Ste
am
tu
rbin
e o
utp
ut,
MW
Single pressure
Double pressure
Triple pressure reheat
Source: Kehlhofer et al., 2009
Combined Cycle Power Plants 6. Gas Turbine Performance 87 / 101
HIoPE
16. Compressor Washing [1/11]
Performance Degradation
All guaranteed performance numbers are valid for a new and clean engine. New and clean conditions are
specified on a project-by-project basis, but typically are defined as performance during first 20 to 100 hours
of fired operation.
All engines have performance degradation, those are easily recoverable, or non-recoverable.
A typical recoverable loss is usually associated with compressor fouling which can be partially removed by
water washing or by mechanical cleaning after opening the unit. The removal of fouling deposits from the air
path components can restore partially the aerodynamic performance of the machine.
Non-recoverable loss is due to increased turbine and compressor tip clearances and changes in surface
finish and airfoil contour, mainly caused by corrosion and erosion, and sometimes by FOD.
These non-recoverable losses are main cause of the reduction in component efficiencies, and it may be
recovered only by replacement or repair of the affected parts at recommended inspection intervals.
OEMs typically recommend periodic maintenance inspections and overhauls which are scheduled on the
basis of hours of fired operation, type of fuel used, and the number of starting the machine.
On the basis of natural gas firing, it has generally being recommended that the inspection intervals are 8,000
hours of operation for combustors, 24,000 hours of operation for hot gas parts, and 48,000 hours of
operation for a major overhaul.
Typically, performance degradation during the first 24,000 hours of operation (the normally recommended
interval for a hot gas path inspection) is 2% to 6% from the guaranteed performance. This assumes
degraded parts are not replaced. If replaced, the expected performance degradation is 1% to 1.5%.

Combined Cycle Power Plants 6. Gas Turbine Performance 88 / 101
HIoPE
Compressor Fouling
The most significant performance degradation occurred in gas turbines is
caused by compressor fouling.
Compressor fouling takes place when particulate matter in the inlet air is
deposited and adhered to the bell mouth or compressor blades. The fouling
physically changes the shape of the compressor blades, reducing
aerodynamic performance.
Fouling may also block cooling air flow ports and passages, resulting in
thermal damage to the components.
A large quantities of air pass through the compressor, combustor, and turbine
section.
Although inlet air is filtered, some contaminants pass through the compressor
and turbine. Typical contaminants are submicron dirt particles entering the
compressor, oil vapors, smoke, and sea salt.
There is a temperature and humidity region showing higher compressor
fouling rate. Too little humidity gives too little water for sticking the particles
whilst too high levels might result in the effect of on-line wash.
Compressor fouling can be severer with inlet foggers.
Fouled gas turbine air inlet bell
mouth and blading, engine
operated in an industrial
environment
16. Compressor Washing [2/11]
Front stages are usually fouled worst. This is because the particles adhere to the compressor blade mainly
by bell mouth condensation, or by oil leak from #1 bearing.
Rear stage fouling gives a smaller impact on performance; but due to higher temperatures, deposits can
become baked and difficult to remove. This baking effect is more severe on the machines with high
pressure ratio compressor.

Combined Cycle Power Plants 6. Gas Turbine Performance 89 / 101
HIoPE
The compressor efficiency is governed by the smoothness of
stator and rotor blade surfaces and their shapes. These
surfaces can be roughened by erosion, but more frequently by
fouling.
The shapes of compressor blades are also changed from its
design shape by fouling.
An axial compressor is a machine where the aerodynamic
efficiency of each stage depends on that of the previous stages.
Thus, when fouling occurs in the inlet guide vanes and the first
few stages, there may be a dramatic decrease in compressor
efficiency.
The effects of compressor fouling are decrease of airflow,
pressure ratio, and compressor efficiency, resulting in a
decrease in power output and thermal efficiency.
Airflow is reduced by 5% due to the compressor fouling, which
will reduce output by 13% and increase heat rate by 5.5%.
The output of a gas turbine can be reduced as much as 20% by
fouling .
Fouling Effects in terms of Performance
Deterioration of GT performance due to compressor blade fouling
Hea
t ra
te
incre
ase
, %
Ou
tpu
t
de
cre
ase, %
Pressure ratio decrease, %
-1 -2 -3 -4 -5 -6 -7 -8
-2
-4
-6
-8
-10
-12
-14
8
6
4
2
0
Fouling
Fouling
5% loss of
airflow
It has been estimated that the fouling is responsible for 70 to 85% of all gas turbine performance losses
accumulated during operation.
In extreme cases, fouling can also result in surge problems, as it tends to reduce the surge margin.
16. Compressor Washing [3/11]

Combined Cycle Power Plants 6. Gas Turbine Performance 90 / 101
HIoPE
Severe fouling, dried carbonaceous type
of deposits
Severe carbonaceous oily type of
deposits on 1st stage vanes. Fouling
mainly caused by oil leaks in the bearing
system
Pre
ssu
re r
atio
Fouled
Mass flow
Design
point
Heavy stage
loading
Light stage
loading
Surge line
Compressor Fouling
16. Compressor Washing [4/11]

Combined Cycle Power Plants 6. Gas Turbine Performance 91 / 101
HIoPE
Disposition for Compressor Fouling
Fouling is best controlled by a combination of two methods. The first one is to employ a high quality air
filtration system. Recently, fouling problems have reduced dramatically by the employment of HEPA (High
Efficiency Particulate Air) filters, which can remove 99.95-99.97% of 0.3 µm particles.
However, as fouling will inevitably occur, compressor washing should be used to control its impact.
In general, water washing is employed to remove the fouling. Under extreme fouling conditions, however,
hand washing of the IGVs may have to be conducted. During overhauls, hand cleaning of the full axial
compressor is most effective.
Previously, abrasive cleaning using crushed nutshells had been employed for compressor cleaning.
However, abrasive cleaning is not recommended anymore because it can damage compressor blade
coatings and compressor blade surface finish. Moreover, abrasive cleaning compounds are also a potential
cause of plugged cooling passages.
16. Compressor Washing [5/11]
Before water
washing
After water
washing
Silica deposits resulting from untreated water
used for evaporative cooling of the compressor
inlet air are difficult to remove.
The various impurities can be washed by
condensed water at bell mouth. The droplets
and wet blade and end-walls become acidic
due to the scrubbed pollutants, such as CO2,
SO2, NOx, HCl, and Cl2. Therefore, corrosion
risk is elevated and protective coatings are
required.

Combined Cycle Power Plants 6. Gas Turbine Performance 92 / 101
HIoPE
On/off-line washing system diagram (GE)
Water washing piping system (GE)
On-line water washing (GE 7EA)
16. Compressor Washing [6/11]

Combined Cycle Power Plants 6. Gas Turbine Performance 93 / 101
HIoPE
Off-line wash (Siemens) On-line wash (Siemens)
16. Compressor Washing [7/11]
Off-line wash nozzles
On-line wash nozzles

Combined Cycle Power Plants 6. Gas Turbine Performance 94 / 101
HIoPE
There are two water wash systems performed on
gas turbines: on-line and off-line (crank wash).
On-line washing with the machine running at full
speed and loaded.
On-line is not as effective as off-line but on-line
washing is performed with the unit in full
operation, and outages or shutdown periods are
not required.
On-line washing is now very popular as a means
to control fouling by avoiding the problem from
developing.
The primary purpose of on-line washing is to
extend the operating period between off-line
washes by minimizing the compressor fouling,
thereby to provide peak availability.
On-line Washing
16. Compressor Washing [8/11]
Pow
er
outp
ut, %
of
new
cle
an
machin
e
Operating hours 1000
100
97
94
91
0 8 16 24 32 88
On-line cleaning is straightforward but because the temperature increases through the compressor, the
cleaning solution evaporates and cleaning is limited to the first compressor rows. Fortunately, fouling of the
first stage guide vane is the primary cause of reduced air mass flow through the compressor.
On-line washing has become increasingly important with base load combined cycle plants and CHP plants.
On-line cleaning has a risk of getting dirt particles into the secondary air system.

Combined Cycle Power Plants 6. Gas Turbine Performance 95 / 101
HIoPE
Off-line washing is better suited to large, modern gas turbines because it is more effective. Normally, off-line
washing removes particulate matter and sticky coating on blades. On-line washing removes particulate
matter.
However, it requires shutting down and cooling the engine.
Off-line washing with the machine on crank.
Off-line involves injecting the cleaning solution into the compressor while it is turning at cranking speed (=
850 rpm for 7FA+e).
The downtime for a crank wash depends mainly on the time it takes for cooling the engine. In order to avoid
thermal shock, wheel spacer temperatures must be below 200F.
Larger heavy-duty engines can take 8 to 10 hours to cool whereas on light aeroderivative engines only 1.5
to 3 hours may be needed due to its low metal mass.
Optimal compressor washing can normally be achieved by adopting a combined program of regular and
routine on-line washing (every few days or weekly), plus periodic offline washing during planned outages.
Typical on-line cleaning cycles are in the order of 10 to 20 minutes.
Off-line Washing
16. Compressor Washing [9/11]

Combined Cycle Power Plants 6. Gas Turbine Performance 96 / 101
HIoPE
Off-line Washing On-line Washing
• Objective: To clean a dirty compressor
• Objective: To keep a clean compressor cleaner for
longer. To extend operating period between off-line
cleaning, thus enhancing availability.
• Virtually full power recovery (approaches new and
clean values)
• About 1% power can be recovered per wash, with a
frequent on-line cleaning program
• Reaches all compressor stages • Primarily cleans the IGVs (no effect after water
evaporates)
• Involves shutdown and cool-down period (8 to 10
hours) • No shutdown
• Lost revenue during shutdown • No lost revenue
• Optimum time for cleaning may not be convenient,
especially with base load plants • Optimum cleaning frequency is site specific
• Effluent water for disposal • No effluent water for disposal
• Maintains safe margin to surge line
• Reduce risk of blade corrosion
16. Compressor Washing [10/11]

Combined Cycle Power Plants 6. Gas Turbine Performance 97 / 101
HIoPE
Benefits of Compressor Washing
• Restoration of lost performance
• Maintaining higher efficiency
• Compliance with environmental regulations
• Increased availability and reliability
• Longer life expectancy
• Reduced O&M costs
• Reduction of gas turbine fuel consumption
16. Compressor Washing [11/11]

Combined Cycle Power Plants 6. Gas Turbine Performance 98 / 101
HIoPE
For a MS7001E unit, a rub of 20 mils on
the labyrinth seal teeth equates to at
least 1.0% loss in unit performance.
To increase unit performance and to
reduce the rate of performance
degradation due to wear on labyrinth seal
teeth, a wire brush seal has been
employed.
Since the wire brush seal is flexible and
will bend (not wear) on contact with the
compressor aft shaft, a closer clearance
can be allowed for the initial installation.
Since the wire brush seal will “bounce back” to its original configuration after a “rub,” there will be
substantially less performance degradation over time than for the original labyrinth seal.
Performance improvement is typically about 1% output and 0.5% heat rate.
High Pressure Packing Brush Seal GER-3571H
17. Seal Rubbing [1/3]

Combined Cycle Power Plants 6. Gas Turbine Performance 99 / 101
HIoPE
Stage 2 Nozzle Inner Diaphragm Brush Seal GER-3571H
There is a large gap between the
stage 2 nozzle inner diaphragm and
the stage 1-2 wheel spacer to prevent
any contact due to rotor vibration,
thermal transients or nozzle deflection.
A brush seal has also been employed
to improve the inner stage packing
seal.
This seal is available for all single
shaft designs and provides a
performance improvement of
approximately 1% output and 0.5%
heat rate.
17. Seal Rubbing [2/3]

Combined Cycle Power Plants 6. Gas Turbine Performance 100 / 101
HIoPE
Stage 2 and 3 Shroud Honeycomb Seal
To avoid bucket tip rub, the clearance between
the bucket tip and stationary shroud blocks
have always been about 100 mils.
This large clearance allows a significant
amount of hot gas to flow over the bucket tip,
resulting in significant performance loss.
The honeycomb material is softer than the
shroud and bucket material, which makes it
sacrificial in nature for this application.
The bucket tip shroud labyrinth seals are
designed to cut a groove into the honeycomb
material. The clearance between the bucket tip
and the honeycomb shroud seals provide a
performance improvement up to 0.6% in both
output and heat rate.
GER-3571H
17. Seal Rubbing [3/3]

Combined Cycle Power Plants 6. Gas Turbine Performance 101 / 101
HIoPE
질의 및 응답
작성자: 이 병 은 (공학박사) 작성일: 2015.02.11 (Ver.5) 연락처: [email protected]
Mobile: 010-3122-2262 저서: 실무 발전설비 열역학/증기터빈 열유체기술