6 sheet and answers mechanical behavior ahmedawad
DESCRIPTION
Mechanical BehaviourTRANSCRIPT

Ain Shams University
Faculty of Engineering
New Program
6th assignment
Presented to: Dr. Nahed Abd El-Salam
Presented by: Ahmed Hassan Ibrahim
Mostafa sherif Ibrahim
S.MANF

4.6 Engineering stress strain curve data are plotted in Fig. P4.6 for the initial portion of a tension
test on 7075-T651 aluminum . Note that that the data points A and B are labeled with their stress
strain coordination.
(a)- obtain the approximation value of the elastic modulus
E =𝜎
𝜀=
326 𝑀𝑃𝑎
0.00474= 68,776 𝑀𝑃𝑎 = 68.776 𝐺𝑃𝑎
E=68.8 GPa
(B) If a sample of this material is strained to point B and then unloaded, what is the plastic (permanent) strain that remains after unloading?
From graph 𝜀𝑝 = 0.017
(C) If a bar of this material 150 mm long is strained to point A and then unloaded, what is it-s
length at point A and also after unloading?
𝜀 =∆𝐿
𝐿𝑜 , 𝐿𝑜 = 150 𝑚𝑚 , ∆𝐿 = 𝜀𝐿𝑜 = (0.00474)(150 𝑚𝑚) = 0.711 𝑚𝑚
𝐿𝑎𝑡 𝑝𝑜𝑖𝑛𝑡 𝑎 = 𝐿𝑜 + ∆𝐿 = 150 𝑚𝑚 + 0.711 𝑚𝑚 = 150.711 𝑚𝑚
After un loaded L = Li = 150 mm ( whiten the elastic zone )
LA = 150.711 mm
(d) Repeat (c), but with the bar loaded instead to point B
𝜀 =∆𝐿
𝐿𝑜 , 𝐿𝑜 = 150 𝑚𝑚 , ∆𝐿 = 𝜀𝐿𝑜 = (0.0252)(150 𝑚𝑚) = 3.78 𝑚𝑚
𝐿𝑎𝑡 𝑝𝑜𝑖𝑛𝑡 𝐵 = 𝐿𝑜 + ∆𝐿 = 150 𝑚𝑚 + 3.78𝑚𝑚 = 153.78 𝑚𝑚
After unloading :
∆𝐿 = 𝜀𝑝𝐿𝑜 = (0.017)(150 𝑚𝑚) = 2.55𝑚𝑚
𝐿𝑎𝑡 𝑝𝑜𝑖𝑛𝑡 𝐵 𝑎𝑓𝑡𝑒𝑟 𝑢𝑛𝑙𝑜𝑎𝑑𝑖𝑛𝑔 = 𝐿𝑜 + ∆𝐿 = 150 𝑚𝑚 + 2.55 = 152.55 𝑚𝑚

4.7 Engineering stress-strain data from a tension test on AISI 4140 steel tempered at 538°C (1000℉) are listed in Table P4.7 and plotted in Fig.P4.7. Curve 1 shows the initial Part of the data plotted at a sensitive strain scale, and Curve 2 shows all of the data to fracture. The diameter before testing was 8.56mm, and after fracture the minimum diameter in the necked region was 6.17 mm, Determine the following: elastic modulus 0.2 % offset yield strength, ultimate tensile strength, percent elongation, and percent reduction in area.
𝝈, 𝑴𝑷𝒂 𝜺, % 𝝈, 𝑴𝑷𝒂 𝜺, % 0 0 1207 2.98 331 0.156 1217 3.85 669 0.315 1221 4.77 1022 0.493 1200 6.02 1140 0.554 1129 7.51 1175 0.581 2045 9.03 1167 0.776 944 10.60 1177 1.294 829 12.00 1193 2.16
Final point is the fracture
Elastic modulus : from graph E =𝜎
𝜀=
1022 𝑀𝑃𝑎
0.00493= 207302.23 𝑀𝑃𝑎 = 207.3 𝐺𝑃𝑎
E = 207.3 GPa
0.2% offset yield strength : from graph 𝜎𝑦 = 1800 𝑀𝑃𝑎
Ultimate tensile strength : from graph 𝜎𝑈 = 1221 𝑀𝑃𝑎
percent elongation from graph :
11.6 % percent reduction in area
=𝑑𝑖
2 − 𝑑𝑓2
𝑑𝑖2 =
8.562 − 6.172
8.562
= 0.48 = 48 %
0
200
400
600
800
1000
1200
1400
0 0.002 0.004 0.006 0.008 0.01
0
200
400
600
800
1000
1200
1400
0 0.02 0.04 0.06 0.08 0.1 0.12 0.14
stre
ss (
Mp
a)
strain
fracture point
ultimate point

0
100
200
300
400
500
600
700
0 0.05 0.1 0.15 0.2
stre
ss (
Mp
a)
strain
fracture point
ultimate point
4.8 Engineering stress-strain data from a tension test on 7075-T651 aluminum are given in P4.8. The diameter before testing was 9.07 mm, and after fracture the minimum diameter in the necked region was 7.78 mm. Determine the following: elastic modulus, 0.2% offset yield strength, ultimate tensile strength, percent elongation, and percent reduction in area.
Table P4.8
𝝈, MPa 𝜺, % 𝝈, MPa 𝜺, %
0 0 557 1.819 112 0.165 563 2.30 222 0.322 577 4.02 326 0.474 587 -5.98 415 0.605 593 8.02 473 0.703 596 9.52 505 0.797 597 10.97
527 0.953 597 12.50 542 1.209 ' 591 13.90 551 1.498 571 15.33
(Final point is fracture.)
- elastic modulus E =𝜎
𝜀=
200 𝑀𝑃𝑎
0.003= 66,666.67 𝑀𝑃𝑎 = 66.7 𝐺𝑃𝑎
- 0.2% offset yield strength : from graph
𝜎𝑦=527 MPa
- ultimate tensile strength : from graph
𝜎𝑢 = 597 𝑀𝑃𝑎
- percent elongation = 14.5 %
- percent reduction in area
=𝑑𝑖
2 − 𝑑𝑓2
𝑑𝑖2 =
9.072 − 7.782
9.072
= 0.264 = 26.4%
0
100
200
300
400
500
600
0 0.005 0.01 0.015 0.02 0.025

4.9 Engineering stress-strain data from a tension test on a near-K titanium aluminidc, Ti-48A1-2Mn-2Cr (atomic percentages), are given in Table P4.9. Determine the following: elastic modulus, 0,2% offset yield strength. ultimate tensile strength, percent total elongation, and percent plastic elongation. Linear behavior is observed up to the first nonzero data point given. [Data courtesy of S. I.. Kampe; see |Kampe94].)
Table P4.9
(Final point is
fracture.)
- elastic modulus E =𝜎
𝜀=
255 𝑀𝑃𝑎
0.00164= 66,666.67 𝑀𝑃𝑎 = 66.7 𝐺𝑃𝑎
- 0.2% offset yield strength : from graph 𝜎𝑦=527 MPa
- ultimate tensile strength : from graph 𝜎𝑢 = 523 𝑀𝑃𝑎
- percent elongation = 0.48 %
𝝈, MPa 𝜺, % 0 0 255 0.164 332 0.226 389 0.300 432 0.377
472 0.503 495 0.618 514 0.73O 523 0.816
0
100
200
300
400
500
600
0 0.002 0.004 0.006 0.008 0.01
stre
ss M
pa
strain
ultimate point fracture point

4.10 Engineering stress-strain data from a tension test on HOPE polymer arc listed in Table P4.10 plotted in Fig. P4.10. Curve I shows the Initial part of the data plotted at a sensitive scale, and Curve 2 shows all of the data until the extensometer had to be removed as measurement was approaching its 50% strain capacity. The specimen had a rectangular cross section with original dimensions width 12.61 and thickness 2.25 mm. After the eucnsometer was removed, the specimen continued to deform under approximately constant force until the test was stopped without fracture having occurred. The force when the test was stopped was 0.503kN. After testing, the dimensions were width 5.16 and thickness 0.60mm. and gage marks originally 50mm apart had stretched to 531 mm. Determine the following: elastic modulus, yield strength, ultimate tensile strength, percent elongation, and percent reduction in area.
𝝈, MPa 𝜺, % 𝝈, MPa 𝜺, % 0 0 26.7 7.71
3.69 0.217 27.0 9.52 6.67 0.431 26.8 12.06
11.21 0.833 26.2 15,86 15.99 1.451 25.4 19.85 19.96 2.32 24.1 26.2
23.0 3.47 22.6 33.2 24.6 4,45 20.8 39.4 26.0 6,03 18.64 46.1
- elastic modulus E =𝜎
𝜀=
3.69 𝑀𝑃𝑎
0.00217= 1,700.46 𝑀𝑃𝑎 = 1.7 𝐺𝑃𝑎
- yield strength : from graph
𝜎𝑦 = 27 𝑀𝑃𝑎
- stress at fracture: 𝜎𝑢 =0.503 𝑘𝑁
12.61 𝑚𝑚 ×2.25 𝑚𝑚 = 17.72 𝑀𝑃𝑎
- percent elongation
=𝐿 −𝐿𝑖
𝐿𝑖 =
535−50
50= 970 %
- percent reduction in area
=𝐴𝑖
− 𝐴𝑓
𝐴𝑖 =
(12.6 × 2.25) − (5.16 × 0.6)
(12.6 × 2.25)= 89.1 %
0
5
10
15
20
25
30
0 0.1 0.2 0.3 0.4 0.5
stre
ss M
Pa
strain
ultimate point

4.11 Engineering stress strain data from a tension lest on polycarbonate are given in P4.ll. Data acquisition was terminated when the extensometer had to be removed as the measurement was approaching its 50% strain capacity. The specimen had a rectangular section with original dimensions width 12.54 and thickness 2.00 mm. After fracture, dimension were width 10.09 and thickness 1.37 mm. Gage marks originally 50 mm apart had stretched to 85.5 mm after fracture, which occurred at a force of 1.466 kN. Determine the following :elastic modulus, yield strength, ultimate tensile strength, percent elongation, and percent reduction in area
𝝈, MPa 𝜺, % 𝝈, MPa 𝜺, %
0 0 60,8 8.44 10.81 0.427 56.3 9.80 21.8 0.9O6 49.7 10.98
31.5 1.388 48.2 12.22 39.8 1.895 47.5 13.32 48.8 2.63 46.8 1491 55.7 3.47 47.2 19.88 60.3
62.5 4.40 5.23
48.1 48.8
28.8 38.6
63.3 6.21 49.2 48.5 63.0 7.00
- elastic modulus E =𝜎
𝜀=
10.81 𝑀𝑃𝑎
0.00427= 2,531.615 𝑀𝑃𝑎 = 2.5 𝐺𝑃𝑎
- yield strength : from graph
𝜎𝑦 = 63.3 MPa
- stress at fracture: 𝜎𝑢 =1.466 𝐾𝑁
(12.54𝑚𝑚×2𝑚𝑚) = 58.8755𝑀𝑃𝑎 stress at fracture
- percent elongation
=𝐿 −𝐿𝑖
𝐿𝑖 =
85.5−50
50= 71 %
- percent reduction in area
=𝐴𝑖
– 𝐴𝑓
𝐴𝑖 =
(12.54 × 2) − (10.09 × 1.37)
(12.54 × 2)
= 44.88 %
0
10
20
30
40
50
60
70
0 0.1 0.2 0.3 0.4 0.5 0.6
stre
ss
strain
yield point

4.19 For a number of points during a tension test on Man-Ten steel, engineering stress and strain data are given in Table P4.20. Also given are minimum diameters measured in the necked region in the latter portions of the test. The initial diameter was 6.32 mm.
.
(a) Evaluate the following engineering stress-strain properties: elastic modulus, yield strength, ultimate tensile strength, and percent reduction in area,
- elastic modulus E =𝜎
𝜀=
68.1 𝑀𝑃𝑎
0.001= 68,100 𝑀𝑃𝑎 = 68.1 𝐺𝑃𝑎
- 0.2% offset yield strength : from graph
𝜎𝑦 = 125 MPa
- ultimate tensile strength : from graph 𝜎𝑢 =141.1530877 𝑀𝑃𝑎
- percent elongation
= 16.8 %
- percent reduction in area
=𝑑𝑖
2 − 𝑑𝑓2
𝑑𝑖2 =
9.072 − 4.062
9.072
= 80%
Force P, KN
Length Change L , mm
Diameter d , mm
0 0 9.07 4.4 0.05 6.80 0.10 8.15 0.20 8.55 0.40 9.12 1.81 8.89 8.93 4.11 8.38 7.94 5.93 7.11 6.18 7.36 5.59 4.00 8.50 4.06
0
20
40
60
80
100
120
140
0 0.002 0.004 0.006 0.008 0.01
0
20
40
60
80
100
120
140
160
0 0.05 0.1 0.15 0.2
stre
ss
strain

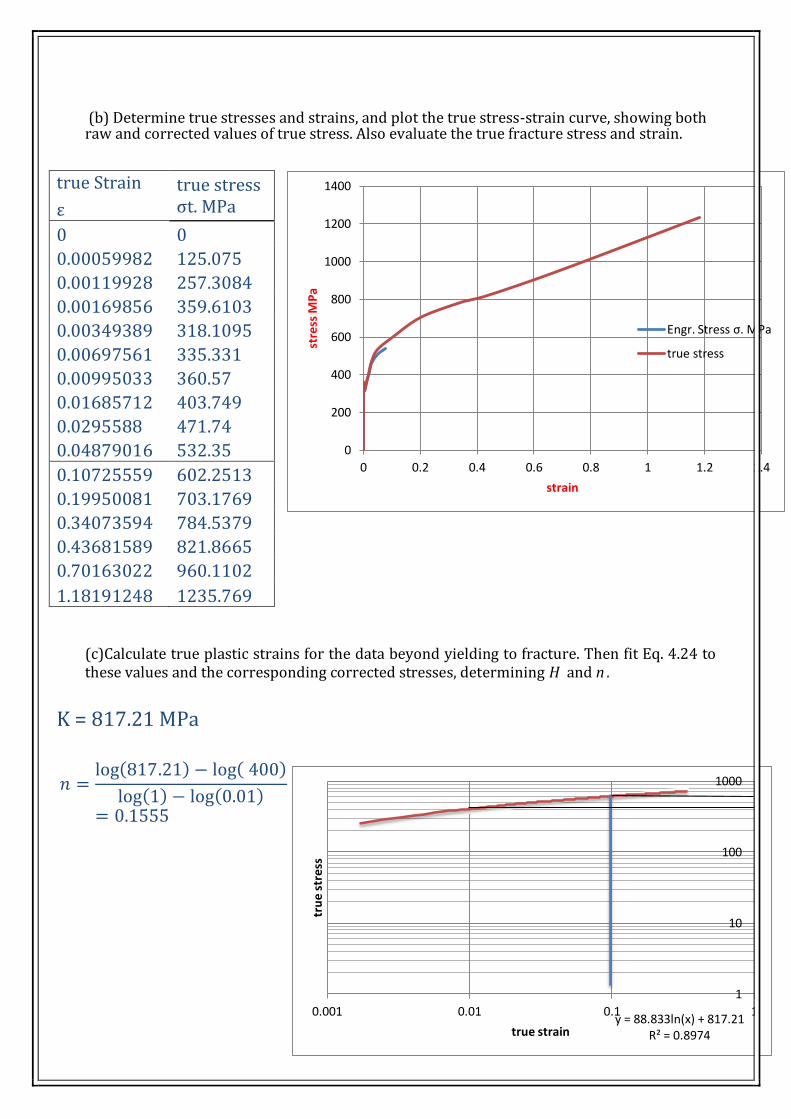
(b) Determine true stresses and strains, and plot the true stress-strain curve, showing both raw and corrected values of true stress. Also evaluate the true fracture stress and strain.
true strain
true stress
0 0
0.001 68.16827
0.001998 105.4562
0.003992 126.6447
0.007968 133.3897
0.04009 146.9269
0.158249 161.91
0.48694 199.9822
0.967986 251.8112
1.607579 308.9712
(c) Calculate true plastic strains for the data beyond yielding to fracture. Then fit Eq. 4.24 to these values and the corresponding corrected stresses, determining H and n
Plastic strain =εtrue- σt/E
σt=Kεn
from graph ::
K = 180 MPa
𝑛 =log(155) − log ( 129)
log(1) − log(0.01)= 0.0398 ? ? ? ?
plastic strain
0
0
0.000449453
0.002132335
0.006009437
0.037932912
0.155871167
0.484003444
0.964288286
1.603041559
0
50
100
150
200
250
300
350
0 0.2 0.4 0.6 0.8 1 1.2 1.4 1.6 1.8
stre
ss M
Pa
strain
engineering stress strain
true stress strain
y = 5.5012ln(x) + 155.14R² = 0.7928
1
10
100
1000
0.0001 0.001 0.01 0.1 1

4.20 For a number of points during a tension test on Man-Ten steel, engineering stress and strain data are given in Table P4.20. Also given are minimum diameters measured in the necked region in the latter portions of the test. The initial diameter was 6.32 mm.
Table P4.20
Diameter Engr. Strain
ε
Engr. Stress
d, mm σ. MPa
6.32 0 0
— 0.0006 125
— 0.001 257
— 0.002 359
— 0.004 317
— 0.007 333
— 0.01 357
— 0.017 397
— 0.03 458
— 0.O50O 507
5.99 0.079 541
5.72 576
5.33 558
5.08 531
4.45 476
3.50 379
(a) Evaluate the following engineering stress-strain properties: elastic modulus, yield strength, ultimate tensile strength, and percent reduction in area,
- elastic modulus E =𝜎
𝜀=
250 𝑀𝑃𝑎
0.0012= 208,333.33 𝑀𝑃𝑎 = 208.3 𝐺𝑃𝑎
- 0.2% offset yield strength : from graph
𝜎𝑦 = 320 MPa
- ultimate tensile strength : from graph 𝜎𝑢 =359 𝑀𝑃𝑎
- percent reduction in area
=𝑑𝑖
2 − 𝑑𝑓2
𝑑𝑖2 =
6.322 − 3.52
6.322
= 69.3%
0
50
100
150
200
250
300
350
400
0 0.002 0.004 0.006 0.008
(b) Determine true stresses and strains, and plot the true stress-strain curve, showing both raw and corrected values of true stress. Also evaluate the true fracture stress and strain.
(c)Calculate true plastic strains for the data beyond yielding to fracture. Then fit Eq. 4.24 to these values and the corresponding corrected stresses, determining H and n .
K = 817.21 MPa
𝑛 =log(817.21) − log( 400)
log(1) − log(0.01)
= 0.1555
true Strain true stress
ε σt. MPa
0 0
0.00059982 125.075
0.00119928 257.3084
0.00169856 359.6103
0.00349389 318.1095
0.00697561 335.331
0.00995033 360.57
0.01685712 403.749
0.0295588 471.74
0.04879016 532.35
0.10725559 602.2513
0.19950081 703.1769
0.34073594 784.5379
0.43681589 821.8665
0.70163022 960.1102
1.18191248 1235.769
0
200
400
600
800
1000
1200
1400
0 0.2 0.4 0.6 0.8 1 1.2 1.4
stre
ss M
Pa
strain
Engr. Stress σ. MPa
true stress
y = 88.833ln(x) + 817.21R² = 0.8974
1
10
100
1000
0.001 0.01 0.1 1
tru
e s
tre
ss
true strain

4.32 Vickers hardness and tensile data are listed in Table P4.32 for AISI 4140 steel that has been heat treated to various strength levels by varying the tempering temperature. Plot the hardness and the various tensile properties all as a function of tempering temperature. Then discuss the trends observed. How do the various tensile properties vary with hardness?
Temper, °C 20.-5 315 425 540 650 Hardness, H V 619 535 468 399 300 Ultimate. σu MPa 2053 1789 1491 1216 963 Yield. σy MPa 1583 1560 1399 1158 872 Red. in Area, % RA 7 33 38 48 55
4.38 What characteristics are needed for material for steel ball bearings? What materials tests would be important in judging the suitability of a given steel for this use ? This material can be easily drilled, threaded, and otherwise machined with conventional chip making machines.
Life Testing
Impact Testing
Hardness Test
Corrosion Test
Magnetic Test
0
500
1000
1500
2000
2500
0 100 200 300 400 500 600 700
Temper
Hardness, H V
Ultimate. σu MPa
Yield. σy MPa
Red. in Area, %RA
4.39 You are an engineer designing pressure vessels to hold liquid nitrogen. What general characteristics should the material to be used have? Of the various types of materials tests described in this chapter, which would you employ to aid in selecting among candidate materials? Explain the reason you need each type of test chosen.
- withstand temperature
- doesn't rust easily
- no bending
- Hardening
Establishing a correlation between the hardness result and the desired material property allows this
- compression
Different pressure in and out el vessel
- bending test
Liquid Nitrogen Properties Chemical Formula N2 Boiling Point @ 1 atm –320.5°F (–195.8°C) Melting Point @ 1 atm –346°F (–210°C) Critical Temperature –232.5°F (–146.9C) Critical Pressure 492.3 psia (33.5 atm) Density, Gas @ 68°F (20°C), 1 atm 0.0725 lb/scf Specific Volume @ 68°F (20°C), 1 atm 13.8 scf/lb Density, Liquid, @ Boiling Point, 1 atm 50.45 lb/scf Heat of Vaporization 92 Btu/lb Expansion Ratio, Liquid to Gas, BP to 68°F (20°C) 1 to 694