6.0 hibiscus and bays - hospitals & health auckland · 59 6.0 hibiscus and bays 6.1...
TRANSCRIPT
59
6.0 Hibiscus and Bays
6.1 Introduction
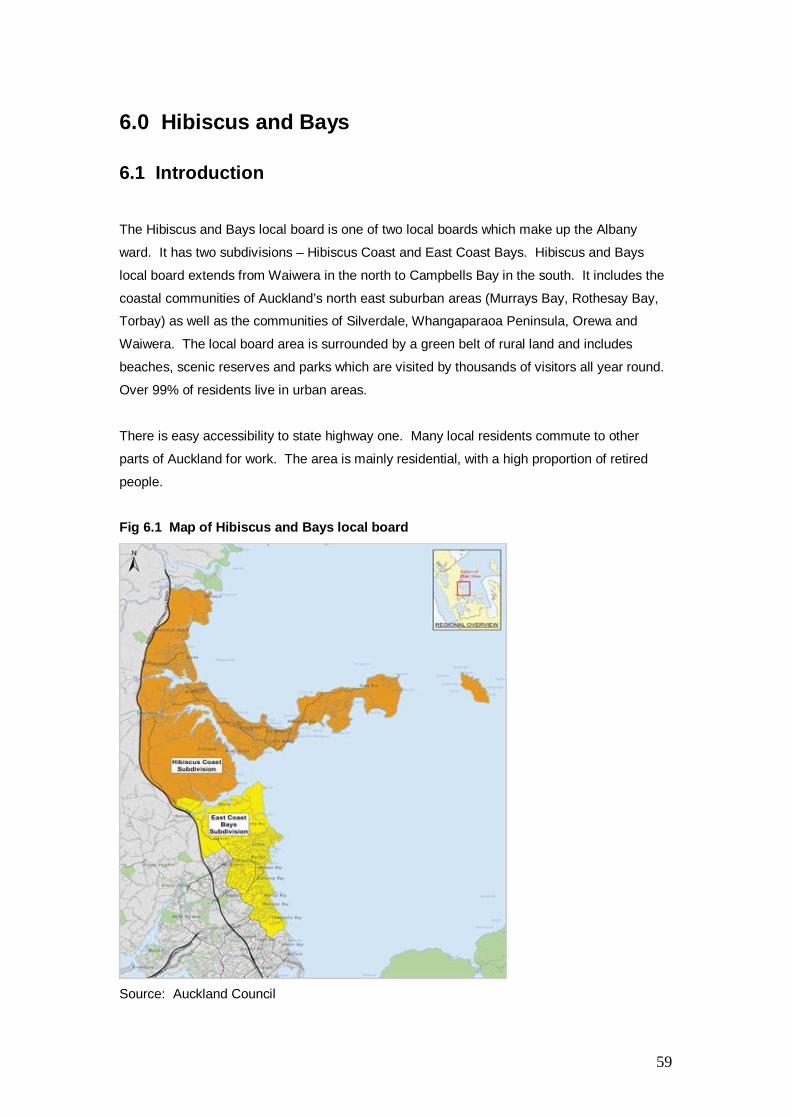
The Hibiscus and Bays local board is one of two local boards which make up the Albany
ward. It has two subdivisions – Hibiscus Coast and East Coast Bays. Hibiscus and Bays
local board extends from Waiwera in the north to Campbells Bay in the south. It includes the
coastal communities of Auckland’s north east suburban areas (Murrays Bay, Rothesay Bay,
Torbay) as well as the communities of Silverdale, Whangaparaoa Peninsula, Orewa and
Waiwera. The local board area is surrounded by a green belt of rural land and includes
beaches, scenic reserves and parks which are visited by thousands of visitors all year round.
Over 99% of residents live in urban areas.
There is easy accessibility to state highway one. Many local residents commute to other
parts of Auckland for work. The area is mainly residential, with a high proportion of retired
people.
Fig 6.1 Map of Hibiscus and Bays local board
Source: Auckland Council
60
6.2 Population and Social characteristics
6.2.1 Population
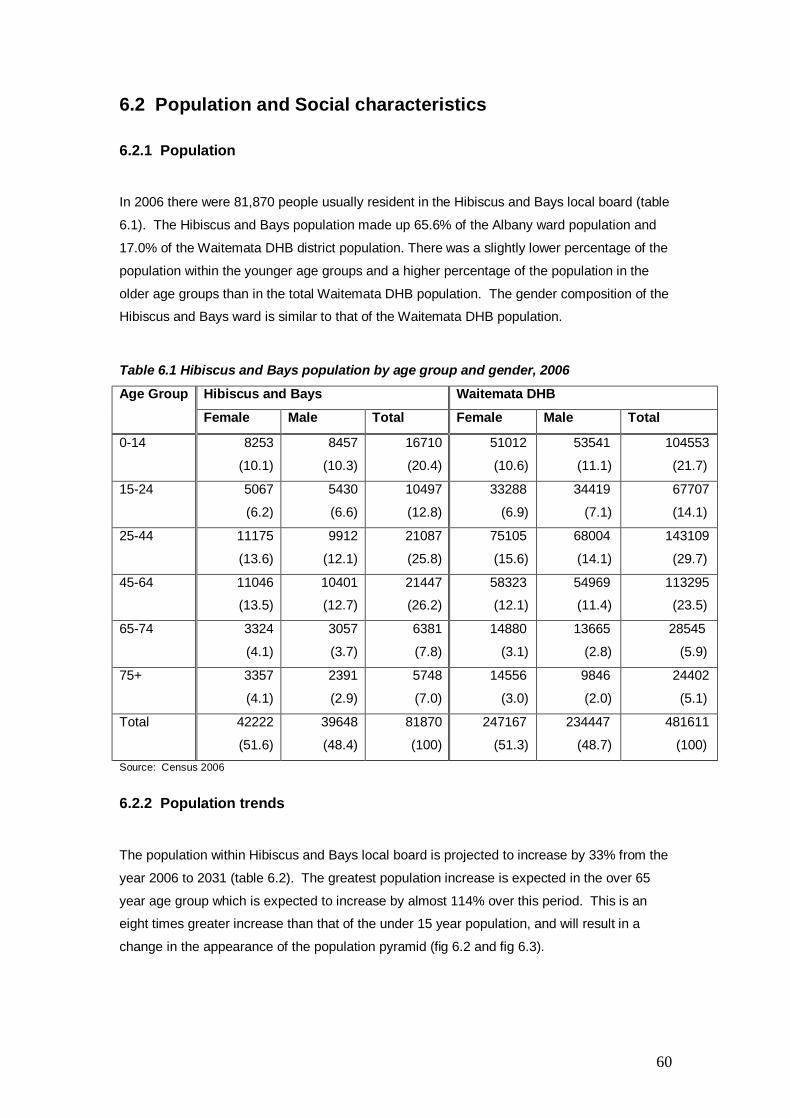
In 2006 there were 81,870 people usually resident in the Hibiscus and Bays local board (table
6.1). The Hibiscus and Bays population made up 65.6% of the Albany ward population and
17.0% of the Waitemata DHB district population. There was a slightly lower percentage of the
population within the younger age groups and a higher percentage of the population in the
older age groups than in the total Waitemata DHB population. The gender composition of the
Hibiscus and Bays ward is similar to that of the Waitemata DHB population.
Table 6.1 Hibiscus and Bays population by age group and gender, 2006
Hibiscus and Bays Waitemata DHB Age Group
Female Male Total Female Male Total
0-14 8253
(10.1)
8457
(10.3)
16710
(20.4)
51012
(10.6)
53541
(11.1)
104553
(21.7)
15-24 5067
(6.2)
5430
(6.6)
10497
(12.8)
33288
(6.9)
34419
(7.1)
67707
(14.1)
25-44 11175
(13.6)
9912
(12.1)
21087
(25.8)
75105
(15.6)
68004
(14.1)
143109
(29.7)
45-64 11046
(13.5)
10401
(12.7)
21447
(26.2)
58323
(12.1)
54969
(11.4)
113295
(23.5)
65-74 3324
(4.1)
3057
(3.7)
6381
(7.8)
14880
(3.1)
13665
(2.8)
28545
(5.9)
75+ 3357
(4.1)
2391
(2.9)
5748
(7.0)
14556
(3.0)
9846
(2.0)
24402
(5.1)
Total 42222
(51.6)
39648
(48.4)
81870
(100)
247167
(51.3)
234447
(48.7)
481611
(100) Source: Census 2006
6.2.2 Population trends
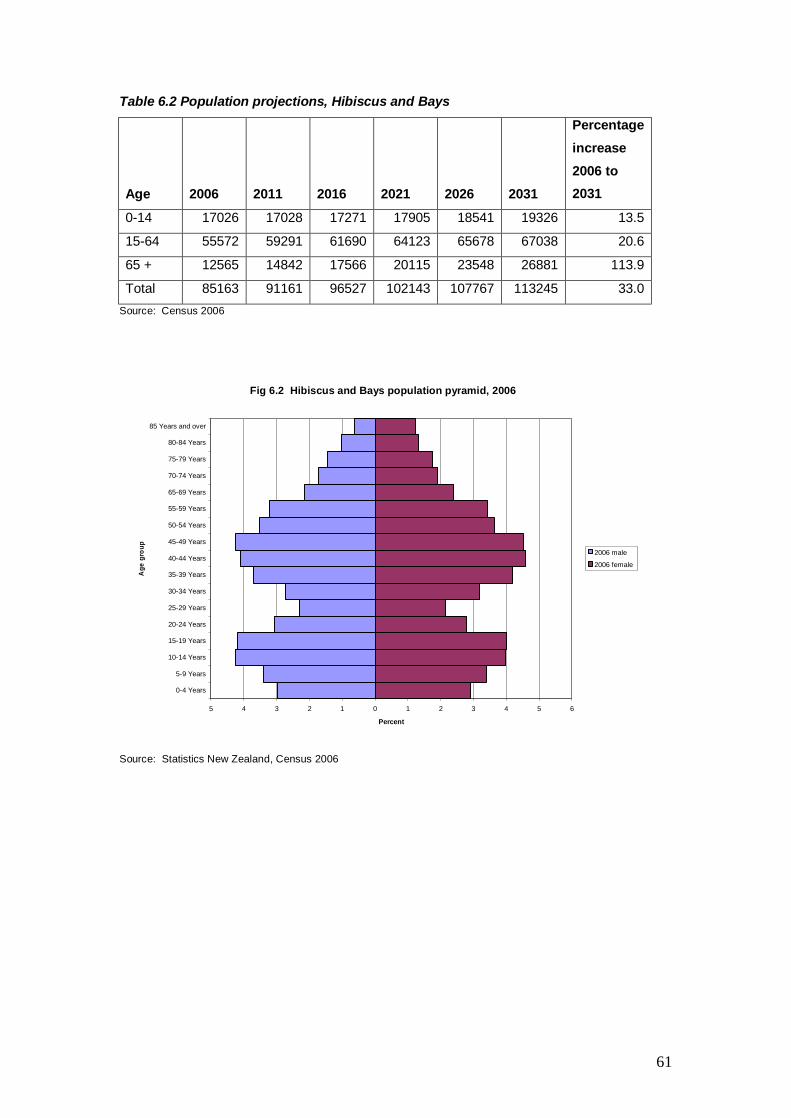
The population within Hibiscus and Bays local board is projected to increase by 33% from the
year 2006 to 2031 (table 6.2). The greatest population increase is expected in the over 65
year age group which is expected to increase by almost 114% over this period. This is an
eight times greater increase than that of the under 15 year population, and will result in a
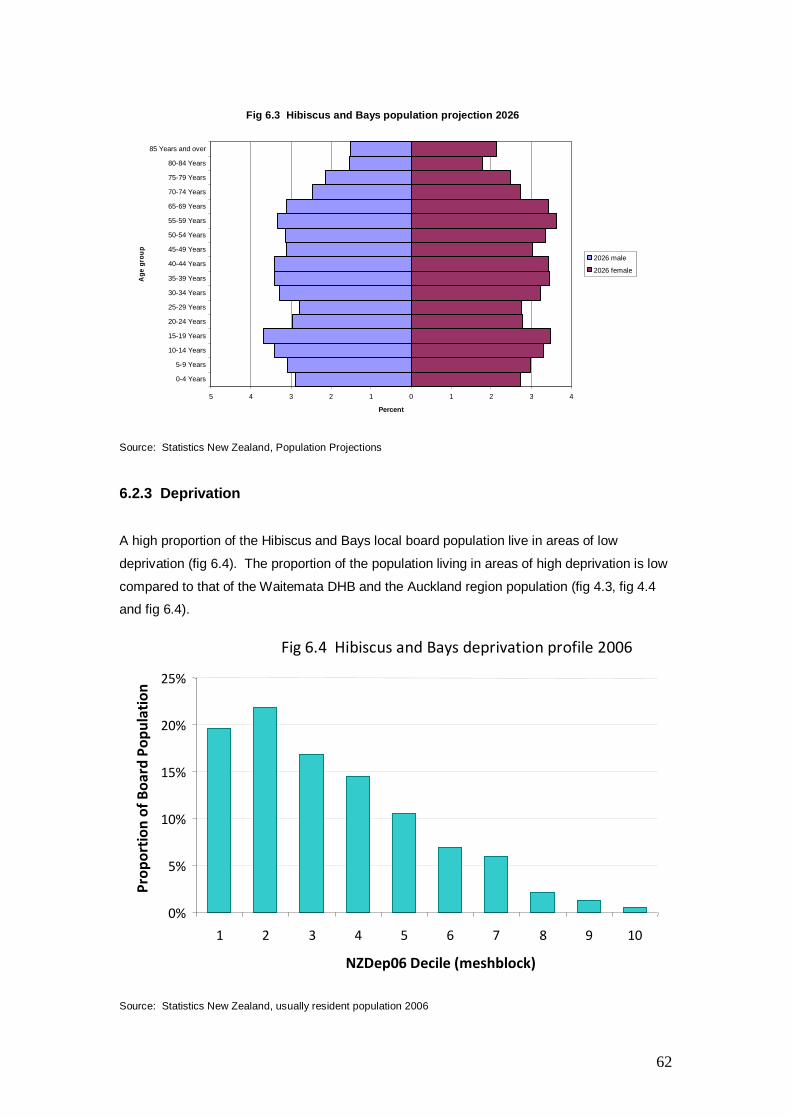
change in the appearance of the population pyramid (fig 6.2 and fig 6.3).
61
Table 6.2 Population projections, Hibiscus and Bays
Age 2006 2011 2016 2021 2026 2031
Percentage increase 2006 to 2031
0-14 17026 17028 17271 17905 18541 19326 13.5
15-64 55572 59291 61690 64123 65678 67038 20.6
65 + 12565 14842 17566 20115 23548 26881 113.9
Total 85163 91161 96527 102143 107767 113245 33.0 Source: Census 2006
Fig 6.2 Hibiscus and Bays population pyramid, 2006
5 4 3 2 1 0 1 2 3 4 5 6
0-4 Years
5-9 Years
10-14 Years
15-19 Years
20-24 Years
25-29 Years
30-34 Years
35-39 Years
40-44 Years
45-49 Years
50-54 Years
55-59 Years
65-69 Years
70-74 Years
75-79 Years
80-84 Years
85 Years and over
Age
gro
up
Percent
2006 male
2006 female
Source: Statistics New Zealand, Census 2006
62
Fig 6.3 Hibiscus and Bays population projection 2026
5 4 3 2 1 0 1 2 3 4
0-4 Years
5-9 Years
10-14 Years
15-19 Years
20-24 Years
25-29 Years
30-34 Years
35-39 Years
40-44 Years
45-49 Years
50-54 Years
55-59 Years
65-69 Years
70-74 Years
75-79 Years
80-84 Years
85 Years and overA
ge g
roup
Percent
2026 male
2026 female
Source: Statistics New Zealand, Population Projections
6.2.3 Deprivation
A high proportion of the Hibiscus and Bays local board population live in areas of low
deprivation (fig 6.4). The proportion of the population living in areas of high deprivation is low
compared to that of the Waitemata DHB and the Auckland region population (fig 4.3, fig 4.4
and fig 6.4).
Source: Statistics New Zealand, usually resident population 2006
Fig 6.4 Hibiscus and Bays deprivation profile 2006
0%
5%
10%
15%
20%
25%
1 2 3 4 5 6 7 8 9 10
NZDep06 Decile (meshblock)
Prop
orti
on o
f Boa
rd P
opul
atio
n
63
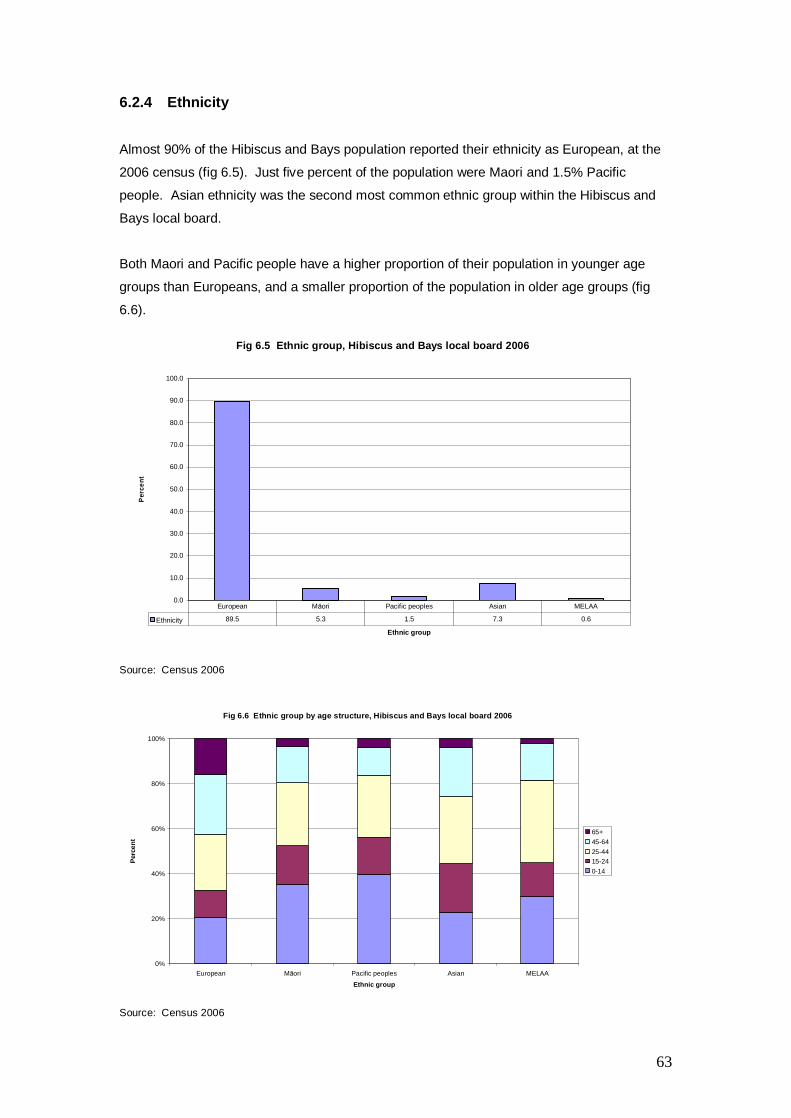
6.2.4 Ethnicity
Almost 90% of the Hibiscus and Bays population reported their ethnicity as European, at the
2006 census (fig 6.5). Just five percent of the population were Maori and 1.5% Pacific
people. Asian ethnicity was the second most common ethnic group within the Hibiscus and
Bays local board.
Both Maori and Pacific people have a higher proportion of their population in younger age
groups than Europeans, and a smaller proportion of the population in older age groups (fig
6.6).
Fig 6.5 Ethnic group, Hibiscus and Bays local board 2006
0.0
10.0
20.0
30.0
40.0
50.0
60.0
70.0
80.0
90.0
100.0
Ethnic group
Perc
ent
Ethnicity 89.5 5.3 1.5 7.3 0.6
European Māori Pacific peoples Asian MELAA
Source: Census 2006
Fig 6.6 Ethnic group by age structure, Hibiscus and Bays local board 2006
0%
20%
40%
60%
80%
100%
European Māori Pacific peoples Asian MELAA
Ethnic group
Perc
ent
65+45-6425-4415-240-14
Source: Census 2006
64
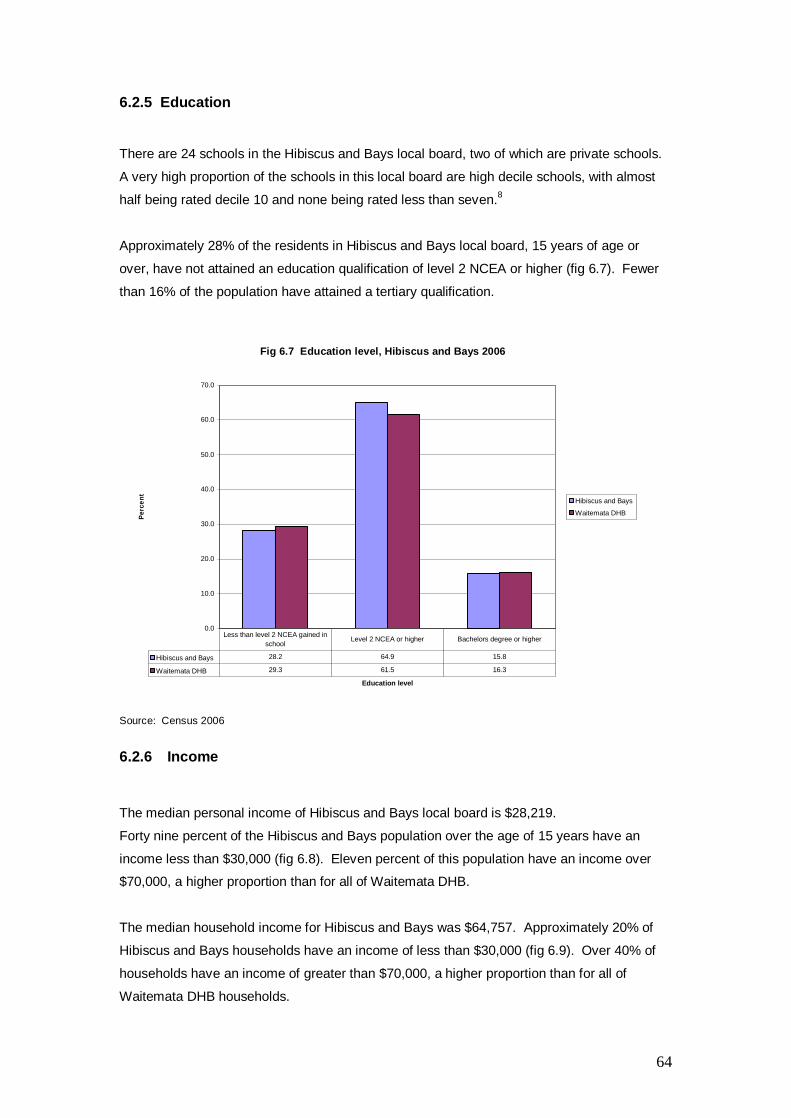
6.2.5 Education
There are 24 schools in the Hibiscus and Bays local board, two of which are private schools.
A very high proportion of the schools in this local board are high decile schools, with almost
half being rated decile 10 and none being rated less than seven.8
Approximately 28% of the residents in Hibiscus and Bays local board, 15 years of age or
over, have not attained an education qualification of level 2 NCEA or higher (fig 6.7). Fewer
than 16% of the population have attained a tertiary qualification.
Fig 6.7 Education level, Hibiscus and Bays 2006
0.0
10.0
20.0
30.0
40.0
50.0
60.0
70.0
Education level
Perc
ent
Hibiscus and Bays
Waitemata DHB
Hibiscus and Bays 28.2 64.9 15.8
Waitemata DHB 29.3 61.5 16.3
Less than level 2 NCEA gained in school
Level 2 NCEA or higher Bachelors degree or higher
Source: Census 2006
6.2.6 Income
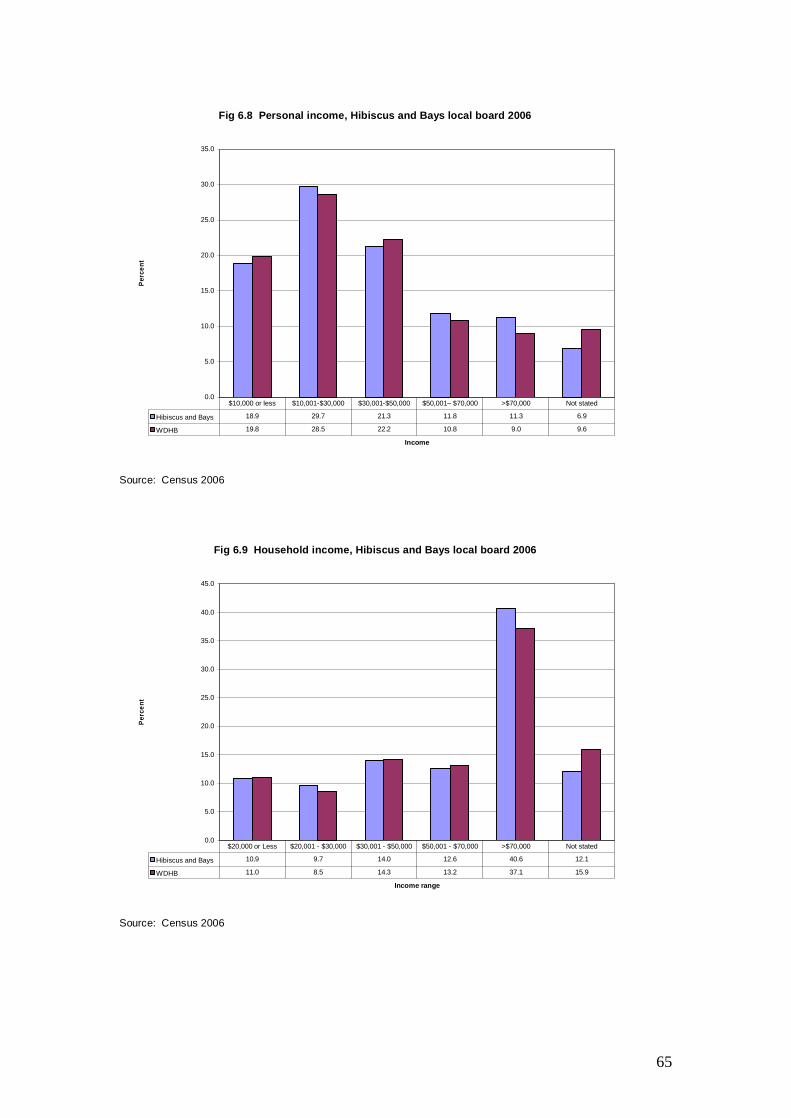
The median personal income of Hibiscus and Bays local board is $28,219.
Forty nine percent of the Hibiscus and Bays population over the age of 15 years have an
income less than $30,000 (fig 6.8). Eleven percent of this population have an income over
$70,000, a higher proportion than for all of Waitemata DHB.
The median household income for Hibiscus and Bays was $64,757. Approximately 20% of
Hibiscus and Bays households have an income of less than $30,000 (fig 6.9). Over 40% of
households have an income of greater than $70,000, a higher proportion than for all of
Waitemata DHB households.
65
Fig 6.8 Personal income, Hibiscus and Bays local board 2006
0.0
5.0
10.0
15.0
20.0
25.0
30.0
35.0
Income
Perc
ent
Hibiscus and Bays 18.9 29.7 21.3 11.8 11.3 6.9
WDHB 19.8 28.5 22.2 10.8 9.0 9.6
$10,000 or less $10,001-$30,000 $30,001-$50,000 $50,001– $70,000 >$70,000 Not stated
Source: Census 2006
Fig 6.9 Household income, Hibiscus and Bays local board 2006
0.0
5.0
10.0
15.0
20.0
25.0
30.0
35.0
40.0
45.0
Income range
Perc
ent
Hibiscus and Bays 10.9 9.7 14.0 12.6 40.6 12.1
WDHB 11.0 8.5 14.3 13.2 37.1 15.9
$20,000 or Less $20,001 - $30,000 $30,001 - $50,000 $50,001 - $70,000 >$70,000 Not stated
Source: Census 2006
66
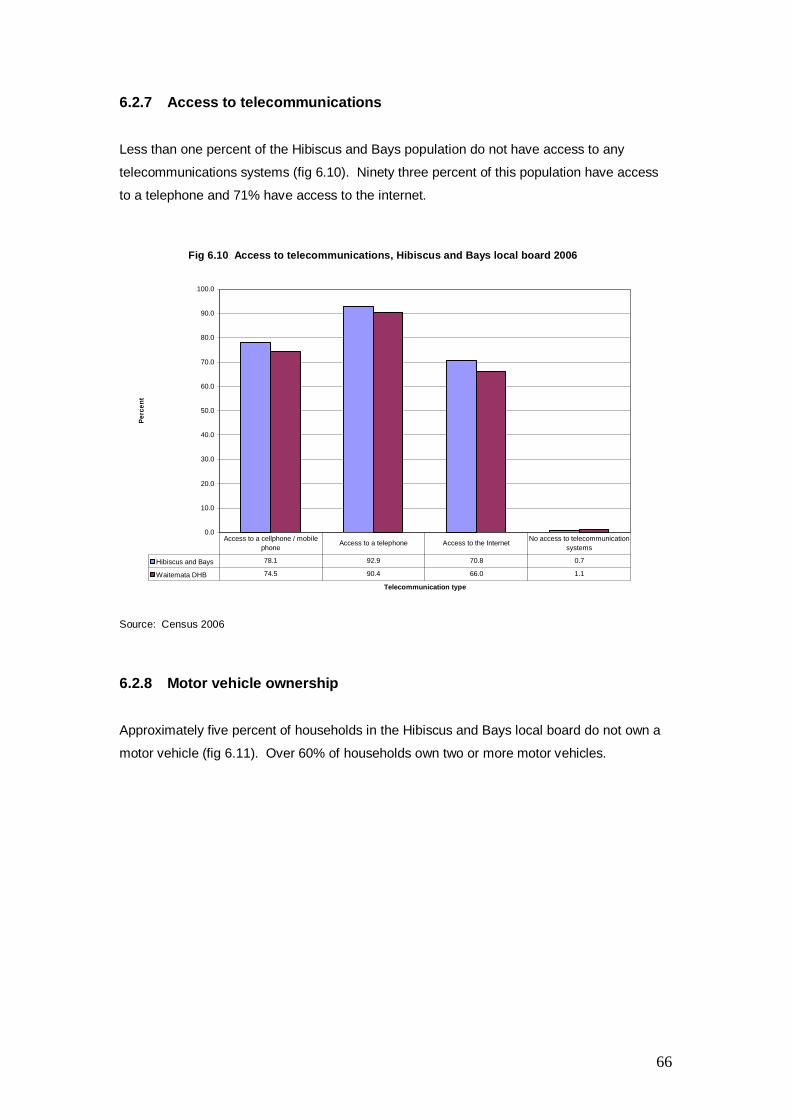
6.2.7 Access to telecommunications
Less than one percent of the Hibiscus and Bays population do not have access to any
telecommunications systems (fig 6.10). Ninety three percent of this population have access
to a telephone and 71% have access to the internet.
Fig 6.10 Access to telecommunications, Hibiscus and Bays local board 2006
0.0
10.0
20.0
30.0
40.0
50.0
60.0
70.0
80.0
90.0
100.0
Telecommunication type
Perc
ent
Hibiscus and Bays 78.1 92.9 70.8 0.7
Waitemata DHB 74.5 90.4 66.0 1.1
Access to a cellphone / mobile phone
Access to a telephone Access to the Internet No access to telecommunication systems
Source: Census 2006
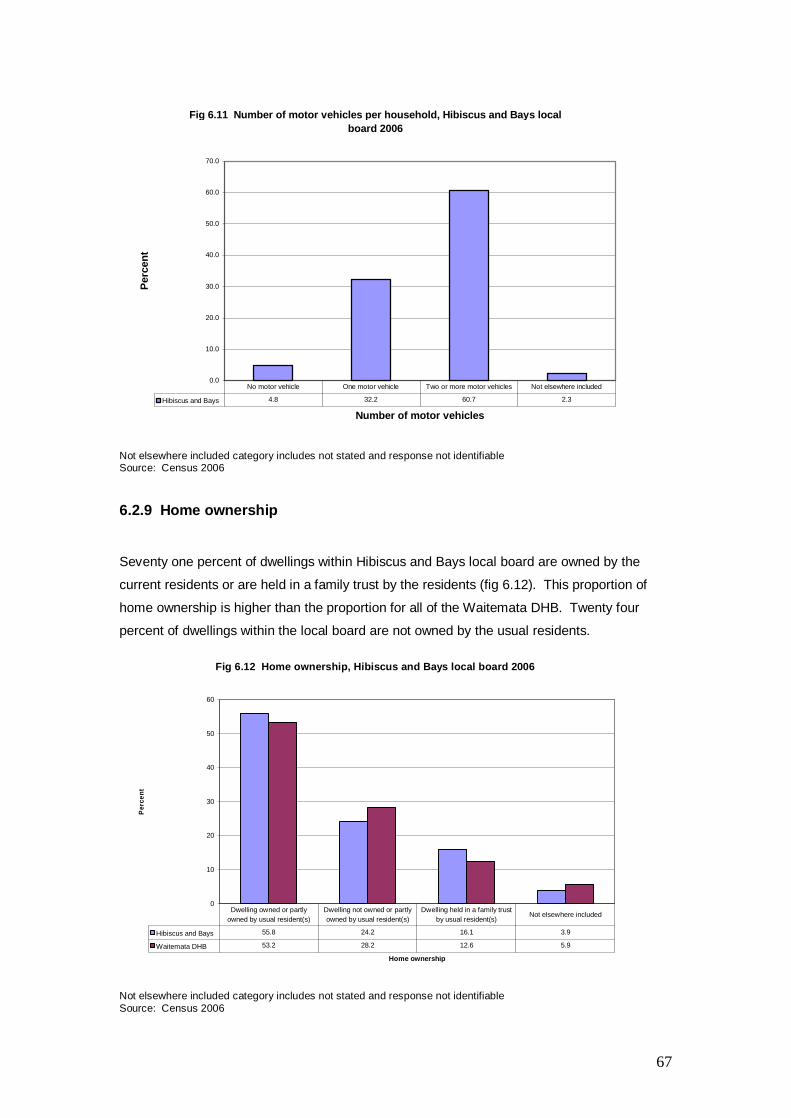
6.2.8 Motor vehicle ownership
Approximately five percent of households in the Hibiscus and Bays local board do not own a
motor vehicle (fig 6.11). Over 60% of households own two or more motor vehicles.
67
Fig 6.11 Number of motor vehicles per household, Hibiscus and Bays local board 2006
0.0
10.0
20.0
30.0
40.0
50.0
60.0
70.0
Number of motor vehicles
Perc
ent
Hibiscus and Bays 4.8 32.2 60.7 2.3
No motor vehicle One motor vehicle Two or more motor vehicles Not elsewhere included
Not elsewhere included category includes not stated and response not identifiable Source: Census 2006
6.2.9 Home ownership
Seventy one percent of dwellings within Hibiscus and Bays local board are owned by the
current residents or are held in a family trust by the residents (fig 6.12). This proportion of
home ownership is higher than the proportion for all of the Waitemata DHB. Twenty four
percent of dwellings within the local board are not owned by the usual residents.
Fig 6.12 Home ownership, Hibiscus and Bays local board 2006
0
10
20
30
40
50
60
Home ownership
Perc
ent
Hibiscus and Bays 55.8 24.2 16.1 3.9
Waitemata DHB 53.2 28.2 12.6 5.9
Dwelling owned or partly owned by usual resident(s)
Dwelling not owned or partly owned by usual resident(s)
Dwelling held in a family trust by usual resident(s)
Not elsewhere included
Not elsewhere included category includes not stated and response not identifiable Source: Census 2006
68
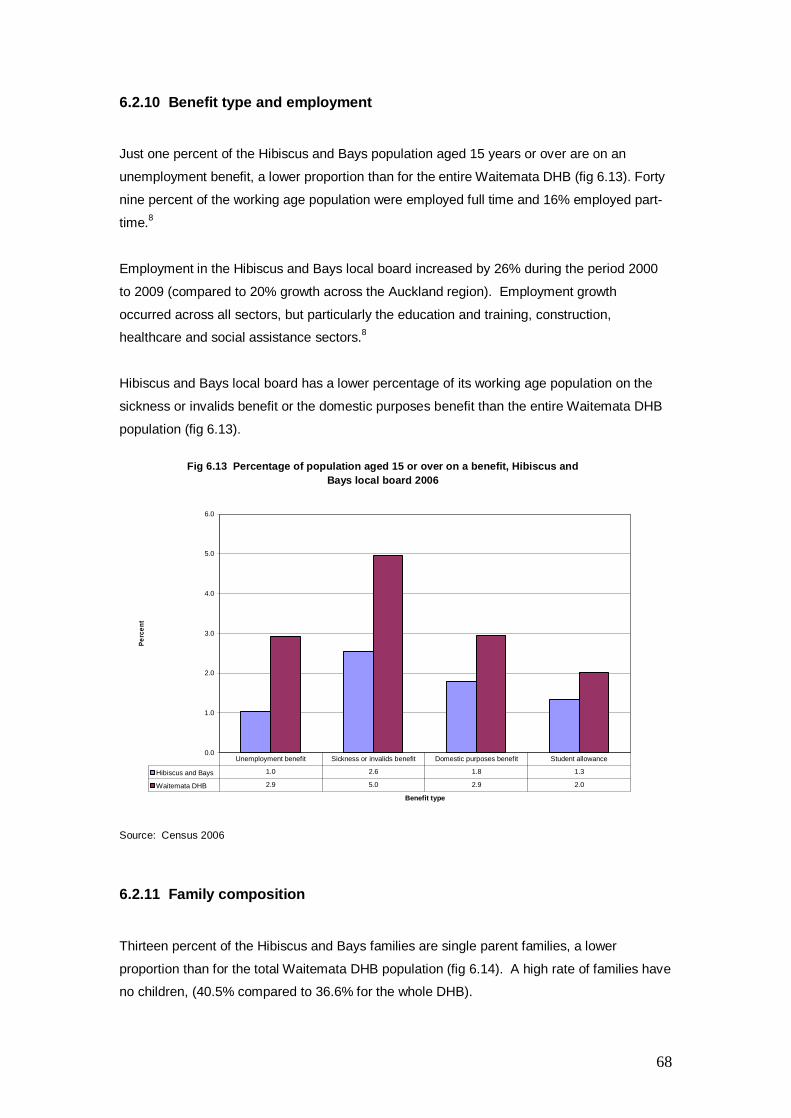
6.2.10 Benefit type and employment
Just one percent of the Hibiscus and Bays population aged 15 years or over are on an
unemployment benefit, a lower proportion than for the entire Waitemata DHB (fig 6.13). Forty
nine percent of the working age population were employed full time and 16% employed part-
time.8
Employment in the Hibiscus and Bays local board increased by 26% during the period 2000
to 2009 (compared to 20% growth across the Auckland region). Employment growth
occurred across all sectors, but particularly the education and training, construction,
healthcare and social assistance sectors.8
Hibiscus and Bays local board has a lower percentage of its working age population on the
sickness or invalids benefit or the domestic purposes benefit than the entire Waitemata DHB
population (fig 6.13).
Fig 6.13 Percentage of population aged 15 or over on a benefit, Hibiscus and Bays local board 2006
0.0
1.0
2.0
3.0
4.0
5.0
6.0
Benefit type
Perc
ent
Hibiscus and Bays 1.0 2.6 1.8 1.3
Waitemata DHB 2.9 5.0 2.9 2.0
Unemployment benefit Sickness or invalids benefit Domestic purposes benefit Student allowance
Source: Census 2006
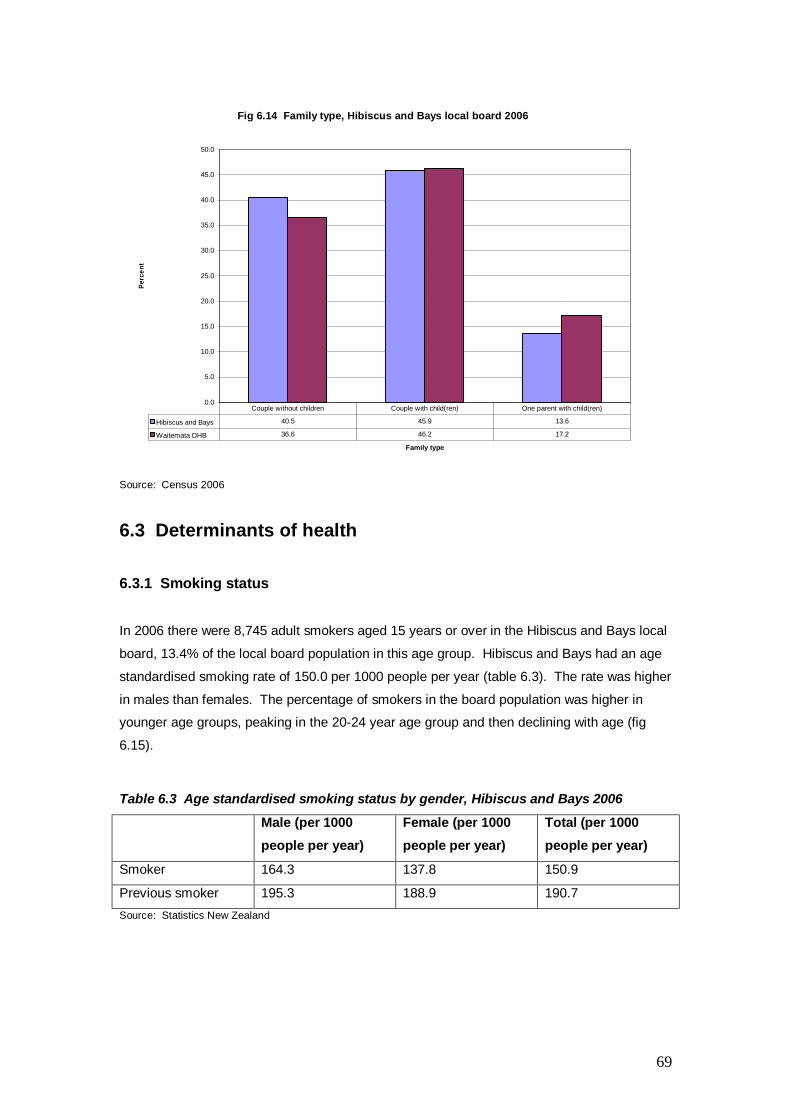
6.2.11 Family composition
Thirteen percent of the Hibiscus and Bays families are single parent families, a lower
proportion than for the total Waitemata DHB population (fig 6.14). A high rate of families have
no children, (40.5% compared to 36.6% for the whole DHB).
69
Fig 6.14 Family type, Hibiscus and Bays local board 2006
0.0
5.0
10.0
15.0
20.0
25.0
30.0
35.0
40.0
45.0
50.0
Family type
Perc
ent
Hibiscus and Bays 40.5 45.9 13.6
Waitemata DHB 36.6 46.2 17.2
Couple without children Couple with child(ren) One parent with child(ren)
Source: Census 2006
6.3 Determinants of health
6.3.1 Smoking status
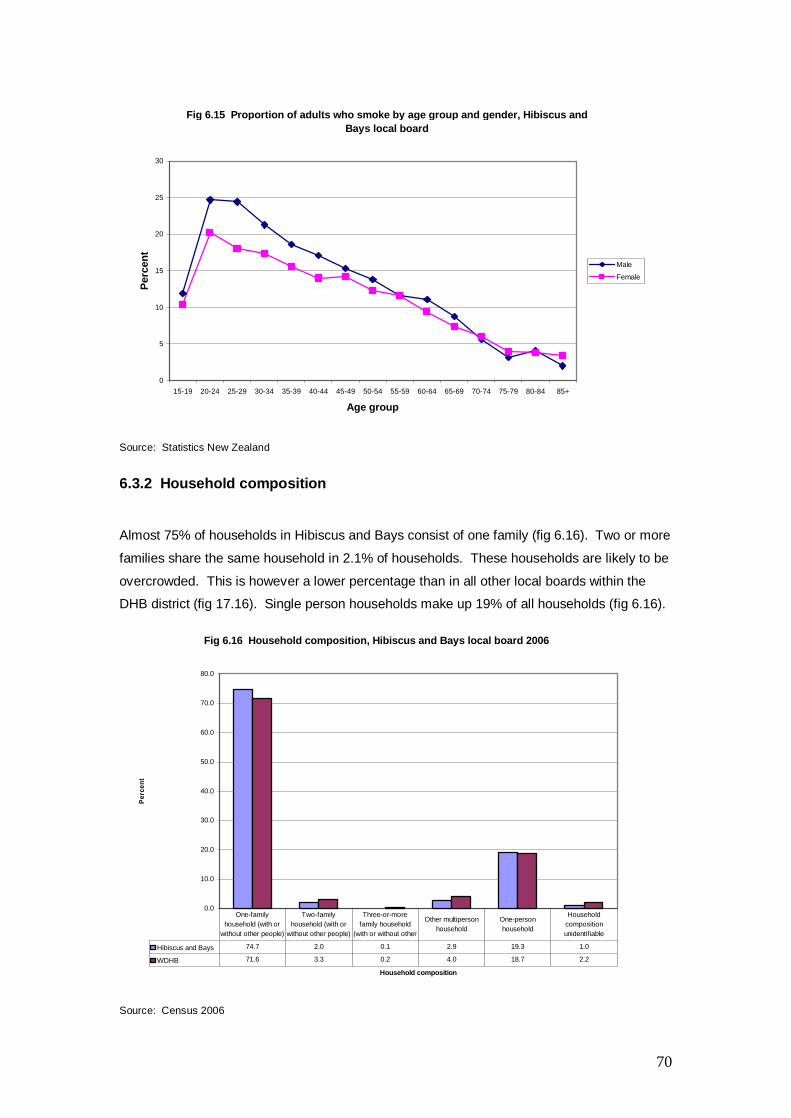
In 2006 there were 8,745 adult smokers aged 15 years or over in the Hibiscus and Bays local
board, 13.4% of the local board population in this age group. Hibiscus and Bays had an age
standardised smoking rate of 150.0 per 1000 people per year (table 6.3). The rate was higher
in males than females. The percentage of smokers in the board population was higher in
younger age groups, peaking in the 20-24 year age group and then declining with age (fig
6.15).
Table 6.3 Age standardised smoking status by gender, Hibiscus and Bays 2006
Male (per 1000 people per year)
Female (per 1000 people per year)
Total (per 1000 people per year)
Smoker 164.3 137.8 150.9
Previous smoker 195.3 188.9 190.7 Source: Statistics New Zealand
70
Fig 6.15 Proportion of adults who smoke by age group and gender, Hibiscus and Bays local board
0
5
10
15
20
25
30
15-19 20-24 25-29 30-34 35-39 40-44 45-49 50-54 55-59 60-64 65-69 70-74 75-79 80-84 85+
Age group
Perc
ent
Male
Female
Source: Statistics New Zealand
6.3.2 Household composition
Almost 75% of households in Hibiscus and Bays consist of one family (fig 6.16). Two or more
families share the same household in 2.1% of households. These households are likely to be
overcrowded. This is however a lower percentage than in all other local boards within the
DHB district (fig 17.16). Single person households make up 19% of all households (fig 6.16).
Fig 6.16 Household composition, Hibiscus and Bays local board 2006
0.0
10.0
20.0
30.0
40.0
50.0
60.0
70.0
80.0
Household composition
Perc
ent
Hibiscus and Bays 74.7 2.0 0.1 2.9 19.3 1.0
WDHB 71.6 3.3 0.2 4.0 18.7 2.2
One-family household (with or
without other people)
Two-family household (with or
without other people)
Three-or-more family household
(with or without other
Other multiperson household
One-person household
Household composition unidentifiable
Source: Census 2006
71
6.4 Health need
6.4.1 Births
There were 905 live births in the Hibiscus and Bays local board during the 2009/2010 year.
The birth rate over this period for women aged 15 to 49 years was 45.8 live births per 1,000
women.
There were 38 live births to teenagers aged 15 to 19 years in the Hibiscus and Bays local
board, during the 2009/2010 year. The birth rate in this age group was 12.5 per 1,000
teenagers per year.
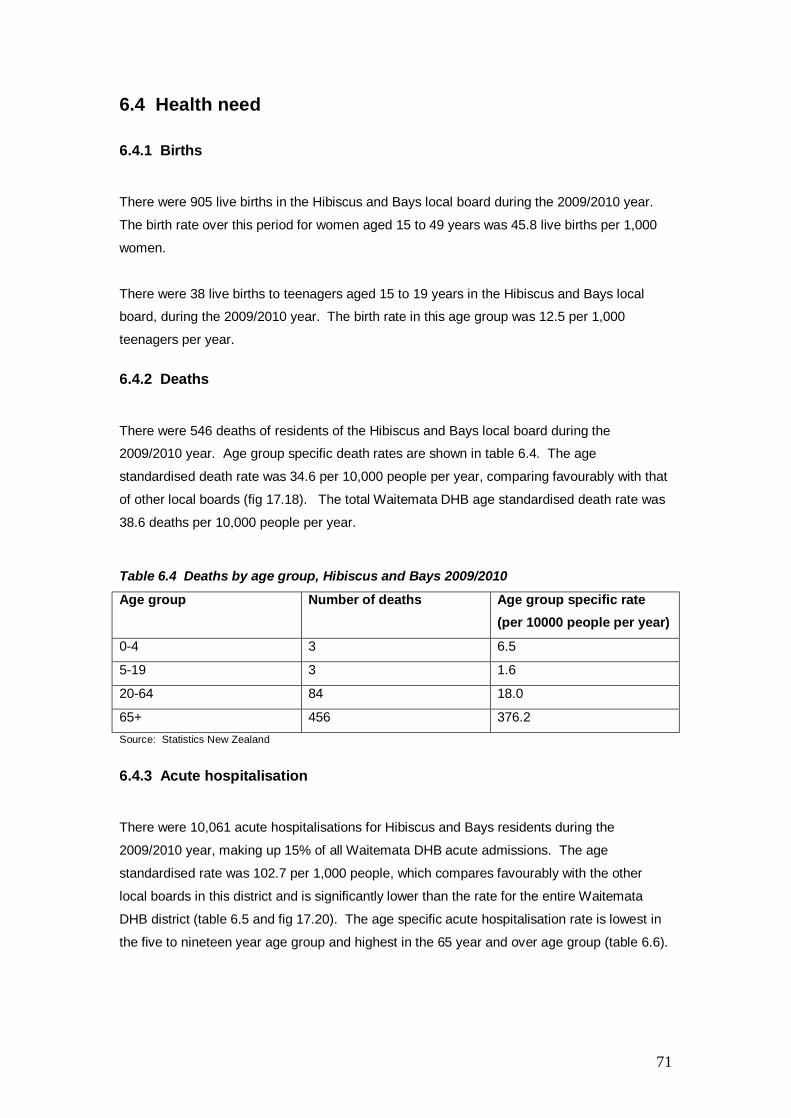
6.4.2 Deaths
There were 546 deaths of residents of the Hibiscus and Bays local board during the
2009/2010 year. Age group specific death rates are shown in table 6.4. The age
standardised death rate was 34.6 per 10,000 people per year, comparing favourably with that
of other local boards (fig 17.18). The total Waitemata DHB age standardised death rate was
38.6 deaths per 10,000 people per year.
Table 6.4 Deaths by age group, Hibiscus and Bays 2009/2010
Age group Number of deaths Age group specific rate (per 10000 people per year)
0-4 3 6.5
5-19 3 1.6
20-64 84 18.0
65+ 456 376.2 Source: Statistics New Zealand
6.4.3 Acute hospitalisation
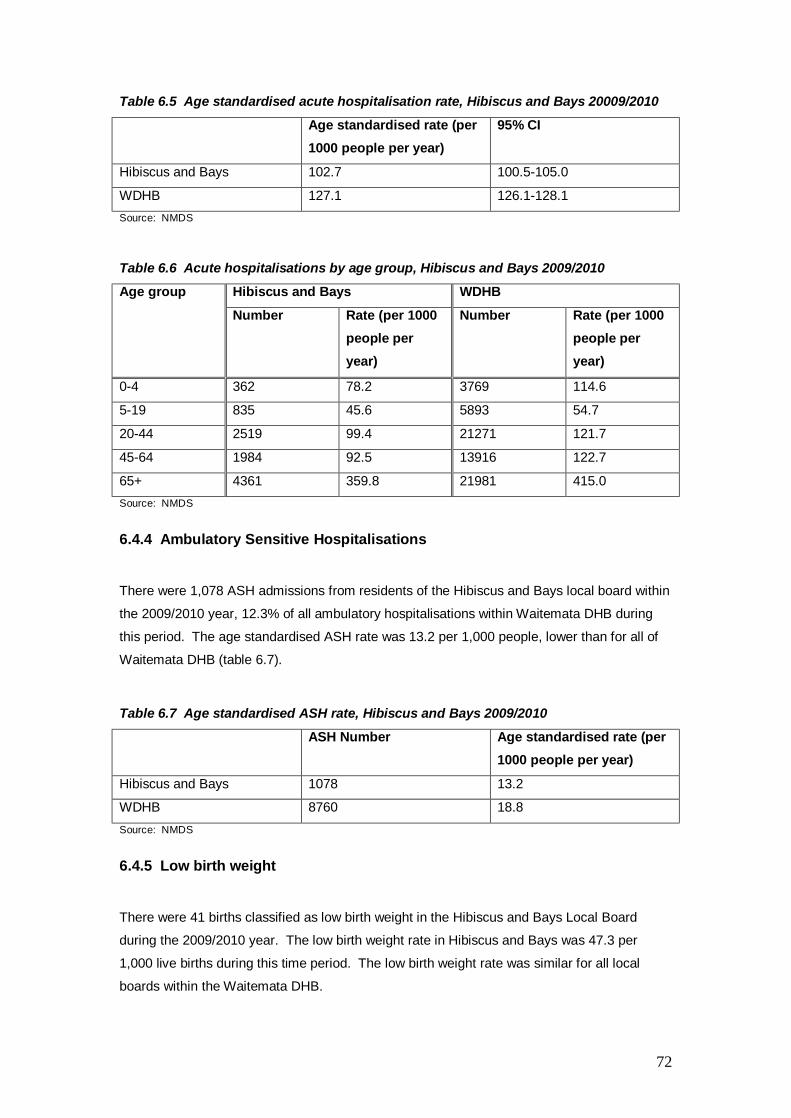
There were 10,061 acute hospitalisations for Hibiscus and Bays residents during the
2009/2010 year, making up 15% of all Waitemata DHB acute admissions. The age
standardised rate was 102.7 per 1,000 people, which compares favourably with the other
local boards in this district and is significantly lower than the rate for the entire Waitemata
DHB district (table 6.5 and fig 17.20). The age specific acute hospitalisation rate is lowest in
the five to nineteen year age group and highest in the 65 year and over age group (table 6.6).
72
Table 6.5 Age standardised acute hospitalisation rate, Hibiscus and Bays 20009/2010
Age standardised rate (per 1000 people per year)
95% CI
Hibiscus and Bays 102.7 100.5-105.0
WDHB 127.1 126.1-128.1 Source: NMDS
Table 6.6 Acute hospitalisations by age group, Hibiscus and Bays 2009/2010
Hibiscus and Bays WDHB Age group
Number Rate (per 1000 people per year)
Number Rate (per 1000 people per year)
0-4 362 78.2 3769 114.6
5-19 835 45.6 5893 54.7
20-44 2519 99.4 21271 121.7
45-64 1984 92.5 13916 122.7
65+ 4361 359.8 21981 415.0 Source: NMDS
6.4.4 Ambulatory Sensitive Hospitalisations
There were 1,078 ASH admissions from residents of the Hibiscus and Bays local board within
the 2009/2010 year, 12.3% of all ambulatory hospitalisations within Waitemata DHB during
this period. The age standardised ASH rate was 13.2 per 1,000 people, lower than for all of
Waitemata DHB (table 6.7).
Table 6.7 Age standardised ASH rate, Hibiscus and Bays 2009/2010
ASH Number Age standardised rate (per 1000 people per year)
Hibiscus and Bays 1078 13.2
WDHB 8760 18.8 Source: NMDS
6.4.5 Low birth weight
There were 41 births classified as low birth weight in the Hibiscus and Bays Local Board
during the 2009/2010 year. The low birth weight rate in Hibiscus and Bays was 47.3 per
1,000 live births during this time period. The low birth weight rate was similar for all local
boards within the Waitemata DHB.
73
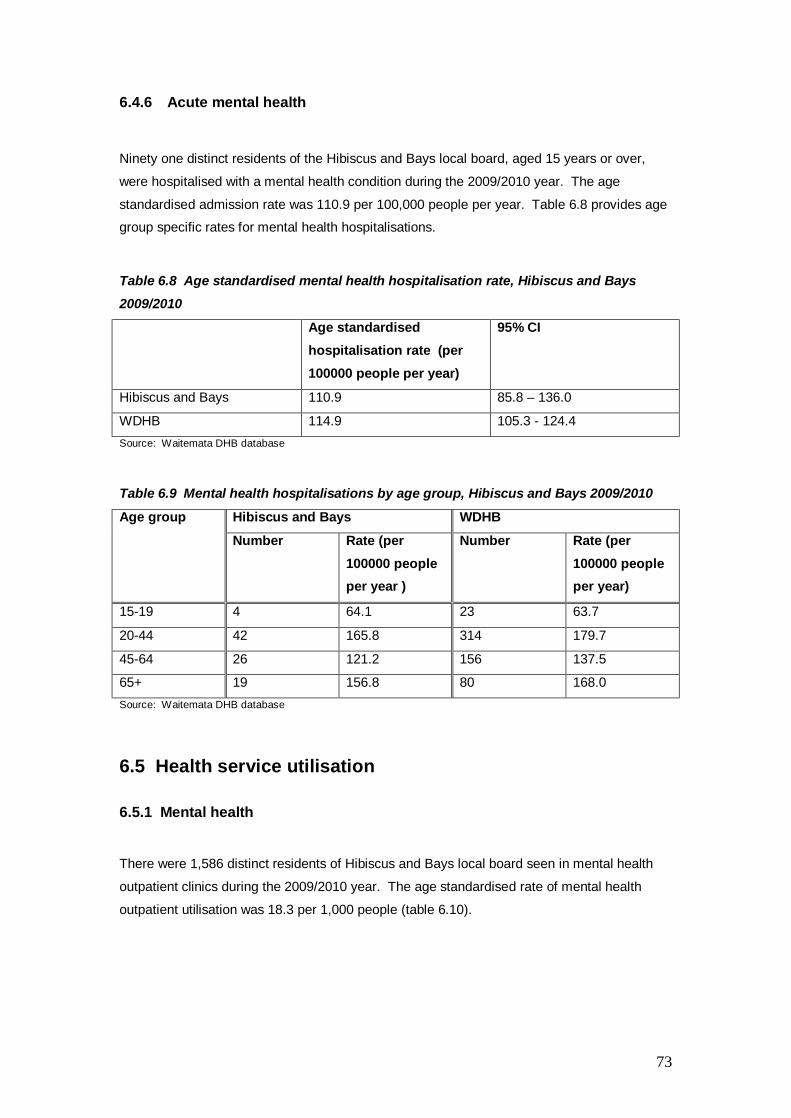
6.4.6 Acute mental health
Ninety one distinct residents of the Hibiscus and Bays local board, aged 15 years or over,
were hospitalised with a mental health condition during the 2009/2010 year. The age
standardised admission rate was 110.9 per 100,000 people per year. Table 6.8 provides age
group specific rates for mental health hospitalisations.
Table 6.8 Age standardised mental health hospitalisation rate, Hibiscus and Bays 2009/2010
Age standardised hospitalisation rate (per 100000 people per year)
95% CI
Hibiscus and Bays 110.9 85.8 – 136.0
WDHB 114.9 105.3 - 124.4 Source: Waitemata DHB database
Table 6.9 Mental health hospitalisations by age group, Hibiscus and Bays 2009/2010
Hibiscus and Bays WDHB Age group
Number Rate (per 100000 people per year )
Number Rate (per 100000 people per year)
15-19 4 64.1 23 63.7
20-44 42 165.8 314 179.7
45-64 26 121.2 156 137.5
65+ 19 156.8 80 168.0 Source: Waitemata DHB database
6.5 Health service utilisation
6.5.1 Mental health
There were 1,586 distinct residents of Hibiscus and Bays local board seen in mental health
outpatient clinics during the 2009/2010 year. The age standardised rate of mental health
outpatient utilisation was 18.3 per 1,000 people (table 6.10).
74
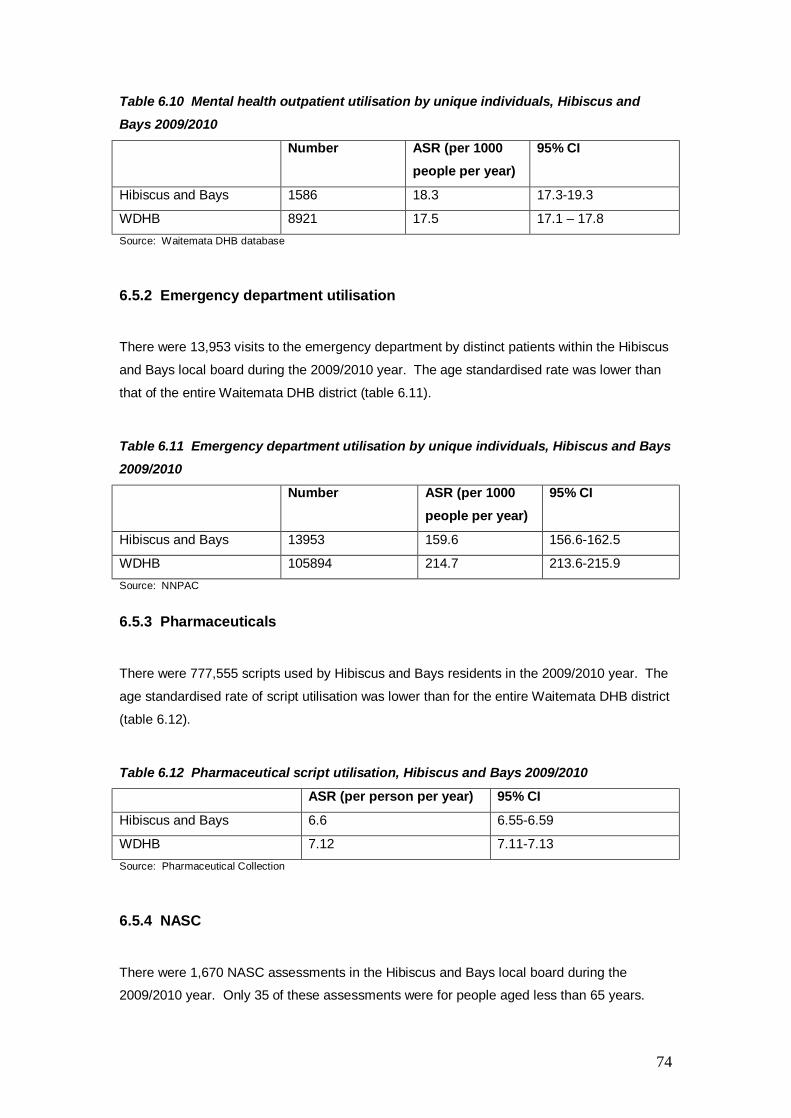
Table 6.10 Mental health outpatient utilisation by unique individuals, Hibiscus and Bays 2009/2010
Number ASR (per 1000 people per year)
95% CI
Hibiscus and Bays 1586 18.3 17.3-19.3
WDHB 8921 17.5 17.1 – 17.8 Source: Waitemata DHB database
6.5.2 Emergency department utilisation
There were 13,953 visits to the emergency department by distinct patients within the Hibiscus
and Bays local board during the 2009/2010 year. The age standardised rate was lower than
that of the entire Waitemata DHB district (table 6.11).
Table 6.11 Emergency department utilisation by unique individuals, Hibiscus and Bays 2009/2010
Number ASR (per 1000 people per year)
95% CI
Hibiscus and Bays 13953 159.6 156.6-162.5
WDHB 105894 214.7 213.6-215.9 Source: NNPAC
6.5.3 Pharmaceuticals
There were 777,555 scripts used by Hibiscus and Bays residents in the 2009/2010 year. The
age standardised rate of script utilisation was lower than for the entire Waitemata DHB district
(table 6.12).
Table 6.12 Pharmaceutical script utilisation, Hibiscus and Bays 2009/2010
ASR (per person per year) 95% CI
Hibiscus and Bays 6.6 6.55-6.59
WDHB 7.12 7.11-7.13 Source: Pharmaceutical Collection
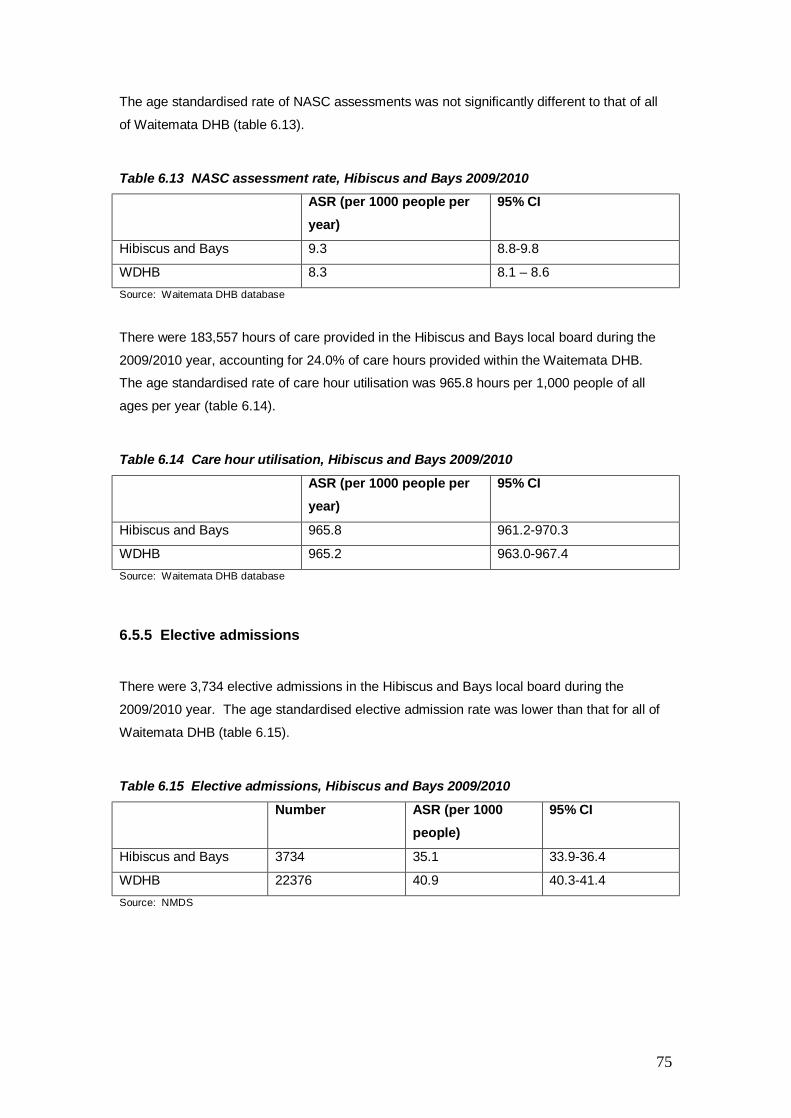
6.5.4 NASC
There were 1,670 NASC assessments in the Hibiscus and Bays local board during the
2009/2010 year. Only 35 of these assessments were for people aged less than 65 years.
75
The age standardised rate of NASC assessments was not significantly different to that of all
of Waitemata DHB (table 6.13).
Table 6.13 NASC assessment rate, Hibiscus and Bays 2009/2010
ASR (per 1000 people per year)
95% CI
Hibiscus and Bays 9.3 8.8-9.8
WDHB 8.3 8.1 – 8.6 Source: Waitemata DHB database
There were 183,557 hours of care provided in the Hibiscus and Bays local board during the
2009/2010 year, accounting for 24.0% of care hours provided within the Waitemata DHB.
The age standardised rate of care hour utilisation was 965.8 hours per 1,000 people of all
ages per year (table 6.14).
Table 6.14 Care hour utilisation, Hibiscus and Bays 2009/2010
ASR (per 1000 people per year)
95% CI
Hibiscus and Bays 965.8 961.2-970.3
WDHB 965.2 963.0-967.4 Source: Waitemata DHB database
6.5.5 Elective admissions
There were 3,734 elective admissions in the Hibiscus and Bays local board during the
2009/2010 year. The age standardised elective admission rate was lower than that for all of
Waitemata DHB (table 6.15).
Table 6.15 Elective admissions, Hibiscus and Bays 2009/2010
Number ASR (per 1000 people)
95% CI
Hibiscus and Bays 3734 35.1 33.9-36.4
WDHB 22376 40.9 40.3-41.4 Source: NMDS
76
6.6 Specific health needs
The 10 most common diagnoses for potentially avoidable hospitalisations in Hibiscus and
Bays local board are given in table 6.16. The conditions are similar for all boards and the top
three conditions are the same for all local boards.
Table 6.16 Most common potentially avoidable hospitalisation diagnoses, Hibiscus and Bays 2009/2010
Hibiscus and Bays Percentage of all conditions
WDHB Percentage of all conditions
IHD/Angina/chest pain
Respiratory infections
Cellulitis
ENT infections
CORD
Kidney/urinary tract infection
Gastroenteritis
Dental conditions
Ruptured Appendix
Skin cancers
27.2
10.3
6.8
4.5
4.5
4.3
4.0
3.7
3.7
3.6
IHD/angina/chest pain
Respiratory infections
Cellulitis
ENT infections
Asthma
Dental conditions
CORD
Kidney/urinary infection
Ruptured appendix
Gastroenteritis
24.1
12.4
8.6
6.0
4.9
4.6
4.4
4.2
3.3
2.7 Source: NMDS
6.7 Service Volumes
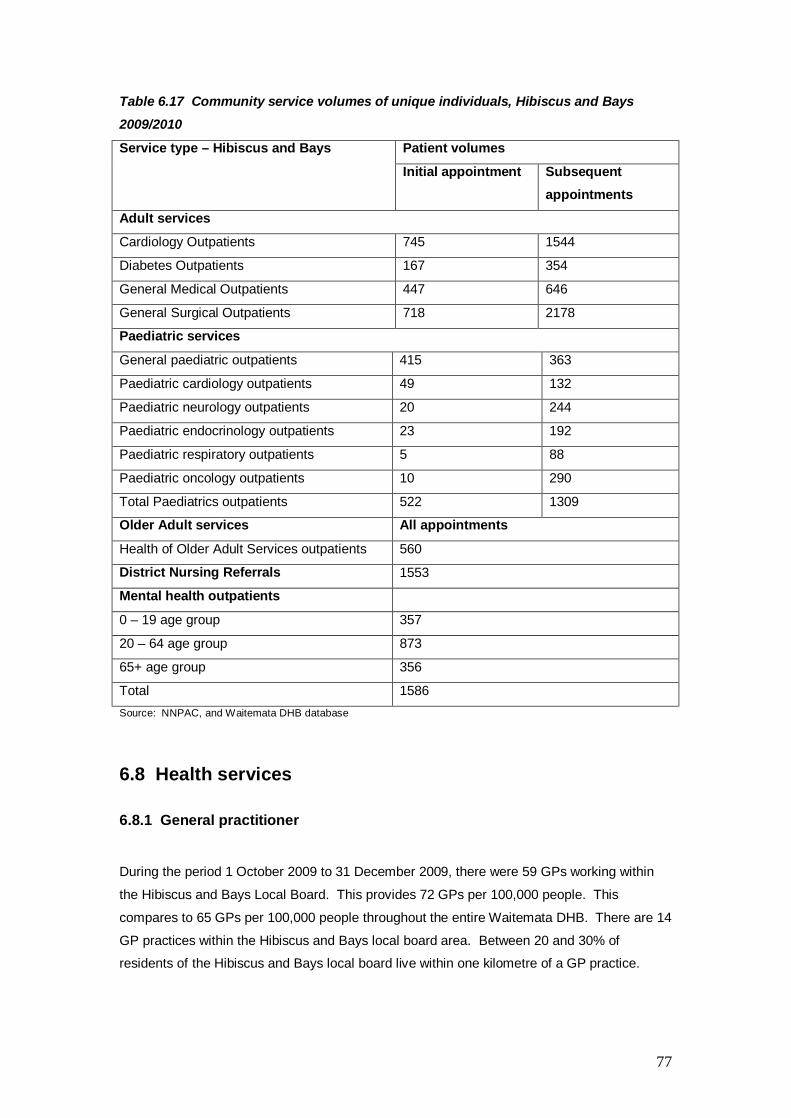
The volumes of distinct patients seen in outpatient clinics over the 2009/2010 year are shown
in table 6.17. Patient volumes for many of these services are large enough to make local
service provision feasible.
77
Table 6.17 Community service volumes of unique individuals, Hibiscus and Bays 2009/2010
Patient volumes Service type – Hibiscus and Bays
Initial appointment Subsequent appointments
Adult services
Cardiology Outpatients 745 1544
Diabetes Outpatients 167 354
General Medical Outpatients 447 646
General Surgical Outpatients 718 2178
Paediatric services
General paediatric outpatients 415 363
Paediatric cardiology outpatients 49 132
Paediatric neurology outpatients 20 244
Paediatric endocrinology outpatients 23 192
Paediatric respiratory outpatients 5 88
Paediatric oncology outpatients 10 290
Total Paediatrics outpatients 522 1309
Older Adult services All appointments
Health of Older Adult Services outpatients 560
District Nursing Referrals 1553
Mental health outpatients
0 – 19 age group 357
20 – 64 age group 873
65+ age group 356
Total 1586 Source: NNPAC, and Waitemata DHB database
6.8 Health services
6.8.1 General practitioner
During the period 1 October 2009 to 31 December 2009, there were 59 GPs working within
the Hibiscus and Bays Local Board. This provides 72 GPs per 100,000 people. This
compares to 65 GPs per 100,000 people throughout the entire Waitemata DHB. There are 14
GP practices within the Hibiscus and Bays local board area. Between 20 and 30% of
residents of the Hibiscus and Bays local board live within one kilometre of a GP practice.
78
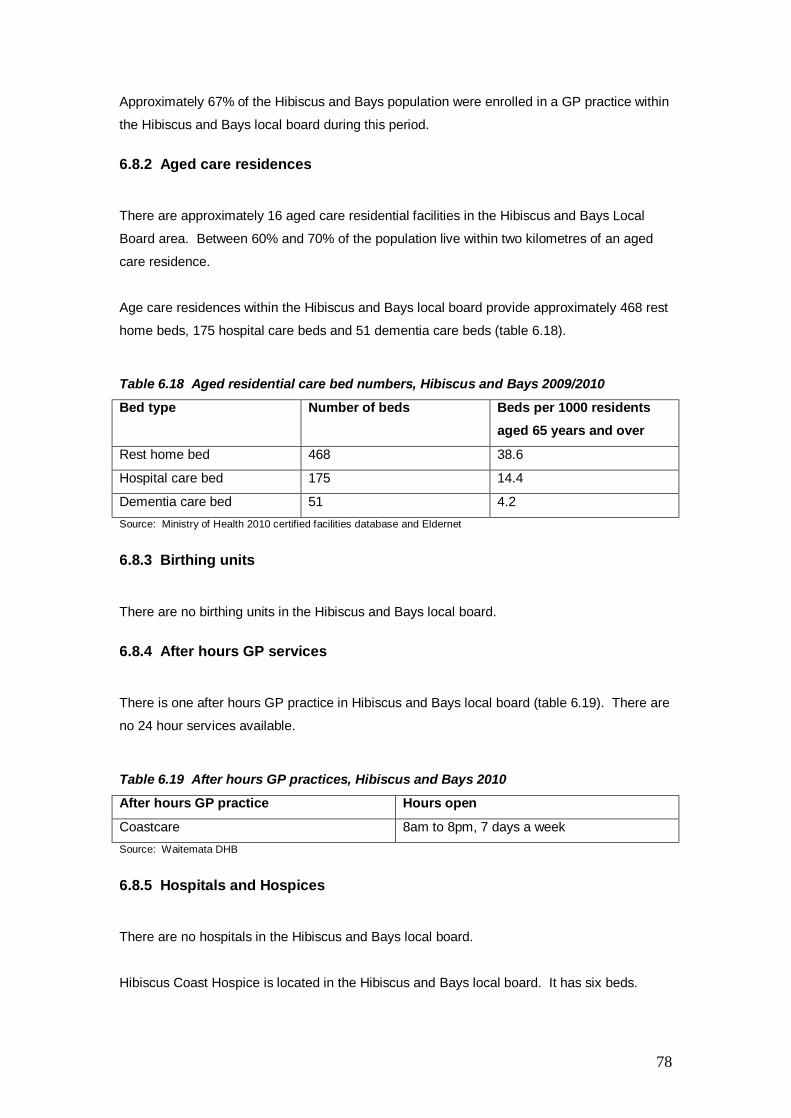
Approximately 67% of the Hibiscus and Bays population were enrolled in a GP practice within
the Hibiscus and Bays local board during this period.
6.8.2 Aged care residences
There are approximately 16 aged care residential facilities in the Hibiscus and Bays Local
Board area. Between 60% and 70% of the population live within two kilometres of an aged
care residence.
Age care residences within the Hibiscus and Bays local board provide approximately 468 rest
home beds, 175 hospital care beds and 51 dementia care beds (table 6.18).
Table 6.18 Aged residential care bed numbers, Hibiscus and Bays 2009/2010
Bed type Number of beds Beds per 1000 residents aged 65 years and over
Rest home bed 468 38.6
Hospital care bed 175 14.4
Dementia care bed 51 4.2 Source: Ministry of Health 2010 certified facilities database and Eldernet
6.8.3 Birthing units
There are no birthing units in the Hibiscus and Bays local board.
6.8.4 After hours GP services
There is one after hours GP practice in Hibiscus and Bays local board (table 6.19). There are
no 24 hour services available.
Table 6.19 After hours GP practices, Hibiscus and Bays 2010
After hours GP practice Hours open
Coastcare 8am to 8pm, 7 days a week Source: Waitemata DHB
6.8.5 Hospitals and Hospices
There are no hospitals in the Hibiscus and Bays local board.
Hibiscus Coast Hospice is located in the Hibiscus and Bays local board. It has six beds.
79
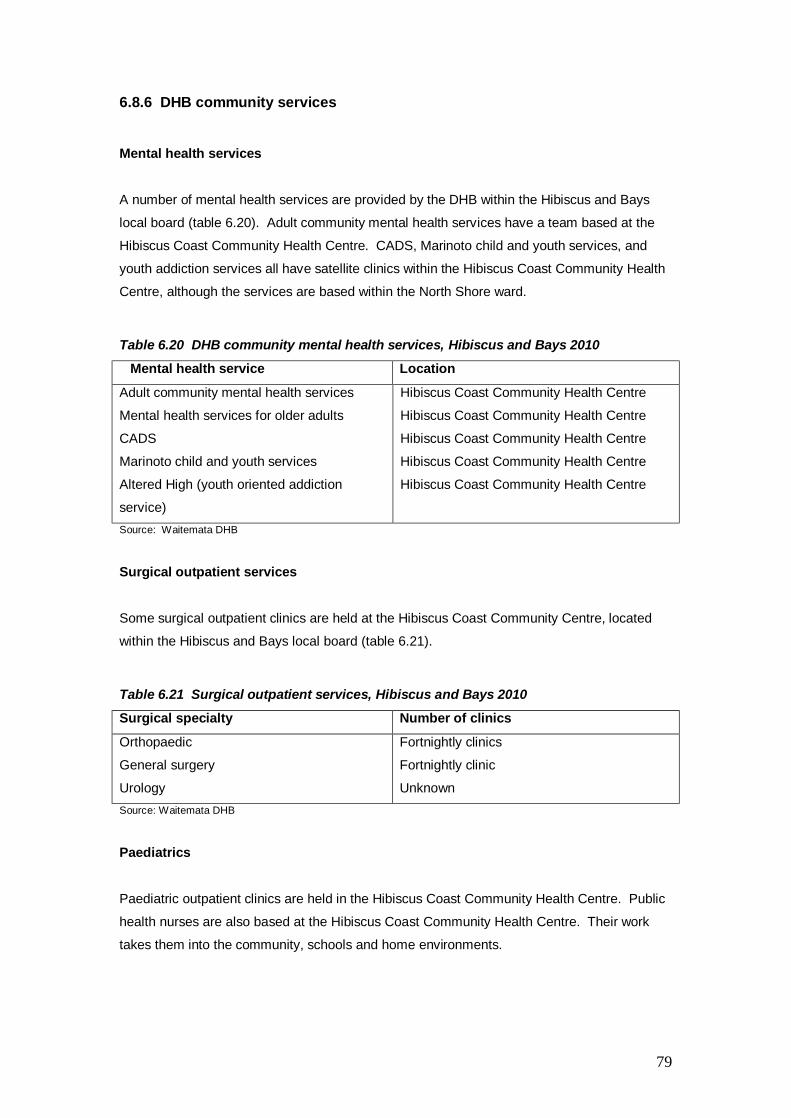
6.8.6 DHB community services
Mental health services
A number of mental health services are provided by the DHB within the Hibiscus and Bays
local board (table 6.20). Adult community mental health services have a team based at the
Hibiscus Coast Community Health Centre. CADS, Marinoto child and youth services, and
youth addiction services all have satellite clinics within the Hibiscus Coast Community Health
Centre, although the services are based within the North Shore ward.
Table 6.20 DHB community mental health services, Hibiscus and Bays 2010
Mental health service Location
Adult community mental health services
Mental health services for older adults
CADS
Marinoto child and youth services
Altered High (youth oriented addiction
service)
Hibiscus Coast Community Health Centre
Hibiscus Coast Community Health Centre
Hibiscus Coast Community Health Centre
Hibiscus Coast Community Health Centre
Hibiscus Coast Community Health Centre
Source: Waitemata DHB
Surgical outpatient services
Some surgical outpatient clinics are held at the Hibiscus Coast Community Centre, located
within the Hibiscus and Bays local board (table 6.21).
Table 6.21 Surgical outpatient services, Hibiscus and Bays 2010
Surgical specialty Number of clinics
Orthopaedic
General surgery
Urology
Fortnightly clinics
Fortnightly clinic
Unknown Source: Waitemata DHB
Paediatrics
Paediatric outpatient clinics are held in the Hibiscus Coast Community Health Centre. Public
health nurses are also based at the Hibiscus Coast Community Health Centre. Their work
takes them into the community, schools and home environments.
80
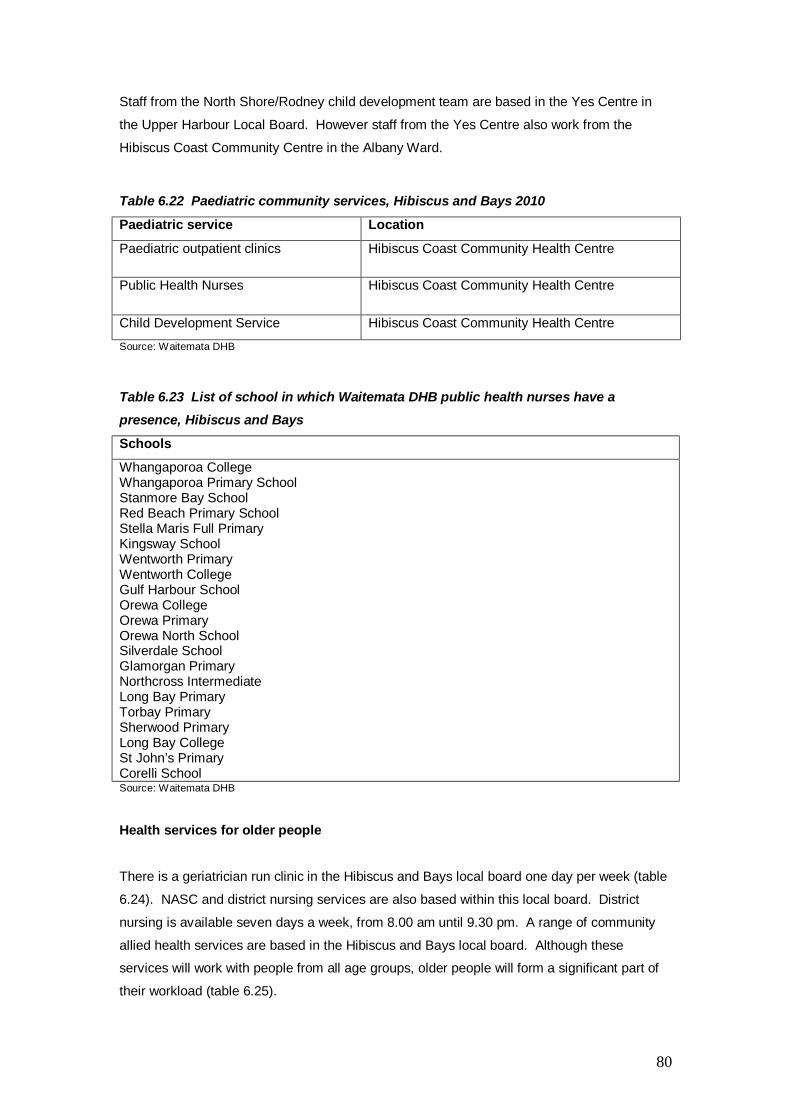
Staff from the North Shore/Rodney child development team are based in the Yes Centre in
the Upper Harbour Local Board. However staff from the Yes Centre also work from the
Hibiscus Coast Community Centre in the Albany Ward.
Table 6.22 Paediatric community services, Hibiscus and Bays 2010
Paediatric service Location
Paediatric outpatient clinics Hibiscus Coast Community Health Centre
Public Health Nurses Hibiscus Coast Community Health Centre
Child Development Service Hibiscus Coast Community Health Centre
Source: Waitemata DHB
Table 6.23 List of school in which Waitemata DHB public health nurses have a presence, Hibiscus and Bays
Schools
Whangaporoa College Whangaporoa Primary School Stanmore Bay School Red Beach Primary School Stella Maris Full Primary Kingsway School Wentworth Primary Wentworth College Gulf Harbour School Orewa College Orewa Primary Orewa North School Silverdale School Glamorgan Primary Northcross Intermediate Long Bay Primary Torbay Primary Sherwood Primary Long Bay College St John’s Primary Corelli School Source: Waitemata DHB
Health services for older people
There is a geriatrician run clinic in the Hibiscus and Bays local board one day per week (table
6.24). NASC and district nursing services are also based within this local board. District
nursing is available seven days a week, from 8.00 am until 9.30 pm. A range of community
allied health services are based in the Hibiscus and Bays local board. Although these
services will work with people from all age groups, older people will form a significant part of
their workload (table 6.25).
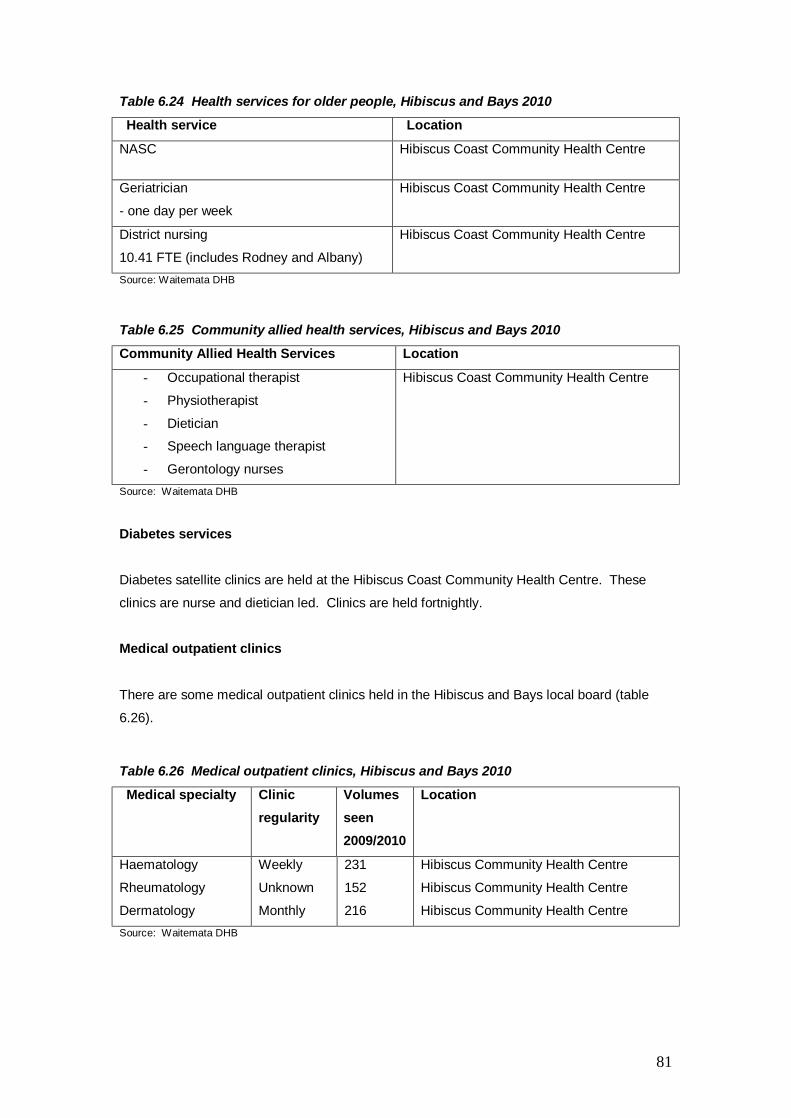
81
Table 6.24 Health services for older people, Hibiscus and Bays 2010
Health service Location
NASC Hibiscus Coast Community Health Centre
Geriatrician
- one day per week
Hibiscus Coast Community Health Centre
District nursing
10.41 FTE (includes Rodney and Albany)
Hibiscus Coast Community Health Centre
Source: Waitemata DHB
Table 6.25 Community allied health services, Hibiscus and Bays 2010
Community Allied Health Services Location
- Occupational therapist
- Physiotherapist
- Dietician
- Speech language therapist
- Gerontology nurses
Hibiscus Coast Community Health Centre
Source: Waitemata DHB
Diabetes services Diabetes satellite clinics are held at the Hibiscus Coast Community Health Centre. These
clinics are nurse and dietician led. Clinics are held fortnightly.
Medical outpatient clinics
There are some medical outpatient clinics held in the Hibiscus and Bays local board (table
6.26).
Table 6.26 Medical outpatient clinics, Hibiscus and Bays 2010
Medical specialty Clinic regularity
Volumes seen 2009/2010
Location
Haematology
Rheumatology
Dermatology
Weekly
Unknown
Monthly
231
152
216
Hibiscus Community Health Centre
Hibiscus Community Health Centre
Hibiscus Community Health Centre Source: Waitemata DHB