7 - aafs 2008 validation studies and interpretation
TRANSCRIPT

Validation and Interpretation Guidelines – J.B. Sgueglia February 19, 2008
http://www.cstl.nist.gov/biotech/strbase/training/AAFS2008_MixtureWorkshop.htm 1
DNA Mixture Interpretation:Principles and Practice in Component Deconvolution and Statistical Analysis
AAFS 2008 Workshop #16Washington, DC
February 19, 2008
Joanne Sgueglia
Validation Studies and Preparing Mixture
Interpretation Guidelines
Overview• Know Your System (KYS)• Quantitation• Degradation/Inhibition• PCR• STR-Artifacts vs. DNA• Validation Studies- Precision, Sensitivity,
Balance, Stutter and Mixture Ratios
• Intro to Statistics

Validation and Interpretation Guidelines – J.B. Sgueglia February 19, 2008
http://www.cstl.nist.gov/biotech/strbase/training/AAFS2008_MixtureWorkshop.htm 2
Validation Studies to Establish Parameters
• Precision-Allele sizes, ranges and standard deviations.
• Sensitivity-minimum and maximum thresholds.
• Balance-Within and across loci. Allelic and locus drop out.
• Stutter-@ each locus, for each allele.• Mixture Ratios for detection of minor.
Precision
• Validation– Repeat injections of allelic
ladder and positive control – Assess 250 bp peaks for all
data within and across runs.– Calculate values for Min.,
Max., Average, SD, Range of +/- 3 SD and bin sizes.
• Guideline– Precision check of run data
against established ranges for positive control and 250 bp for each instrument.
– Allelic designations for variants must be made with caution at larger loci.
– If in region of imprecision one may call with 22.X designation if 1 bp resolution cannot be established (e.g. 22.2 vs. 22.3).

Validation and Interpretation Guidelines – J.B. Sgueglia February 19, 2008
http://www.cstl.nist.gov/biotech/strbase/training/AAFS2008_MixtureWorkshop.htm 3
SENSITIVITY• Minimum Threshold (Noise Threshold)
– noise=baseline and background – Reporting threshold usually 3x noise level
• Maximum Threshold– Pull up, Nonspecific product, stutter, balance– Saturation effects of overloading the CCD camera can
interfere with evaluation of stutter and other artifacts.– Usually at approximately 8100 rfu on CE instruments– Note that pull up occurs prior to full saturation (dependent
on matrix/spectral)
Sensitivity Studies and Thresholds
• Validation– Titration series of range of
target DNA in ng (5, 2.5 -------0.039) -use @ least two sources
– Evaluation of rfu values for all targets (both at low end and for high end saturation)
– Evaluation of signal-to- noise– Noise comprised of baseline
and background effects
• Guideline– Establish criteria for a
reporting threshold (RT) and noise threshold (NT)
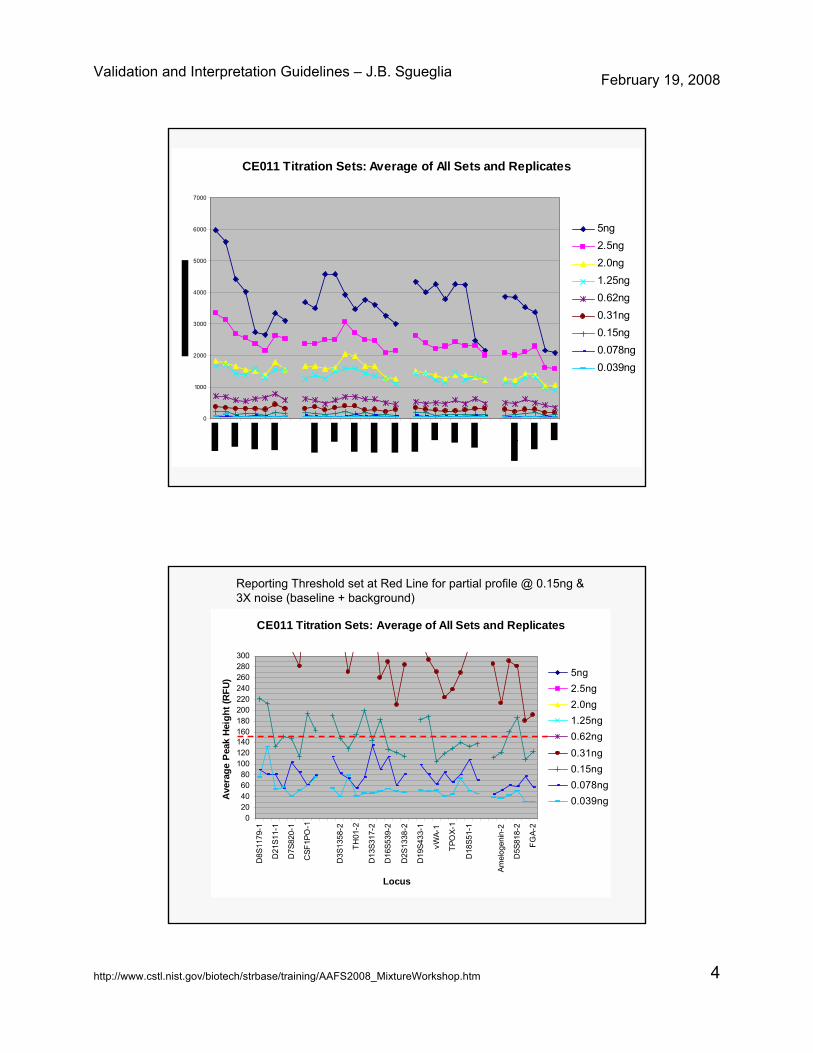
– RT set to obtain a partial profile @ 0.15ng and to be at 3X of established noise
– Peaks above RT have met criteria to be given an allele designation and accompanying statistic (to type 0.25 ng of DNA)
Validation and Interpretation Guidelines – J.B. Sgueglia February 19, 2008
http://www.cstl.nist.gov/biotech/strbase/training/AAFS2008_MixtureWorkshop.htm 4
CE011 Titration Sets: Average of All Sets and Replicates
0
1000
2000
3000
4000
5000
6000
7000
5ng2.5ng2.0ng1.25ng0.62ng0.31ng0.15ng0.078ng0.039ng
CE011 Titration Sets: Average of All Sets and Replicates
020406080
100120140160180200220240260280300
D8S
1179
-1
D21
S11-
1
D7S
820-
1
CSF
1PO
-1
D3S
1358
-2
TH01
-2
D13
S317
-2
D16
S539
-2
D2S
1338
-2
D19
S433
-1
vWA-
1
TPO
X-1
D18
S51-
1
Amel
ogen
in-2
D5S
818-
2
FGA-
2
Locus
Ave
rage
Pea
k H
eigh
t (R
FU) 5ng
2.5ng2.0ng1.25ng0.62ng0.31ng0.15ng0.078ng0.039ng
Reporting Threshold set at Red Line for partial profile @ 0.15ng & 3X noise (baseline + background)

Validation and Interpretation Guidelines – J.B. Sgueglia February 19, 2008
http://www.cstl.nist.gov/biotech/strbase/training/AAFS2008_MixtureWorkshop.htm 5
Epg of noise
Link to Noise PDF
SATURATION—Raw data > 8100
DNA from a vibrator sample @ 10 sec
D3 is > 8100,flatlined

Validation and Interpretation Guidelines – J.B. Sgueglia February 19, 2008
http://www.cstl.nist.gov/biotech/strbase/training/AAFS2008_MixtureWorkshop.htm 6
Analyzed data versus Raw Data-
Peak heights may not be illustrative of raw data after being analyzed
6509 rfu 6991 rfu
1st allele is
Saturated!
RAW DATAANALYZED DATA
Saturated Data- Maximum Thresholds
Gray ZonePeaks-Artifact or Real?
• How to utilize data contained in the zone between the NT and RT?– NT set to exclude any
spurious artifacts from baseline/background and peaks below the NT are not assessed
– Gray zone-ensure all peaks are assessed and edit out artifacts and mark only if DNA (i.e. exclude pull up, spikes, dyes, etc.)
• Note potential alleles below threshold (pabt) with an asterisk
• Data used for comprehensive view of questioned profile(s)
• Used for overall interpretation of exclusion or inclusion
• No statistic performed at a locus if included with asterisk (pabt)

Validation and Interpretation Guidelines – J.B. Sgueglia February 19, 2008
http://www.cstl.nist.gov/biotech/strbase/training/AAFS2008_MixtureWorkshop.htm 7
8,9
X,Y
8,(10)
THO1TPOX
X,Y
CSF
Partial profile with 1 allele called and the other below reporting threshold
Pabt’s—no alleles called-drop out possible
Degradation/Inhibition and Potential Alleles Below Threshold
Potential Alleles Below Threshold (PABT)
EPG of data with PABT’s
• Link to Set A
• Link to Set B
Validation and Interpretation Guidelines – J.B. Sgueglia February 19, 2008
http://www.cstl.nist.gov/biotech/strbase/training/AAFS2008_MixtureWorkshop.htm 8
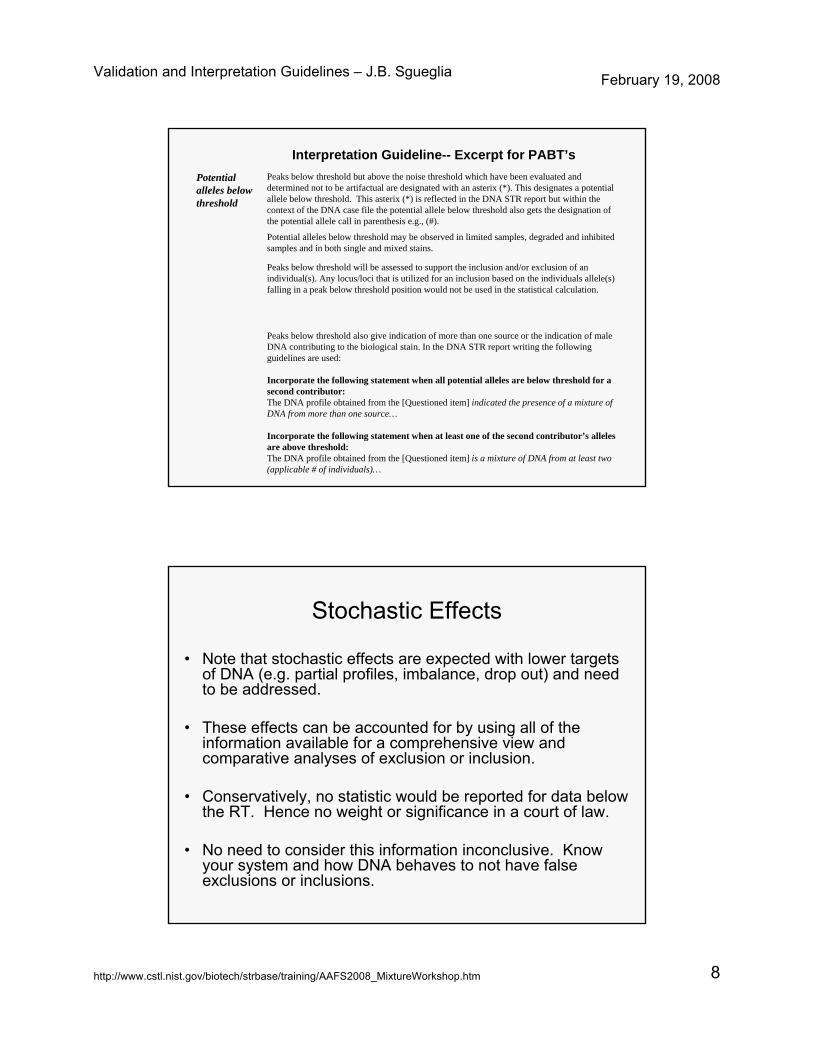
Peaks below threshold also give indication of more than one source or the indication of male DNA contributing to the biological stain. In the DNA STR report writing the following guidelines are used:
Incorporate the following statement when all potential alleles are below threshold for a second contributor:The DNA profile obtained from the [Questioned item] indicated the presence of a mixture of DNA from more than one source…
Incorporate the following statement when at least one of the second contributor’s alleles are above threshold:The DNA profile obtained from the [Questioned item] is a mixture of DNA from at least two (applicable # of individuals)…
Peaks below threshold will be assessed to support the inclusion and/or exclusion of an individual(s). Any locus/loci that is utilized for an inclusion based on the individuals allele(s) falling in a peak below threshold position would not be used in the statistical calculation.
Potential alleles below threshold may be observed in limited samples, degraded and inhibited samples and in both single and mixed stains.
Peaks below threshold but above the noise threshold which have been evaluated and determined not to be artifactual are designated with an asterix (*). This designates a potential allele below threshold. This asterix (*) is reflected in the DNA STR report but within the context of the DNA case file the potential allele below threshold also gets the designation of the potential allele call in parenthesis e.g., (#).
Potential alleles below threshold
Interpretation Guideline-- Excerpt for PABT’s
Stochastic Effects
• Note that stochastic effects are expected with lower targets of DNA (e.g. partial profiles, imbalance, drop out) and need to be addressed.
• These effects can be accounted for by using all of the information available for a comprehensive view and comparative analyses of exclusion or inclusion.
• Conservatively, no statistic would be reported for data below the RT. Hence no weight or significance in a court of law.
• No need to consider this information inconclusive. Know your system and how DNA behaves to not have false exclusions or inclusions.

Validation and Interpretation Guidelines – J.B. Sgueglia February 19, 2008
http://www.cstl.nist.gov/biotech/strbase/training/AAFS2008_MixtureWorkshop.htm 9
Each locus must be analyzed individually to differentiate and quantify peaks in order to distinguish the profiles observed in the mixture. However, the combined profile can be utilized to provide a comprehensive view of the mixture possibilities and ratios of major to minor components.
Interpretation Guideline Excerpt -use all information—COMPREHENSIVE PROFILE
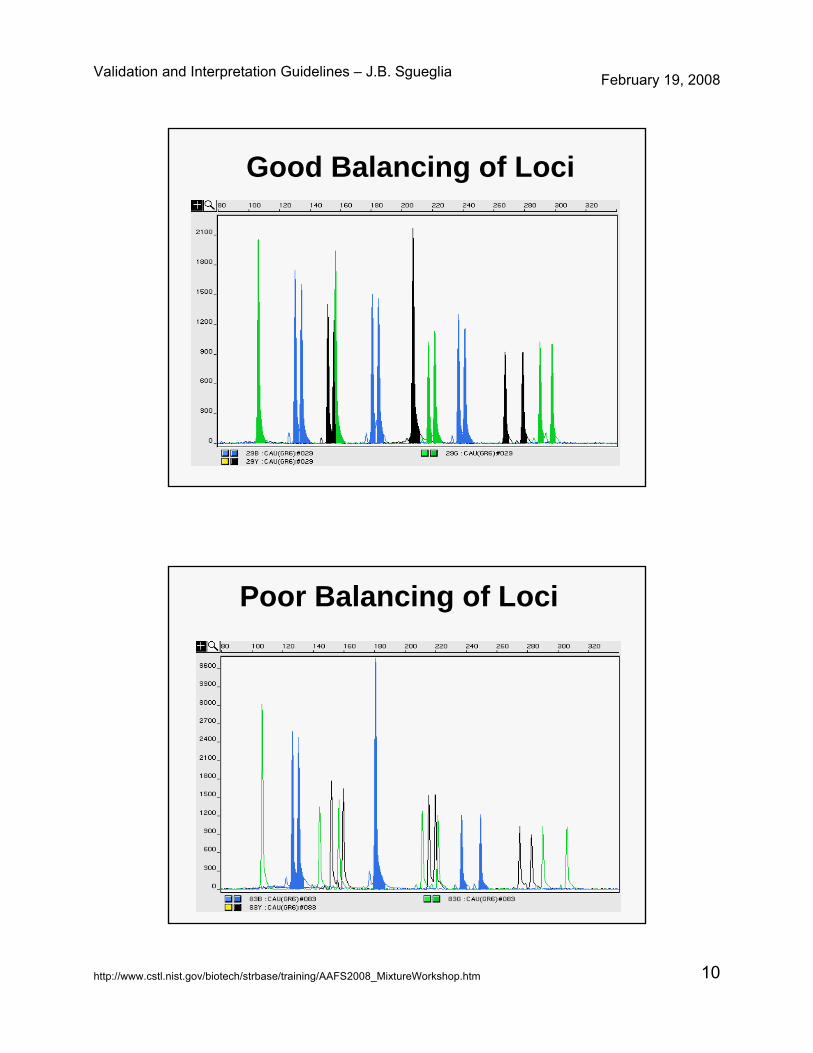
Allele Balance• Within and Across Loci
– Sister Allele Balance-measure differences and use + 3 SD
– Across same and other colors-Individual (i.e.Blue, Green, Yellow, Red)- measure relative to highest locus as a percentage-Overall (i.e. Blue relative to others and so on).
• Kit performance assessed by examination of positive controls– ~ 70 % Rule to indicate
mixture– Guide to evaluate if minor
components of a mixture have dropped out due to degradation or inhibition or kit balance expectations.
Validation and Interpretation Guidelines – J.B. Sgueglia February 19, 2008
http://www.cstl.nist.gov/biotech/strbase/training/AAFS2008_MixtureWorkshop.htm 10
Good Balancing of Loci
Poor Balancing of Loci

Validation and Interpretation Guidelines – J.B. Sgueglia February 19, 2008
http://www.cstl.nist.gov/biotech/strbase/training/AAFS2008_MixtureWorkshop.htm 11
BALANCE ACROSS LOCI PROFILER PLUS
0
200
400
600
800
1000
1200
1400
1 2 3 4
LOCUS
PEA
K H
EIG
HT
(rfu
)
KEYBlue1-D32-vWA3-FGA
Green1-AMEL2-D83-D214-D18
Yellow1-D52-D133-D7
Graph of Balance Across Loci
Balance--vWA most robust
•D3 and FGA substantially lower for compromised sample:
Match book found @ arson scene

Validation and Interpretation Guidelines – J.B. Sgueglia February 19, 2008
http://www.cstl.nist.gov/biotech/strbase/training/AAFS2008_MixtureWorkshop.htm 12
vWA-
• most robust locus
•Only data for minor component
SWAB of Ground
KNIFE
Good Balancing of Alleles
Validation and Interpretation Guidelines – J.B. Sgueglia February 19, 2008
http://www.cstl.nist.gov/biotech/strbase/training/AAFS2008_MixtureWorkshop.htm 13
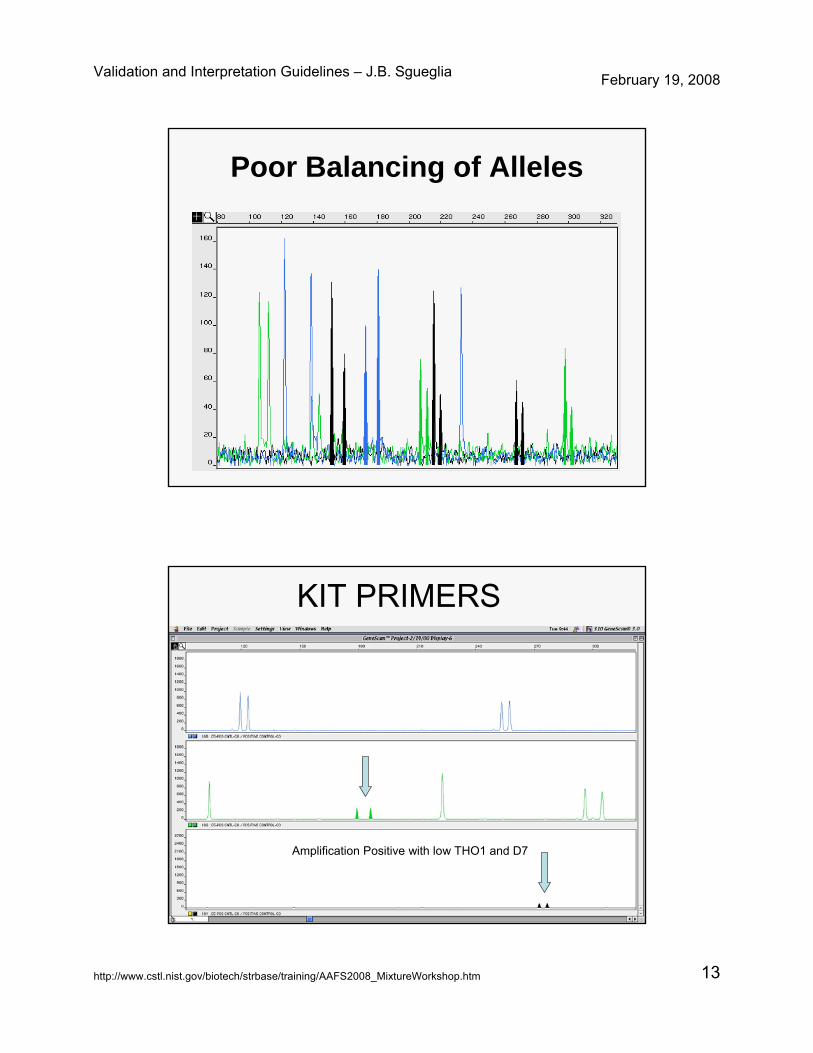
Poor Balancing of Alleles
KIT PRIMERS
Amplification Positive with low THO1 and D7
Validation and Interpretation Guidelines – J.B. Sgueglia February 19, 2008
http://www.cstl.nist.gov/biotech/strbase/training/AAFS2008_MixtureWorkshop.htm 14
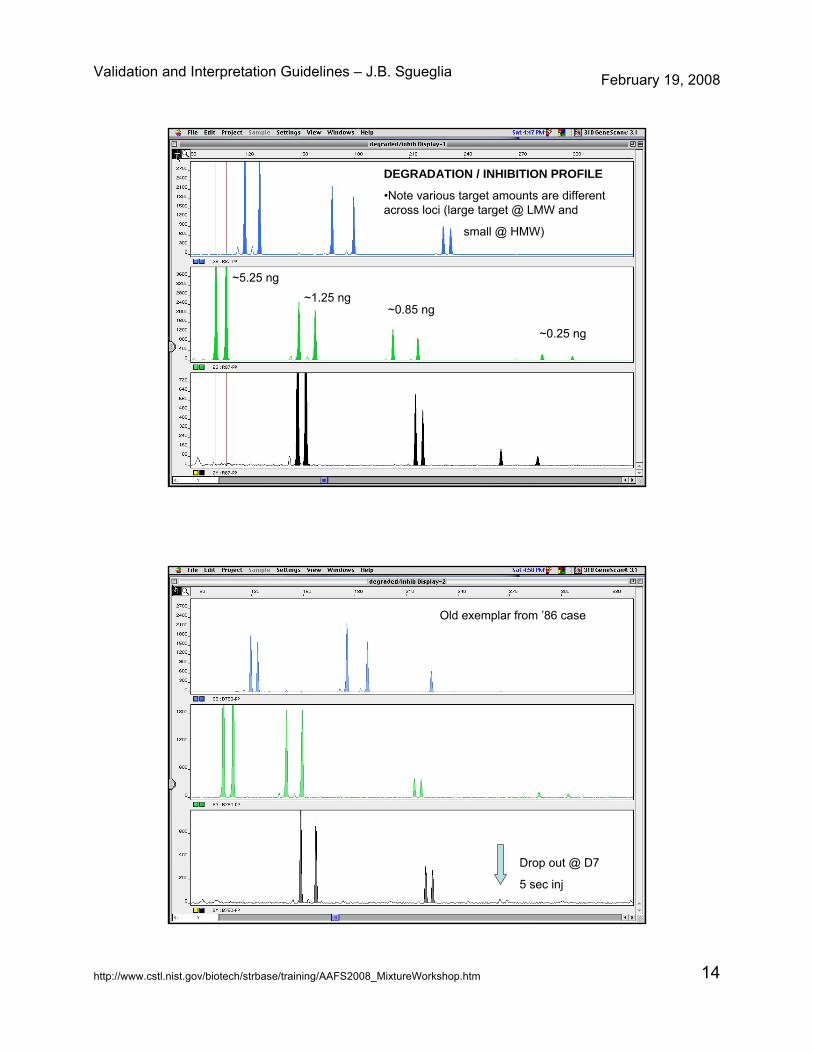
DEGRADATION / INHIBITION PROFILE
•Note various target amounts are different across loci (large target @ LMW and
small @ HMW)
~0.25 ng
~0.85 ng~1.25 ng
~5.25 ng
Old exemplar from ’86 case
Drop out @ D7
5 sec inj
Validation and Interpretation Guidelines – J.B. Sgueglia February 19, 2008
http://www.cstl.nist.gov/biotech/strbase/training/AAFS2008_MixtureWorkshop.htm 15
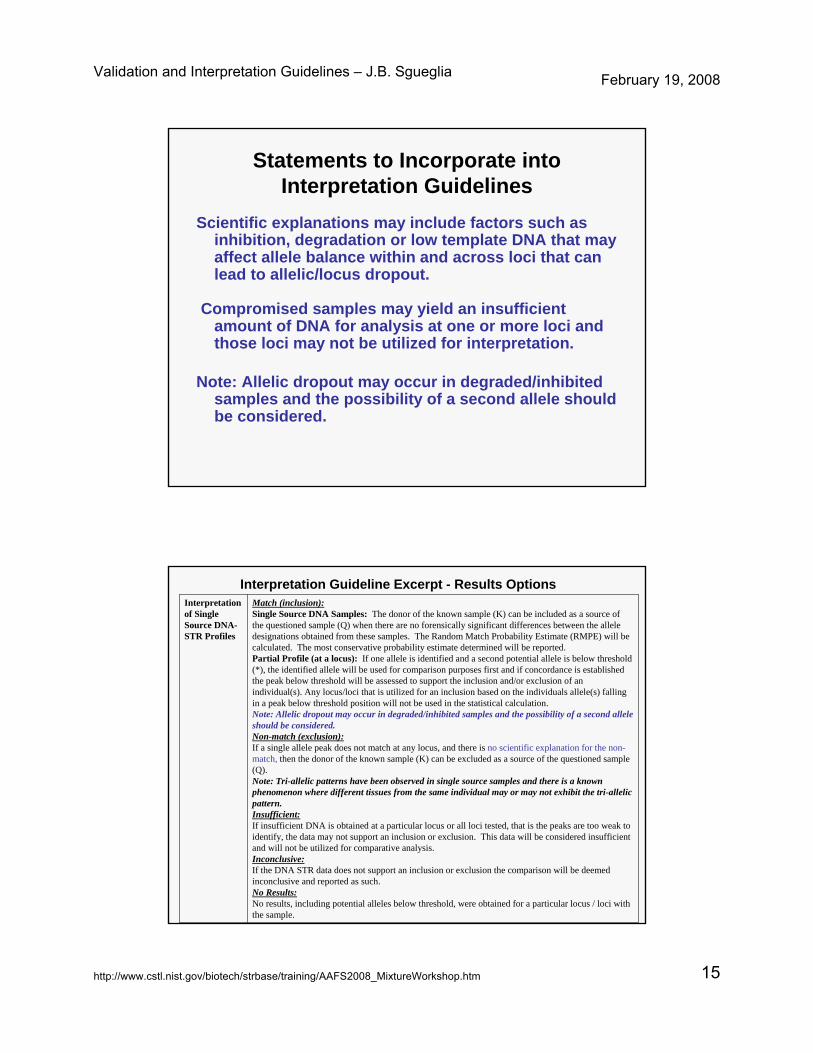
Statements to Incorporate into Interpretation Guidelines
Scientific explanations may include factors such as inhibition, degradation or low template DNA that may affect allele balance within and across loci that can lead to allelic/locus dropout.
Compromised samples may yield an insufficient amount of DNA for analysis at one or more loci and those loci may not be utilized for interpretation.
Note: Allelic dropout may occur in degraded/inhibited samples and the possibility of a second allele should be considered.
Match (inclusion):Single Source DNA Samples: The donor of the known sample (K) can be included as a source of the questioned sample (Q) when there are no forensically significant differences between the allele designations obtained from these samples. The Random Match Probability Estimate (RMPE) will be calculated. The most conservative probability estimate determined will be reported.Partial Profile (at a locus): If one allele is identified and a second potential allele is below threshold (*), the identified allele will be used for comparison purposes first and if concordance is established the peak below threshold will be assessed to support the inclusion and/or exclusion of an individual(s). Any locus/loci that is utilized for an inclusion based on the individuals allele(s) falling in a peak below threshold position will not be used in the statistical calculation.Note: Allelic dropout may occur in degraded/inhibited samples and the possibility of a second allele should be considered.Non-match (exclusion):If a single allele peak does not match at any locus, and there is no scientific explanation for the non-match, then the donor of the known sample (K) can be excluded as a source of the questioned sample (Q).Note: Tri-allelic patterns have been observed in single source samples and there is a known phenomenon where different tissues from the same individual may or may not exhibit the tri-allelic pattern.Insufficient:If insufficient DNA is obtained at a particular locus or all loci tested, that is the peaks are too weak to identify, the data may not support an inclusion or exclusion. This data will be considered insufficient and will not be utilized for comparative analysis. Inconclusive:If the DNA STR data does not support an inclusion or exclusion the comparison will be deemed inconclusive and reported as such.No Results:No results, including potential alleles below threshold, were obtained for a particular locus / loci with the sample.
Interpretation of Single Source DNA-STR Profiles
Interpretation Guideline Excerpt - Results Options

Validation and Interpretation Guidelines – J.B. Sgueglia February 19, 2008
http://www.cstl.nist.gov/biotech/strbase/training/AAFS2008_MixtureWorkshop.htm 16
Y Filer Kit Balance-Interpretation Guidelines
• The validation binder summarizes the balance across the Yfiler™system. The graphs depict the overall megaplex balance. The Yfiler™ kit did not exhibit consistency from sample to sample. Balance across loci was variable within each color and did not exhibit a general trend from color to color.
• Given the inconsistency in balance across loci, data must be assessed carefully to interpret profiles which may be indicative of degradation and/or inhibition. Caution must be exercised and data scrutinized if a particular locus exhibits imbalance relative to other loci in the multiplex system. It is recommended to be conservative, due to imbalance issues, by only using data present to interpretminor components of a mixture (e.g., there may not be a reasonable scientific explanation, based on expected kit performance, for the absence of an allele(s) at a locus due to degradation and/or inhibition).
Y Filer Kit -Interpretation Guidelines
• InsufficientDue to insufficient DNA, minor components may not be detectable at one or more loci. If the minor component result is not available at a locus, the peaks are too weak to report, or the minor alleles may be masked by the main allele, then a conservative interpretation must be made at that locus. The data will be evaluated cautiously. For comparative analysis, alleles present in the K but not in the Q may not be considered exclusionary for samples exhibiting degradation, inhibition or those samples known to contain minimal template DNA.
Y-STR balance across loci is inconsistent and some loci may not contain the full complement of information from the minor component(s) in a mixture. Peak height information may not allow the analyst to have a reasonable scientific expectation of data present or absent at a locus. In such cases, that particular locus may contain insufficient data for comparative analyses and will be considered inconclusive for interpretive purposes. The other loci containing sufficient interpretable data may be used to make a comprehensive interpretation of the Q to the K.
Validation and Interpretation Guidelines – J.B. Sgueglia February 19, 2008
http://www.cstl.nist.gov/biotech/strbase/training/AAFS2008_MixtureWorkshop.htm 17
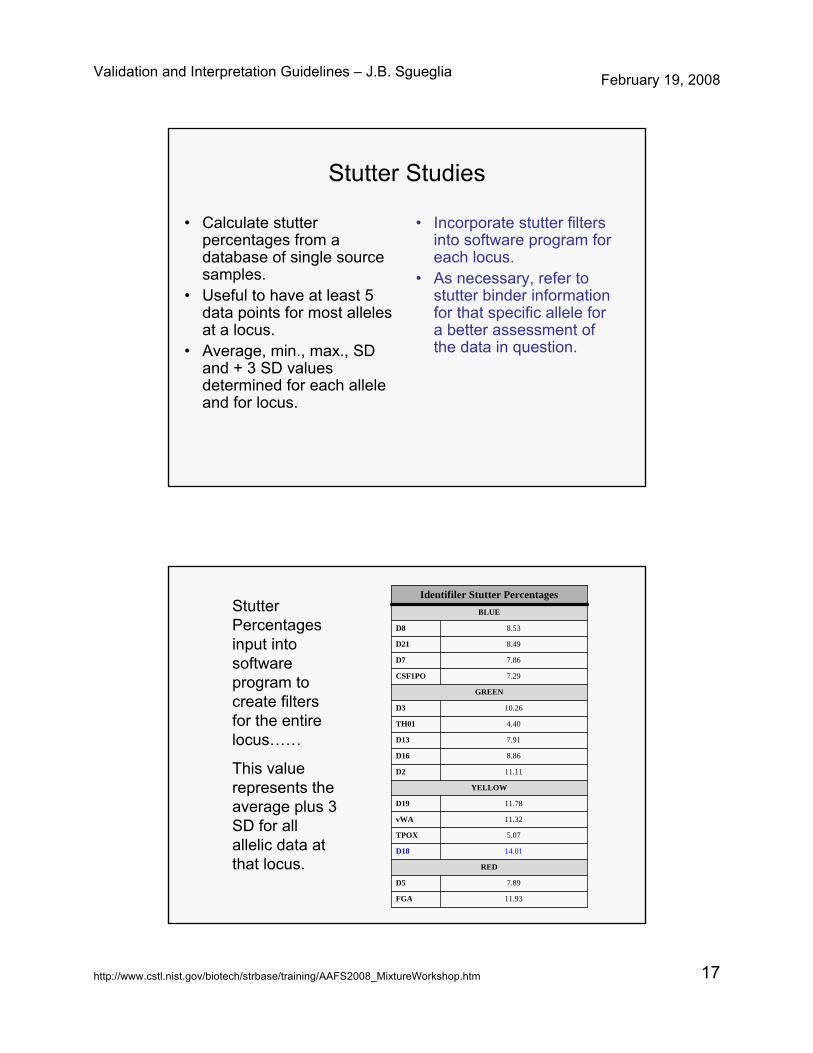
Stutter Studies
• Calculate stutter percentages from a database of single source samples.
• Useful to have at least 5 data points for most alleles at a locus.
• Average, min., max., SD and + 3 SD values determined for each allele and for locus.
• Incorporate stutter filters into software program for each locus.
• As necessary, refer to stutter binder information for that specific allele for a better assessment of the data in question.
11.93FGA
7.89D5
RED
14.01D18
5.07TPOX
11.32vWA
11.78D19
YELLOW
11.11D2
8.86D16
7.91D13
4.40TH01
10.26D3
GREEN
7.29CSF1PO
7.86D7
8.49D21
8.53 D8
BLUE
Identifiler Stutter PercentagesStutter Percentages input into software program to create filters for the entire locus……
This value represents the average plus 3 SD for all allelic data at that locus.
Validation and Interpretation Guidelines – J.B. Sgueglia February 19, 2008
http://www.cstl.nist.gov/biotech/strbase/training/AAFS2008_MixtureWorkshop.htm 18
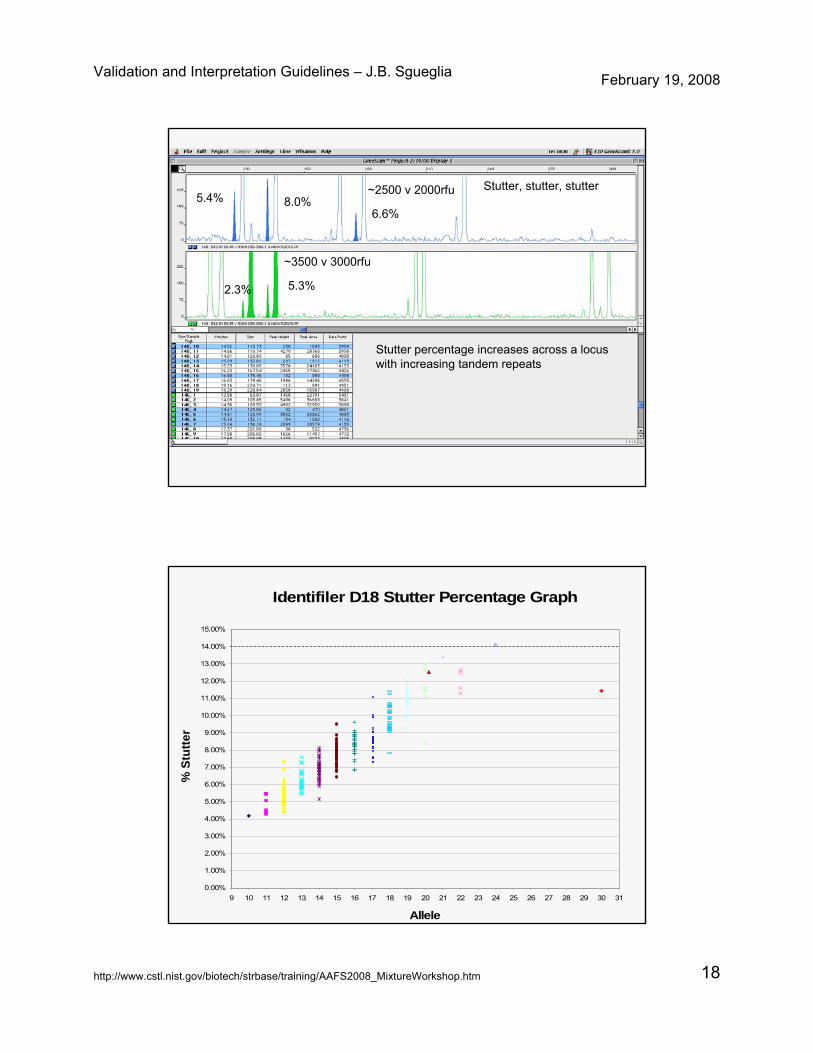
Stutter, stutter, stutter
Stutter percentage increases across a locus with increasing tandem repeats
5.4% 8.0%6.6%
~2500 v 2000rfu
2.3% 5.3%
~3500 v 3000rfu
Identifiler D18 Stutter Percentage Graph
0.00%
1.00%
2.00%
3.00%
4.00%
5.00%
6.00%
7.00%
8.00%
9.00%
10.00%
11.00%
12.00%
13.00%
14.00%
15.00%
9 10 11 12 13 14 15 16 17 18 19 20 21 22 23 24 25 26 27 28 29 30 31
Allele
% S
tutte
r%
Stu
tter

Validation and Interpretation Guidelines – J.B. Sgueglia February 19, 2008
http://www.cstl.nist.gov/biotech/strbase/training/AAFS2008_MixtureWorkshop.htm 19
14.01%2.04%2.00%14.11%4.18%8.02%266ALL ALLELES
11.45%11.45%0.00%11.45%11.45%11.45%130
14.11%14.11%0.00%14.11%14.11%14.11%124
13.94%10.10%0.64%12.63%11.32%12.02%422
13.40%13.40%0.00%13.40%13.40%13.40%121
12.54%12.54%0.00%12.54%12.54%12.54%120.2
15.82%6.92%1.48%12.98%8.38%11.37%720
12.97%8.79%0.70%12.48%9.35%10.88%2119
12.16%7.49%0.78%11.40%7.81%9.83%2718
11.21%6.03%0.86%11.08%7.28%8.62%3817
10.26%6.36%0.65%9.61%6.85%8.31%3016
9.65%5.75%0.65%9.51%6.45%7.70%3615
8.76%5.01%0.63%8.10%5.14%6.89%3614
7.93%4.54%0.57%7.60%5.43%6.24%2613
7.38%3.49%0.65%7.37%4.42%5.44%3012
6.48%3.23%0.54%5.48%4.27%4.85%611
4.18%4.18%0.00%4.18%4.18%4.18%110
(+3) S.D.(-3) S.D.S.D.MaxMinAverageData PointsAllele
Identifiler D18S51
Stutter peaks will be assessed for the inclusion and/ or exclusion of an individual(s). Any locus/loci that is utilized for an inclusion based on the individual’s allele(s) falling in a stutter position, which is below threshold, would not be used in the statistical calculation.
The overall DNA profile must be evaluated for the presence of a mixture of DNA. Single source profiles may exhibit stutter, n-4 & n+4, and/ or elevated stutter which should be edited out. Caution should be exercised with this interpretation.
Check % stutter range (minimum and maximum) and evaluate whether the peak should be edited out or indicative of an allele of a mixture. If indicative of an allele:> reporting threshold: report with allelic designation< reporting threshold, used in the comprehensive interpretation.An individual may be included based on the inclusion in a stutter position.
Stutter % is > Average % Stutter + 3 S.D. (Locus) and > Average % Stutter + 3 S.D. (Allele)
Assess peak and manually edit out as stutter, if appropriateStutter % is > Average % Stutter + 3 S.D. (Locus) but < Average % Stutter + 3 S.D. (Allele)
Check stutter data for allele in question; may be a mixtureStutter % is > Average % Stutter + 3 S.D. (Locus)
GeneMapper™ ID probably filtered it out; if not, manually edit it out
Stutter % is < Average % Stutter + 3 S.D. (Locus)
THEN…..IF…..Summary of Stutter Evaluation
Interpretation Guideline Excerpt - for Stutter
Validation and Interpretation Guidelines – J.B. Sgueglia February 19, 2008
http://www.cstl.nist.gov/biotech/strbase/training/AAFS2008_MixtureWorkshop.htm 20
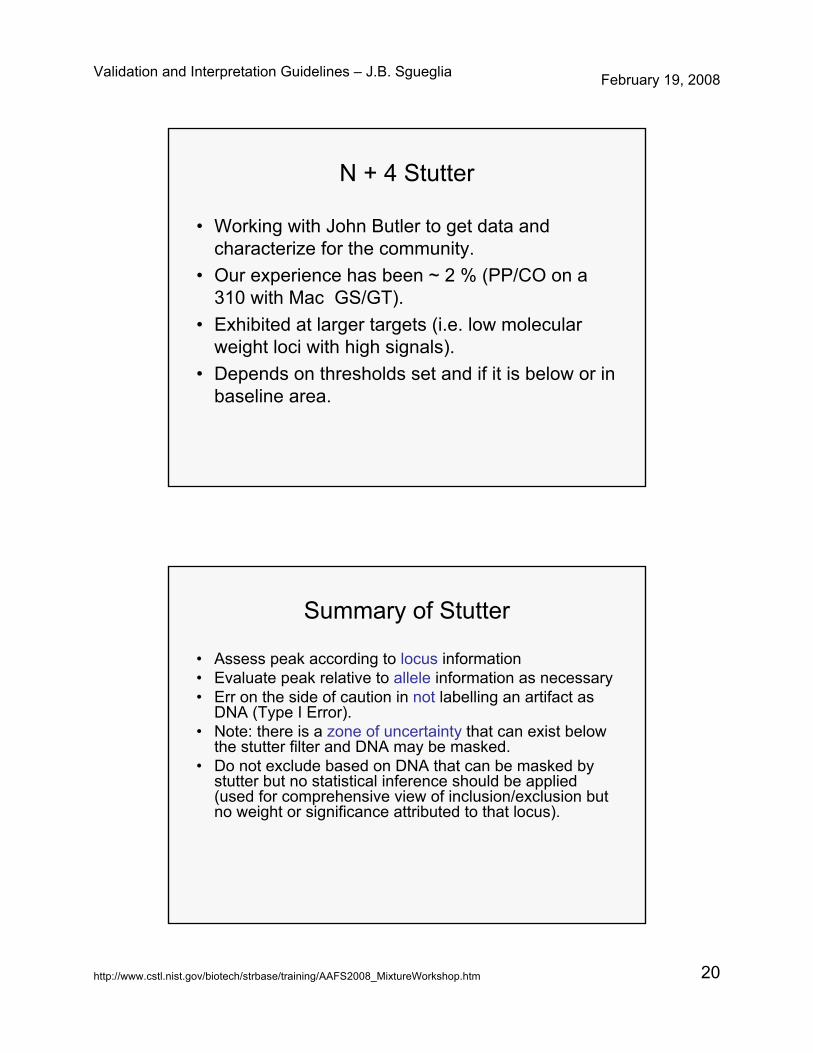
N + 4 Stutter
• Working with John Butler to get data and characterize for the community.
• Our experience has been ~ 2 % (PP/CO on a 310 with Mac GS/GT).
• Exhibited at larger targets (i.e. low molecular weight loci with high signals).
• Depends on thresholds set and if it is below or in baseline area.
Summary of Stutter
• Assess peak according to locus information• Evaluate peak relative to allele information as necessary• Err on the side of caution in not labelling an artifact as
DNA (Type I Error).• Note: there is a zone of uncertainty that can exist below
the stutter filter and DNA may be masked.• Do not exclude based on DNA that can be masked by
stutter but no statistical inference should be applied (used for comprehensive view of inclusion/exclusion but no weight or significance attributed to that locus).

Validation and Interpretation Guidelines – J.B. Sgueglia February 19, 2008
http://www.cstl.nist.gov/biotech/strbase/training/AAFS2008_MixtureWorkshop.htm 21
Mixture Ratio’s
• Two sets of mixtures– Most shared alleles (@ 12/15 loci)– Least shared alleles (@ 7/15 loci)– Ratios prepared to contain 2ng/10ul– 1:1, 1:5, 1:10, 1:15, 1:20 and vice-versa
• Detection of minor contributor established above RT and NT.
• Partial profiles for some loci @ 1:10 and greater
ARTIFACTS
• PCR– Stutter– Non-specific product– Split peaks– Y primer site mutation
• STR– Pull Up (Bleed through)– Spikes– Dye Blobs
• STR runs– Bubbles– Waves– Mis-shapen peaks
Validation and Interpretation Guidelines – J.B. Sgueglia February 19, 2008
http://www.cstl.nist.gov/biotech/strbase/training/AAFS2008_MixtureWorkshop.htm 22
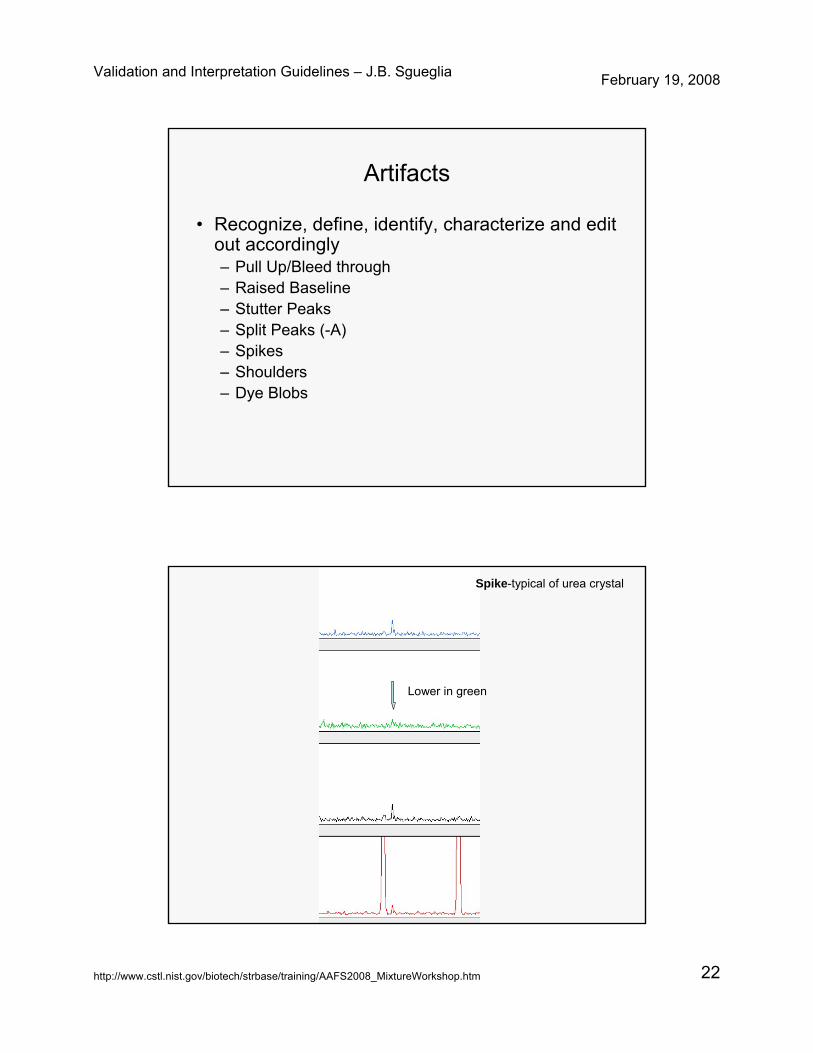
Artifacts
• Recognize, define, identify, characterize and edit out accordingly– Pull Up/Bleed through– Raised Baseline– Stutter Peaks– Split Peaks (-A)– Spikes– Shoulders– Dye Blobs
Spike-typical of urea crystal
Lower in green
Validation and Interpretation Guidelines – J.B. Sgueglia February 19, 2008
http://www.cstl.nist.gov/biotech/strbase/training/AAFS2008_MixtureWorkshop.htm 23
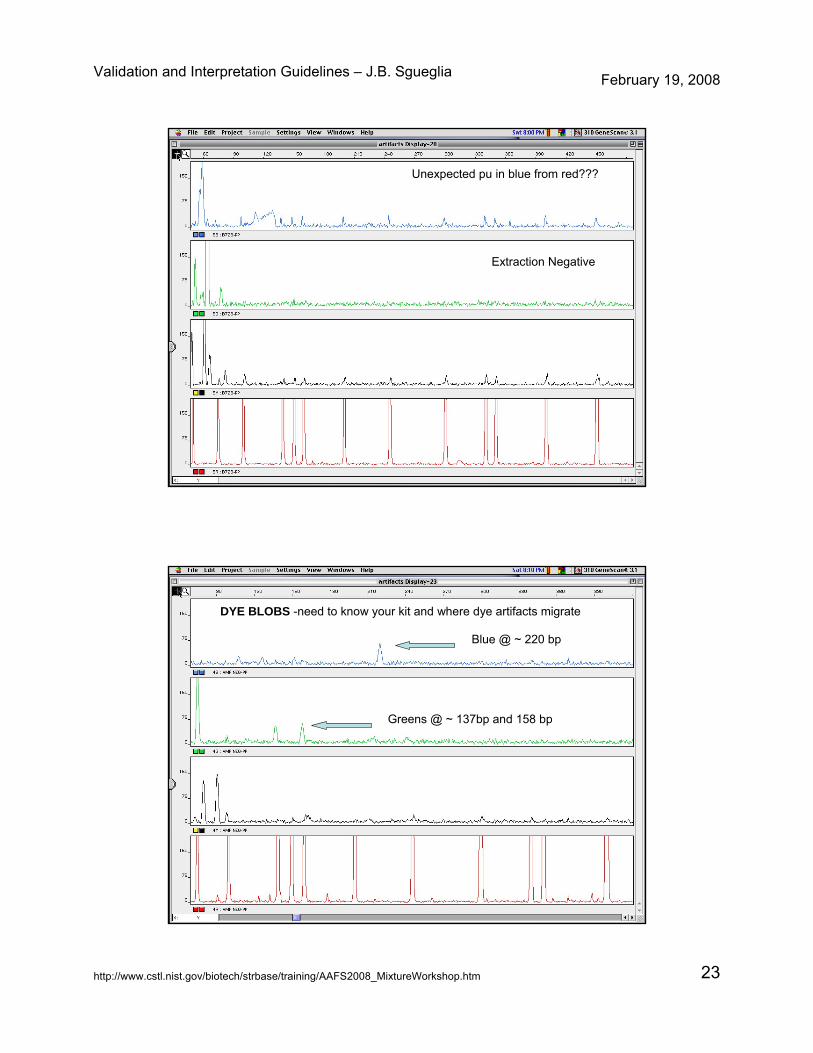
Unexpected pu in blue from red???
Extraction Negative
DYE BLOBS -need to know your kit and where dye artifacts migrate
Blue @ ~ 220 bp
Greens @ ~ 137bp and 158 bp

Validation and Interpretation Guidelines – J.B. Sgueglia February 19, 2008
http://www.cstl.nist.gov/biotech/strbase/training/AAFS2008_MixtureWorkshop.htm 24
Dye Blobs— Do you think these will interfere with allele calls??FGA
D8
Assessing a Profile
• Is it a mixture?• How many individuals?
– Assumption of only 2 (e.g. intimate sample: if one is victim, deduce suspect using obligate alleles-foreign to V)
– More than one source or @ least X individuals (if greater than 2)
• Based only on called alleles (not pabt’s)
• Is there a major and a minor (s)?
Validation and Interpretation Guidelines – J.B. Sgueglia February 19, 2008
http://www.cstl.nist.gov/biotech/strbase/training/AAFS2008_MixtureWorkshop.htm 25
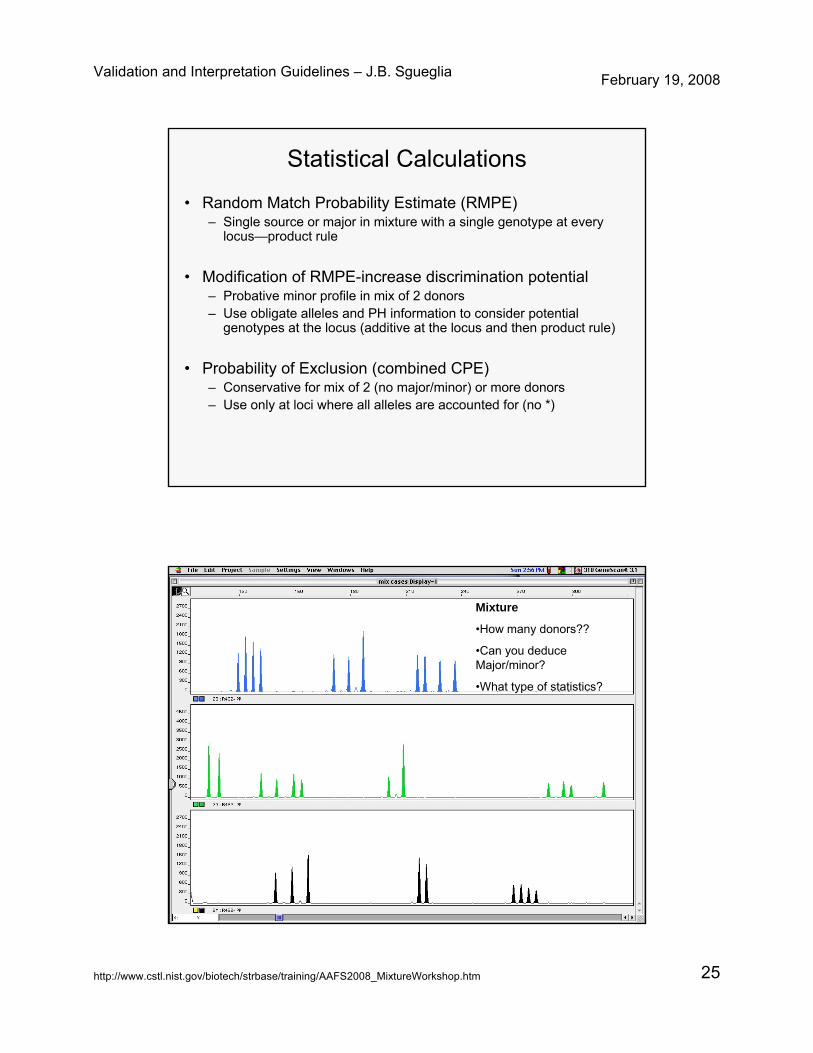
Statistical Calculations
• Random Match Probability Estimate (RMPE)– Single source or major in mixture with a single genotype at every
locus—product rule
• Modification of RMPE-increase discrimination potential– Probative minor profile in mix of 2 donors– Use obligate alleles and PH information to consider potential
genotypes at the locus (additive at the locus and then product rule)
• Probability of Exclusion (combined CPE)– Conservative for mix of 2 (no major/minor) or more donors– Use only at loci where all alleles are accounted for (no *)
Mixture
•How many donors??
•Can you deduce Major/minor?
•What type of statistics?
Validation and Interpretation Guidelines – J.B. Sgueglia February 19, 2008
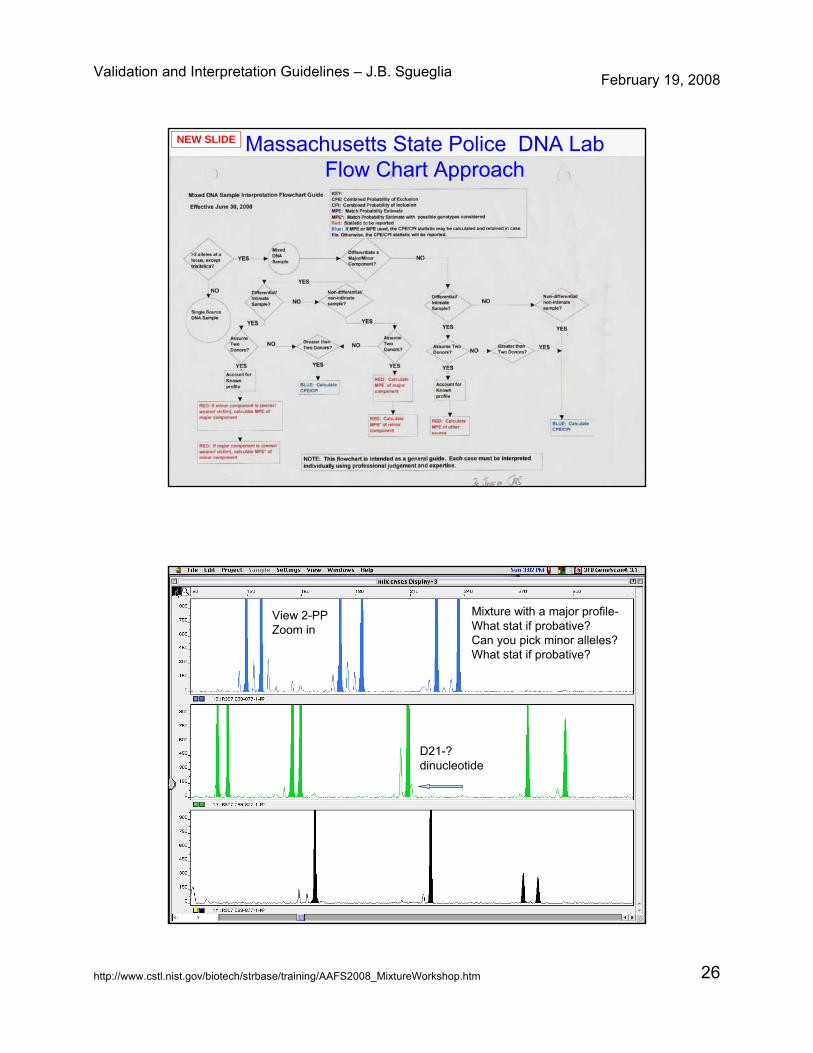
http://www.cstl.nist.gov/biotech/strbase/training/AAFS2008_MixtureWorkshop.htm 26
Massachusetts State Police DNA LabFlow Chart Approach
NEW SLIDE
View 2-PPZoom in
Mixture with a major profile-What stat if probative? Can you pick minor alleles?What stat if probative?
D21-? dinucleotide
Validation and Interpretation Guidelines – J.B. Sgueglia February 19, 2008
http://www.cstl.nist.gov/biotech/strbase/training/AAFS2008_MixtureWorkshop.htm 27
Elements of Laboratory-Specific Mixture Interpretation Guidelines
• Introduction• Mixture Evidence Profile Evaluation
– Signal saturation– Alleles in stutter product positions (using stutter %)– Balance within a locus (using heterozygote PHRs)– Balance across loci
• Interpretation Possibilities (with examples)– Match, non-match, insufficient, inconclusive
• Worked statistical examples• Use of IF/THEN tables and flow charts
Acknowledgements
• AAFS • John Butler• MA State Police Mixture/Interpretation training
with JBS, Dr. George Carmody & Ray Wickenheiser
• Graphs-Dr. Sandra Haddad• All DNA analysts working with difficult mixtures
Validation and Interpretation Guidelines – J.B. Sgueglia February 19, 2008
http://www.cstl.nist.gov/biotech/strbase/training/AAFS2008_MixtureWorkshop.htm 28
Validation Studies• Database
– Caucasians– African Americans– Hispanics
Stutter Studies
• Variants– Detection of New
Alleles– ‘Far Out’ Variant
• Balancing– Loci– Alleles

Validation and Interpretation Guidelines – J.B. Sgueglia February 19, 2008
http://www.cstl.nist.gov/biotech/strbase/training/AAFS2008_MixtureWorkshop.htm 29
Precision
• Establish instrument is performing properly to designate allele categories.
• Address temperature fluctuations and oven door issues prior to running other validation studies.
• General rule-the standard deviation of measurements for any allele should not exceed 0.15 bp so the window bin of +/- 3 SD for sizing is less than 1 bp (3 x .15 = .45 x 2 = 0.9 bp)
• Software usually establishes the bin around the ladder size as +/- 0.5 bp) of the average size of that fragment in the ladder.
3130xl (CE004) (Ned)- Estimation of 250 Base Pair RangeApprox. +3 standard deviation = 246.45
Approximate average value = 246.11Approx. –3 standard deviation = 245.77
250 Base Pair Precision Data Check

Validation and Interpretation Guidelines – J.B. Sgueglia February 19, 2008
http://www.cstl.nist.gov/biotech/strbase/training/AAFS2008_MixtureWorkshop.htm 30
330.25329.02329.6312CSF1PO
322.03320.83321.4310CSF1PO
275.42274.73275.0811D7S820
271.30270.67270.9810D7S820
208.26207.86208.0630D21S11
144.15143.60143.8813D8S1179
+3 Standard Deviations
-3 Standard Deviations
Average Size (bp)AlleleLocus
Average Fragment Range (bp)BLUE
Amplification Positive Precision Data Check
‘Far Out’ Variant
16,17
15,15
19 44.2
FGA

Validation and Interpretation Guidelines – J.B. Sgueglia February 19, 2008
http://www.cstl.nist.gov/biotech/strbase/training/AAFS2008_MixtureWorkshop.htm 31
MATCH PROBABILITY ESTIMATE
Match Probability Estimate (MPE)• RMP-random match probability for a single
source (SS) sample or Major in a mixture
• Statistic calculated as 1 genotype @ each locus• If minor component is deduced to 1 GT at each• Use product rule—
• Allele frequencies to determine GT frequencies to cross multiply to obtain the profile frequency (MPE)
• Homozygote GT frequency: p2 + p(1-p)θ• Heterozygote GT frequency: 2pq
Modified MPE
• Modified MPE-combination of one or more possible GT’s at a locus are added together to obtain the genotype frequency– Increases the discrimination potential– Minor is probative and assumption of 2 donors– Utilize peak height information– Use ‘obligate’ allele of minor component– After addition @ locus, use product rule across loci– Should use for intimate samples and may use for other scenarios,
as applicable

Validation and Interpretation Guidelines – J.B. Sgueglia February 19, 2008
http://www.cstl.nist.gov/biotech/strbase/training/AAFS2008_MixtureWorkshop.htm 32
Mixture profile having alleles > instrument specific rfu threshold and assuming two donors (including the victim/source individual):
The data must support the assumption that there are only 2 contributors to the DNA mixture. The assume two contributors is reserved for intimate swabs e.g., vaginal swabs, swabs taken from a person e.g., breast swabs, hand swabs. Alternative scenarios may be considered at the Technical Leader’s and/or DNA Supervisor’s discretion. Approval will be documented in the case file.
Differentiate the contributor profiles and account for the victim/source using peak heights and mixture ratios, if possible. For example, use the non-sperm fraction as a reference to account for the carry-over profile in the sperm fraction. After assessment of the victim/source profile, if a single allele peak in the questioned sample (Q) fraction does not match the known sample (K) at any locus and there is no scientific explanation for the non-match, then the donor of the known sample (K) can be excluded as a source of the questioned sample (Q). Utilize the mixture interpretation worksheet Appendix A to document calculations/evaluation. This worksheet is also available electronically in the current worksheets folder.If there is a match at all loci a match is declared and a random match probability estimate may be calculated.
If it is not possible to deduce out at all loci, the combination of all possible genotypes at the unconvoluted locus could be included in the statistical calculation, alternatively this locus could be dropped from the statistical calculation but it must still include the individual as a contributor.
Possible genotypes
Non Sperm
Fraction profile
Comments
Possible Component
profiles giving rise to observed
mixture
Peak heightAlleleLocus
Example of a Mixture Worksheet to deduce potential genotypes of a minor contributor

Validation and Interpretation Guidelines – J.B. Sgueglia February 19, 2008
http://www.cstl.nist.gov/biotech/strbase/training/AAFS2008_MixtureWorkshop.htm 33
The DNA profile obtained from the [Questioned Item ] is a mixture of DNA consistent with DNA profiles from [Victim and Exemplar]. Assuming 1) two contributors and 2) [victim's name] is one of the contributors; [Exemplar ] is included as the other potential contributor.
Reporting Template Excerpt
Combined Probability of Exclusion
• CPE-conservative calculation of the estimated proportion of individuals that can be excluded as a contributor to a mixed stain
• Mixture of more than 2 individuals
• 1:1 ratio where major/minor cannot be deduced
• MUST have all alleles accounted for to employ at a locus (no potential alleles below threshold)
• Convert to CPI (inclusion)
Validation and Interpretation Guidelines – J.B. Sgueglia February 19, 2008
http://www.cstl.nist.gov/biotech/strbase/training/AAFS2008_MixtureWorkshop.htm 34
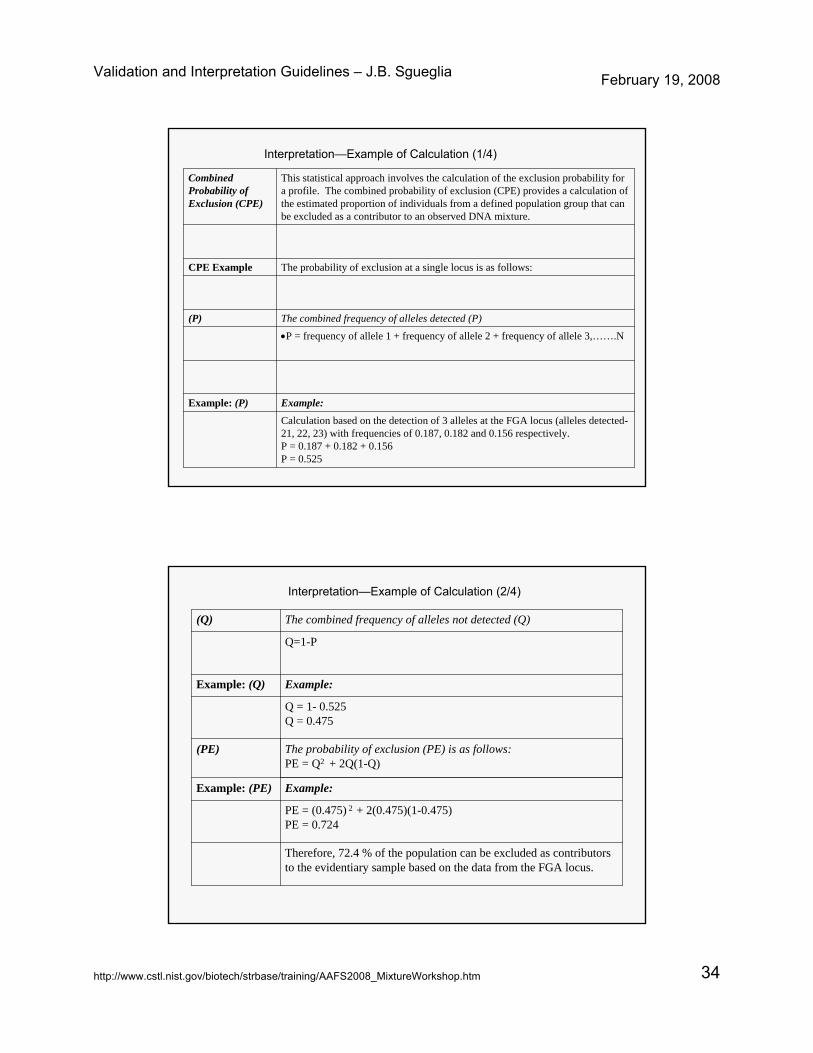
Calculation based on the detection of 3 alleles at the FGA locus (alleles detected-21, 22, 23) with frequencies of 0.187, 0.182 and 0.156 respectively.P = 0.187 + 0.182 + 0.156P = 0.525
Example:Example: (P)
•P = frequency of allele 1 + frequency of allele 2 + frequency of allele 3,…….N
The combined frequency of alleles detected (P)(P)
The probability of exclusion at a single locus is as follows:CPE Example
This statistical approach involves the calculation of the exclusion probability for a profile. The combined probability of exclusion (CPE) provides a calculation of the estimated proportion of individuals from a defined population group that can be excluded as a contributor to an observed DNA mixture.
Combined Probability of Exclusion (CPE)
Interpretation—Example of Calculation (1/4)
Therefore, 72.4 % of the population can be excluded as contributors to the evidentiary sample based on the data from the FGA locus.
PE = (0.475) 2 + 2(0.475)(1-0.475)PE = 0.724
Example:Example: (PE)
The probability of exclusion (PE) is as follows:PE = Q2 + 2Q(1-Q)
(PE)
Q = 1- 0.525Q = 0.475
Example:Example: (Q)
Q=1-P
The combined frequency of alleles not detected (Q)(Q)
Interpretation—Example of Calculation (2/4)
Validation and Interpretation Guidelines – J.B. Sgueglia February 19, 2008
http://www.cstl.nist.gov/biotech/strbase/training/AAFS2008_MixtureWorkshop.htm 35
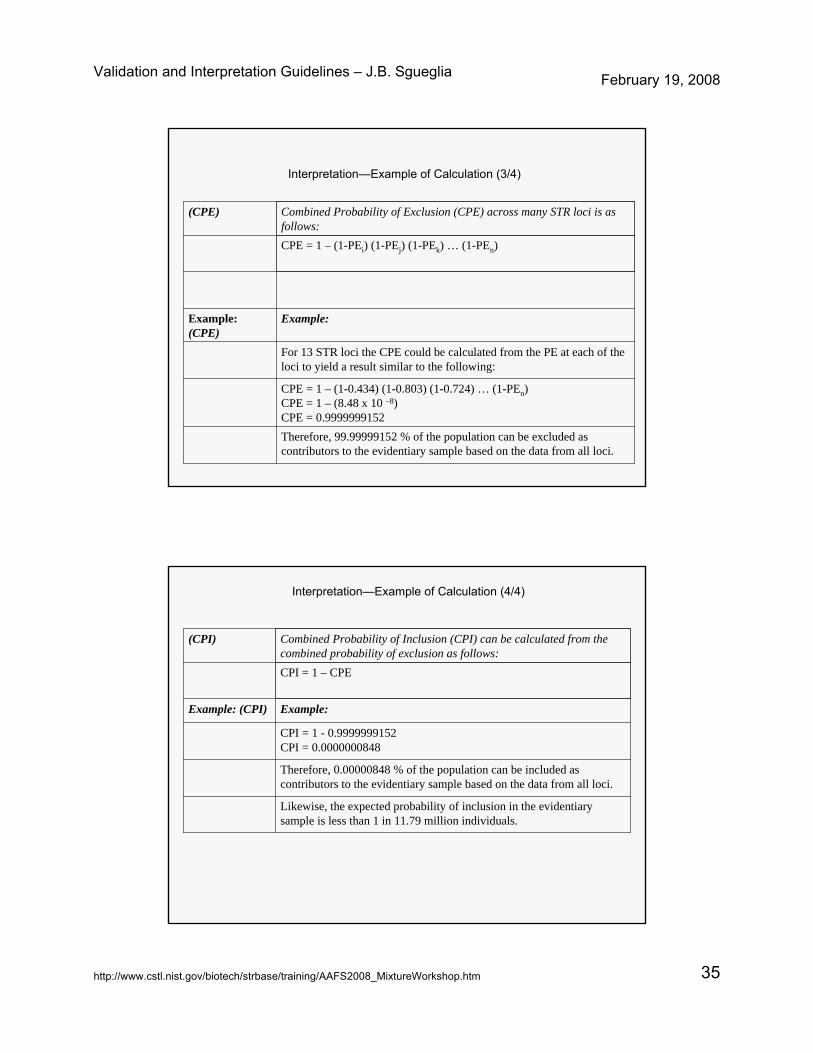
Therefore, 99.99999152 % of the population can be excluded as contributors to the evidentiary sample based on the data from all loci.
CPE = 1 – (1-0.434) (1-0.803) (1-0.724) … (1-PEn)CPE = 1 – (8.48 x 10 –8)CPE = 0.9999999152
For 13 STR loci the CPE could be calculated from the PE at each of the loci to yield a result similar to the following:
Example:Example: (CPE)
CPE = 1 – (1-PEi) (1-PEj) (1-PEk) … (1-PEn)
Combined Probability of Exclusion (CPE) across many STR loci is as follows:
(CPE)
Interpretation—Example of Calculation (3/4)
Likewise, the expected probability of inclusion in the evidentiary sample is less than 1 in 11.79 million individuals.
Therefore, 0.00000848 % of the population can be included as contributors to the evidentiary sample based on the data from all loci.
CPI = 1 - 0.9999999152CPI = 0.0000000848
Example:Example: (CPI)
CPI = 1 – CPE
Combined Probability of Inclusion (CPI) can be calculated from the combined probability of exclusion as follows:
(CPI)
Interpretation—Example of Calculation (4/4)
Validation and Interpretation Guidelines – J.B. Sgueglia February 19, 2008
http://www.cstl.nist.gov/biotech/strbase/training/AAFS2008_MixtureWorkshop.htm 36
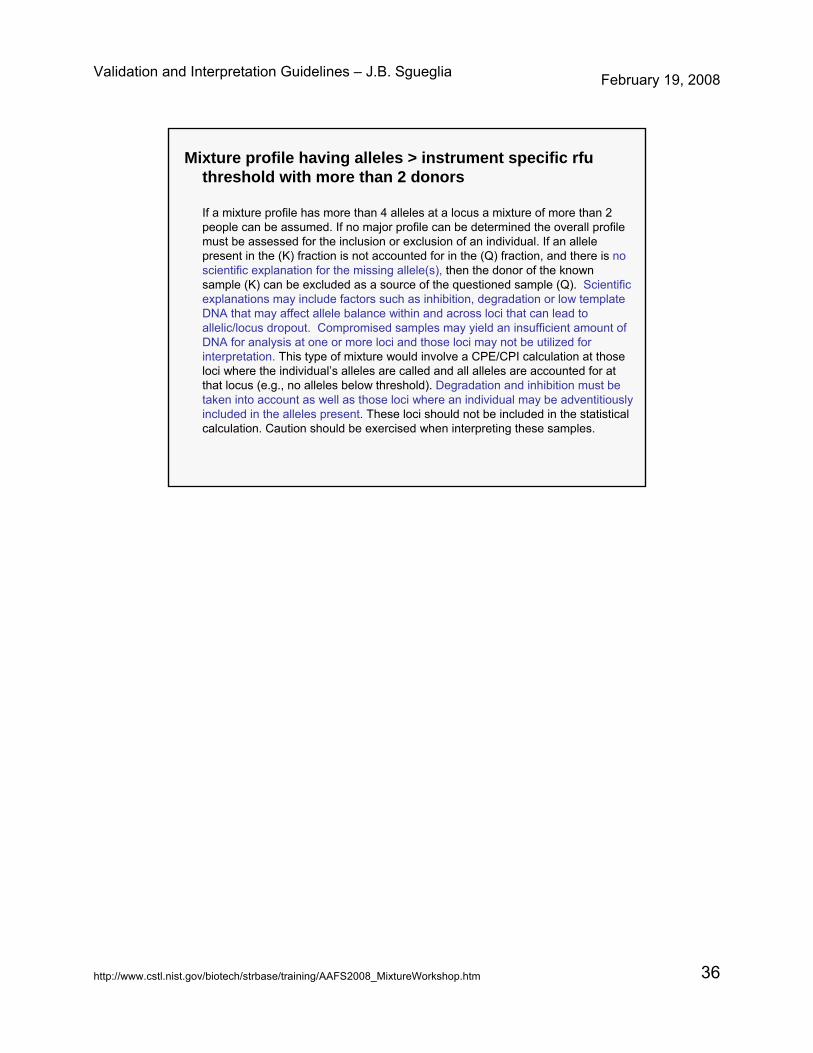
Mixture profile having alleles > instrument specific rfuthreshold with more than 2 donors
If a mixture profile has more than 4 alleles at a locus a mixture of more than 2 people can be assumed. If no major profile can be determined the overall profile must be assessed for the inclusion or exclusion of an individual. If an allele present in the (K) fraction is not accounted for in the (Q) fraction, and there is no scientific explanation for the missing allele(s), then the donor of the known sample (K) can be excluded as a source of the questioned sample (Q). Scientific explanations may include factors such as inhibition, degradation or low template DNA that may affect allele balance within and across loci that can lead to allelic/locus dropout. Compromised samples may yield an insufficient amount of DNA for analysis at one or more loci and those loci may not be utilized for interpretation. This type of mixture would involve a CPE/CPI calculation at those loci where the individual’s alleles are called and all alleles are accounted for at that locus (e.g., no alleles below threshold). Degradation and inhibition must be taken into account as well as those loci where an individual may be adventitiously included in the alleles present. These loci should not be included in the statistical calculation. Caution should be exercised when interpreting these samples.