7 dr. ivan miestchovich economic outlook & real estate ... · 7 dr. ivan miestchovich economic...
TRANSCRIPT
2017 Dr. Ivan Miestchovich
Economic Outlook & Real Estate Forecast
for Metropolitan New Orleans
Hosted by:
Institute for Economic Development
& Real Estate Research
Executive Partner: Latter & Blum, Inc.
River Parishes
Source: DDD New Orleans

Table of Contents
Agenda Inside Front Cover
Table of Contents 1
Speaker Biographies 2
Redeveloping New Orleans
Cullan Maumas 6
Chris Ross 11
Kurt Weigle 20
Commercial Real Estate Panel
Retail Market, Stephanie Hilferty 26
Office Market, Cres Gardner 33
Residential Real Estate Panel
Single Family Housing, Richard Haase 38
Metro New Orleans Multi-Family Market, Larry Schedler 43
Institute for Economic Development & Real Estate Research Partners Back Cover
2017 Dr. Ivan Miestchovich Economic Outlook & Real Estate Forecast Seminar - 1

THE UNIVERSITY OF NEW ORLEANS / LATTER & BLUM, INC. 2017 Economic Outlook & Real Estate Forecast Seminar
SPEAKER BIOGRAPHIES
Dr. John Nicklow, President, the University of New Orleans
Dr. John Nicklow is the seventh leader in the history of the University of New Orleans. He was selected Presi-dent by the University of Louisiana System Board of Supervisors on March 16, 2016. Prior to his ascent to the presidency, he spent nine months as the University’s Provost and Vice President for Academic Affairs. President Nicklow brings to the position nearly 18 years of higher education experience as a faculty member and adminis-trator with extensive experience in research, enrollment management, student success initiatives, fundraising, campus-wide collaborations and academic program innovation. As Provost, Dr. Nicklow served as the Chief Academic Officer for the University of New Orleans and was responsible for managing academic programs and support units and the policies and practices that affect the academic success of students at the University. He oversaw undergraduate and graduate education, recruitment and retention of students, faculty affairs, includ-ing promotion and tenure, outreach to the community, information technology, and institutional effectiveness and assessment. President Nicklow previously held the position of Provost and Vice Chancellor for Academic Affairs at Southern Illinois University, as well as earlier appointments as Assistant Provost for Enrollment Man-agement, Associate Dean of Engineering, and Professor of Civil Engineering at that institution. As Provost, Dr. Nicklow led an effort that resulted in increased overall student enrollment, following more than 10 years of consecutive declines. Other highlights of his tenure included two of the largest freshmen classes in 20 years, the largest international student population in 30 years and strong gains in the number of transfer students as well as rates of student persistence. Dr. Nicklow helped triple the size of the University Honors Program; grew ac-credited online programs and online enrollment; managed new, successful recruitment initiatives; created cen-tralized First-Year Advisement; and established a number of cross-disciplinary and new academic programs. President Nicklow has been widely recognized at the university level by the American Society of Civil Engineers and by industry for his teaching and research. His research interests are focused on STEM education and on environmental and water resources systems optimization. He has published more than 75 articles and is the author of four books. He is a registered professional engineer, a certified professional hydrologist, a Fellow of the American Society of Civil Engineers, and a Diplomat of the American Academy of Water Resources Engi-neers. President Nicklow earned B.S. and M.S. degrees in Civil Engineering from Bucknell University in Lewisburg, Pennsylvania and a Ph.D., in Civil Engineering from Arizona State University. He began his career as an Environmental Engineering Officer with the U.S. Public Health Service and was responsible for design and construction of water supply and waste disposal facilities for American Indian communities. President Nicklow is a native of Berlin, Pennsylvania. He is married with one son.
Dr. John Williams, Dean, College of Business Administration, University of New Orleans
John A. Williams, Ph.D. is Dean of the College of Business Administration and Veta Professor of Strategy at the University of New Orleans. He holds a Ph.D., Master of Science, and Bachelor of Science from the Pennsylva-nia State University. Prior to joining the University of New Orleans, Dr. Williams held administration positions at Penn State University, Virginia Tech, and Kansas State University. His oversight of the AACSB accredited College of Business Administration includes the Department of Accounting, Department of Economics & Fi-nance, Department of Management and Marketing, and the Lester E. Kabacoff School of Hotel, Restaurant & Tourism Administration. In addition to undergraduate programs in those areas, graduate programs include the MBA, Master of Science in Health Care Management, MS in Accounting and Taxation, MS in Hospitality and Tourism Management, and the Ph.D. degree program in Financial Economics. Executive Education Programs include an Executive Master of Business Administration Program, Executive Master of Health Care Manage-ment Program, and the on-line Master of Science in Hospitality and Tourism Management. Dr. Williams also oversees the AT&T Center, the Center for Economic Development, the Real Estate Market Data Center, the Hospitality Research Center, and the Division of Business & Economic Research. He serves as Director of the Hospitality Research Center (HRC), a Board of Regents Center of Excellence, and the premier university-based hospitality and tourism center in the nation. He also serves as Director of the Division of Business & Economic Research (DBER). Dr. Williams has published numerous articles on hospitality and tourism and has achieved over $3 million grants and contracts focusing on the tourism industry in New Orleans and the state of Louisi-ana. He began his position at the University of New Orleans one month prior to Hurricane Katrina and has conducted many studies and collected a volume of longitudinal data on tourism resiliency and the transforma-tional change of tourism in New Orleans. He is an active member on many boards in the greater New Orleans area and is the President of the South Western Business Dean’s Association.
2017 Dr. Ivan Miestchovich Economic Outlook & Real Estate Forecast Seminar - 2

Dr. Robert Penick, Interim Director, Institute for Economic Development & Real Estate Research and Adjunct Professor, UNO; Senior Vice President & CFO, Latter & Blum, Inc.
Dr. Robert Penick has been appointed the Interim Director of the Institute for Economic Development and Real Estate Research. He also serves as an Adjunct Professor of Finance, teaching undergraduate and graduate cours-es in real estate principles and real estate finance. He currently serves as Senior Vice President and Chief Finan-cial Officer for the Latter & Blum Companies in New Orleans. Dr. Penick holds a B.S. in Finance and an M.B.A. in business administration and management from Loyola University of New Orleans. He also holds a M.Ed. in su-pervision and administration from Our Lady of Holy Cross College of New Orleans. His University of New Orleans education includes a M.S. in Urban Studies and a Ph.D. in Urban Studies with a concentration in real estate and real estate ethics. Dr. Penick also holds an Insurance license in the State of Louisiana. Dr. Penick authored his dissertation on Real Estate Ethics in the State of Louisiana. His writings were referenced in the Real Estate Jour-nal in 2006. He also wrote a Thesis entitled A Qualitative Study of Real Estate Ethics while a student at the Uni-versity of New Orleans. He is currently on the faculty of the NAR Realtor University which offers master’s de-grees in real estate to Realtors across the country. He teaches Personal Finance courses at St. Joseph Abbey and Seminary College in Covington, Louisiana and previously taught at Southeastern Louisiana University in Ham-mond, Louisiana. In 2011 he was named one of the top Money Makers by the City Business publication in New Orleans. He is active in many civic, business, and professional organizations and serves on or has served on the boards of several of them. He currently serves on the International Alumni Association at the University of New Orleans and on the Board of the University of New Orleans Foundation. He also has served on the Board of a local school board as a member and President of that School Board. He is a veteran of the U.S. Army and the U.S. Army Reserves having served more than 30 years and retiring as a Lt. Colonel, Engineer Branch.
Cullan Maumas, Director of Development, New Orleans Redevelopment Fund
Cullan Maumus is the Director of Development for the New Orleans Redevelopment Fund (NORF). NORF is a private equity real estate fund focused on improving the City’s housing stock by eradicating blight and demonstrating that New Orleans is fertile ground for outside investment. Since 2014, Mr. Maumus has overseen the successful completion of 27 rehabilitation projects valued at $13 million. He is currently overseeing $18 million in development of 19 projects ranging from single-family new construction homes for sale, to adaptive reuse of historic churches, and mixed-use condos. Mr. Maumus was born and raised in New Orleans. He graduated from Ben Franklin High School. He holds a BS in Hospitality and Tourism Management from the University of Massachusetts where he was a four-year starter on the University's Baseball Team. He received his MBA from the A.B. Freeman School of Business at Tulane University where he focused his studies on Entrepreneurship and Real Estate Finance. While at Tulane, Mr. Maumus was the President of the Tulane Entrepreneurs' Associ-ation and received numerous awards for his leadership, and service to the school and community. Mr. Maumus currently resides in New Orleans with his wife and son.
Chris Ross, Director, Hospitality Division, NAI/Latter & Blum, Inc.
Chris R. Ross serves as the Director for NAI/Latter & Blum, Inc. Hospitality Division where he specializ-es in Hotel Investment & Brokerage. He has strong expertise of construction, development and hotel operations and an in-depth knowledge of real estate finance that gives him a unique ability to manage transactions successfully for new and seasoned investors. Chris began his career 18 years ago as a commercial real estate sales associate with Latter & Blum, Inc. working in site selecting, lease & con-tract negotiations, and property acquisition & disposition. Chris was the co-lead Broker of one of the largest industrial office sales transaction in the metro New Orleans market and was a pivotal team player in a premier 276-unit apartment transaction in 2013. In 2015, Latter & Blum, Inc. Hospitality Division was a part of the leadership that closed 5 new hotel developments in the CBD- over 850 rooms totaling approximately $200,000,000 in completed transaction cost. The 182-room Oil and Gas Building, the 110-room Moxy by Marriott, the 185-room 1111 Gravier, the 165-room Cambria Suites by Choice, and the 210-room Luxury Boutique Independent NOPSI Building. Chris is a native of New Orleans, LA where he was raised and educated. He previously served as the Director of Housing for New Orleans Neighborhood Development Collaborative, and thru a partnership with McCormack Baron Salazar, work on the team to successfully redevelop the former CJ Peete Public Housing Devel-opment into 450 mixed use units and generated income of $120 million dollars. In 2010, Chris served on New Orleans Mayor Mitch Landrieu’s Housing transition team and was the founding Board Presi-dent of the ARISE Academy Charter School in New Orleans. He is a former board member of Café’ Rec-oncile and a member of the Urban Land Institute. Chris was also recognized by New Orleans City Busi-ness magazine “Success Guide” as one of New Orleans top business people to watch in 2005 and was the 1999 commercial sales rookie of the year within Latter & Blum.
2017 Dr. Ivan Miestchovich Economic Outlook & Real Estate Forecast Seminar - 3

Kurt Weigle, President & CEO, Downtown Development District of New Orleans
Kurt Weigle has been President & CEO of the Downtown Development District (DDD) of New Orle-ans since 2003. During his tenure, the DDD’s focus on quality of life and place-based economic de-velopment strategies to retain & attract Industries of the Mind has led to international recognition of New Orleans as a creative hub, now home to dozens of digital media and tech firms. Downtown is the epicenter for New Orleans’ tech growth, adding an average of 350 new digital media & tech jobs per year. The DDD was instrumental in securing the state of the art University Medical Center, opening in 2015, and VA Medical Center opening in 2016. Since 2006, Downtown New Orleans has welcomed over $6.5 billion of new real estate investment and its residential population has doubled and more than fifty new retail establishments have opened downtown. Mr. Weigle serves on the boards of the National New Markets Fund, New Orleans Police & Justice Foundation, Health Educa-tion Authority of Louisiana, Arts Council of New Orleans, New Orleans Medical Complex and public radio station WWNO. He is a past director of the International Downtown Association and the Com-mittee for a Better New Orleans, and a member of the Super Bowl XLVII Host Committee. Mr. Wei-gle received the Excellence in Government Award in 2007 from the Bureau of Governmental Re-search and is a graduate of the New Orleans Regional Leadership Institute. Mr. Weigle earned his Master of Urban Planning and Bachelor of Arts degrees from the University of Michigan in Ann Ar-bor.
Stephanie Hilferty, Sales & Leasing Associate, SRSA Commercial Real Estate
Stephanie Hilferty joined SRSA in 2007. Stephanie specializes in office leasing throughout the New Orleans metropolitan area and retail representation throughout the state of Louisiana and gulf coast of Mississippi. Working in a market as unique as Southern Louisiana, Stephanie possesses the tenacity and creativity to assist her clients in making the deal. Some of Stephanie’s retail ten-ants include Mattress Firm, Tuesday Morning, Anna’s Linens, Chuck E Cheese, Chuy’s, Charles Schwab, and Nothing Bundt Cakes. Stephanie works closely with physicians/medical groups in the New Orleans area. She has represented Diagnostic Imaging Services, Crescent City Physicians, Tou-ro Hospital and several physician groups. In 2011, Stephanie received the highest volume, first time recipient award from the New Orleans Metropolitan Association of Realtors (NOMAR) for sales and lease transactions in excess of $4.4 million. Every year since, Stephanie has received the NOMAR Achievement Award. Hilferty is a member of the Urban Land Institute (ULI), International Council of Shopping Centers (ICSC), X Team Retail Services Network, and is a licensed real estate agent in Louisiana. She serves on the Lake Vista Property Owners Association Board and as Presi-dent of the New Orleans Alpha Chi Omega alumni chapter. Prior to joining SRSA, Hilferty attended Loyola University New Orleans and graduated summa cum laude with a B.A. in 2007.
Cres Gardner, Vice President, Beau Box of New Orleans
Cres Gardner has worked in the commercial real estate industry since 1998. During his time in the business he has worked with a number of local and national clients to meet their real estate needs, such as the Hertz Investment Group, Progressive Insurance, Fresenius Medical, Men’s Warehouse and Children’s Hospital Medical Practice Corporation. Cres joined Beau Box Commercial Real Estate in 2012 as a Vice President and Manager of the New Orleans Office after 12 years with Transwest-ern. Cres holds the prestigious CCIM designation and is a Past President of the Louisiana CCIM chap-ter and has served on the National Board of Directors for CCIM. He is a member of the Commercial Investment Division (CID), New Orleans Association of Realtors. Cres graduated from Rhodes College and obtained his MBA from the University of New Orleans.
2017 Dr. Ivan Miestchovich Economic Outlook & Real Estate Forecast Seminar - 4

Richard Haase, President, Latter & Blum, Inc.
Richard “Rick” Haase is the President of Latter & Blum Inc. (LBI), the largest independently owned Real
Estate brokerage in the Gulf South with more than thirty offices located throughout Louisiana, Texas
and Southern Mississippi. LBI is comprised of Latter & Blum Inc./REALTORS®, C.J. Brown REALTORS®
Inc., Noles-Frye Realty®, Van Eaton & Romero REALTORS®, Realty Associates, NAI Latter & Blum
Commercial Real Estate, Latter & Blum Insurance Services, Essential Mortgage Company and Platinum
Title & Settlement Services. Established in 1916, the company’s service footprint has grown to include
the markets of Greater New Orleans, Greater Baton Rouge, Houston, Alexandria, Acadiana, Lake
Charles, Houma, Thibodaux, South Lafourche Parish, and Southern Mississippi. The firm handles all
phases of residential and commercial sales, leasing, property management, insurance, appraisals, title
and mortgage services. Latter & Blum’s residential operation is currently ranked number one in
Louisiana and is the twenty-seventh largest in the nation. Mr. Haase has been active in residential
Real Estate sales and brokerage management for more than thirty-five years. Before being named
President of Latter & Blum Inc., Mr. Haase served as President of Latter & Blum’s residential
operations and has held senior leadership positions with market-leading companies in the United
States. Mr. Haase continues to focus on process improvements and growth of Latter & Blum Inc. and
its Real Estate services in the Gulf South and oversees the operations and strategic direction of the
Latter & Blum Family of Companies. He is an expert in strategic planning and management and is a
graduate of the Gestalt Institute’s Organizational Systems Development program. Mr. Haase serves on
the Board of Directors and Executive Committee of the New Orleans Police & Justice Foundation. He is
a member of the Business Council of New Orleans and the River Region and the University of New
Orleans Research and Technology Foundation Board. He is a member of the Board of Directors of
Greater New Orleans, Inc. and the Southeast Super-Region Committee. Mr. Haase is also a member of
the Board of Directors of The Real Estate Services Providers Council. He serves on the Board of
Trustees of the United Way of Southeast Louisiana (UWSELA) and was the organization’s 2015
Fundraising Campaign Chair.
Larry Schedler, President, Larry G. Schedler & Associates, Inc.
Larry G. Schedler has been exclusively representing buyers and sellers of apartment communities for
30 years, and has successfully handled the sale of more than 40,000 multi-family units, with a market
capitalization in excess of $1,000,000,000 in value. Mr. Schedler began his career as an acquisition
representative for a private, regional investment firm that specialized in multi-family assets and then
as a multi-family broker. Larry formed Larry G. Schedler & Associates, Inc. to specifically represent
buyers and sellers of multi-family properties throughout the Gulf South. He has consistently been
recognized by various professional organizations as the top multi-family broker in the State of Louisi-
ana and the Gulf South. Larry has successfully represented conventional market-rate buyers and
sellers, as well as non-profit housing organizations, institutional investors, insurance companies, and
financial institutions. He has experience in working with not only all cash and conventionally financed
transactions, but also on tax-exempt and taxable bond transactions, Low Income Housing Tax Credits
(LIHTC), Historic Tax Credits and with the various HUD/FHA financing programs. He is a graduate of
Loyola University of the South and holds the Certified Commercial Investment Member designation
(CCIM). Larry is a licensed real estate broker in Louisiana, Mississippi and Alabama. Larry is a frequent
guest speaker as a representative of the local and regional apartment market for The University of
New Orleans, as well as numerous professional organizations. He has been a guest on local radio
broadcasts and was asked to testify at a Congressional Hearing of the Gulf South Apartment Market in
the wake of Hurricanes Katrina and Rita. Larry currently chairs the Board of Directors of Christopher
Homes, Inc. and serves on an advisory board of the Willwoods Foundation. Larry is a co-publisher of
the Greater New Orleans Multi-Family Report, which is a bi-annual publication on the local multi-
family market which provides an overview of rental rates, occupancy and sales and construction
activity.
2017 Dr. Ivan Miestchovich Economic Outlook & Real Estate Forecast Seminar - 5

LLC
Cullan MaumusDevelopment [email protected]
• Background
• New Orleans Redevelopment Fund (NORF)
• NORF 1
• NORF 2
• Challenges
• Opportunities
• Trends
Agenda
B
A
C
K
G
R
O
U
N
D
Cullan MaumusDevelopment [email protected]
NORF 1NORF 2
NORF MANAGEMENT
NORP
AVS Partners
N
O
R
F
1
NORF 1
Mid-City Market
Whole Foods Refresh Project Market
The Lafitte Greenway New VA and LSU Teaching Hospitals
Commercial Development along Tulane Avenue
Faubourg-Lafitte Housing Development
MID-CITY NEW ORLEANS
N
O
R
F
1
Investment Thesis:Build upon the Public / Private investment in Mid‐City to acquire,redevelop, and rent residential properties to the population locating tothe area.
• Initial Capital Raise $1.5 million – January 2014• Fund size approximately $6 million levered• Acquired and redeveloped 19 properties in 2 years• Returned 167% of investor capital in 3 years• Achieved 24% IRR• Generated additional $640,000 in Historic Tax Credit Equity
NORF 1 315‐317 S. SALCEDO
A shotgun double built in the early 20th century in the Mid‐City neighborhood, between Banks and Canal Streets.
• Double: 2 bedrooms / 1 bathroom each unit• Purchased for $39,500• Renovated for $103,000 • Total Investment $142,500• Leased‐up for June 1, 2014• Total monthly revenue: $2,500 ($30,000 annually)
• Sold in 2016: $330,000
N
O
R
F
1
2017 Dr. Ivan Miestchovich Economic Outlook & Real Estate Forecast Seminar - 6

4007 – 4009 BANKS
Last property purchased by NORF 1. An up/down double built in the early 20th
century 1 block from Jesuit High School.
• 3,000 SF Double: 3 bedrooms / 1.5 bathrooms each unit• Purchased for $195,000 in June 2014• Renovated for $165,000• Total Investment $360,000• Leased‐up for January 1, 2016• Total monthly revenue: $4,000 ($48,000 annually)• Historic Tax Credit Equity: $90,000
• Appraised Value: $600,000
N
O
R
F
1
N
O
R
F
1
N
O
R
F
1
NORF 1 Takeaways
A
V
S
P
A
R
T
N
E
R
S
620 Opelousas AvenueAlgiers Point
A
V
S
P
A
R
T
N
E
R
S
620 Opelousas
‐ 10 Units‐ Mixed 1BR & 2BR‐ $2.8 MM Investment‐ $1 MM in HTC equity‐ Building fully leased‐ Rent range :
$1,250 ‐ $1,900
A
V
S
P
A
R
T
N
E
R
S
2017 Dr. Ivan Miestchovich Economic Outlook & Real Estate Forecast Seminar - 7

N
O
R
P
4411 Canal StMid‐City
N
O
R
P
N
O
R
P
4411 Canal St‐ 2 Commercial Units‐ 2,200 Sf each‐ $800,000 investment‐ $295,000 in HTC Equity
N
O
R
F
2
NORF 2
Investment Thesis:Opportunities exist to expand on NORF 1. In addition to scatteredsite multi‐family redevelopment, acquire vacant lots, commercial,and mixed use properties in New Orleans to redevelop, leaseand/or sell.
• Initial Capital Raise $4.2 million – August 2015• Targeted Fund size approximately $18 million levered• Acquired 22 properties ‐ 4 under contract• Will continue to acquire through October 2019• Delivered 8 properties
N
O
R
F
2
New Construction on Vacant LandVarious Sites in New Orleans
4618 & 4620 Baudin
N
O
R
F
2
New Construction on Vacant LandVarious Sites in New Orleans
223 S. White227 S. White
2017 Dr. Ivan Miestchovich Economic Outlook & Real Estate Forecast Seminar - 8

N
O
R
F
2
Mixed‐Use New ConstructionMid‐City
3100 Banks
N
O
R
F
2
N
O
R
F
2
Adaptive Re‐use Historic Rehabilitation Mid‐City
131 S. Jeff Davis Parkway
N
O
R
F
2
Historic Commercial RehabilitationMid‐City Greenway
2720 St. Louis
N
O
R
F
2
N
O
R
F
2
NORF 2 Takeaways
2017 Dr. Ivan Miestchovich Economic Outlook & Real Estate Forecast Seminar - 9

N
O
R
F
2
The Road Ahead
2017 Dr. Ivan Miestchovich Economic Outlook & Real Estate Forecast Seminar - 10

New Orleans Hospitality Update Chris R. RossLatter & Blum Hospitality Division
Address Property Opened Rooms1 225 Baronne Street The ALOFT Hotel 2015 1882 1250 Poydras Street Hyatt House 2015 1943 600 Carondelet Street ACE Hotel 2016 2454 1111 Gravier Street Tupadour Hotel 2016 1855 210 Okeefe Moxy Hotel 2016 1086 914 Union Street Catahoula Hotel 2016 357 346 Baronne Street Fairfield Inn & Suites 2016 1038 2031 St. Charles Avenue The Pontchatrain Hotel 2016 1009 317 North Rampart Street Homewood Suites 2017 207
10 1225 St. Charles Avenue The Quisby Hostel 2017 301,395
Address Property Planned Opening Rooms11 317 Baronne Street The NOPSI Hotel 2017 22512 632 Tchopitolous Street Cambria Inn & Suites 2017 16213 1500 Canal Street The Jung Hotel 2017 22014 1600 Canal Street TownPlace & Springhill Suite 2017 20015 1633 Canal Street Independent 2018 220
1,027
Address Property Planned Opening Rooms16 1100 Tulane Avenue Canopy Hotel 2018 17617 744 St. Charles Avenue Moxy Hotel 2018 9618 200 St. Charles Avenue Residence Inn Hotel 2018 25019 Magazine Street D-Day Hotel 2019 22520 550 Baronne Street The Virgin Hotel 2019 20021 2 Canal Street Four Seasons Hotel 2019 33622 Convention Center Blvd. Convention Center Hotel 2021 1,20023 1020 Annunciation Luxury TBD 17024 1031 Canal Street Hard Rock Hotel TBD TBD25 1028 Canal Street Fischer Jewelry Building Hostel TBD 43
2,696
Total 5,118
Recently Completed Hotels
In Progress
Planned Hotels
Recently Completed Hotels
The Troubadour 1111 Gravier Street
Opened2016
Room Count185
The Ace Hotel600 Carondelet Street
Opened2016
Room Count245
The Ace Hotel
The Troubadour
2017 Dr. Ivan Miestchovich Economic Outlook & Real Estate Forecast Seminar - 11

ALOFT225 Baronne Street
Opened2015
Room Count188
Hyatt House 1250 Poydras Street
Opened2015
Room Count194
Moxy210 O’Keefe Street
Opened2016
Room Count108
Catahoula Hotel 914 O’Keefe Street
Opened2016
Room Count35
MoxyOn O’Keefe
Catahoula Hotel
The Pontchatrain Hotel2031 St. Charles Avenue
Opened2016
Room Count100
2017 Dr. Ivan Miestchovich Economic Outlook & Real Estate Forecast Seminar - 12

Fairfield Inn & Suites346 Baronne Street
Opened2016
Room Count103
Homewood Suites317 North Rampart Street
Opened2017
Room Count207
The Quisby Hotel1225 St. Charles Avenue
Opened2017
Room Count30 / 120 Beds
In Progress
The NOPSI Hotel317 Baronne Street
OpeningMid – 2017
Room Count225
2017 Dr. Ivan Miestchovich Economic Outlook & Real Estate Forecast Seminar - 13

The NOPSI Hotel
Cambria Inn & Suites632 Tchopitolous Street
Opening Mid – 2017
Room Count162
The Jung Hotel1500 Canal Street
OpeningLate – 2017
Room Count225 TownPlace & Springhill Suite
16oo Canal Street Opening DateLate – 2017
Room Count200
Independent1633 Canal Street
OpeningEarly 2018
Room Count220
Planned Hotels
2017 Dr. Ivan Miestchovich Economic Outlook & Real Estate Forecast Seminar - 14

Canopy Hotel1100 Tulane Avenue
Planned Opening2018
Room Count176
Moxy744 St. Charles Avenue
Planned Opening2018
Room Count96
Residence Inn Hotel200 St. Charles Avenue
Planned Opening 2018
Room Count250
D-Day Museum HotelMagazine & Andrew Higgins
Planned Opening2019
Room Count225
The Virgin Hotel550 Baronne Street
Planned Opening 2019
Room Count200
The Trade District HotelConvention Center
Planned OpeningTBD
Room Count1200
The Trade District
2017 Dr. Ivan Miestchovich Economic Outlook & Real Estate Forecast Seminar - 15

Luxury Hotel 1020 Annunciation
Planned OpeningTBD
Room Count170
Hard Rock Hotel1031 Canal Street
Planned OpeningTBD
Room CountTBD
Fischer Jewelry Building Hostelling International 1028 Canal Street
Planned OpeningTBD
Room Count43
Four Seasons Hotel2 Canal Street
Opening Date2019
Room Count336
New Orleans ForecastNew Orleans Occupancy Forecast 2015 - 2019
69.72%
69.90%
68.88%
69.55% 69.55%
2017 Dr. Ivan Miestchovich Economic Outlook & Real Estate Forecast Seminar - 16
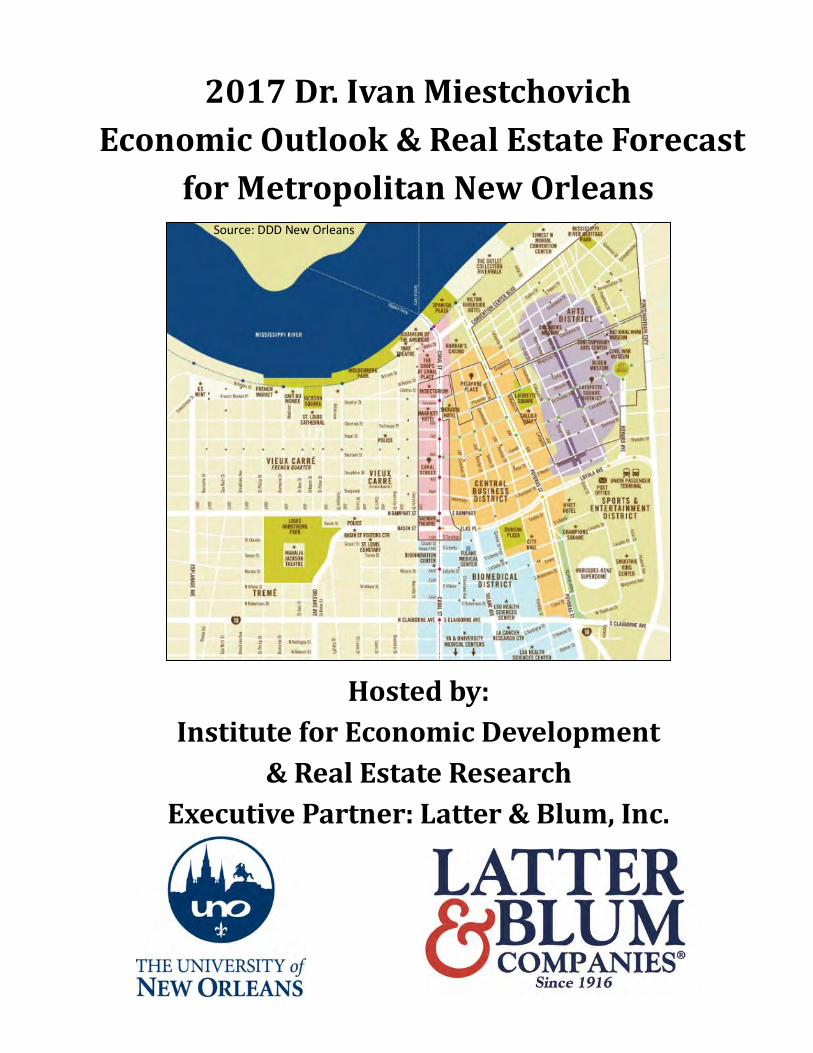
New Orleans ADR & RevPar Forecast 2015 - 2019
$148.35$152.80
$157.38$162.89
$166.96
$103.44$106.80 $108.41
$113.29 $116.12
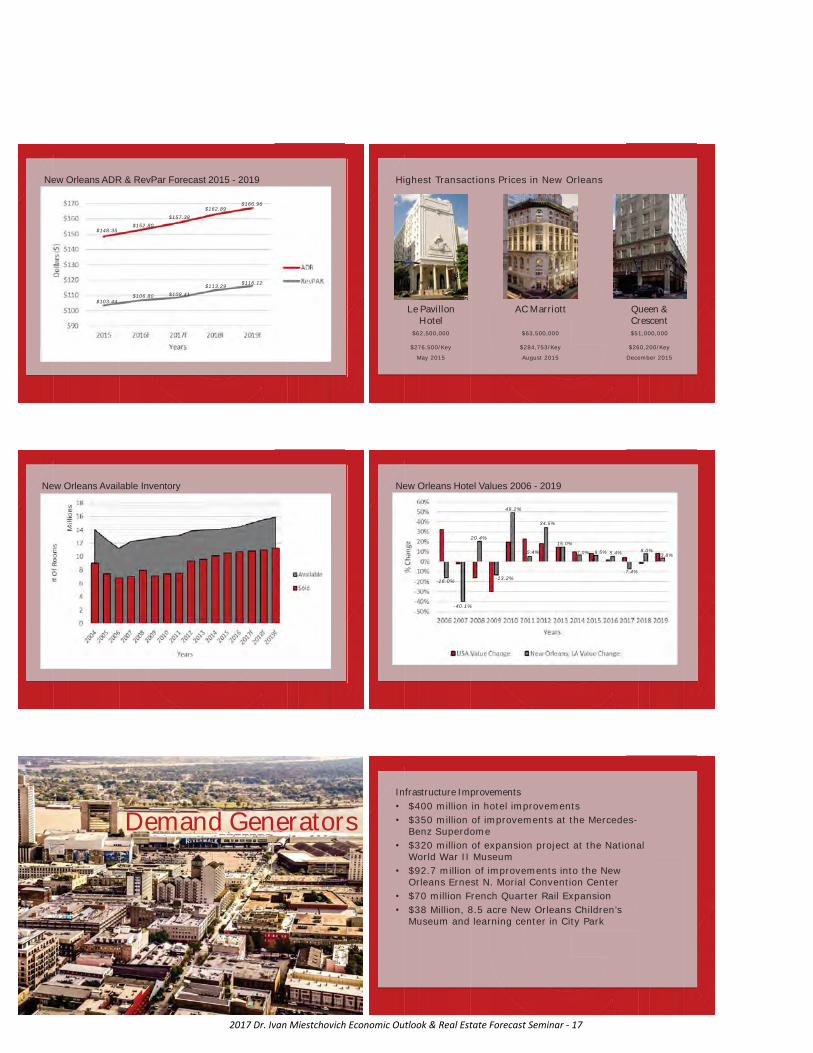
Highest Transactions Prices in New Orleans
Le PavillonHotel
$62,500,000
$276,500/Key
May 2015
AC Marriott
$63,500,000
$284,753/Key
August 2015
Queen & Crescent$51,000,000
$260,200/Key
December 2015
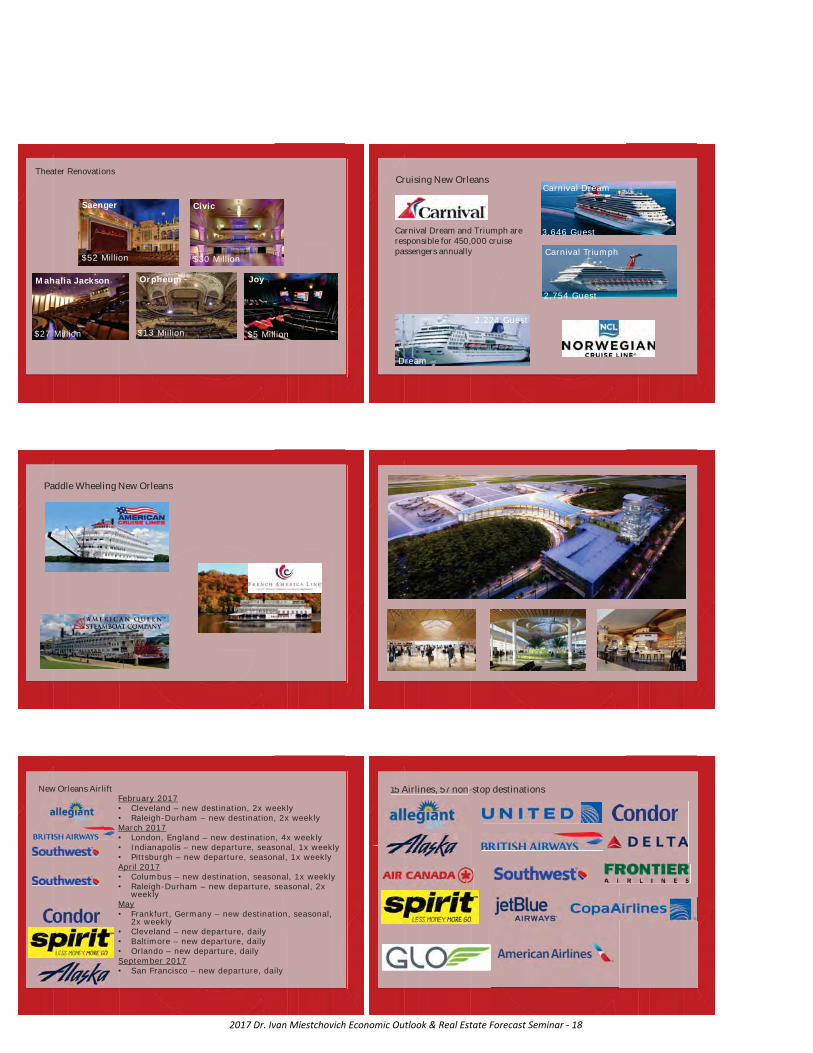
New Orleans Available Vs Sold Room Count
New Orleans Available Inventory
Newewewewewewewewewewewewewwewew OrOOOOOOOOOOOrOOrlealeaeeeeeaeee nsns s AvaAvaailailaablebleb e VsVss SoSoSoldld d RooRooooRooooooooooooom Cm Cm Cm Cm Cm CCm Cm Cm Cm Cm Cm Cm CCCm Cm Cm CCounoununounounounounounounounounounounouounounounouounoou ttttttttttttttt
New Orleans Hotel Values 2006 - 2019
-16.0%
-40.1%
20.4%
-13.2%
49.2%
5.4%
34.5%
15.0%
7.0% 6.5% 5.4%
-7.4%
8.0%3.8%
Demand GeneratorsInfrastructure Improvements • $400 million in hotel improvements • $350 million of improvements at the Mercedes-
Benz Superdome • $320 million of expansion project at the National
World War II Museum• $92.7 million of improvements into the New
Orleans Ernest N. Morial Convention Center • $70 million French Quarter Rail Expansion• $38 Million, 8.5 acre New Orleans Children’s
Museum and learning center in City Park
2017 Dr. Ivan Miestchovich Economic Outlook & Real Estate Forecast Seminar - 17
Saenger
$52 Million
Civic
$30 Million
Mahalia Jackson
$27 Million
Orpheum
$13 Million
Joy
$5 Million
Theater RenovationsCruising New Orleans
Carnival Triumph
2,754 Guest
Carnival Dream
3,646 Guest
Dream
2,224 Guest
Carnival Dream and Triumph are responsible for 450,000 cruise passengers annually
Paddle Wheeling New Orleans
February 2017• Cleveland – new destination, 2x weekly • Raleigh-Durham – new destination, 2x weekly March 2017 • London, England – new destination, 4x weekly • Indianapolis – new departure, seasonal, 1x weekly • Pittsburgh – new departure, seasonal, 1x weekly April 2017• Columbus – new destination, seasonal, 1x weekly • Raleigh-Durham – new departure, seasonal, 2x
weekly May • Frankfurt, Germany – new destination, seasonal,
2x weekly • Cleveland – new departure, daily • Baltimore – new departure, daily • Orlando – new departure, dailySeptember 2017 • San Francisco – new departure, daily
New Orleans Airlift New Orleans Airl 15 Airlines, 57 non-stop destinations 15 Airlines, 57 non-
2017 Dr. Ivan Miestchovich Economic Outlook & Real Estate Forecast Seminar - 18

Chris R. Ross Hospitality Division
504.569.9333 Cell 504.352.1492 Office
430 Notre Dame Street New Orleans, LA 70130-3610 USAwww.latterblumhotels.com
2017 Dr. Ivan Miestchovich Economic Outlook & Real Estate Forecast Seminar - 19

Kurt M. WeiglePresident & CEO
Downtown NOLAGet caught in our BrainStorms
Downtown New Orleans
Who We Are
DDD Mission:
To drive the development of Downtown New Orleans and be the catalyst for a prosperous, stimulating, innovative heart of the Crescent City.
We do this by:
• Cultivating economic development in such industries as bioscience, the arts, digital media and tourism
• Ensuring Downtown is clean and safe• Serving as a voice and advocate for Downtown’s future• Promoting Downtown as a world-class destination for
residents and visitors
UMC and VA Hospitals • $2.1 billion project• Annual $1.26 billion economic impact• Expected to create more than 3,000 permanent jobs•7,000 jobs retained•Average salary $90k•UMC opened 8/1/15•VA opened 11/18/16
ResidentialDevelopments
** As of January 2015
Lafayette Square & Warehouse District Neighborhoods
Existing, Recently CompletedA. 930 PoydrasB. 900 Poydras renovationsC. Civic TheatreD. Civic LoftsE. Rouses MarketF. Moss Bauer residencesG. Aunt Sally’sH. 13 Sisters of JuliaI. South Market - ParamountJ. South Market – The ParkK. Triangle Building L. Drury Hotel ExpansionM. GNO FoundationN. ACE HotelO. South Market - The Beacon
Under Construction, Financed or Planned1. South Market – The Odeon2. South Market –The Standars3. Madam Julia’s Guest House 4. Plaza Tower5. Culinary & Hospitality Institute6. Moxy Hotel7. Steven’s Garage8. Jacob’s Candy9. ACE Hotel Expansion10. The Advocate New Orleans11. 710 Baronne Residences12. 835 St Joseph Residences13. 731 St Charles Condos14. 749 St Charles Condos
2017 Dr. Ivan Miestchovich Economic Outlook & Real Estate Forecast Seminar - 20

Existing, Recently Completed:A. Saratoga ResidencesB. 925 CommonC. Roosevelt HotelD. Maritime ResidencesE. 144 ElkF. 225 BaronneG. Four WindsH. AC HotelI. The PythianJ. Troubador HotelK. California ResidencesL. Orpheum
Under Construction, Financed or Planned1. Loew’s Theatre2. 1100 Tulane
Gravier‐Common Neighborhood South Market District • Mixed-use development combining
luxury apartments, retail, restaurants and entertainment venues
• Over 700 new luxury apartments
• 200,000 square feet of retail space including a 40,000 SF full-service gourmet grocer
• 1,300 garage parking spaces
Downtown by the Numbers
• $6.5 billion in investment since 2005
• Over 45 national retailers added recently including Neiman Marcus, Nordstrom,Tiffany & Co, True Religion, The Art of Shaving and many more
• 175 restaurants & bars and 59 sidewalk cafes
• Over 60% of “Vacant and Underutilized Properties” either redeveloped or under development since 2012
• More than 62,000 jobs
• 142,764 people are in Downtown on the average weekday• Number of apartments and condos have doubled since 2008
(6,775 units) • 19,769 hotel rooms
Canal Street
New Streetscape Granite & Brick Pavers, Enhanced
Lighting ‐ completed 2007
Façade Improvement 28 Canal Street Projects $1,949,439 Private Façade Investment $573,219 DDD Match
Before After
2017 Dr. Ivan Miestchovich Economic Outlook & Real Estate Forecast Seminar - 21

1098 New Hotel Rooms
The Saint
The Saint
926 New Apartments & Condos
1201 Canal
Theater Redevelopment
The Saenger Theatre The Joy Theater The Orpheum
New Retailo True Religiono Tiffany and Co.o The Art of Shavingo M.A.Co Ruby Slipper Caféo Starbucks o Fogo de Chaoo IHOPo Creole House Restauranto LIVƎo Nouveauo The Athlete’s Footo Pinkberryo Walgreens boutiqueo CVSo New Erao The Sunglass Shopo Denim Den Co.o Serenity Boutique
Starbucks
Jung Hotel
• Mixed‐use development• 175 apartments• 145 hotel rooms
Montgomery Building
• Vacant 40 years• The Sazerac House Museum
2017 Dr. Ivan Miestchovich Economic Outlook & Real Estate Forecast Seminar - 22

UNO Building
• Dual‐branded Marriott Hotel• 183 rooms
Canal Street Hotel
• 225‐room hotel
University Medical Center 2000 Canal Street $1,100,000,000
Roosevelt Hotel 123 Baronne St $135,000,000
1201 Canal 1201 Canal Street $70,000,000
The Saint Hotel 931 Canal Street $45,000,000
Saenger Theatre 1111 Canal Street $45,000,000
Orpheum 125 Roosevelt Way $13,000,000
Joy Theater 1200 Canal Street $8,000,000
Marais Apartments 1501 Canal Street $33,000,000
LaSalle Apartments 1113 Canal Street $11,600,000
Giani Building 600 Canal Street $16,000,000
144 Elk Place 144 Elk Place $20,000,000
Jung Hotel 1500 Canal Street $130,000,000
Towne Place Suites 1600 Canal Street $15,860,000
Canal Street Hotel 1630 Canal Street $30,000,000
Marriott Hotel Renovations Canal Street $38,000,000
Ritz Carlton Renovations 921 Canal Street $14,000,000
Astor Crowne Plaza Renovations 739 Canal Street $13,000,000
Doubletree Renovations 300 Canal Street $25,000,000
621 Canal 621 Canal Street $1,000,000
Walgreens 801 Canal Street $2,000,000
The Four Seasons 2 Canal Street $364,000,000
VA Medical Center 2400 Canal Street $1,000,000,000
Canal St. Private Investment
Total Since 2005 ‐ $3,471,460,000
Canal Street Upper Floor Development
Parks & Open Space
Parks & Open Space
• Quality of place matters morethan ever to residents, workers,and visitors
• Partners: ULI, AIA, ASLA, APA
• ULI Technical Assistance Panel (TAP): o DDD should manage more public
space Downtowno Prepare a Green Space Master Plano Start with Duncan Plazao CEA with City of New Orleans
2017 Dr. Ivan Miestchovich Economic Outlook & Real Estate Forecast Seminar - 23

Duncan Plaza Re‐Envisioned Legacy Park
Community Resource & Referral Center Expansion
Community Resource & Referral Center (CRRC) Expansion –Low Barrier Homeless Shelter
Current CRRC Low Barrier Shelter and Engagement Center
2017 Dr. Ivan Miestchovich Economic Outlook & Real Estate Forecast Seminar - 24

What’s Up Downtown – Weekly Newsletter – downtownnola.com
Follow us on Facebook – facebook.com/Downtown NOLAFollow us on Twitter – twitter.com/DDDNewOrleansFollow us on Instagram – Instagram.com/DDDNewOrleans
Downtown in the Palm of Your Hands
2017 Dr. Ivan Miestchovich Economic Outlook & Real Estate Forecast Seminar - 25

NEW ORLEANSRETAIL MARKET OVERVIEW
Presented By: Stephanie Hilferty with
RETAIL: EVOLUTION, REVOLUTION OR APOCALYPSE?
Source: Cushman & Wakefield
RETAIL OVERLOAD
MILLENNIALS & GEN Z
INCREASINGCOMPETITION
RETAIL REVOLUTION
RETAIL REVOLUTION DRIVERS
2017 Dr. Ivan Miestchovich Economic Outlook & Real Estate Forecast Seminar - 26

RETAIL OVERLOAD
RETAILOVERLOAD
U.S. HAS TOO MUCH RETAILRETAILOVERLOAD
THE SURVIVORS
FITNESS
GROCERY
SERVICES
MEDICAL RESTAURANTS IMPULSE DRIVEN BRANDS
BARGAIN/DISCOUNT HOME IMPROVEMENT
ExperientialRetail
RETAILOVERLOAD
2017 Dr. Ivan Miestchovich Economic Outlook & Real Estate Forecast Seminar - 27
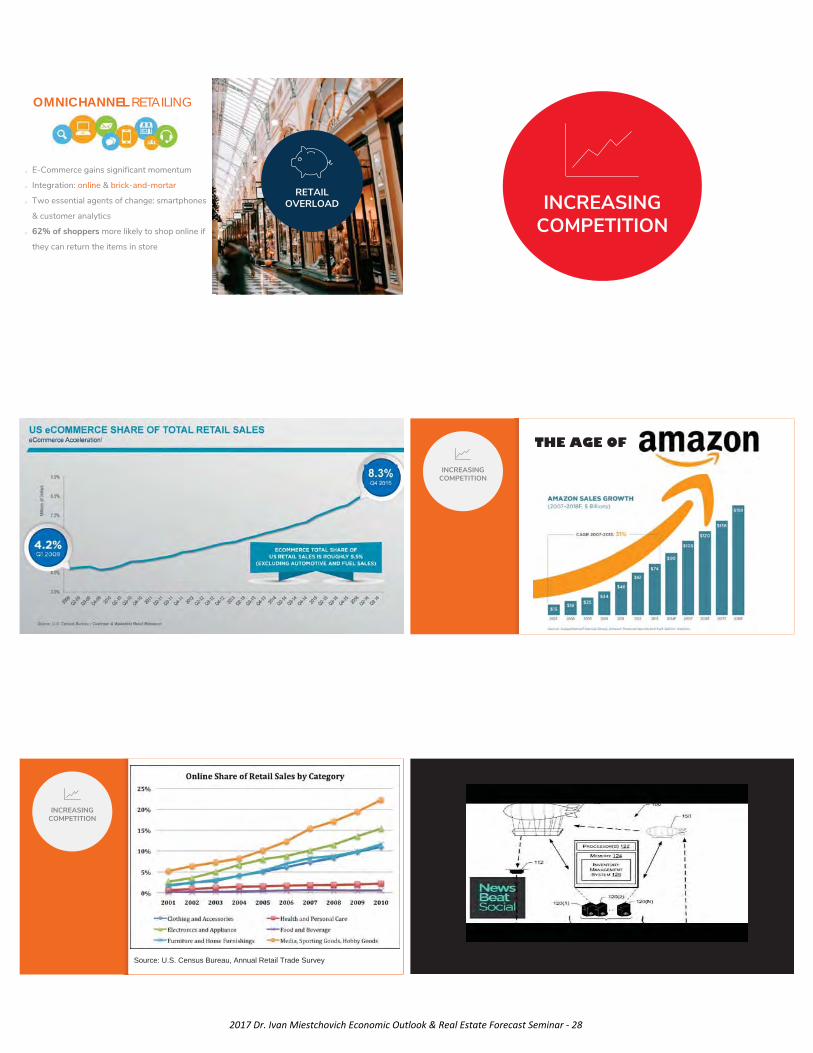
OMNICHANNEL RETAILING
o E-Commerce gains significant momentum
o Integration: online & brick-and-mortar
o Two essential agents of change: smartphones
& customer analytics
o 62% of shoppers more likely to shop online if
they can return the items in store
RETAIL OVERLOAD INCREASING
COMPETITION
http://www.loopnet.com/Listing/20300392/2065-1st-St-Slidell-LA/
INCREASING COMPETITION
THE AGE OF
INCREASING COMPETITION
Source: U.S. Census Bureau, Annual Retail Trade Survey
2017 Dr. Ivan Miestchovich Economic Outlook & Real Estate Forecast Seminar - 28

MILLENNIALS & GEN Z
MILLENNIALS & GEN Z
Source: U.S. Census Bureau
THE NEXT GENERATION: GEN ZCHANGING SHOPPING FOREVER
MILLENNIALS & GEN Z
THE NEXT, NEXT GENERATION: THE ALPHA GENERATION
MILLENNIALS & GEN Z
POLITICS & RETAIL
BorderAdjustmentTax
Commercial ActivitiesTax
ValueAddedTax
New Orleans Metro Local Trends
2017 Dr. Ivan Miestchovich Economic Outlook & Real Estate Forecast Seminar - 29

$1 Billion Terminal
Est. Opening Day: Oct. 2018
New non-stop international flights (Frankfurt, Germany and London, England)
KENNER AREA:AIRPORT EXPANSION
KENNER AREA:ESPLANADE MALL
Pacific Retail Capital Partners bought
property for an undisclosed price.
Developers looking at a variety of uses:
• Restaurants
• Entertainment
• Non-Retail Uses:
• Multi-family housing
• Hotel
METAIRIE AREA:LAKESIDE MALL
Vacancy opportunities
New retailers
Mall powerhouse expansions
Incorporating experiential retail
METAIRIE AREA:
New Adlers and Trader Joe’s
Tolmas Tract finally developed
Elmwood getting a new look
VACANT BOXESHHGregg, Kmart at Elmwood, and
Office Depot on Veterans Blvd.
Vacant boxes lead to opportunities
OPENINGS
NEW ORLEANS EAST:SOUTHSHORE HARBOR REVIVAL
THE WESTBANK: HHGREGG
2017 Dr. Ivan Miestchovich Economic Outlook & Real Estate Forecast Seminar - 30

THE WESTBANK: TOYS R’ US THE WESTBANK: SEARS
NEW ORLEANS AREA: FOOD HALL CRAZE
St. Roch Market (Open)
Dryades Public Market (Open)
Pythian Market (Fall 2017)
Auction House Market (Winter 2017)
FRENCH MARKET: THE ORIGINAL FOOD HALL
PLAYING GAMES IN NOLA NEW RETAILERS IN NOLA
2017 Dr. Ivan Miestchovich Economic Outlook & Real Estate Forecast Seminar - 31

LOCAL RETAILERS EXPANDING
Sourceshttp://money.cnn.com/2017/02/27/news/economy/border-adjustment-tax-trump-trump-congress/ https://www.bna.com/laissez-les-bon-n57982086900/ http://www.naiop.org/en/Magazine/2016/Summer-2016/Business-Trends/The-Rise-of-Experiential-Retail.aspx https://www.forbes.com/forbes/welcome/?toURL=https://www.forbes.com/sites/tommcgee/2017/01/23/the-rise-of-the-millennial/&refURL=https://www.google.com/&referrer=https://www.google.com/ https://www.youtube.com/watch?v=GvGskEO-dvs https://www.youtube.com/watch?v=6jCTAkx_05Yhttp://www.theadvocate.com/baton_rouge/news/business/article_94ac11f4-329e-5cbb-9220-acd54cf4f66a.htmlhttp://www.nola.com/business/index.ssf/2017/03/dave_busters_opening_in_may.htmlhttp://canalstreetbeat.com/ http://www.businessinsider.com/payless-list-of-stores-closing-2017-4http://www.nola.com/business/index.ssf/2017/01/armstrong_airport_food_new_ter.htmlhttp://www.nola.com/business/index.ssf/2017/04/armstrong_airport_retail.htmlhttps://www.nytimes.com/2015/09/19/fashion/meet-alpha-the-next-next-generation.htmlhttp://genhq.com/gen-z/ http://3pur2814p18t46fuop22hvvu.wpengine.netdna-cdn.com/wp-content/uploads/2017/01/Research-White-Paper-Gen-Z-Tech-Disruption-c-2016-Center-for-Generational-Kinetics.pdf https://www.nytimes.com/2015/09/20/fashion/move-over-millennials-here-comes-generation-z.html?_r=1https://newsroom.lowes.com/news-releases/holoroom-how-to/https://www.invespcro.com/blog/ecommerce-product-return-rate-statistics/http://www.zerohedge.com/news/2017-04-22/retail-bubble-has-now-burst-record-8640-stores-are-closing-2017https://www.forbes.com/sites/bisnow/2017/03/09/the-aftermath-of-retails-burst-bubble-more-city-centers-in-secondary-markets/#75f41e7b510d http://www.businessinsider.com/the-retail-apocalypse-has-officially-descended-on-america-2017-3 http://www.glasbergen.com/cartoons-about-retail/
Image Sources
https://www.theodysseyonline.com/millennial-proud-millennialhttps://www.pinterest.com/pin/138485757268501850/http://www.keywordhut.com/Z29sZiBhcHBhcmVs/http://gonola.com/2016/11/16/tale-two-beer-tour-buses.htmlhttp://www.destination360.com/north-america/us/louisiana/new-orleans/canal-streethttps://ciclavia.wordpress.com/2009/12/20/new-orleans-no-stranger-to-ciclavia-2/https://twitter.com/robertivy/status/746072189024100353http://keywordteam.net/gallery/863562.htmlhttp://www.bestofneworleans.com/gambit/blake-pontchartrain-huba-huba-to-the-west-bank/Content?oid=3092099https://www.wired.com/2015/06/jurassic-world-six-flags-new-orleans/ http://www.broadsuite.com/generation-z-teens-tech-and-what-the-future-holds/https://en.wikipedia.org/wiki/French_Markethttp://www.velvetgroup.com/event-wrap-up-virtual-reality-for-brands/http://bexleyeducationfoundation.org/gallery/silent-auction-2016/dave-and-busters/
2017 Dr. Ivan Miestchovich Economic Outlook & Real Estate Forecast Seminar - 32

Presented by: Cres Gardner, CCIM, SIOR
Beau Box Commercial Real Estate
Market Occupancy Trend ‐ CBD
2012 2013 2014 2015 2016
New Orleans/CBD 86.3 88.5 89.5 89.4 88.4
Dallas 78.78 80.4 80.6 81.3 81.63
Houston 86.2 86.4 86.4 82.1 79.7
Atlanta 78.1 79 80.2 82.5 83.1
72
74
76
78
80
82
84
86
88
90
92
5 Year Class “A” Occupancy Trend
New Orleans/CBD
Dallas
Houston
Atlanta
• 5 year Class “A” occupancy trend CBD
• Market comparison – higher occupancy, lower demand and no new supply
• New Orleans has lost 3 million square feet of space while the other markets have expanded dramatically
Market Occupancy Trend – Metairie
2012 2013 2014 2015 2016
Metairie 95.15 94.9 92.21 93.28 92.3
Dallas 78.78 80.4 80.6 81.3 81.63
Houston 86.2 86.4 86.4 82.1 79.7
Atlanta 78.1 79 80.2 82.5 83.1
60
65
70
75
80
85
90
95
100
5 Year Class “A” Occupancy Trend
Metairie
Dallas
Houston
Atlanta
• The office market ranged from 92.13% – 95.15%
• Less consolidation in Metairie vs CBD
CBD OFFICE MARKET
CLASS A – 8.8 M SF
CLASS “A” OCCUPANCY 2015 V. 2016 CLASS “A” AVERAGE RATES 2015 V. 2016
*Source = Bruce Sossaman Corporate Realty Office and Occupancy Survey
89.4
88.7
88.2
88.4
88.6
88.8
89
89.2
89.4
89.6
2015 2016
$19.10
$20.14
$18.40
$18.60
$18.80
$19.00
$19.20
$19.40
$19.60
$19.80
$20.00
$20.20
$20.40
2015 2016
CBD OFFICE MARKET
CLASS B – 1.6M SF
CLASS “B” OCCUPANCY 2015 V. 2016 CLASS “B” AVERAGE RATES 2015 V. 2016
*Source = Bruce Sossaman Corporate Realty Office and Occupancy Survey
72%
70%
69%
70%
70%
71%
71%
72%
72%
73%
2015 2016
$15.87
$15.91
$15.85
$15.86
$15.87
$15.88
$15.89
$15.90
$15.91
$15.92
2015 2016
2017 Dr. Ivan Miestchovich Economic Outlook & Real Estate Forecast Seminar - 33

KEY 2016 CBD DEALSStone Pigman Walther & Witmann
First Bank & Trust Tower
• Relocated from single tenant leased building
• 44,000 sf
• Long Term Lease
• Occupancy Summer 2017
KEY 2016 CBD DEALSReily Foods
400 Poydras Tower
• Relocated from owned single tenant building currently being redeveloped into a mixed use project
• 24,500 RSF
• Long term lease
KEY 2016 CBD DEALSLaunch Pad
400 Poydras Tower
• Version 2.0 of original NOLA co‐working concept
• Relocated from 643 Magazine
• 22,500 RSF
• Long term lease
The Shop – CAC • Domain Companies building
40,000 sf co‐working space
• Space will house Domain’s Corporate Office, Idea Village, Ceasars, GNO Inc incubator space
METAIRIE OFFICE MARKET
CLASS A – 2M SF
CLASS “A” OCCUPANCY 2015 V. 2016 CLASS “A” RATES 2015 V. 2016
*Source = Bruce Sossaman Corporate Realty Office and Occupancy Survey
93%
92%
91%
92%
92%
92%
92%
92%
93%
93%
93%
93%
2015 2016
$24.00 $24.00
$0.00
$5.00
$10.00
$15.00
$20.00
$25.00
$30.00
2015 2016
2017 Dr. Ivan Miestchovich Economic Outlook & Real Estate Forecast Seminar - 34

METAIRIE OFFICE MARKET
CLASS B – 1.4M SF
CLASS “B” OCCUPANCY 2015 V. 2016 CLASS “B” RATES 2015 V. 2016
*Source = Bruce Sossaman Corporate Realty Office and Occupancy Survey
90%
92%
89%
90%
90%
91%
91%
92%
92%
93%
2015 2016
$21.20
$19.55
$18.50
$19.00
$19.50
$20.00
$20.50
$21.00
$21.50
2015 2016
KEY 2016 METAIRIE
DEALSLammico
Galleria Building
• Long term renewal
• 42,000 sf
KEY 2016 METAIRIE
DEALSCrescent Bank & Trust
Burns & Wilcox Center
• 35,000 SF
• Occupancy mid 2017
Metairie Centre Sale90,000 sf – Class B
Rumored Price* ‐ $10,100,000 ($111.11 psf)
* Sale was recorded at $100
An inflection point or more of the same?
New Orleans Market
• No new multi‐tenant building since 1989
• Stability provided by eliminating supply• Over 3 million square feet of space repurposed over last 10 years
• More to come?
2017 Dr. Ivan Miestchovich Economic Outlook & Real Estate Forecast Seminar - 35

Positive Trends
• CBD amenity and residential environment the best its ever been
• Emergence of co‐working spaces
• High level of conversion activity has pushed office tenants into the Class A market
• British Airways flight provides direct connections to Europe
• Growing creative and entrepreneurial class
“People ask the question: Can you build a category defining unicorn outside of the coasts?” he said. “The answer is yes.”
Patrick Comer – Founder & CEO @ Lucid
Absorption
• 2 years of negative absorption in Metairie A and CBD
• Projected negative absorption in 2017
• What industries will drive future office absorption?
• Can we continue to keep market stable by trimming supply?
Consolidation
• Corporate consolidation to core markets and technology reducing number of regional offices in Metairie and New Orleans
• End of the “disaster industrial complex” is returning close over 300,000 sf into the class A & B inventories
Jobs & Population
• The New Orleans economy is producing low wage jobs and exporting high wage jobs
• More people left New Orleans than moved here for the first time since Katrina*
*US Census data
What can we do as an industry to help?
• We are an industry with national reach – use it
• Tell our story – it often goes beyond the numbers
• Encourage our policy makers to undertake serious fiscal reform that attracts business
2017 Dr. Ivan Miestchovich Economic Outlook & Real Estate Forecast Seminar - 36

Impacts
• Further redevelopment of office building into residential and hospitality
• Lack of quality space to attract new tenants
• New Orleans a boutique city?
2017 UNO/BEAU BOXECONOMIC OUTLOOK & COMMERCIAL REAL ESTATE ________________________FORCAST SEMINAR FOR METROPOLITAN NEW ORLEANS________________________PRESENTED BY:CRES GARDNER, CCIM, SIOR BEAU BOX COMMERCIAL REAL ESTATE
2017 Dr. Ivan Miestchovich Economic Outlook & Real Estate Forecast Seminar - 37

Rick Haase, President
Latter & Blum, Inc.
2017 Dr. Ivan MiestchovichEconomic Outlook & Real Estate Forecast Seminar
Friday, May 5, 2017
Market Conditions
Housing Supply at the National Level
Sellers – Under 3 Months Inventory
Buyers – Over 6 Months Inventory
The markets behave differently…relative to pricing!
Buyers Market or Sellers Market?
Mississippi Gulf Coast AreaSingle Family- Active Listings vs. Sold Listings
Jul. 2001 thru Mar. 2017
This representation is based in whole or in part on data supplied by New Orleans Metropolitan Association of Realtors, St. Tammany Association of Realtors, Tangipahoa Board of Realtors, Baton Rouge Board of Realtors or their Multiple Listing Services. Neither the Boards, Associations, nor their MLS guarantees or is in any way responsible for its accuracy. Data maintained by the Boards, Associations or their MLS may not reflect all real estate activity for all years.
Source: LATTER & BLUM Research Division.
0
1000
2000
3000
4000
5000
6000
2001 2002 2003 2004 2005 2006 2007 2008 2009 2010 2011 2012 2013 2014 2015 2016 2017
Active Sold
Painful Market
Getting Better
Greater Baton Rouge AreaSingle Family- Active Listings vs. Sold Listings
Jan. 1989 thru Mar. 2017
This representation is based in whole or in part on data supplied by New Orleans Metropolitan Association of Realtors, St. Tammany Association of Realtors, Tangipahoa Board of Realtors, Baton Rouge Board of Realtors or their Multiple Listing Services. Neither the Boards, Associations, nor their MLS guarantees or is in any way responsible for its accuracy. Data maintained by the Boards, Associations or their MLS may not reflect all real estate activity for all years.
Source: LATTER & BLUM Research Division.
0
10
20
30
40
50
60
1989 1990 1991 1992 1993 1994 1995 1996 1997 1998 1999 2000 2001 2002 2003 2004 2005 2006 2007 2008 2009 2010 2011 2012 2013 2014 2015 2016 2017
Active Sold
Seller’s Markets
2017 Dr. Ivan Miestchovich Economic Outlook & Real Estate Forecast Seminar - 38

Greater New Orleans AreaSingle Family- Active Listings vs. Sold Listings
Jan. 1989 – Mar. 2017
This representation is based in whole or in part on data supplied by New Orleans Metropolitan Association of Realtors, St. Tammany Association of Realtors, Tangipahoa Board of Realtors, Baton Rouge Board of Realtors or their Multiple Listing Services. Neither the Boards, Associations, nor their MLS guarantees or is in any way responsible for its accuracy. Data maintained by the Boards, Associations or their MLS may not reflect all real estate activity for all years.
Source: LATTER & BLUM Research Division.
0
20
40
60
80
100
120
1989 1990 1991 1992 1993 1994 1995 1996 1997 1998 1999 2000 2001 2002 2003 2004 2005 2006 2007 2008 2009 2010 2011 2012 2013 2014 2015 2016 2017
Active Sold
Seller’s Markets • Phase I - PEAK
Unit Sales Increasing Prices Increasing Inventory Decreasing
• Phase II CORRECTION
Unit Sales Decreasing Prices Increasing Inventory Increasing
• Phase III TROUGH
Unit Sales Decreasing Prices Decreasing Inventory Increasing
• Phase IV RECOVERY
Unit Sales Increasing Prices Decreasing Inventory Decreasing
GNO Real Estate Market - 2015 (last year)
• Phase I - PEAK
Unit Sales Increasing Prices Increasing Inventory Decreasing
• Phase II CORRECTION
Unit Sales Decreasing Prices Increasing Inventory Increasing
• Phase III TROUGH
Unit Sales Decreasing Prices Decreasing Inventory Increasing
• Phase IV RECOVERY
Unit Sales Increasing Prices Decreasing Inventory Decreasing
GNO Real Estate Market - 2016 Garden/Uptown AreaSingle Family- Active Listings vs. Sold Listings
Jan. 1989 – Mar. 2017
Source: LATTER & BLUM Research Division.This representation is based in whole or in part on data supplied by New Orleans Metropolitan Association of Realtors, St. Tammany Association of Realtors, Tangipahoa Board of Realtors, Baton Rouge Board of Realtors or their Multiple Listing Services. Neither the Boards, Associations, nor their MLS guarantees or is in any way responsible for its accuracy. Data maintained by the Boards, Associations or their MLS may not reflect all real estate activity for all years.
0
200
400
600
800
1,000
1,200
1,400
1989 1990 1991 1992 1993 1994 1995 1996 1997 1998 1999 2000 2001 2002 2003 2004 2005 2006 2007 2008 2009 2010 520 2012 2013 2014 2015 2016 2017
Active Sold
Seller’s Market
Garden/Uptown AreaSingle Family- Active Listings vs. Sold Listings
Jan. 1989 – Mar. 2017
Source: LATTER & BLUM Research Division.This representation is based in whole or in part on data supplied by New Orleans Metropolitan Association of Realtors, St. Tammany Association of Realtors, Tangipahoa Board of Realtors, Baton Rouge Board of Realtors or their Multiple Listing Services. Neither the Boards, Associations, nor their MLS guarantees or is in any way responsible for its accuracy. Data maintained by the Boards, Associations or their MLS may not reflect all real estate activity for all years.
0
200
400
600
800
1,000
1,200
1,400
1989 1990 1991 1992 1993 1994 1995 1996 1997 1998 1999 2000 2001 2002 2003 2004 2005 2006 2007 2008 2009 2010 520 2012 2013 2014 2015 2016 2017
Active Sold
Seller’s Market in Transition
Historic AreaSingle Family- Active Listings vs. Sold Listings
Jan. 1989 – Mar. 2017
This representation is based in whole or in part on data supplied by New Orleans Metropolitan Association of Realtors, St. Tammany Association of Realtors, Tangipahoa Board of Realtors, Baton Rouge Board of Realtors or their Multiple Listing Services. Neither the Boards, Associations, nor their MLS guarantees or is in any way responsible for its accuracy. Data maintained by the Boards, Associations or their MLS may not reflect all real estate activity for all years.
Source: LATTER & BLUM Research Division.
0
100
200
300
400
500
600
1989 1990 1991 1992 1993 1994 1995 1996 1997 1998 1999 2000 2001 2002 2003 2004 2005 2006 2007 2008 2009 2010 2011 2012 2013 2014 2015 2016 2017
Active Sold
Market in Transition
2017 Dr. Ivan Miestchovich Economic Outlook & Real Estate Forecast Seminar - 39

Metairie AreaSingle Family- Active Listings vs. Sold Listings
Jan. 1989 – Mar. 2017
This representation is based in whole or in part on data supplied by New Orleans Metropolitan Association of Realtors, St. Tammany Association of Realtors, Tangipahoa Board of Realtors, Baton Rouge Board of Realtors or their Multiple Listing Services. Neither the Boards, Associations, nor their MLS guarantees or is in any way responsible for its accuracy. Data maintained by the Boards, Associations or their MLS may not reflect all real estate activity for all years.
Source: LATTER & BLUM Research Division.
0
200
400
600
800
1000
1200
1400
1600
1800
1989 1990 1991 1992 1993 1994 1995 1996 1997 1998 1999 2000 2001 2002 2003 2004 2005 2006 2007 2008 2009 2010 2011 2012 2013 2014 2015 2016 2017
Active Sold
Seller’s Market
Lakefront/Gentilly AreaSingle Family- Active Listings vs. Sold Listings
Jan. 1989 – Mar. 2017
This representation is based in whole or in part on data supplied by New Orleans Metropolitan Association of Realtors, St. Tammany Association of Realtors, Tangipahoa Board of Realtors, Baton Rouge Board of Realtors or their Multiple Listing Services. Neither the Boards, Associations, nor their MLS guarantees or is in any way responsible for its accuracy. Data maintained by the Boards, Associations or their MLS may not reflect all real estate activity for all years.
Source: LATTER & BLUM Research Division.
0
100
200
300
400
500
600
700
800
900
1000
1989 1990 1991 1992 1993 1994 1995 1996 1997 1998 1999 2000 2001 2002 2003 2004 2005 2006 2007 2008 2009 2010 2011 2012 2013 2014 2015 2016 2017
Active Sold
West St. Tammany AreaSingle Family- Active Listings vs. Sold Listings
Jan. 1989 – Mar. 2017
This representation is based in whole or in part on data supplied by New Orleans Metropolitan Association of Realtors, St. Tammany Association of Realtors, Tangipahoa Board of Realtors, Baton Rouge Board of Realtors or their Multiple Listing Services. Neither the Boards, Associations, nor their MLS guarantees or is in any way responsible for its accuracy. Data maintained by the Boards, Associations or their MLS may not reflect all real estate activity for all years.
Source: LATTER & BLUM Research Division.
0
200
400
600
800
1000
1200
1400
1600
1800
2000
1989
1990
1991
1992
19931994
1995
1996
1997
1998
19992000
200120
0220
0320
042005
200620
0720
0820
0920
101/2
011
201220
1320
1420
1520
162017
Active Sold
New Orleans EastSingle Family- Active Listings vs. Sold Listings
Jan. 1989 – Mar. 2017
This representation is based in whole or in part on data supplied by New Orleans Metropolitan Association of Realtors, St. Tammany Association of Realtors, Tangipahoa Board of Realtors, Baton Rouge Board of Realtors or their Multiple Listing Services. Neither the Boards, Associations, nor their MLS guarantees or is in any way responsible for its accuracy. Data maintained by the Boards, Associations or their MLS may not reflect all real estate activity for all years.
Source: LATTER & BLUM Research Division.
0
100
200
300
400
500
600
700
800
900
1000
1989 1990 1991 1992 1993 1994 1995 1996 1997 1998 1999 2000 2001 2002 2003 2004 2005 2006 2007 2008 2009 2010 2011 2012 2013 2014 2015 2016 2017
Active Sold
Kenner AreaSingle Family- Active Listings vs. Sold Listings
Jan. 1989 – Mar. 2017
This representation is based in whole or in part on data supplied by New Orleans Metropolitan Association of Realtors, St. Tammany Association of Realtors, Tangipahoa Board of Realtors, Baton Rouge Board of Realtors or their Multiple Listing Services. Neither the Boards, Associations, nor their MLS guarantees or is in any way responsible for its accuracy. Data maintained by the Boards, Associations or their MLS may not reflect all real estate activity for all years.
Source: LATTER & BLUM Research Division.
0
100
200
300
400
500
600
700
800
1989 1990 1991 1992 1993 1994 1995 1996 1997 1998 1999 2000 2001 2002 2003 2004 2005 2006 2007 2008 2009 2010 2011 2012 2013 2014 2015 2016 2017
Active Sold
Seller’s Market
East St. Tammany AreaSingle Family- Active Listings vs. Sold Listings
Jan. 1989 – Mar. 2017
This representation is based in whole or in part on data supplied by New Orleans Metropolitan Association of Realtors, St. Tammany Association of Realtors, Tangipahoa Board of Realtors, Baton Rouge Board of Realtors or their Multiple Listing Services. Neither the Boards, Associations, nor their MLS guarantees or is in any way responsible for its accuracy. Data maintained by the Boards, Associations or their MLS may not reflect all real estate activity for all years.
Source: LATTER & BLUM Research Division.
0
200
400
600
800
1000
1200
1400
1600
1989 1990 1991 1992 1993 1994 1995 1996 1997 1998 1999 2000 2001 2002 2003 2004 2005 2006 2007 2008 2009 2010 2011 2012 2013 2014 2015 2016 2017
Active Sold
2017 Dr. Ivan Miestchovich Economic Outlook & Real Estate Forecast Seminar - 40

Ormond AreaSingle Family- Active Listings vs. Sold Listings
Jan. 1989 – Mar. 2017
This representation is based in whole or in part on data supplied by New Orleans Metropolitan Association of Realtors, St. Tammany Association of Realtors, Tangipahoa Board of Realtors, Baton Rouge Board of Realtors or their Multiple Listing Services. Neither the Boards, Associations, nor their MLS guarantees or is in any way responsible for its accuracy. Data maintained by the Boards, Associations or their MLS may not reflect all real estate activity for all years.
Source: LATTER & BLUM Research Division.
0
50
100
150
200
250
300
1989 1990 1991 1992 1993 1994 1995 1996 1997 1998 1999 2000 2001 2002 2003 2004 2005 2006 2007 2008 2009 2010 2011 2012 2013 2014 2015 2016 2017Active Sold
Luling AreaSingle Family- Active Listings vs. Sold Listings
Jan. 1989 – Mar. 2017
This representation is based in whole or in part on data supplied by New Orleans Metropolitan Association of Realtors, St. Tammany Association of Realtors, Tangipahoa Board of Realtors, Baton Rouge Board of Realtors or their Multiple Listing Services. Neither the Boards, Associations, nor their MLS guarantees or is in any way responsible for its accuracy. Data maintained by the Boards, Associations or their MLS may not reflect all real estate activity for all years.
Source: LATTER & BLUM Research Division.
0
20
40
60
80
100
120
140
160
180
1989 1990 1991 1992 1993 1994 1995 1996 1997 1998 1999 2000 2001 2002 2003 2004 2005 2006 2007 2008 2009 2010 2011 2012 2013 2014 2015 2016 2017
Active Sold
Laplace AreaSingle Family- Active Listings vs. Sold Listings
Jan. 1989 – Mar. 2017
This representation is based in whole or in part on data supplied by New Orleans Metropolitan Association of Realtors, St. Tammany Association of Realtors, Tangipahoa Board of Realtors, Baton Rouge Board of Realtors or their Multiple Listing Services. Neither the Boards, Associations, nor their MLS guarantees or is in any way responsible for its accuracy. Data maintained by the Boards, Associations or their MLS may not reflect all real estate activity for all years.
Source: LATTER & BLUM Research Division.
0
50
100
150
200
250
300
350
400
450
500
1989 1990 1991 1992 1993 1994 1995 1996 1997 1998 1999 2000 2001 2002 2003 2004 2005 2006 2007 2008 2009 2010 2011 2012 2013 2014 2015 2016 2017
Active Sold
Seller’s Market
Tangipahoa ParishSingle Family- Active Listings vs. Sold Listings
Jan. 2001 – Mar. 2017
This representation is based in whole or in part on data supplied by New Orleans Metropolitan Association of Realtors, St. Tammany Association of Realtors, Tangipahoa Board of Realtors, Baton Rouge Board of Realtors or their Multiple Listing Services. Neither the Boards, Associations, nor their MLS guarantees or is in any way responsible for its accuracy. Data maintained by the Boards, Associations or their MLS may not reflect all real estate activity for all years.
Source: LATTER & BLUM Research Division.
0
100
200
300
400
500
600
700
800
900
1000
2001 2002 2003 2004 2005 2006 2007 2008 2009 2010 2011 2012 2013 2014 2015 2016 2017
Active Sold
GNO Area - Months of Inventory Pended Sales Rate
2017 – 3.1 Months2016 – 4.0 Months
2015 -5 Months2014 – 5.8 Months
2013 – 7.1Months2012 – 7.5 Months
2011 – 10.4 Months
GNO – Median Price $231,000.00
Source: LATTER & BLUM Research DivisionThis representation is based in whole or in part on data supplied by New Orleans Metropolitan Association of Realtors, St. Tammany Association of Realtors, Tangipahoa Board of Realtors, Baton Rouge Board of Realtors or their Multiple Listing Services. Neither the Boards, Associations, nor their MLS guarantees or is in any way responsible for its accuracy. Data maintained by the Boards, Associations or their MLS may not reflect all real estate activity for all years.
24
New Construction
2017 Dr. Ivan Miestchovich Economic Outlook & Real Estate Forecast Seminar - 41

GNO – Median Price $193,000.00
Source: LATTER & BLUM Research DivisionThis representation is based in whole or in part on data supplied by New Orleans Metropolitan Association of Realtors, St. Tammany Association of Realtors, Tangipahoa Board of Realtors, Baton Rouge Board of Realtors or their Multiple Listing Services. Neither the Boards, Associations, nor their MLS guarantees or is in any way responsible for its accuracy. Data maintained by the Boards, Associations or their MLS may not reflect all real estate activity for all years.
25
Resale Top Expected Influencers 2017
• Interest Rates•Pent Up Demand
•Consumer & CEO Confidence
• Jobs layoffs •Oil & Gas Prices & Investments
Latter & Blum Companies are cautiously optimistic…•Opportunities – 1st time buyers, pent up demand & household creation
• Threats ‐ jobs, mtg rates, MID, low inventory
•Non‐events ‐ GSE reform & election
Forecast
• Closed sales volume up 6%• 50% units & 50% price
Budgets
• Based on “Flat Market Performance”
THANK YOU!
Rick Haase, Latter & [email protected]
2017 Dr. Ivan Miestchovich Economic Outlook & Real Estate Forecast Seminar - 42

METRO NEW ORLEANS MULTI-FAMILY MARKET-- AN OVERVIEW --
UNO Real Estate Market ForecastMay 5, 2017
METRO NEW ORLEANSMulti-Family Inventory
Kenner9%
East Bank Jefferson
31%
West Bank Jefferson
17%
Algiers10%
New Orleans East9%
East St. Tammany
5%
West St. Tammany
7%N.O. Historic
Center12%
Occupancy: 95%
Average Rent: $1,218
Average Rent Per Sq. Ft.: $1.07
SnapshotMetro New Orleans SUBMARKET OCCUPANCY
Kenner 96%West Metairie 97%River Ridge 94%East Metairie 97%Mid-City/Lakefront 97%Warehouse District/CBD 88%Uptown/Garden District 93%Gentilly/Lake Forest 97%East New Orleans 92%St. Bernard Parish 97%Algiers 93%Harvey Canal East 95%Harvey Canal West 96%West St. Tammany 97%East St. Tammany 96%
OCCUPANCY TREND2004 - 2016
95% 94%95%
92%90%
87%88%
90%
93%93%
94%96% 95% 95%
HISTORIC CENTER DEVELOPMENTSProperty Developer Units Costs
Canal Crossing Provident Realty Advisors
330 $61,000,000
Odeon The DomainCompanies
259 $100,000,000
The Jung MCC Real Estate 150 $130,000,000Pythian Green Coast
Enterprises69 $38,000,000
Via Latrobe Sean Cummings 260Lafitte Greenway
Edwards Development/ Torres Site
382 $66,000,000
Jackson Oaks Kailas Companies 211
*Select Developments*
2017 Dr. Ivan Miestchovich Economic Outlook & Real Estate Forecast Seminar - 43

REAGAN CROSSINGCOVINGTON
Developer: McMath/ Riecke288 Luxury Units1,2, & 3 Bedroom Units792-1,371 Square Feet$820-$1,350 Rent Range
NORTHPARKCOVINGTON
Developer: AMG Development218 Luxury UnitsStudio, 1, & 2 Bedroom Units550 – 1,200 Square Feet$900 - $1,450 Rent Range
ARTESIACOVINGTON
Developer: Favrot & Shane 264 Luxury Units1 & 2 Bedroom Units877 – 1,292 Square Feet$1,225 - $1,650 Rent Range
SPRINGS AT RIVER CHASECOVINGTON
Developer: Continental Properties296 Luxury UnitsStudio, 1, 2, & 3 Bedroom Units550 – 1,430 Square Feet$799 - $2,359 Rent Range
CLEARWATER CREEK PHASE IIRIVER RIDGE
Developer: Favrot & Shane Companies108 Luxury Units1 & 2 Bedroom Units830 – 1,270 Square Feet$1,200 - $1,710 Rent Range larryschedler.com
2017 Dr. Ivan Miestchovich Economic Outlook & Real Estate Forecast Seminar - 44

Institute for Economic Development & Real Estate Research 2017 Institute Partners
Associate
American Bank & Trust Ed White &
Associates
Eustis Commercial
Mortgage Fifth District Savings Bank
Liberty Bank & Trust
Max J. Derbes, Inc. Resource Bank Trapolin-Peer Architects, APC Walker & Dunlop
Jefferson Parish Economic Development Commission (JEDCO)
EXECUTIVE General
Senior
Junior
Shadow Lake Management