7. least squares 7.1 method of least squares k. desch – statistical methods of data analysis ss10...
Post on 21-Dec-2015
220 views
TRANSCRIPT

7. Least squares 7.1 Method of least squares
K. Desch – Statistical methods of data analysis SS10
Another important method to estimate parameters
Connection with maximum likelihood :
- N independent Gauss-distributed random variables yi, i=1,…,N- Each yi related to another variable (exactly known) xi
- Each yi has unknown mean i and known variance i2
→ can be regarded as a measurement of an N-dimensional random vector
True value Goal: estimate parameters (x;)
x
yii
2N
i i1 N 1 N 22
i 1 ii
(y )1g(y ,...,y ; ,..., ) exp
22
(x; )
1 m( ,..., )
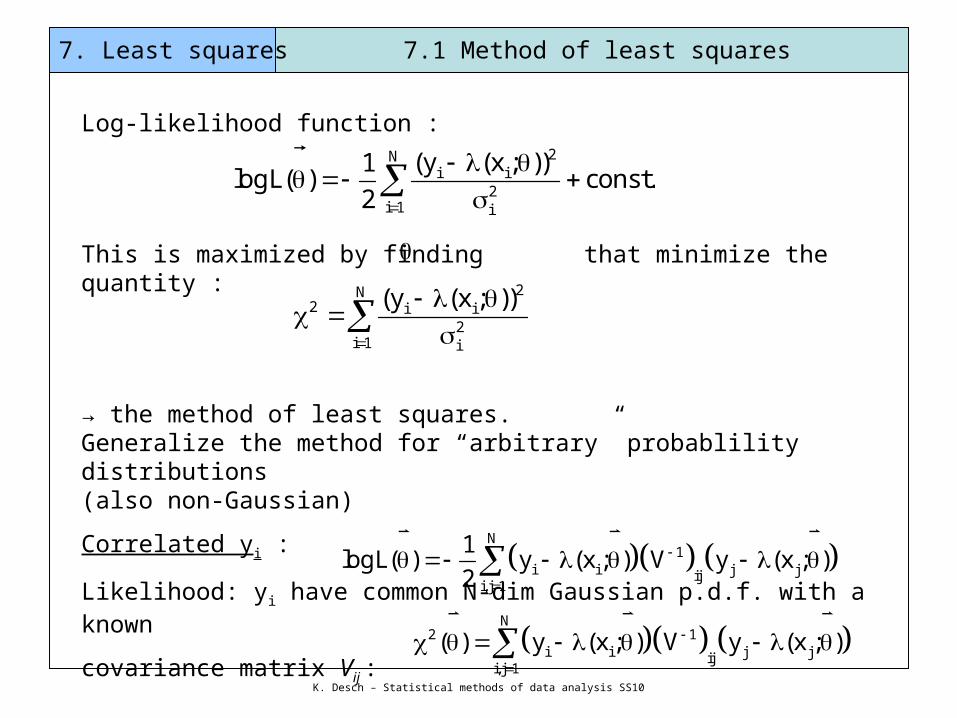
Log-likelihood function :
This is maximized by finding that minimize the quantity :
→ the method of least squares. Generalize the method for “arbitrary” probablility distributions (also non-Gaussian)
Correlated yi :
Likelihood: yi have common N-dim Gaussian p.d.f. with a known
covariance matrix Vij :
equivalent to minimizing of :
7. Least squares 7.1 Method of least squares
K. Desch – Statistical methods of data analysis SS10
2Ni i
2i 1 i
(y (x ; ))1logL( ) const.
2
2N2 i i
2i 1 i
(y (x ; ))
N
1i i j jij
i,j 1
1logL( ) y (x ; ) V y (x ; )
2
N
2 1i i j jij
i,j 1
( ) y (x ; ) V y (x ; )

Linear least-squares fit
special case : ( linear function of ; a j(x) are
in general not linear in x but fixed )
→ can be solved analytically (although often solved numerically)
→ linear LS estimators are unbiased and have minimum variance( among all linear estimators)
Value of at xi can be written :
→
Minimum :
Solution : , if exists
the solutions are linear functions of the original measurements
7. Least squares 7.1 Method of least squares
K. Desch – Statistical methods of data analysis SS10
m
j jj 1
(x; ) a (x)
m m
i i j i j ij jj 1 j 1
(x ; ) a (x ) Aλ(x;θ)
2 T 1 T 1(y ) V (y ) (y A ) V (y A )
2 T 1 T 12(A V y A V A ) 0
1 Nλ (λ ,...,λ )
1 Ny (y ,...,y )
T 1 1 T 1(A V A) A V y By T 1 1(A V A)
θ λ

Covariance matrix using error propagation:
Equivalently the inverse covariance matrix :
that coincides with RCF bound when yi are Gaussian distributed
For the case of λ linear in → 2 is quadratic in →
describes an ellipsoid with tangent
7. Least squares 7.1 Method of least squares
K. Desch – Statistical methods of data analysis SS10
lk l kU cov[ , ] T T 1 1U BVB (A V A)
2 21
klk l
1(U )
2
2 2m2 2
k k l lk,l 1 k l
1( ) ( ) ( )( )
2
2 2 2
min( ) ( ) 1 1 k kˆ ˆ
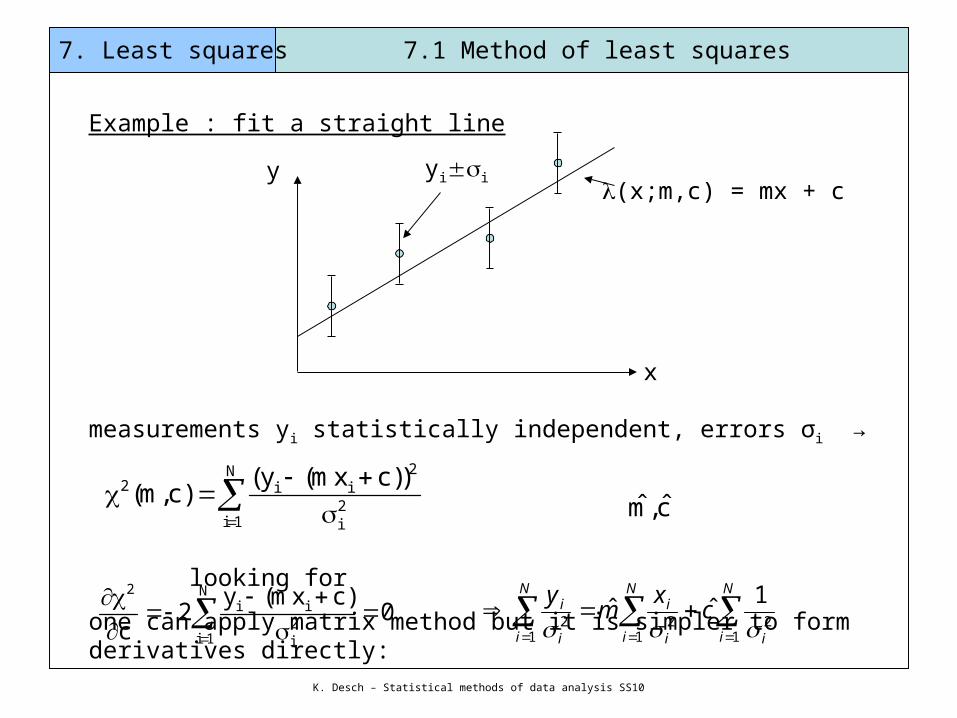
Example : fit a straight line
measurements yi statistically independent, errors σi →
looking for
one can apply matrix method but it is simpler to form derivatives directly:
7. Least squares 7.1 Method of least squares
K. Desch – Statistical methods of data analysis SS10
(x;m,c) = mx + c
x
yiiy
2N
2 i i2
i 1 i
(y (mx c))(m,c) ˆ ˆm,c
2 Ni i
2i 1 i
y (mx c)2 0
c
N
i i
N
i i
iN
i i
i cx
my
12
12
12
1ˆˆ
7. Least squares 7.1 Method of least squares
K. Desch – Statistical methods of data analysis SS10
2 Ni i
i 2i 1 i
y (mx c)2 x 0
m
N
i i
iN
i i
iN
i i
ii xc
xm
yx
12
12
2
12
ˆˆ
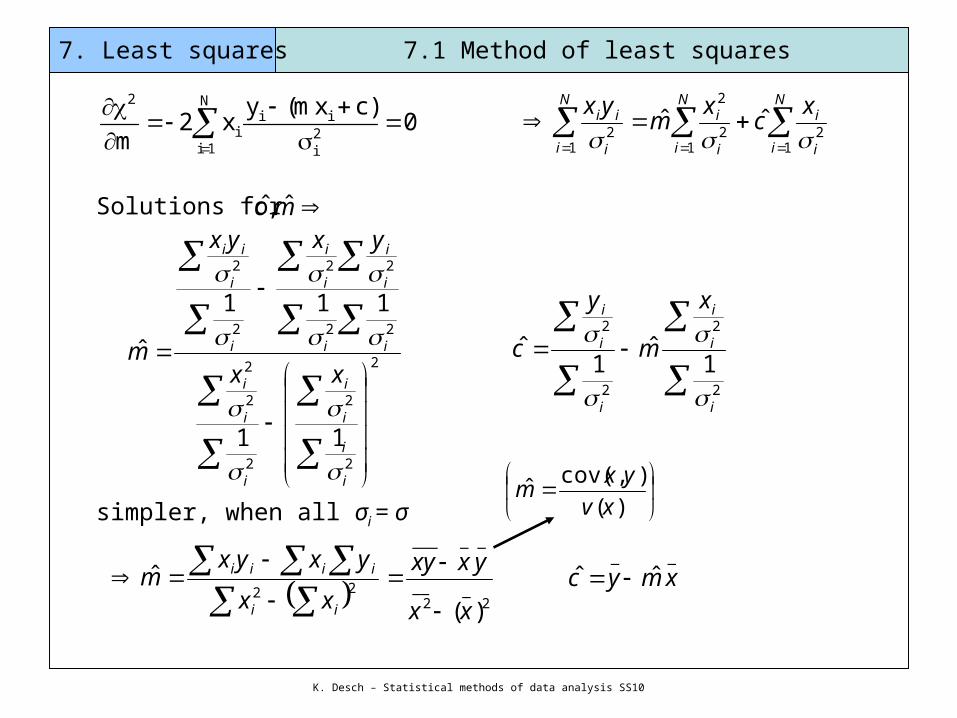
Solutions for
simpler, when all σi = σ
mc ˆ,ˆ
2
2
2
2
2
2
22
22
2
2
11
111
ˆ
i
i
i
i
i
i
i
ii
i
i
i
i
i
i
ii
xx
yxyx
m
2
2
2
2
1ˆ
1ˆ
i
i
i
i
i
i x
m
y
c
2___
2
_____
22
)(
ˆ
xx
yxxy
xx
yxyxm
ii
iiii
__
ˆˆ xmyc
)(
),cov(ˆxv
yxm
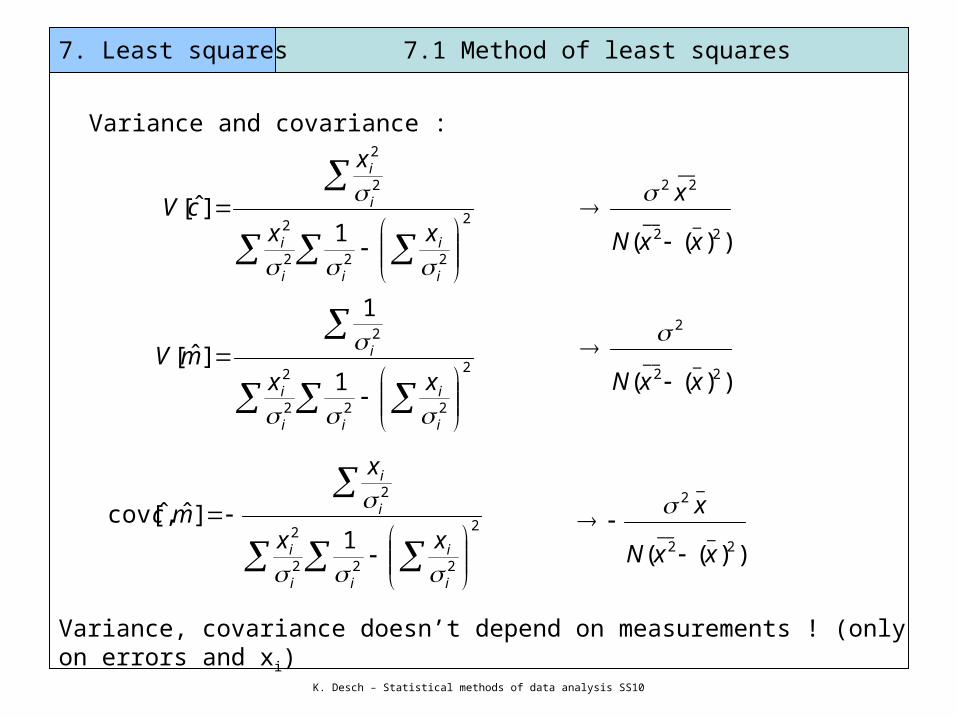
Variance and covariance :
7. Least squares 7.1 Method of least squares
K. Desch – Statistical methods of data analysis SS10
2
222
2
2
2
1]ˆ[
i
i
ii
i
i
i
xx
x
cV
))(( 2___
2
__22
xxN
x
2
222
2
2
1
1
]ˆ[
i
i
ii
i
i
xxmV
))(( 2___
2
2
xxN
2
222
2
2
1]ˆ,ˆcov[
i
i
ii
i
i
i
xx
x
mc
))(( 2___
2
_2
xxN
x
Variance, covariance doesn’t depend on measurements ! (only on errors and xi)

7. Least squares 7.1 Method of least squares
K. Desch – Statistical methods of data analysis SS10
For any point
(error propagation by correlated variables)
cxmxy ˆˆ)(
]ˆ,ˆcov[2]ˆ[]ˆ[][ 2 mcxcVmVxyV
]ˆ,ˆcov[ˆˆ
2ˆˆ
][ 22
22
cmc
y
m
y
c
y
m
yyV cm
]ˆ,ˆcov[22ˆ
2ˆ
2 cmxx cm
7. Least squares 7.1 Method of least squares
K. Desch – Statistical methods of data analysis SS10
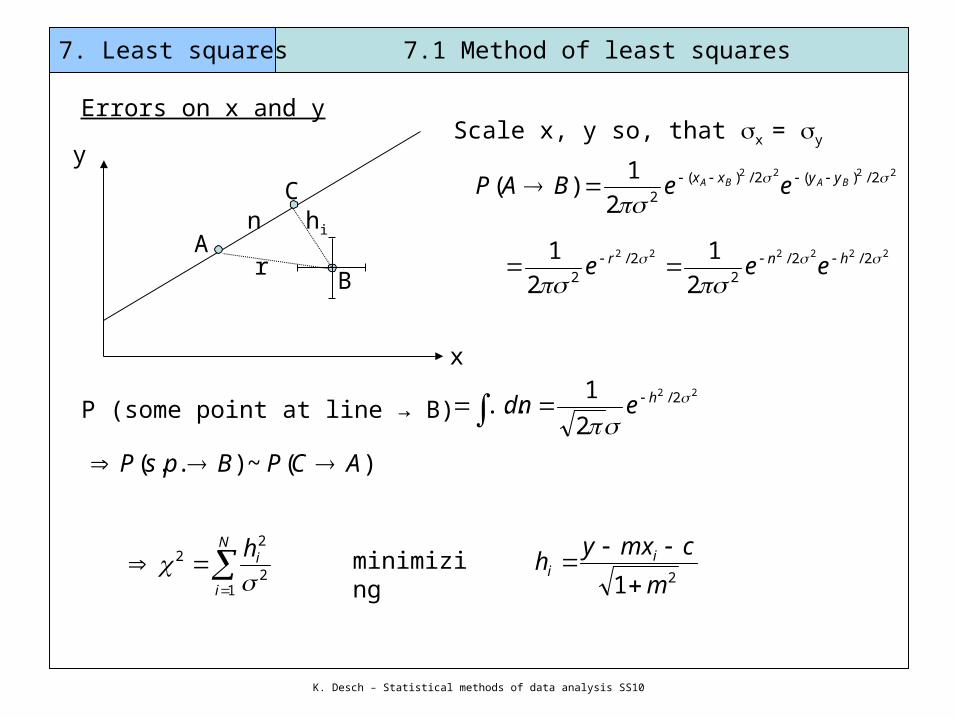
x
y
hi
Scale x, y so, that x = y
Errors on x and y
2222 2/)(2/)(22
1)(
BABA yyxx eeBAP
222222 2/2/2
2/2 2
1
2
1
hnr eee
A
B
C
r
n
P (some point at line → B)22 2/
2
1...
hedn
)(~)..( ACPBpsP
N
i
ih
12
22
minimizing
21 m
cmxyh i
i

with when
when
7. Least squares 7.1 Method of least squares
K. Desch – Statistical methods of data analysis SS10
Solution : (from )cxmy ˆˆ c
2
1ˆ 2 AAm (from )m
2
),cov(2
)()(
yx
xVyVA
m
m
0),cov( yx
0),cov( yx

7. Least squares 7.1 Method of least squares
K. Desch – Statistical methods of data analysis SS10
Least squares with binned data
so far was an arbitrary function
now λ is proportional to a p.d.f. of random variable x
N measurements → histogram with N bins, yi = number of entries in bin i
= p.d.f. The number of entries predicted in bin i is :
Minimizing the quantity :
= Poisson error = λi
i(x ; )
if(x ; )
maxi
mini
x
i i
x
( ) n f(x; )dx np ( )
2N
i i22
i 1 i
y ( )( )
2i
2 2N
i i i i2
i 1 i i
y ( ) y np ( )( )
( ) np ( )

Alternative (“Modified least-squared method NLS”) :
numerically simpler but worse estimation of errors (esp. if yi is small)
Normalization factor
the predicted number of entries becomes :
is estimator
Goodness-of-fit with
itself is a random variable distributed according to - distribution
Number of degrees of freedom = number of measured points –
number of parameters
7. Least squares 7.1 Method of least squares
K. Desch – Statistical methods of data analysis SS10
2N
i i2
i 1 i
y( )
y
maxi
mini
x
i i
x
( , ) f(x; )dx p ( )
2ˆ
2 nLS2ˆ nMLS
22 2