71 turtlecreek blvd. green home makeover energy …...2015/02/03 · using the relationship...
TRANSCRIPT
1
August 19, 2014
Sustainable Neighbourhood Retrofit Action Plan (SNAP) County Court -
71 Turtlecreek Blvd. Green Home Makeover
Energy and Water Use and Stormwater Monitoring Final Report
1. Introduction
The County Court Sustainable Neighbourhood Retrofit Action Plan (SNAP) project focuses on promoting
the adoption of more sustainable practices in an existing community in the City of Brampton. The
neighbourhood is bounded by Hurontario Street to the west, Kennedy Road to the east, Highway 407 to
the south and Etobicoke Creek to the north. As a strategic means of encouraging community members
to renovate their 1980’s era homes to take advantage of more energy and water efficient products
available today, a single family detached home in the neighbourhood was selected to receive a “green
home makeover”. This makeover demonstration also supported new private sector partnerships and
educational opportunities for the renovation industry.
The four bedroom house located at 71 Turtlecreek Boulevard in Brampton was selected in part because
very few renovations had been undertaken since it was built in 1984. This offered the greatest
opportunity to showcase the impact of green renovation. The green home makeover involved
renovations to improve energy efficiency including replacement of heating (furnace, hot water, dryer),
ventilation and air conditioning system components with high efficiency models, improved insulation in
the walls and attic, replacement of all windows and air leak sealing. It also included renovations to
improve water efficiency including replacement of the clothes washer, dishwasher, toilets and fixtures
with low flow models. The front yard was also renovated to showcase landscaping that is less water-
demanding than conventional turfgrass to help conserve municipal water and lot level stormwater
management practices that reduce the amount of runoff that enters the storm sewers during rain and
snowmelt events, to help restore more natural patterns of flow and aquatic habitat in Etobicoke Creek.
A rain garden and permeable pavement driveway and walkway were installed and rain barrels were
added to harvest roof runoff for use in landscape irrigation to offset use of municipal water. The
renovations took place between September 14, 2011 and February 9, 2012. Appendix A describes all of
the renovations that were implemented.
One of the objectives of the green home makeover is to demonstrate to the community the energy and
water use savings and lot runoff volume reductions that are possible to inspire others to undertake
similar types of renovations. Energy and water use in the home prior to the renovations were evaluated
in the report entitled Sustainable Neighbourhood Retrofit Action Plan (SNAP) County Court - 71
Turtlecreek Blvd. Green Home Makeover Pre-renovation Energy and Water Use (TRCA, 2012a). In this
report, pre-renovation energy and water use are compared to post-renovation consumption to quantify
the savings achieved. In order to more accurately characterize usage in the home, the pre-renovation
evaluation period used in this report is extended to four years for energy consumption and five years for
water consumption from the two year period examined in the 2012 report. Post-renovation energy and
water use and the effectiveness of the lot level stormwater practices to reduce runoff are assessed over
2
a two year period. Efforts have been made to characterize energy and water usage both on an annual
and seasonal basis where suitable information is available.
2. Information Sources
Energy Use
Pre-renovation energy use was evaluated over the four year period between mid-September 2007 and
mid-September 2011. Post-renovation energy use was evaluated over the two year period between mid-
March 2012 and mid-March 2014. Information regarding energy use and cost was drawn from
electricity and natural gas bills. Electricity bills provide usage information on a monthly basis in units of
kilowatt hours (kWh) as measured by the electricity meter installed on the home. Electricity bills also
provide information on cost of electricity, which varies depending on the time of day the energy is
consumed. Natural gas bills are also monthly and provide usage in units of cubic metres (m3). Actual
gas meter readings are provided bimonthly and every other bill is based on estimated usage. Both
actual and estimated meter readings were used to determine natural gas use.1 To calculate the cost of
natural gas, the “total new gas charges” were extracted from each bill. Service charges such as the hot
water tank rental fee were excluded from the cost analysis. Natural gas and electricity costs are
reported exclusive of taxes in order to eliminate the effect of the introduction of the Harmonized Sales
Tax (HST) midway through the evaluation period.
Seasonal use of natural gas and electricity was calculated by totaling monthly use each season.2 Winter
was assumed to be represented by the billing period beginning mid-December and ending mid-March.
Spring was assumed to be represented by the billing period beginning mid-March and ending mid-June.
Summer was assumed to be represented by the billing period beginning mid-June and ending mid-
September. Fall was assumed to be represented by the billing period beginning mid-September and
ending mid-December. For comparison, electricity and natural gas usage data were converted to
common units of gigajoules (GJ)3.
Water Use
Pre-renovation water use was assessed over the five year period beginning in late-September 2006 and
ending in late-September 2011. Post-renovation water use was assessed over the two year period from
mid-March 2012 to mid-March 2014. Information regarding water use was drawn from quarterly water
bills which provide usage information in units of cubic metres (m3), truncated to the nearest 10 cubic
metres, as measured by the water meter installed on the home. To help quantify the savings achieved
by yard renovations, pre-renovation outdoor water use was estimated through a seasonal analysis of
water bill information. Since water use measurements were only available on a quarterly period, to
characterize it on a seasonal basis billing information was summed according to a non-growing season
1 Over the majority of the evaluation period, actual and estimated gas meter readings were provided for a one
month billing period. Total usage was determined by taking the sum of both types of readings. From January to
September of 2012, actual gas meter readings were provided for a two month rather than a one month billing
period. . 2 Each monthly billing period for natural gas began approximately one week later than the billing period for
electricity. This was not considered to have a significant effect on the seasonal or annual analysis. 3 One cubic metre of natural gas is equivalent to 0.0370804 gigajoules (GJ) of energy. One kilowatt hour of
electricity is equivalent to 0.0036 GJ of energy.

3
and a growing season. The non-growing season was assumed to be represented by the billing period
beginning in late-September and ending in late-March, during which outdoor water use is typically
minimal or none at all. The growing season was assumed to be represented by the billing period
beginning in late-March and ending in late-September, during which irrigation of lawns and gardens as
well as other outdoor water uses typically occur. It is assumed that outdoor water use accounts for the
difference in water usage between these two periods. Because the number of days between each
billing period varies, water use is reported in units of litres per day (L/d). To understand how water use
in the home compares to average residential water use in the Region of Peel, Ontario and Canada,
annual water use in litres per capita day (L/cd) have also been calculated based on occupancy
information provided by the homeowners.
Stormwater Runoff
Information sources used to evaluate the runoff reduction effectiveness of the Low Impact Development
(LID) stormwater management practices implemented as part of the green home makeover were
historical measurements of rainfall depth in the region, field monitoring of rainfall depth in the
neighbourhood and water levels in the permeable driveway and rain garden. Post-renovation field
monitoring was conducted between April to November 2012 and June to September 2013 , representing
a monitoring period of 12 months.
Historical rainfall data from Environment Canada’s Lester B. Pearson Airport climate station was used to
characterize local rainfall depth, based on 30 year climate normal values that represent the average of
1981 to 2010 data. Environment Canada’s climate normal monthly rainfall depth values and derived
seasonal totals were compared to measured rainfall depth in the neighbourhood to determine whether
or not rainfall during the post-renovation monitoring period deviated substantially from normal values
(see Section 8, Table 3 for results of this comparison). Rainfall depth in the neighbourhood was
continuously measured every 5 minutes by a tipping bucket rain gauge installed at City of Brampton Fire
Station #206 (7880 Hurontario St.), located approximately 0.5 kilometres (km) from the property. The
relationship between rainfall event depth and the portion of average annual rainfall depth that occurs as
events less than or equal to that depth, based on 55 years of historical data (1950 to 2005) from the
Lester B. Pearson Airport climate station (TRCA, 2013a) was also used to predict runoff capture
performance of the rain garden and permeable driveway in an average precipitation year.
Water levels in the rain garden and permeable driveway were continuously measured every 5 minutes
with pressure transducers installed in monitoring wells that extend to the base of each practice. Water
level data was used to identify when each practice overflowed due to the water storage capacity being
exceeded. By examining the relationship between rainfall event depth and the frequency of overflow,
the size of rainfall event that each practice is capable of fully capturing runoff from on a consistent basis
was determined. Using the relationship established by TRCA from the 55 year historical rainfall dataset
from Lester B. Pearson Airport climate station, predictions were made regarding what portion of annual
rainfall depth and runoff volume this represents in an average year. Continuous water level data was
also used to evaluate the rate at which each practice drained, the length of time required to fully drain
and how drainage rates varied over the monitoring period. This provides insight into the performance
of stormwater infiltration practices on fine-textured soil like the silty clay glacial till subsoil present in
this neighbourhood and provides a basis for examining how their drainage performance changes over
time as the practices age.
4
Rainwater Use
The volume of rainwater used by the homeowners over the post-renovation monitoring period was
evaluated by collecting continuous water level data in the front and rear yard rain barrels. Pressure
transducers were installed in each rain barrel that collected water level data every 5 minutes over an
April to November 2012 and June to September 2013 post-renovation monitoring period (12 months).
The volume of rainwater used during each usage event was calculated assuming the rain barrels are
cylindrical and using the formula for the volume of a cylinder (i.e. V = πr2h) with the radius dimension
being the average measured value and the height dimension being the decline in water level measured
by the pressure transducer. Annual volumes of rainwater used were calculated by summing the usage
event volumes for each year of the monitoring period.
3. Energy Use
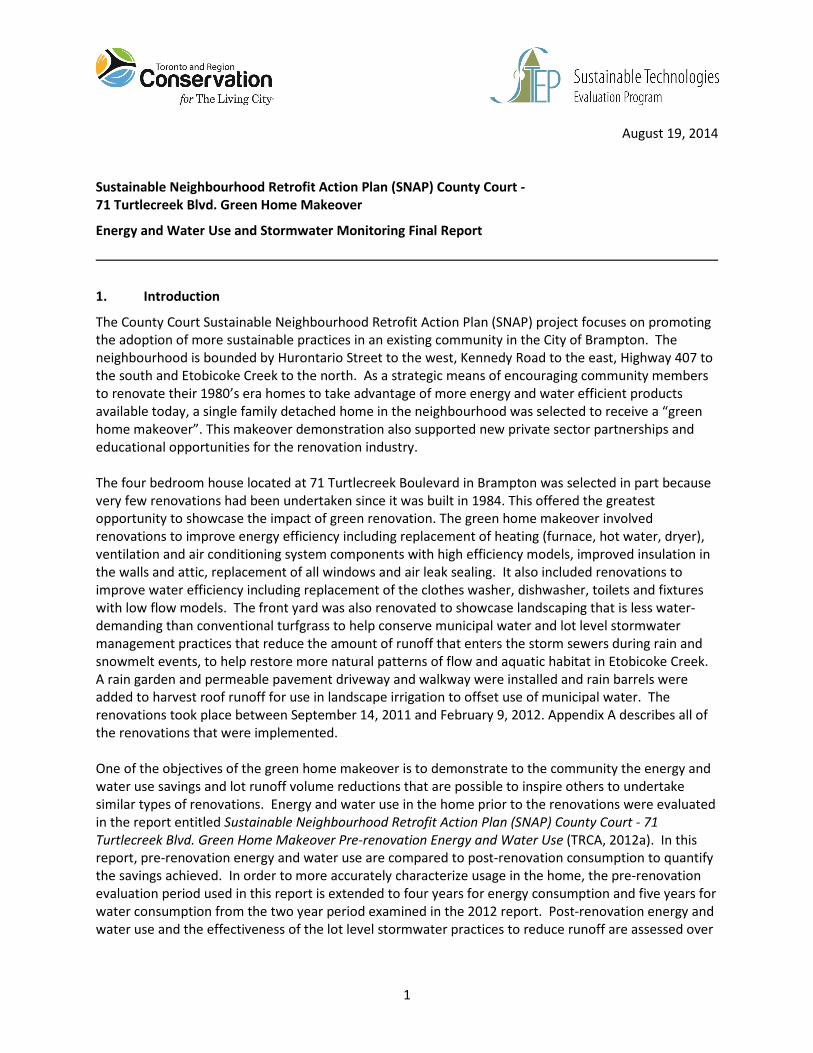
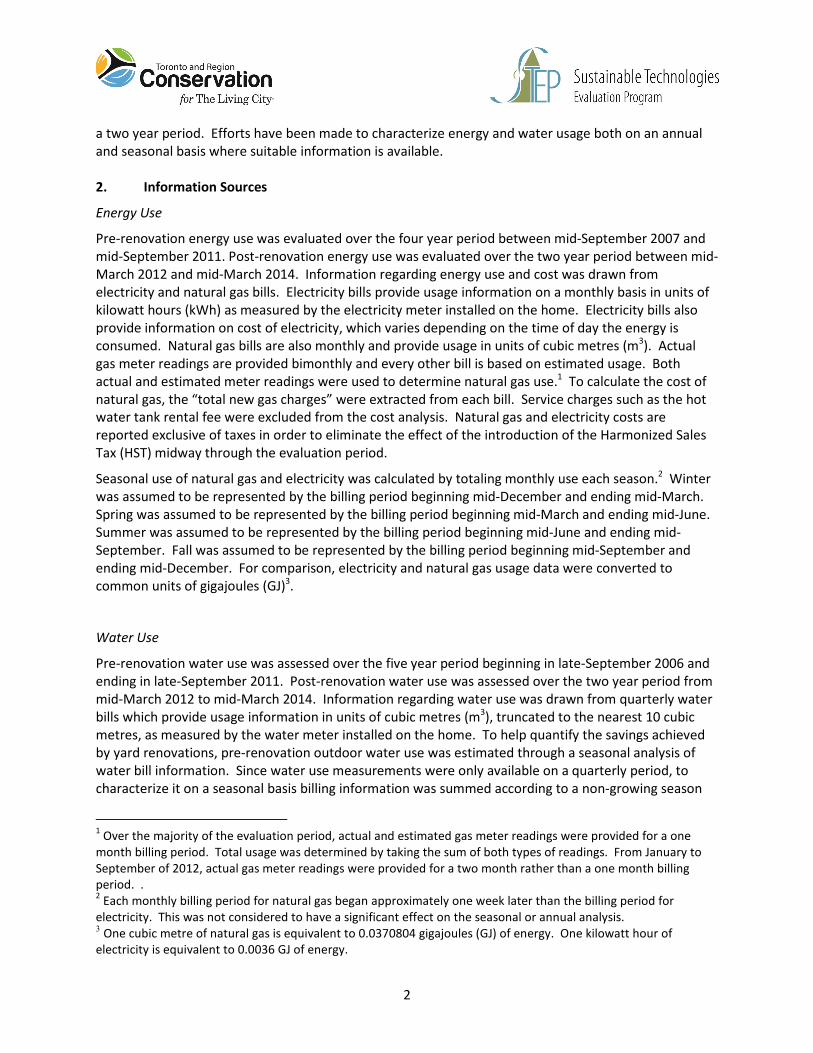
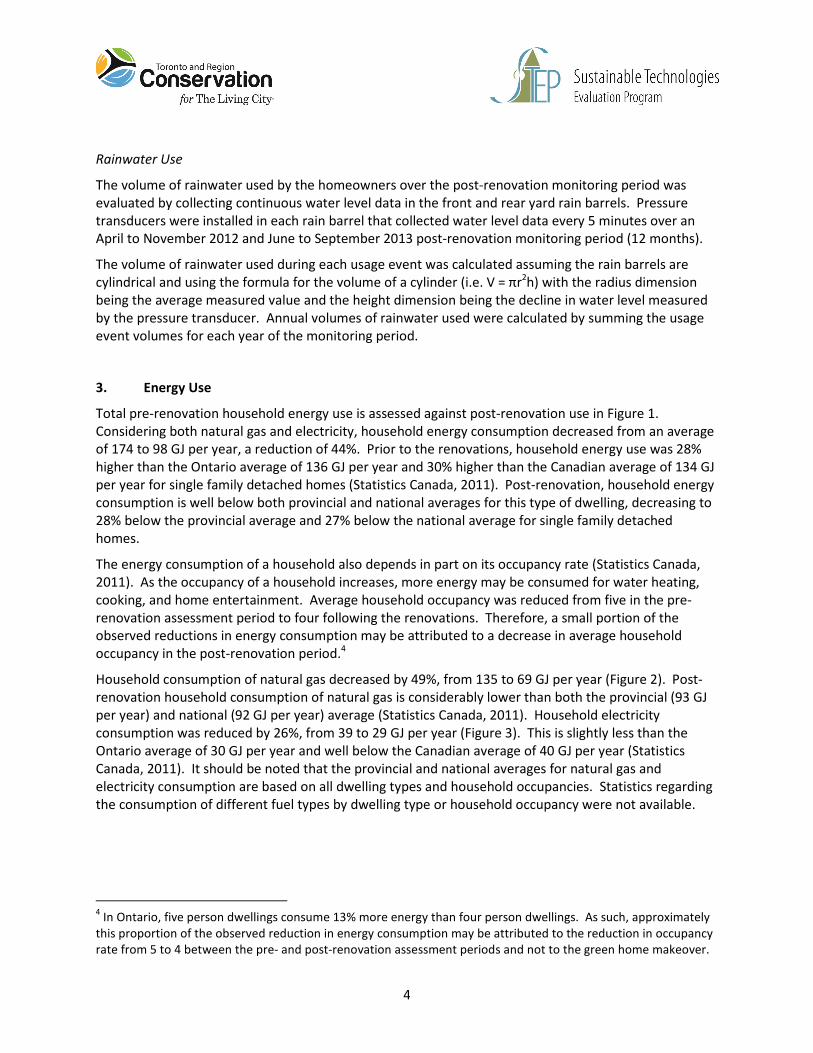
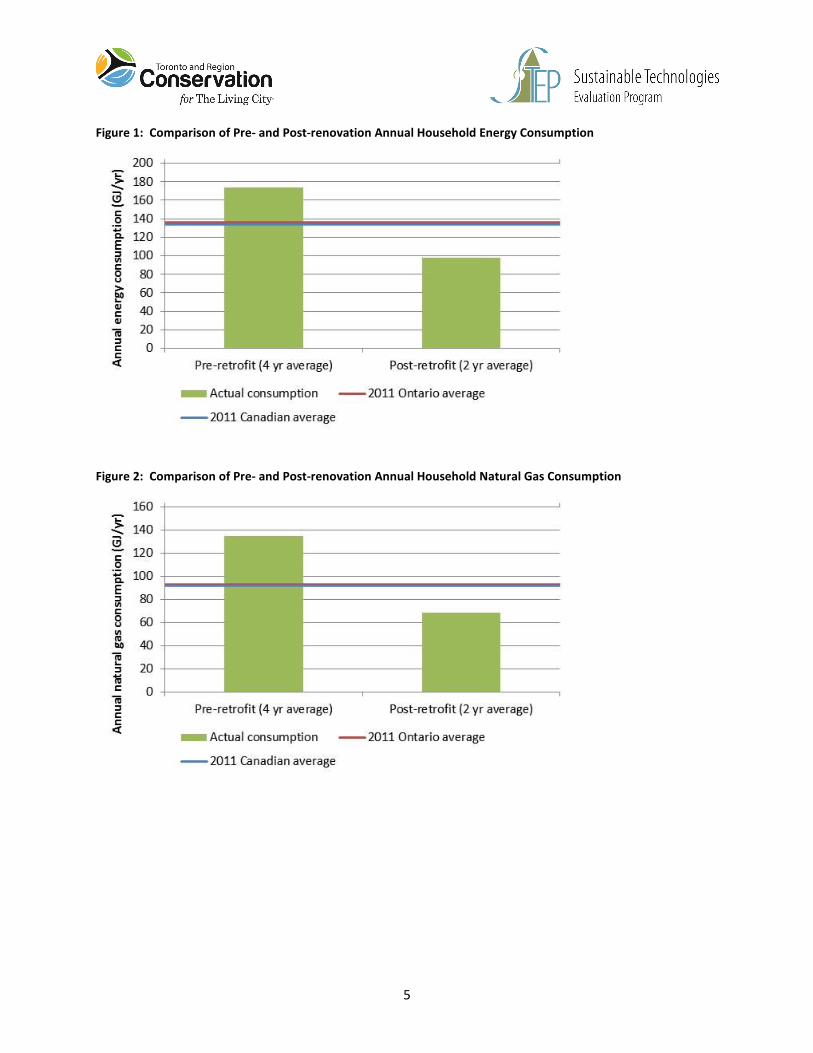
Total pre-renovation household energy use is assessed against post-renovation use in Figure 1.
Considering both natural gas and electricity, household energy consumption decreased from an average
of 174 to 98 GJ per year, a reduction of 44%. Prior to the renovations, household energy use was 28%
higher than the Ontario average of 136 GJ per year and 30% higher than the Canadian average of 134 GJ
per year for single family detached homes (Statistics Canada, 2011). Post-renovation, household energy
consumption is well below both provincial and national averages for this type of dwelling, decreasing to
28% below the provincial average and 27% below the national average for single family detached
homes.
The energy consumption of a household also depends in part on its occupancy rate (Statistics Canada,
2011). As the occupancy of a household increases, more energy may be consumed for water heating,
cooking, and home entertainment. Average household occupancy was reduced from five in the pre-
renovation assessment period to four following the renovations. Therefore, a small portion of the
observed reductions in energy consumption may be attributed to a decrease in average household
occupancy in the post-renovation period.4
Household consumption of natural gas decreased by 49%, from 135 to 69 GJ per year (Figure 2). Post-
renovation household consumption of natural gas is considerably lower than both the provincial (93 GJ
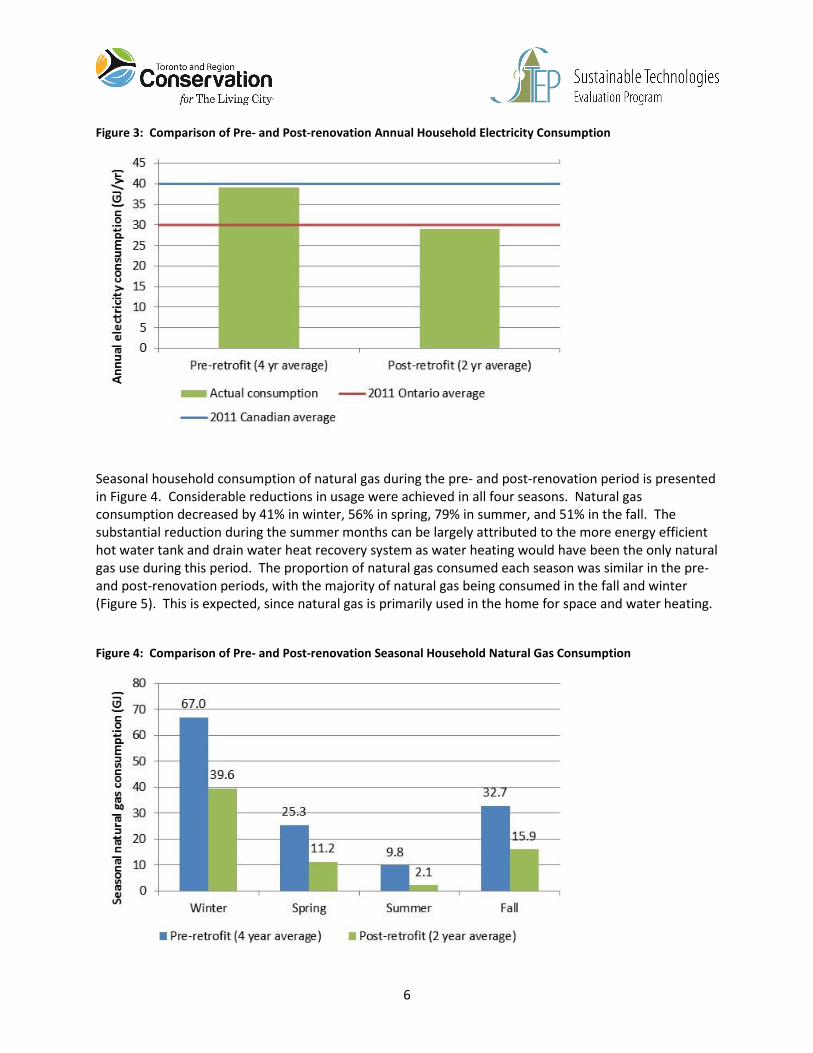
per year) and national (92 GJ per year) average (Statistics Canada, 2011). Household electricity
consumption was reduced by 26%, from 39 to 29 GJ per year (Figure 3). This is slightly less than the
Ontario average of 30 GJ per year and well below the Canadian average of 40 GJ per year (Statistics
Canada, 2011). It should be noted that the provincial and national averages for natural gas and
electricity consumption are based on all dwelling types and household occupancies. Statistics regarding
the consumption of different fuel types by dwelling type or household occupancy were not available.
4 In Ontario, five person dwellings consume 13% more energy than four person dwellings. As such, approximately
this proportion of the observed reduction in energy consumption may be attributed to the reduction in occupancy
rate from 5 to 4 between the pre- and post-renovation assessment periods and not to the green home makeover.
5
Figure 1: Comparison of Pre- and Post-renovation Annual Household Energy Consumption
Figure 2: Comparison of Pre- and Post-renovation Annual Household Natural Gas Consumption
6
Figure 3: Comparison of Pre- and Post-renovation Annual Household Electricity Consumption
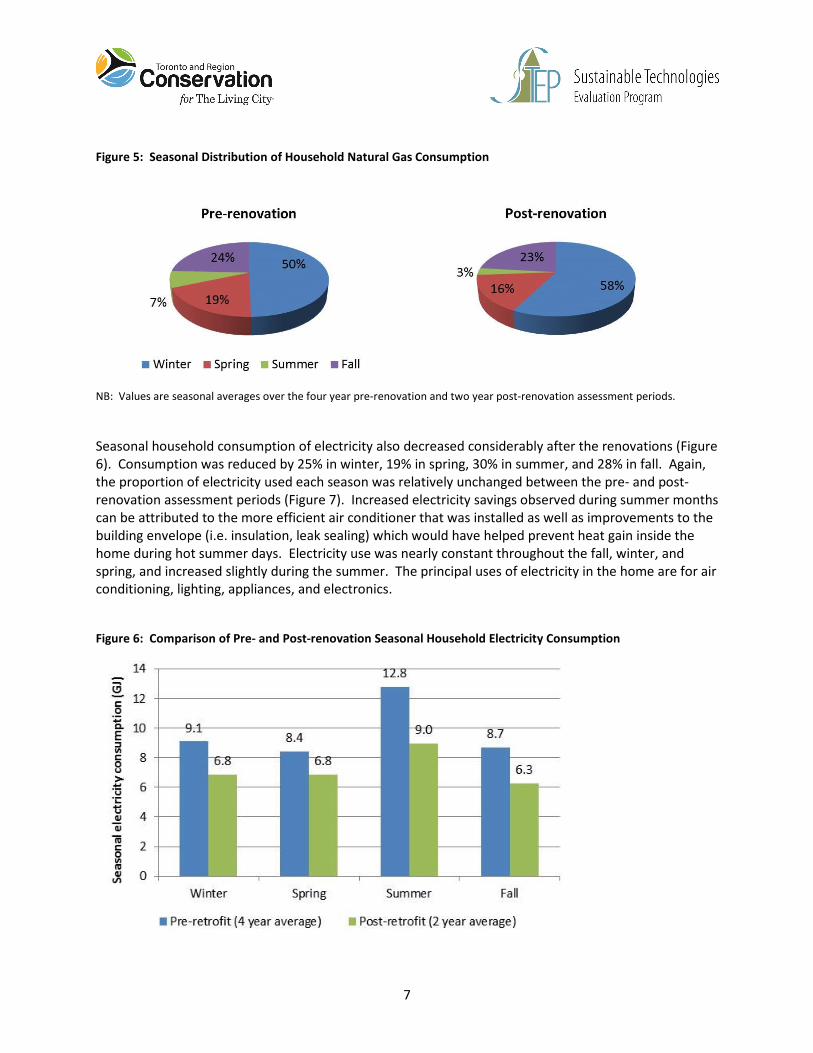
Seasonal household consumption of natural gas during the pre- and post-renovation period is presented
in Figure 4. Considerable reductions in usage were achieved in all four seasons. Natural gas
consumption decreased by 41% in winter, 56% in spring, 79% in summer, and 51% in the fall. The
substantial reduction during the summer months can be largely attributed to the more energy efficient
hot water tank and drain water heat recovery system as water heating would have been the only natural
gas use during this period. The proportion of natural gas consumed each season was similar in the pre-
and post-renovation periods, with the majority of natural gas being consumed in the fall and winter
(Figure 5). This is expected, since natural gas is primarily used in the home for space and water heating.
Figure 4: Comparison of Pre- and Post-renovation Seasonal Household Natural Gas Consumption
7
Figure 5: Seasonal Distribution of Household Natural Gas Consumption
NB: Values are seasonal averages over the four year pre-renovation and two year post-renovation assessment periods.
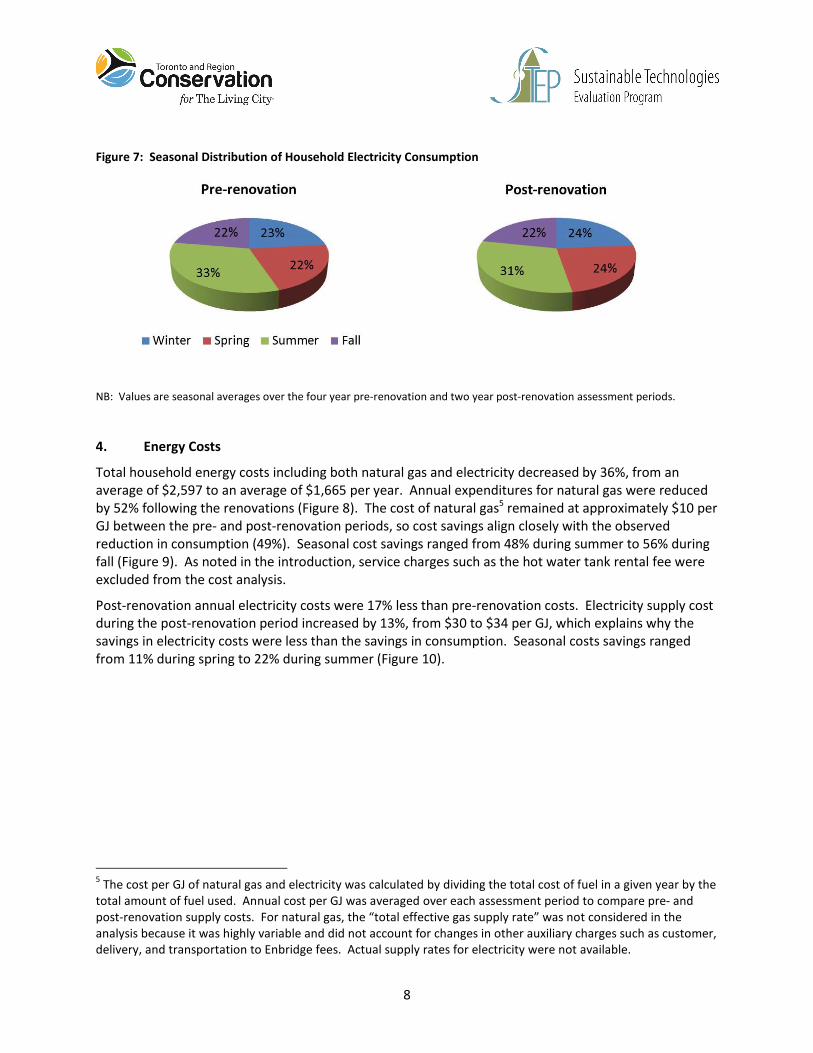
Seasonal household consumption of electricity also decreased considerably after the renovations (Figure
6). Consumption was reduced by 25% in winter, 19% in spring, 30% in summer, and 28% in fall. Again,
the proportion of electricity used each season was relatively unchanged between the pre- and post-
renovation assessment periods (Figure 7). Increased electricity savings observed during summer months
can be attributed to the more efficient air conditioner that was installed as well as improvements to the
building envelope (i.e. insulation, leak sealing) which would have helped prevent heat gain inside the
home during hot summer days. Electricity use was nearly constant throughout the fall, winter, and
spring, and increased slightly during the summer. The principal uses of electricity in the home are for air
conditioning, lighting, appliances, and electronics.
Figure 6: Comparison of Pre- and Post-renovation Seasonal Household Electricity Consumption
8
Figure 7: Seasonal Distribution of Household Electricity Consumption
NB: Values are seasonal averages over the four year pre-renovation and two year post-renovation assessment periods.
4. Energy Costs
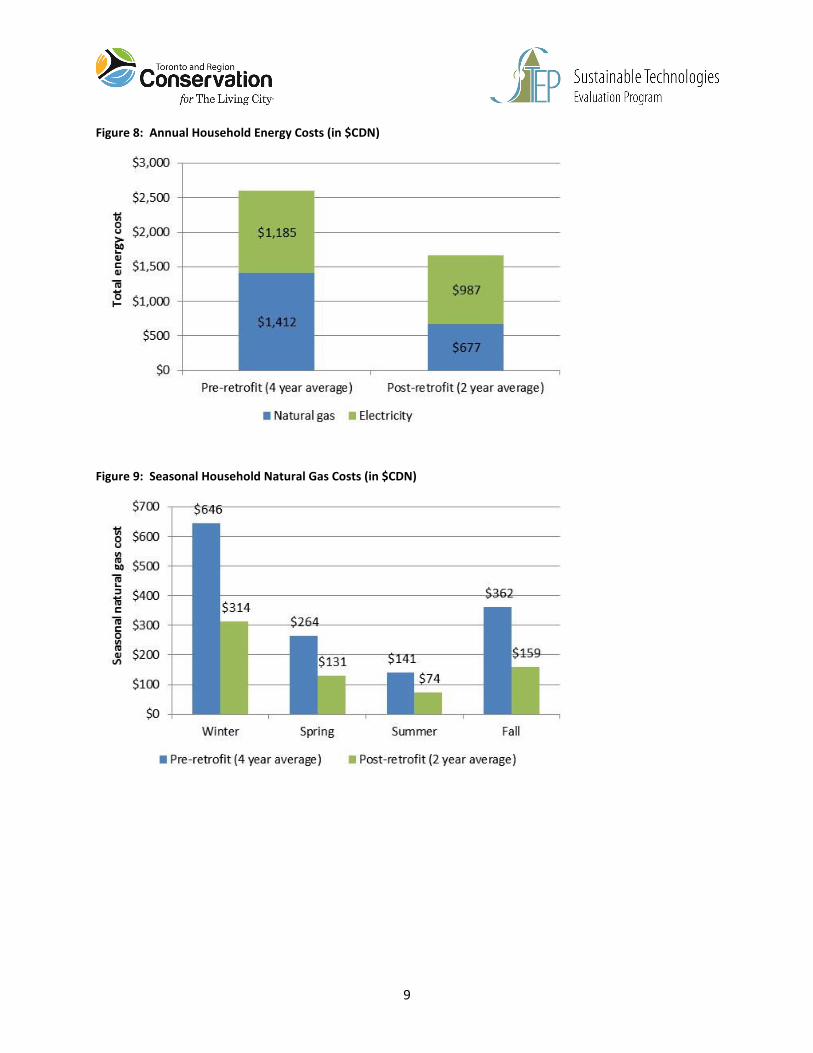
Total household energy costs including both natural gas and electricity decreased by 36%, from an
average of $2,597 to an average of $1,665 per year. Annual expenditures for natural gas were reduced
by 52% following the renovations (Figure 8). The cost of natural gas5 remained at approximately $10 per
GJ between the pre- and post-renovation periods, so cost savings align closely with the observed
reduction in consumption (49%). Seasonal cost savings ranged from 48% during summer to 56% during
fall (Figure 9). As noted in the introduction, service charges such as the hot water tank rental fee were
excluded from the cost analysis.
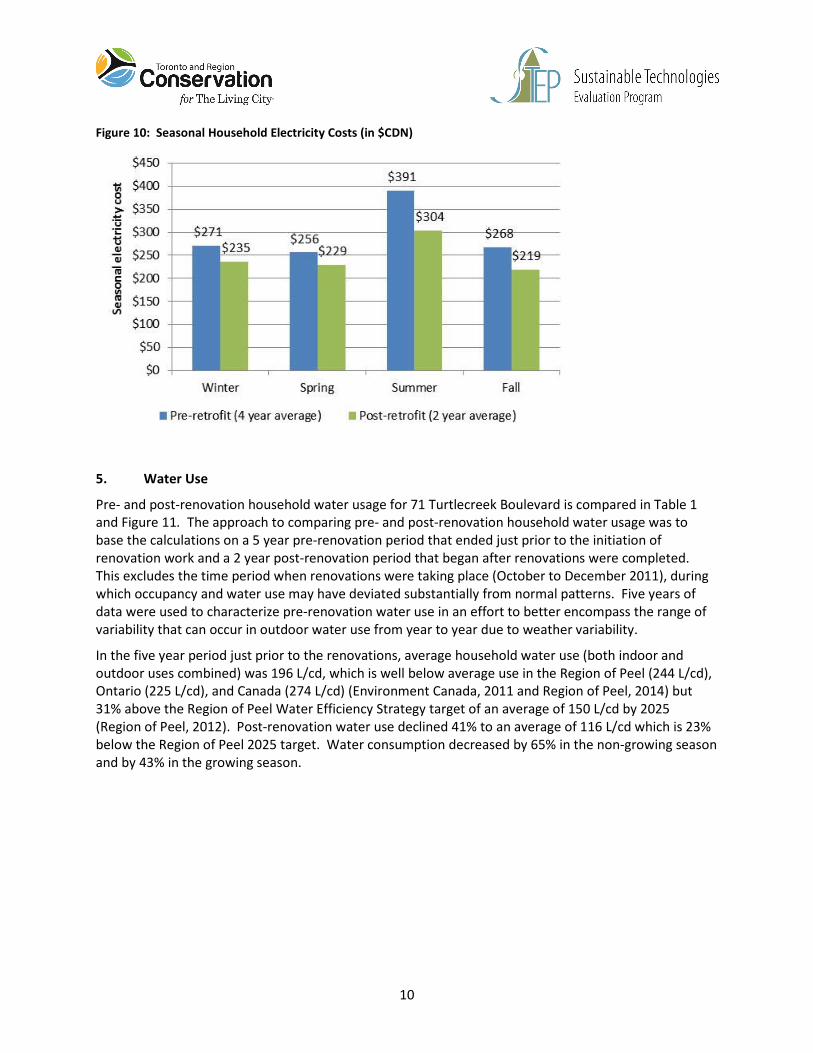
Post-renovation annual electricity costs were 17% less than pre-renovation costs. Electricity supply cost
during the post-renovation period increased by 13%, from $30 to $34 per GJ, which explains why the
savings in electricity costs were less than the savings in consumption. Seasonal costs savings ranged
from 11% during spring to 22% during summer (Figure 10).
5 The cost per GJ of natural gas and electricity was calculated by dividing the total cost of fuel in a given year by the
total amount of fuel used. Annual cost per GJ was averaged over each assessment period to compare pre- and
post-renovation supply costs. For natural gas, the “total effective gas supply rate” was not considered in the
analysis because it was highly variable and did not account for changes in other auxiliary charges such as customer,
delivery, and transportation to Enbridge fees. Actual supply rates for electricity were not available.
9
Figure 8: Annual Household Energy Costs (in $CDN)
Figure 9: Seasonal Household Natural Gas Costs (in $CDN)
10
Figure 10: Seasonal Household Electricity Costs (in $CDN)
5. Water Use
Pre- and post-renovation household water usage for 71 Turtlecreek Boulevard is compared in Table 1
and Figure 11. The approach to comparing pre- and post-renovation household water usage was to
base the calculations on a 5 year pre-renovation period that ended just prior to the initiation of
renovation work and a 2 year post-renovation period that began after renovations were completed.
This excludes the time period when renovations were taking place (October to December 2011), during
which occupancy and water use may have deviated substantially from normal patterns. Five years of
data were used to characterize pre-renovation water use in an effort to better encompass the range of
variability that can occur in outdoor water use from year to year due to weather variability.
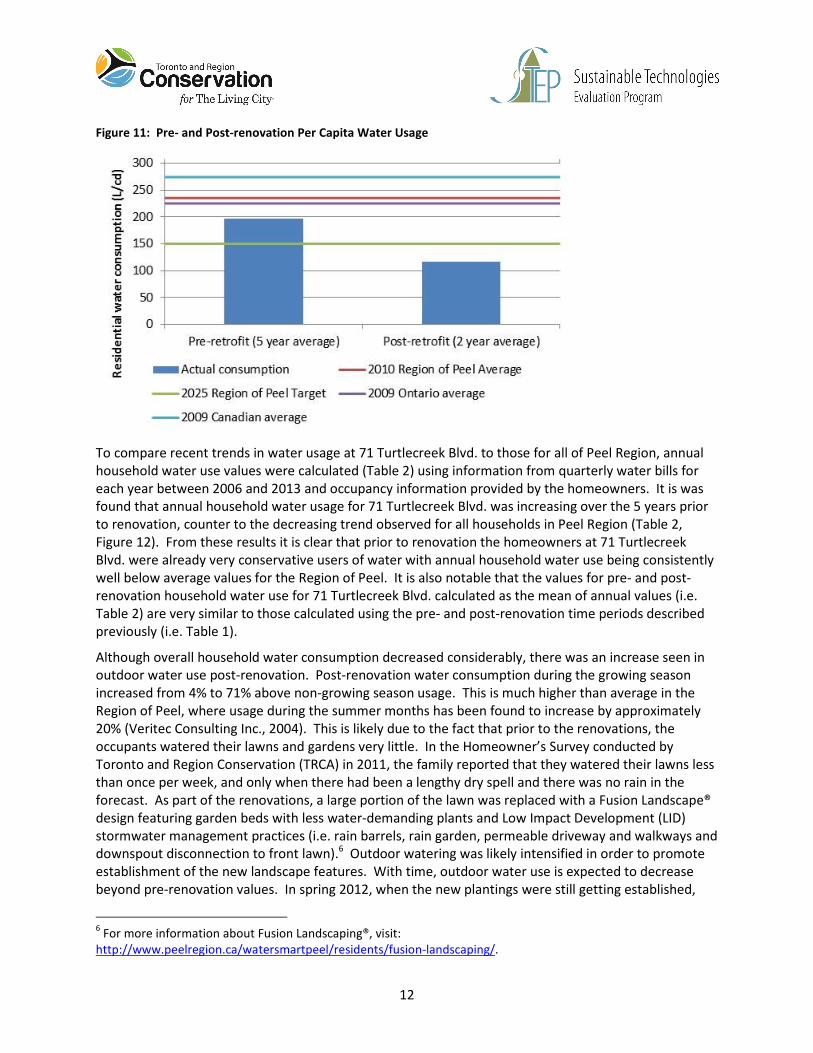
In the five year period just prior to the renovations, average household water use (both indoor and
outdoor uses combined) was 196 L/cd, which is well below average use in the Region of Peel (244 L/cd),
Ontario (225 L/cd), and Canada (274 L/cd) (Environment Canada, 2011 and Region of Peel, 2014) but
31% above the Region of Peel Water Efficiency Strategy target of an average of 150 L/cd by 2025
(Region of Peel, 2012). Post-renovation water use declined 41% to an average of 116 L/cd which is 23%
below the Region of Peel 2025 target. Water consumption decreased by 65% in the non-growing season
and by 43% in the growing season.
11
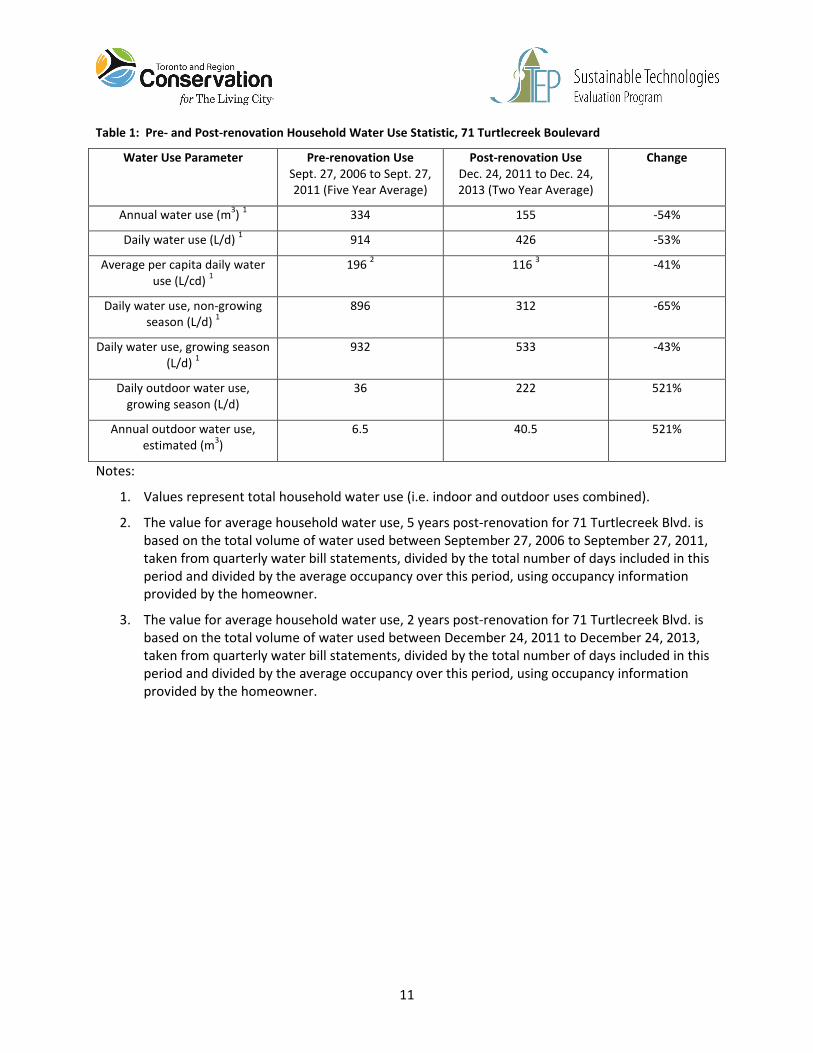
Table 1: Pre- and Post-renovation Household Water Use Statistic, 71 Turtlecreek Boulevard
Water Use Parameter Pre-renovation Use
Sept. 27, 2006 to Sept. 27,
2011 (Five Year Average)
Post-renovation Use
Dec. 24, 2011 to Dec. 24,
2013 (Two Year Average)
Change
Annual water use (m3)
1 334 155 -54%
Daily water use (L/d) 1
914 426 -53%
Average per capita daily water
use (L/cd) 1
196 2
116 3
-41%
Daily water use, non-growing
season (L/d) 1
896 312 -65%
Daily water use, growing season
(L/d) 1
932 533 -43%
Daily outdoor water use,
growing season (L/d)
36 222 521%
Annual outdoor water use,
estimated (m3)
6.5 40.5 521%
Notes:
1. Values represent total household water use (i.e. indoor and outdoor uses combined).
2. The value for average household water use, 5 years post-renovation for 71 Turtlecreek Blvd. is
based on the total volume of water used between September 27, 2006 to September 27, 2011,
taken from quarterly water bill statements, divided by the total number of days included in this
period and divided by the average occupancy over this period, using occupancy information
provided by the homeowner.
3. The value for average household water use, 2 years post-renovation for 71 Turtlecreek Blvd. is
based on the total volume of water used between December 24, 2011 to December 24, 2013,
taken from quarterly water bill statements, divided by the total number of days included in this
period and divided by the average occupancy over this period, using occupancy information
provided by the homeowner.
12
Figure 11: Pre- and Post-renovation Per Capita Water Usage
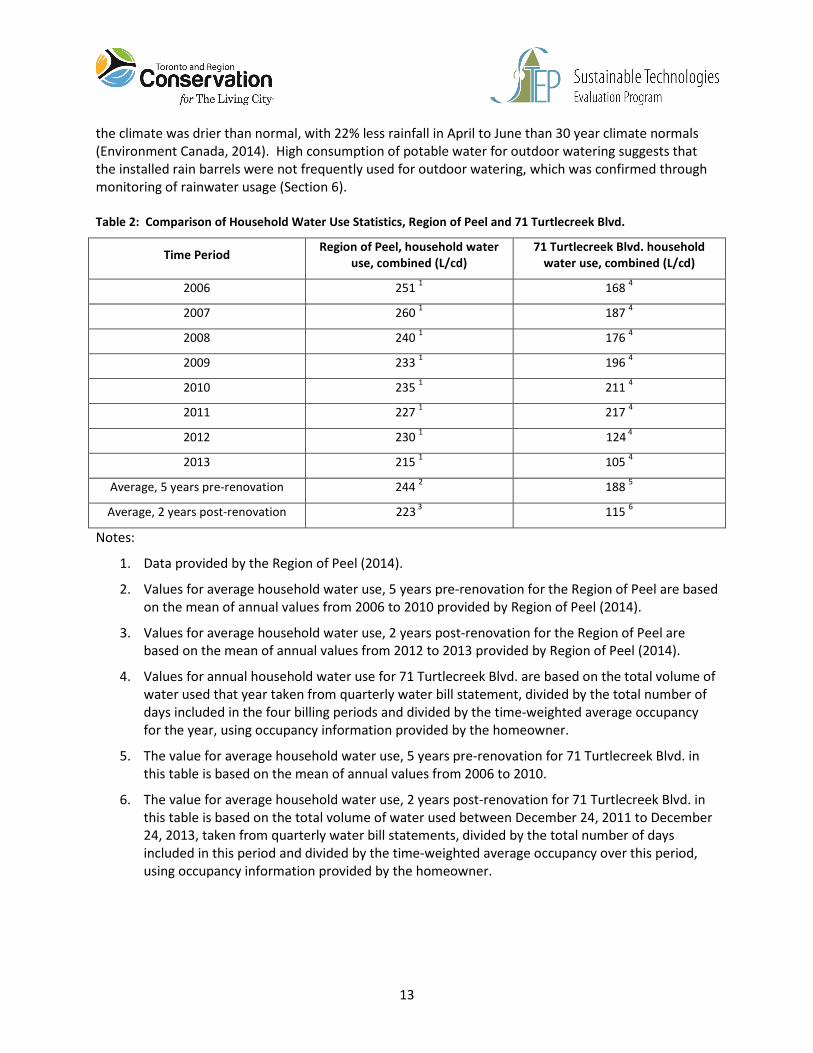
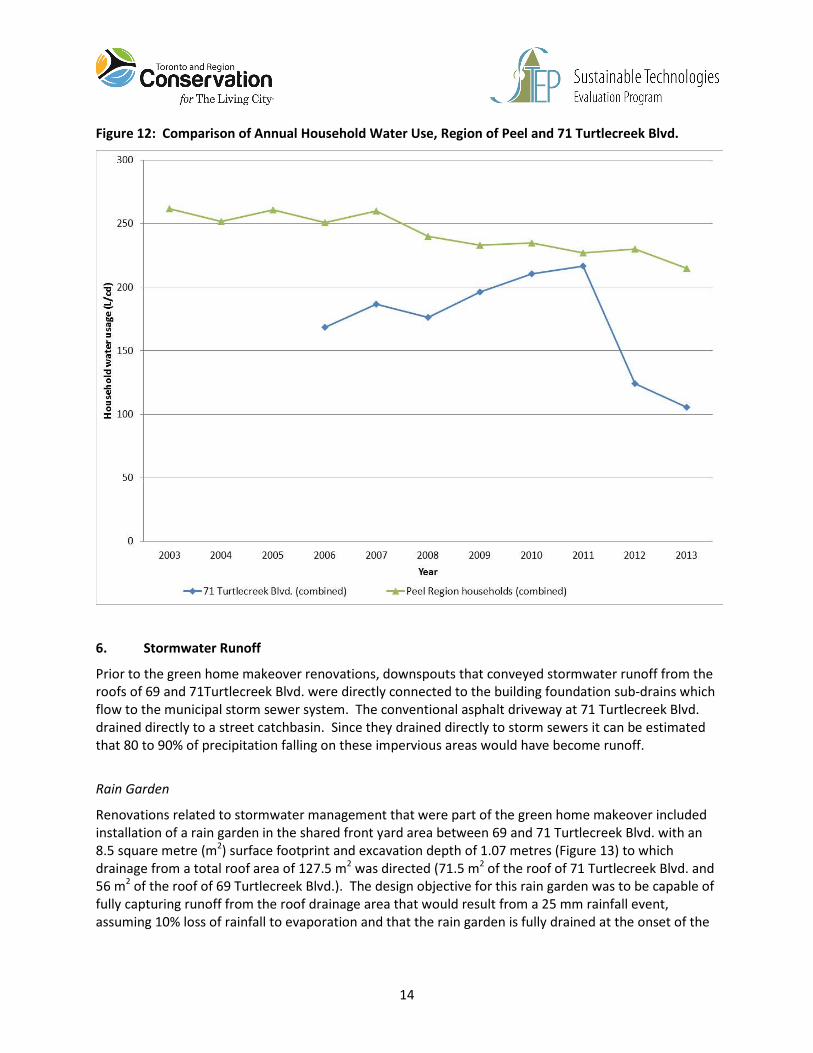
To compare recent trends in water usage at 71 Turtlecreek Blvd. to those for all of Peel Region, annual
household water use values were calculated (Table 2) using information from quarterly water bills for
each year between 2006 and 2013 and occupancy information provided by the homeowners. It is was
found that annual household water usage for 71 Turtlecreek Blvd. was increasing over the 5 years prior
to renovation, counter to the decreasing trend observed for all households in Peel Region (Table 2,
Figure 12). From these results it is clear that prior to renovation the homeowners at 71 Turtlecreek
Blvd. were already very conservative users of water with annual household water use being consistently
well below average values for the Region of Peel. It is also notable that the values for pre- and post-
renovation household water use for 71 Turtlecreek Blvd. calculated as the mean of annual values (i.e.
Table 2) are very similar to those calculated using the pre- and post-renovation time periods described
previously (i.e. Table 1).
Although overall household water consumption decreased considerably, there was an increase seen in
outdoor water use post-renovation. Post-renovation water consumption during the growing season
increased from 4% to 71% above non-growing season usage. This is much higher than average in the
Region of Peel, where usage during the summer months has been found to increase by approximately
20% (Veritec Consulting Inc., 2004). This is likely due to the fact that prior to the renovations, the
occupants watered their lawns and gardens very little. In the Homeowner’s Survey conducted by
Toronto and Region Conservation (TRCA) in 2011, the family reported that they watered their lawns less
than once per week, and only when there had been a lengthy dry spell and there was no rain in the
forecast. As part of the renovations, a large portion of the lawn was replaced with a Fusion Landscape®
design featuring garden beds with less water-demanding plants and Low Impact Development (LID)
stormwater management practices (i.e. rain barrels, rain garden, permeable driveway and walkways and
downspout disconnection to front lawn).6 Outdoor watering was likely intensified in order to promote
establishment of the new landscape features. With time, outdoor water use is expected to decrease
beyond pre-renovation values. In spring 2012, when the new plantings were still getting established,
6 For more information about Fusion Landscaping®, visit:
http://www.peelregion.ca/watersmartpeel/residents/fusion-landscaping/.
13
the climate was drier than normal, with 22% less rainfall in April to June than 30 year climate normals
(Environment Canada, 2014). High consumption of potable water for outdoor watering suggests that
the installed rain barrels were not frequently used for outdoor watering, which was confirmed through
monitoring of rainwater usage (Section 6).
Table 2: Comparison of Household Water Use Statistics, Region of Peel and 71 Turtlecreek Blvd.
Time Period Region of Peel, household water
use, combined (L/cd)
71 Turtlecreek Blvd. household
water use, combined (L/cd)
2006 251 1
168 4
2007 260 1
187 4
2008 240 1
176 4
2009 233 1
196 4
2010 235 1
211 4
2011 227 1
217 4
2012 230 1
124 4
2013 215 1
105 4
Average, 5 years pre-renovation
244 2
188 5
Average, 2 years post-renovation
223 3
115 6
Notes:
1. Data provided by the Region of Peel (2014).
2. Values for average household water use, 5 years pre-renovation for the Region of Peel are based
on the mean of annual values from 2006 to 2010 provided by Region of Peel (2014).
3. Values for average household water use, 2 years post-renovation for the Region of Peel are
based on the mean of annual values from 2012 to 2013 provided by Region of Peel (2014).
4. Values for annual household water use for 71 Turtlecreek Blvd. are based on the total volume of
water used that year taken from quarterly water bill statement, divided by the total number of
days included in the four billing periods and divided by the time-weighted average occupancy
for the year, using occupancy information provided by the homeowner.
5. The value for average household water use, 5 years pre-renovation for 71 Turtlecreek Blvd. in
this table is based on the mean of annual values from 2006 to 2010.
6. The value for average household water use, 2 years post-renovation for 71 Turtlecreek Blvd. in
this table is based on the total volume of water used between December 24, 2011 to December
24, 2013, taken from quarterly water bill statements, divided by the total number of days
included in this period and divided by the time-weighted average occupancy over this period,
using occupancy information provided by the homeowner.
14
Figure 12: Comparison of Annual Household Water Use, Region of Peel and 71 Turtlecreek Blvd.
6. Stormwater Runoff
Prior to the green home makeover renovations, downspouts that conveyed stormwater runoff from the
roofs of 69 and 71Turtlecreek Blvd. were directly connected to the building foundation sub-drains which
flow to the municipal storm sewer system. The conventional asphalt driveway at 71 Turtlecreek Blvd.
drained directly to a street catchbasin. Since they drained directly to storm sewers it can be estimated
that 80 to 90% of precipitation falling on these impervious areas would have become runoff.
Rain Garden
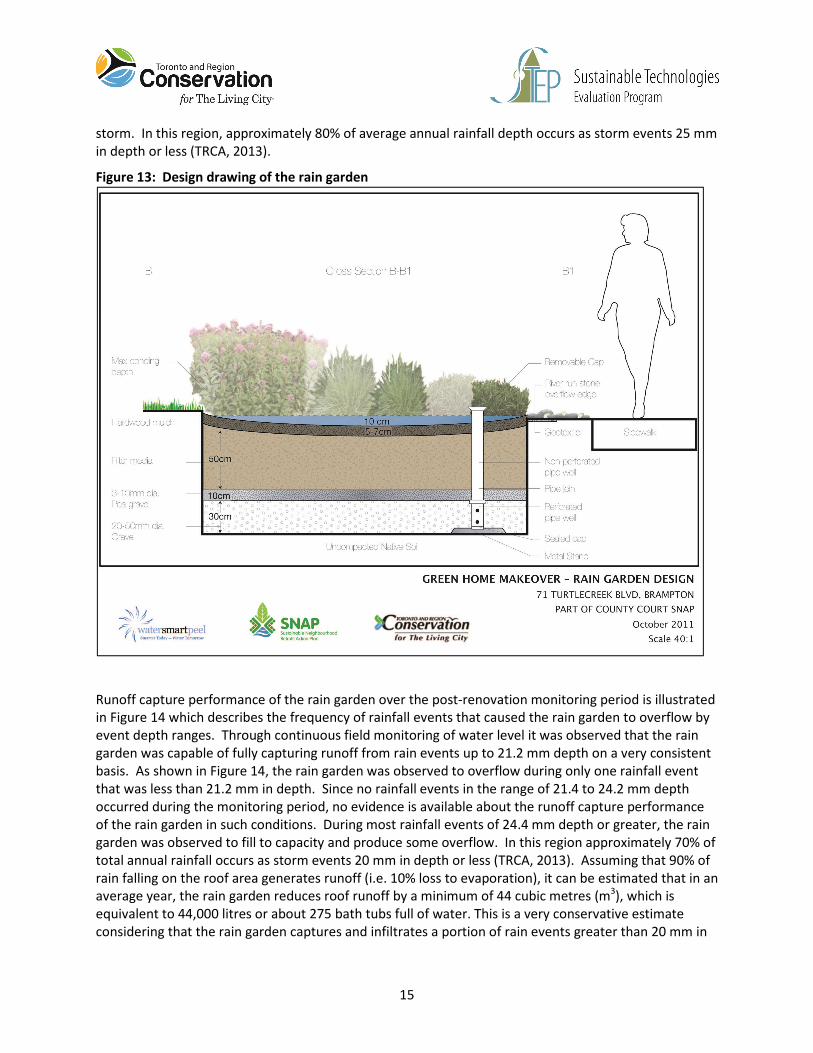
Renovations related to stormwater management that were part of the green home makeover included
installation of a rain garden in the shared front yard area between 69 and 71 Turtlecreek Blvd. with an
8.5 square metre (m2) surface footprint and excavation depth of 1.07 metres (Figure 13) to which
drainage from a total roof area of 127.5 m2 was directed (71.5 m2 of the roof of 71 Turtlecreek Blvd. and
56 m2 of the roof of 69 Turtlecreek Blvd.). The design objective for this rain garden was to be capable of
fully capturing runoff from the roof drainage area that would result from a 25 mm rainfall event,
assuming 10% loss of rainfall to evaporation and that the rain garden is fully drained at the onset of the
15
storm. In this region, approximately 80% of average annual rainfall depth occurs as storm events 25 mm
in depth or less (TRCA, 2013).
Figure 13: Design drawing of the rain garden
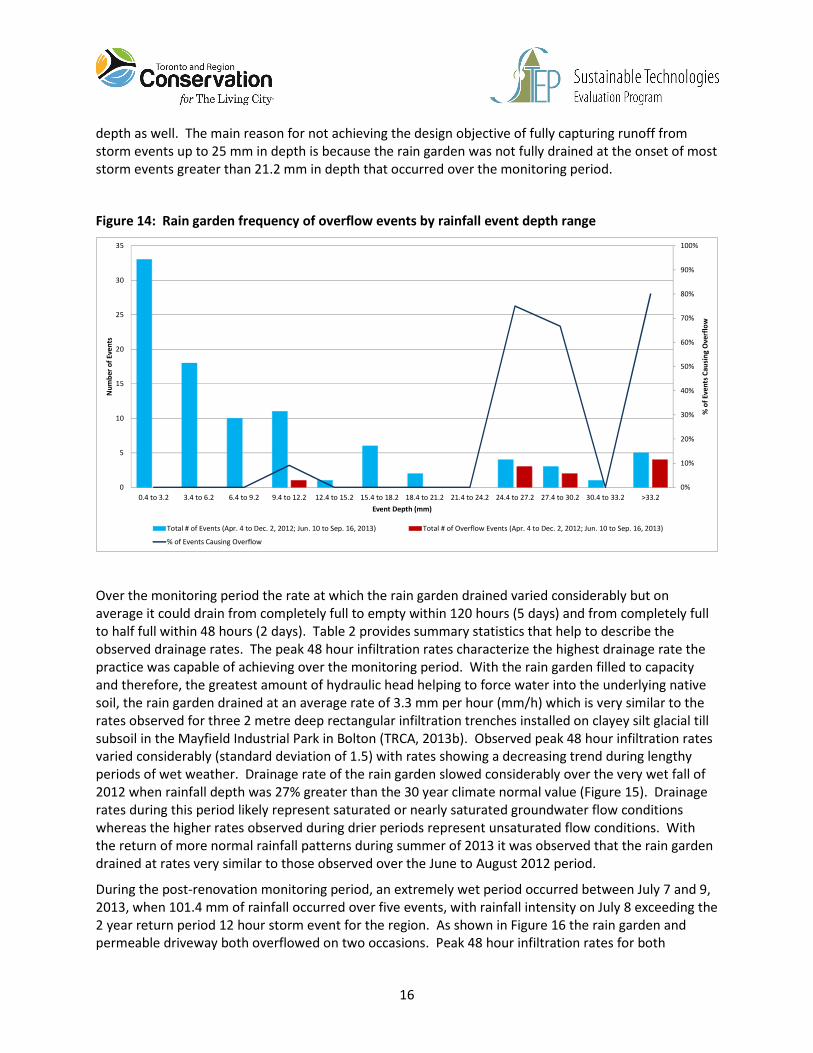
Runoff capture performance of the rain garden over the post-renovation monitoring period is illustrated
in Figure 14 which describes the frequency of rainfall events that caused the rain garden to overflow by
event depth ranges. Through continuous field monitoring of water level it was observed that the rain
garden was capable of fully capturing runoff from rain events up to 21.2 mm depth on a very consistent
basis. As shown in Figure 14, the rain garden was observed to overflow during only one rainfall event
that was less than 21.2 mm in depth. Since no rainfall events in the range of 21.4 to 24.2 mm depth
occurred during the monitoring period, no evidence is available about the runoff capture performance
of the rain garden in such conditions. During most rainfall events of 24.4 mm depth or greater, the rain
garden was observed to fill to capacity and produce some overflow. In this region approximately 70% of
total annual rainfall occurs as storm events 20 mm in depth or less (TRCA, 2013). Assuming that 90% of
rain falling on the roof area generates runoff (i.e. 10% loss to evaporation), it can be estimated that in an
average year, the rain garden reduces roof runoff by a minimum of 44 cubic metres (m3), which is
equivalent to 44,000 litres or about 275 bath tubs full of water. This is a very conservative estimate
considering that the rain garden captures and infiltrates a portion of rain events greater than 20 mm in
16
depth as well. The main reason for not achieving the design objective of fully capturing runoff from
storm events up to 25 mm in depth is because the rain garden was not fully drained at the onset of most
storm events greater than 21.2 mm in depth that occurred over the monitoring period.
Figure 14: Rain garden frequency of overflow events by rainfall event depth range
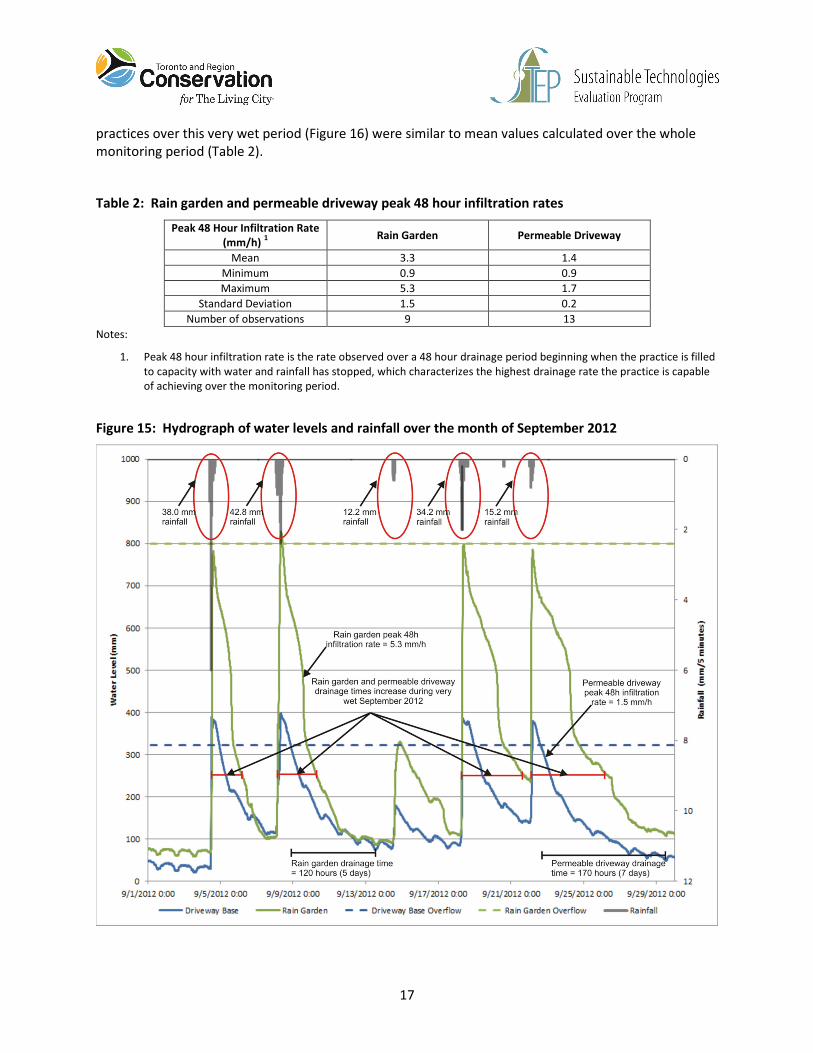
Over the monitoring period the rate at which the rain garden drained varied considerably but on
average it could drain from completely full to empty within 120 hours (5 days) and from completely full
to half full within 48 hours (2 days). Table 2 provides summary statistics that help to describe the
observed drainage rates. The peak 48 hour infiltration rates characterize the highest drainage rate the
practice was capable of achieving over the monitoring period. With the rain garden filled to capacity
and therefore, the greatest amount of hydraulic head helping to force water into the underlying native
soil, the rain garden drained at an average rate of 3.3 mm per hour (mm/h) which is very similar to the
rates observed for three 2 metre deep rectangular infiltration trenches installed on clayey silt glacial till
subsoil in the Mayfield Industrial Park in Bolton (TRCA, 2013b). Observed peak 48 hour infiltration rates
varied considerably (standard deviation of 1.5) with rates showing a decreasing trend during lengthy
periods of wet weather. Drainage rate of the rain garden slowed considerably over the very wet fall of
2012 when rainfall depth was 27% greater than the 30 year climate normal value (Figure 15). Drainage
rates during this period likely represent saturated or nearly saturated groundwater flow conditions
whereas the higher rates observed during drier periods represent unsaturated flow conditions. With
the return of more normal rainfall patterns during summer of 2013 it was observed that the rain garden
drained at rates very similar to those observed over the June to August 2012 period.
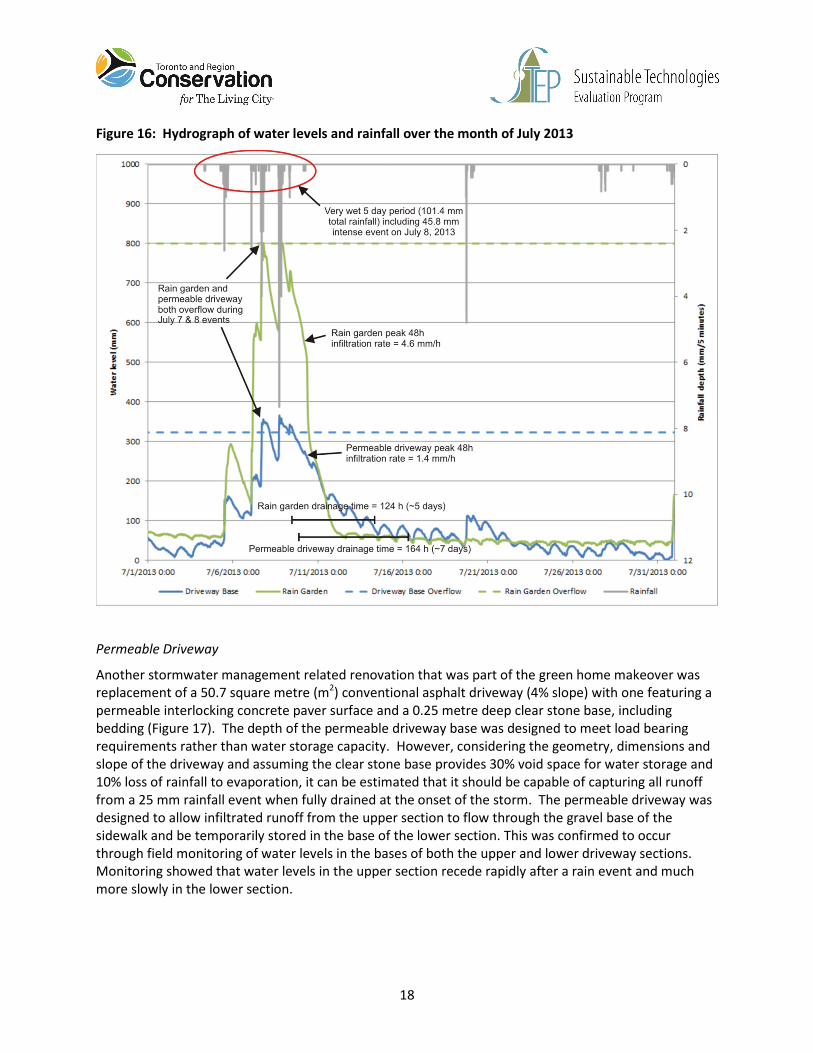
During the post-renovation monitoring period, an extremely wet period occurred between July 7 and 9,
2013, when 101.4 mm of rainfall occurred over five events, with rainfall intensity on July 8 exceeding the
2 year return period 12 hour storm event for the region. As shown in Figure 16 the rain garden and
permeable driveway both overflowed on two occasions. Peak 48 hour infiltration rates for both
0%
10%
20%
30%
40%
50%
60%
70%
80%
90%
100%
0
5
10
15
20
25
30
35
0.4 to 3.2 3.4 to 6.2 6.4 to 9.2 9.4 to 12.2 12.4 to 15.2 15.4 to 18.2 18.4 to 21.2 21.4 to 24.2 24.4 to 27.2 27.4 to 30.2 30.4 to 33.2 >33.2
% o
f E
ve
nts
Ca
usi
ng
Ov
erf
low
Nu
mb
er
of
Eve
nts
Event Depth (mm)
Total # of Events (Apr. 4 to Dec. 2, 2012; Jun. 10 to Sep. 16, 2013) Total # of Overflow Events (Apr. 4 to Dec. 2, 2012; Jun. 10 to Sep. 16, 2013)
% of Events Causing Overflow
17
practices over this very wet period (Figure 16) were similar to mean values calculated over the whole
monitoring period (Table 2).
Table 2: Rain garden and permeable driveway peak 48 hour infiltration rates
Peak 48 Hour Infiltration Rate
(mm/h) 1
Rain Garden Permeable Driveway
Mean 3.3 1.4
Minimum 0.9 0.9
Maximum 5.3 1.7
Standard Deviation 1.5 0.2
Number of observations 9 13
Notes:
1. Peak 48 hour infiltration rate is the rate observed over a 48 hour drainage period beginning when the practice is filled
to capacity with water and rainfall has stopped, which characterizes the highest drainage rate the practice is capable
of achieving over the monitoring period.
Figure 15: Hydrograph of water levels and rainfall over the month of September 2012
18
Figure 16: Hydrograph of water levels and rainfall over the month of July 2013
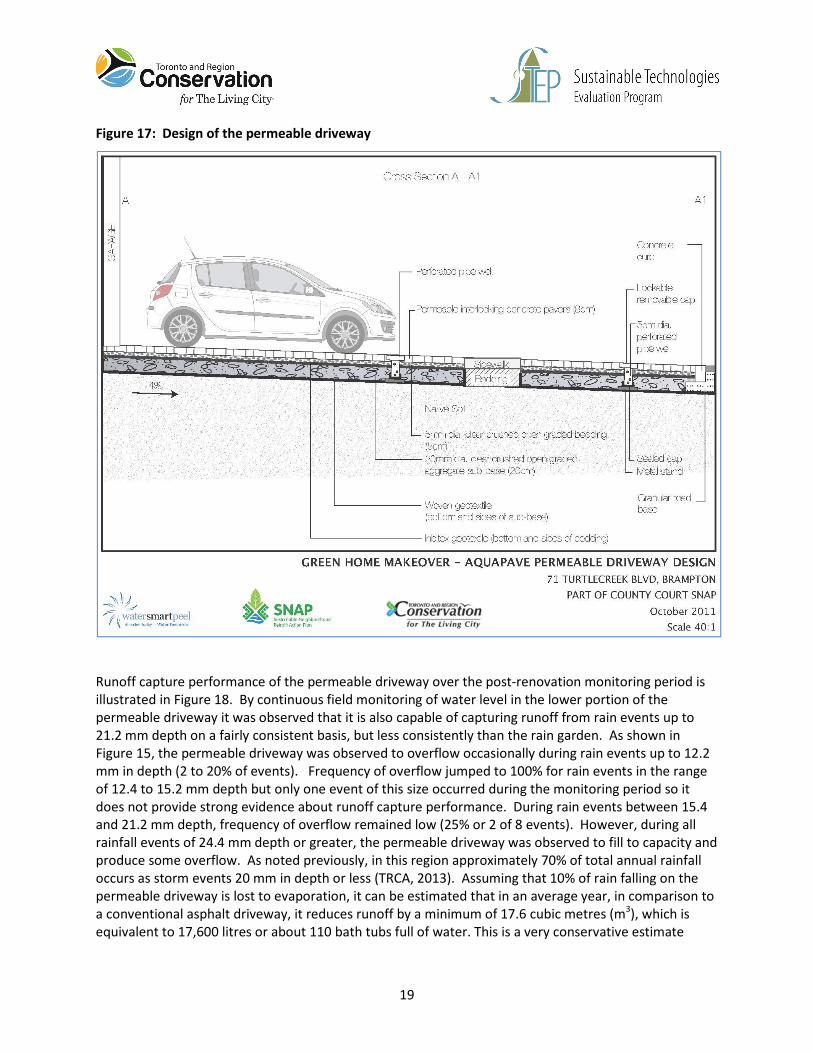
Permeable Driveway
Another stormwater management related renovation that was part of the green home makeover was
replacement of a 50.7 square metre (m2) conventional asphalt driveway (4% slope) with one featuring a
permeable interlocking concrete paver surface and a 0.25 metre deep clear stone base, including
bedding (Figure 17). The depth of the permeable driveway base was designed to meet load bearing
requirements rather than water storage capacity. However, considering the geometry, dimensions and
slope of the driveway and assuming the clear stone base provides 30% void space for water storage and
10% loss of rainfall to evaporation, it can be estimated that it should be capable of capturing all runoff
from a 25 mm rainfall event when fully drained at the onset of the storm. The permeable driveway was
designed to allow infiltrated runoff from the upper section to flow through the gravel base of the
sidewalk and be temporarily stored in the base of the lower section. This was confirmed to occur
through field monitoring of water levels in the bases of both the upper and lower driveway sections.
Monitoring showed that water levels in the upper section recede rapidly after a rain event and much
more slowly in the lower section.
19
Figure 17: Design of the permeable driveway
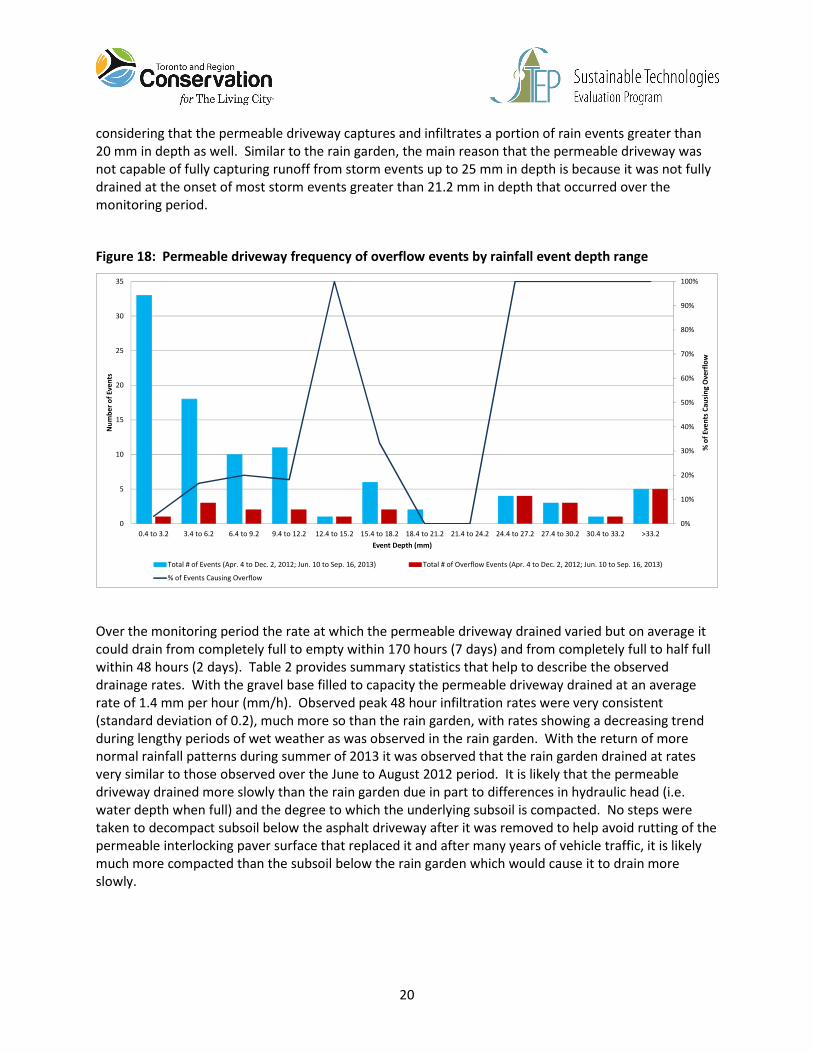
Runoff capture performance of the permeable driveway over the post-renovation monitoring period is
illustrated in Figure 18. By continuous field monitoring of water level in the lower portion of the
permeable driveway it was observed that it is also capable of capturing runoff from rain events up to
21.2 mm depth on a fairly consistent basis, but less consistently than the rain garden. As shown in
Figure 15, the permeable driveway was observed to overflow occasionally during rain events up to 12.2
mm in depth (2 to 20% of events). Frequency of overflow jumped to 100% for rain events in the range
of 12.4 to 15.2 mm depth but only one event of this size occurred during the monitoring period so it
does not provide strong evidence about runoff capture performance. During rain events between 15.4
and 21.2 mm depth, frequency of overflow remained low (25% or 2 of 8 events). However, during all
rainfall events of 24.4 mm depth or greater, the permeable driveway was observed to fill to capacity and
produce some overflow. As noted previously, in this region approximately 70% of total annual rainfall
occurs as storm events 20 mm in depth or less (TRCA, 2013). Assuming that 10% of rain falling on the
permeable driveway is lost to evaporation, it can be estimated that in an average year, in comparison to
a conventional asphalt driveway, it reduces runoff by a minimum of 17.6 cubic metres (m3), which is
equivalent to 17,600 litres or about 110 bath tubs full of water. This is a very conservative estimate
20
considering that the permeable driveway captures and infiltrates a portion of rain events greater than
20 mm in depth as well. Similar to the rain garden, the main reason that the permeable driveway was
not capable of fully capturing runoff from storm events up to 25 mm in depth is because it was not fully
drained at the onset of most storm events greater than 21.2 mm in depth that occurred over the
monitoring period.
Figure 18: Permeable driveway frequency of overflow events by rainfall event depth range
Over the monitoring period the rate at which the permeable driveway drained varied but on average it
could drain from completely full to empty within 170 hours (7 days) and from completely full to half full
within 48 hours (2 days). Table 2 provides summary statistics that help to describe the observed
drainage rates. With the gravel base filled to capacity the permeable driveway drained at an average
rate of 1.4 mm per hour (mm/h). Observed peak 48 hour infiltration rates were very consistent
(standard deviation of 0.2), much more so than the rain garden, with rates showing a decreasing trend
during lengthy periods of wet weather as was observed in the rain garden. With the return of more
normal rainfall patterns during summer of 2013 it was observed that the rain garden drained at rates
very similar to those observed over the June to August 2012 period. It is likely that the permeable
driveway drained more slowly than the rain garden due in part to differences in hydraulic head (i.e.
water depth when full) and the degree to which the underlying subsoil is compacted. No steps were
taken to decompact subsoil below the asphalt driveway after it was removed to help avoid rutting of the
permeable interlocking paver surface that replaced it and after many years of vehicle traffic, it is likely
much more compacted than the subsoil below the rain garden which would cause it to drain more
slowly.
0%
10%
20%
30%
40%
50%
60%
70%
80%
90%
100%
0
5
10
15
20
25
30
35
0.4 to 3.2 3.4 to 6.2 6.4 to 9.2 9.4 to 12.2 12.4 to 15.2 15.4 to 18.2 18.4 to 21.2 21.4 to 24.2 24.4 to 27.2 27.4 to 30.2 30.4 to 33.2 >33.2
% o
f E
ven
ts C
au
sin
g O
ve
rflo
w
Nu
mb
er
of
Ev
en
ts
Event Depth (mm)
Total # of Events (Apr. 4 to Dec. 2, 2012; Jun. 10 to Sep. 16, 2013) Total # of Overflow Events (Apr. 4 to Dec. 2, 2012; Jun. 10 to Sep. 16, 2013)
% of Events Causing Overflow
21
7. Rainwater Use
A total of only 2.3 m3 of rainwater was used over the monitoring period, indicating that the rain barrels
were rarely drained between storm events and mainly used to occasionally fill watering cans. Assuming
a water utility rate of $9.6724 per 10 m3 (Region of Peel, 2013), a total of $2.22 in water utility bill saving
was achieved over the monitoring period. Comparisons of water use during growing and non-growing
seasons over the post-renovation period indicate that the homeowners used a considerable amount of
water for outdoor uses. This high water usage can be associated with the initial need to water their
newly established Fusion Landscape® garden. However, from these results it is clear that they most
often chose to use municipal water for outdoor purposes rather than rainwater, likely out of
convenience and the time required to fill watering cans. In a post-renovation interview with the
homeowners, they noted that they watered the newly planted garden beds more to ensure it became
well established and that the rain barrels did not provide adequate water pressure nor quantity to do a
deep soaking of the beds. It is postulated that if a means of using rainwater from the barrels that was
more convenient than use of a hose with gravity fed flow or filling watering cans had been put in place
(e.g. soaker hose draining to the garden or lawn, submersible pump and pressure sprayer) more
rainwater may have been used, resulting in greater water utility bill savings.
8. Discussion
Climate
Household energy and water consumption are affected by climate, and therefore must be understood
within the context of factors such as air temperature and precipitation. Natural gas is primarily
consumed during the fall and winter for space and water heating. In both the pre- and post-renovation
periods, mean temperature during the fall and winter remained within 1°C of the 30 year climate normal
values based on historical climate data collected at the Lester B. Pearson International Airport by
Environment Canada (Table 3). This suggests that the reduction in natural gas usage observed here
provides a reasonable estimation of long term savings.
During the post-renovation period, mean temperature was 1.9°C warmer in the spring than the 30 year
climate normal. This likely caused electricity consumption to increase in order to meet space cooling
needs. Higher than average electricity use during the post-renovation period would reduce calculated
electricity savings. In the long term, slightly greater savings in electricity use may be achieved than were
observed through this evaluation.
Outdoor water consumption can be affected by the amount of rainfall received during the growing
season (mid-March to mid-September) because homeowners usually refrain from watering during
periods of wet weather. In the pre-renovation period, total rain was 18% greater than normal during
the spring and 16% greater than normal during the summer. During the post-renovation period, total
rainfall was 29% greater than the climate normal during the summer season. It follows that increases in
outdoor water use during spring were likely overestimated due to the atypically wet spring in the pre-
renovation period. Conversely, increases in outdoor water use during summer were likely
underestimated as the average summer rainfall during the post-renovation period was much greater
than during the pre-renovation period. Without detailed analysis, it is difficult to determine the
cumulative effect of these conditions on overall outdoor water use. Rainfall during the non-growing
season was 18% greater than normal during the winter of the post-renovation period. This was not
considered to have a significant effect on outdoor watering.
22
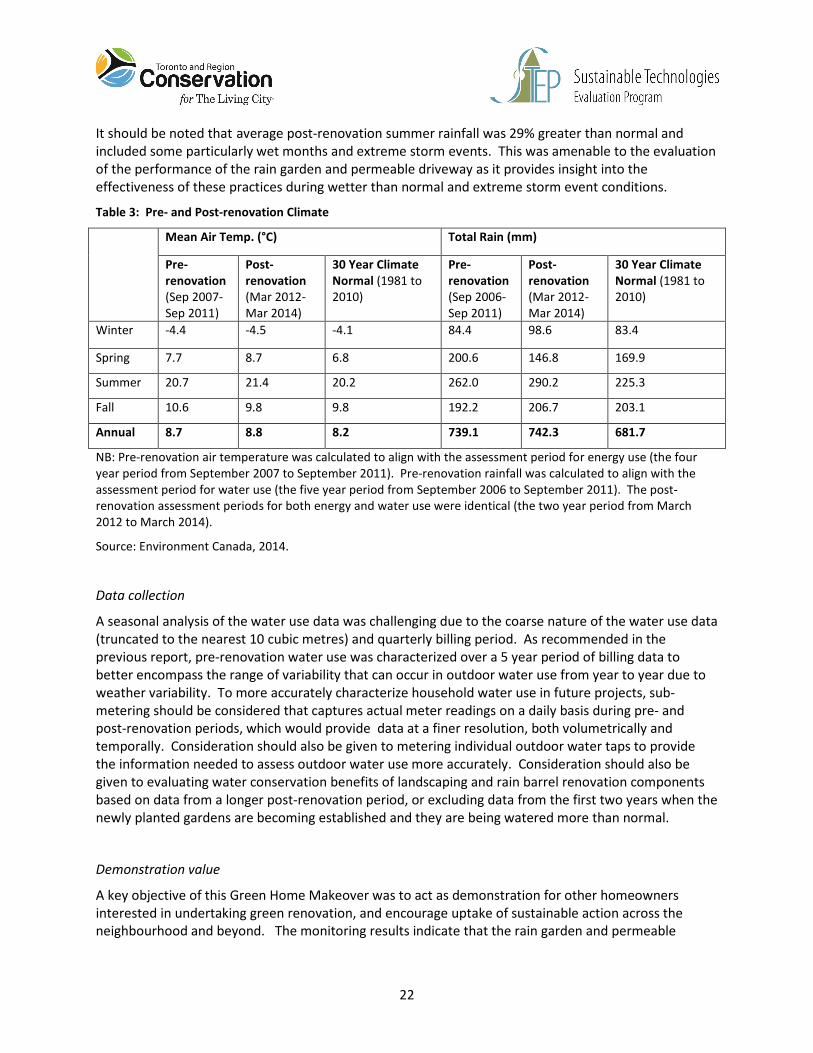
It should be noted that average post-renovation summer rainfall was 29% greater than normal and
included some particularly wet months and extreme storm events. This was amenable to the evaluation
of the performance of the rain garden and permeable driveway as it provides insight into the
effectiveness of these practices during wetter than normal and extreme storm event conditions.
Table 3: Pre- and Post-renovation Climate
Mean Air Temp. (°C) Total Rain (mm)
Pre-
renovation
(Sep 2007-
Sep 2011)
Post-
renovation
(Mar 2012-
Mar 2014)
30 Year Climate
Normal (1981 to
2010)
Pre-
renovation
(Sep 2006-
Sep 2011)
Post-
renovation
(Mar 2012-
Mar 2014)
30 Year Climate
Normal (1981 to
2010)
Winter -4.4 -4.5 -4.1 84.4 98.6 83.4
Spring 7.7 8.7 6.8 200.6 146.8 169.9
Summer 20.7 21.4 20.2 262.0 290.2 225.3
Fall 10.6 9.8 9.8 192.2 206.7 203.1
Annual 8.7 8.8 8.2 739.1 742.3 681.7
NB: Pre-renovation air temperature was calculated to align with the assessment period for energy use (the four
year period from September 2007 to September 2011). Pre-renovation rainfall was calculated to align with the
assessment period for water use (the five year period from September 2006 to September 2011). The post-
renovation assessment periods for both energy and water use were identical (the two year period from March
2012 to March 2014).
Source: Environment Canada, 2014.
Data collection
A seasonal analysis of the water use data was challenging due to the coarse nature of the water use data
(truncated to the nearest 10 cubic metres) and quarterly billing period. As recommended in the
previous report, pre-renovation water use was characterized over a 5 year period of billing data to
better encompass the range of variability that can occur in outdoor water use from year to year due to
weather variability. To more accurately characterize household water use in future projects, sub-
metering should be considered that captures actual meter readings on a daily basis during pre- and
post-renovation periods, which would provide data at a finer resolution, both volumetrically and
temporally. Consideration should also be given to metering individual outdoor water taps to provide
the information needed to assess outdoor water use more accurately. Consideration should also be
given to evaluating water conservation benefits of landscaping and rain barrel renovation components
based on data from a longer post-renovation period, or excluding data from the first two years when the
newly planted gardens are becoming established and they are being watered more than normal.
Demonstration value
A key objective of this Green Home Makeover was to act as demonstration for other homeowners
interested in undertaking green renovation, and encourage uptake of sustainable action across the
neighbourhood and beyond. The monitoring results indicate that the rain garden and permeable

23
driveway are both performing well, which suggests that it would be beneficial from a stormwater
management perspective to promote similar renovations across the neighbourhood. However, the cost
to construct these best management practices (see Appendix A) is likely a factor that may be limiting the
number of homeowners willing to implement them. To help lower the construction cost and effort
involved, rain gardens shallower than the 1 metre deep one implemented at 71 Turtlecreek Blvd. could
be promoted, albeit with lower rainfall capture performance and more frequent occurrence of overflow.
Based on the results from monitoring rainwater use, the likelihood of achieving substantial water
conservation benefits from just providing homeowners with a rain barrel alone, without highly
convenient means of using the harvested rainwater (e.g. submersible pump and pressure sprayer;
soaker hose attachment) or automated means of draining them during dry periods between storms, is
low. Consideration should be given to including soaker hose attachments as part of rain barrel
giveaways and combining with rebates on submersible pumps or smart irrigation system controls that
link to internet-based weather forecasts and can trigger a rain barrel to drain prior to onset of the next
storm (e.g. RainGrid).
9. References
Environment Canada. 2014. National Climate Data and Information Archive.
http://climate.weatheroffice.gc.ca/Welcome_e.html. Accessed April 15, 2014.
Environment Canada. 2014. National Climate Data, Lester B. Pearson International Airport Climate
Station. April 16, 2014.
Environment Canada. 2011. 2011 Municipal Water Use Report: Municipal Water Use 2009 Statistics.
Online document: http://www.ec.gc.ca/Publications/B77CE4D0-80D4-4FEB-AFFA-0201BE6FB37B/2011-
Municipal-Water-Use-Report-2009-Stats_Eng.pdf. Accessed May 15, 2014.
Region of Peel. 2012. Water Efficiency Strategy Update: July 2012. Online document:
http://www.peelregion.ca/watersmartpeel/pdfs/2012-Water-Efficiency-Strategy.pdf. Accessed June 25,
2014.
Region of Peel, 2013. Water utility rates. Online document:
http://www.peelregion.ca/pw/water/rates/waterbills/yourbill/rates.htm. Accessed June 25, 2014.
Region of Peel. 2014. Unpublished data on household per capita water usage, 2006 to 2010.
Statistics Canada. 2011. Households and the Environment: Energy Use. Online document:
http://www.statcan.gc.ca/pub/11-526-s/11-526-s2013002-eng.pdf. Accessed May 15, 2014.
Toronto and Region Conservation Authority (TRCA), 2012a. Sustainable Neighbourhood Retrofit Action
Plan (SNAP) County Court - 71 Turtlecreek Blvd. Green Home Makeover Pre-renovation Energy and
Water Use. Toronto, Ontario.

24
Toronto and Region Conservation Authority (TRCA), 2013a. Historical rainfall depth analysis from four
Environment Canada climate stations in the Greater Toronto Area. Unpublished data.
Toronto and Region Conservation Authority (TRCA), 2013b. Evaluation of the Effectiveness of
Underground Stormwater Infiltration Systems. Prepared by the Sustainable Technologies Evaluation
Program (STEP). http://sustainabletechnologies.ca/wp/home/urban-runoff-green-infrastructure/low-
impact-development/soakaways-infiltration-trenches-and-chambers/evaluation-of-underground-
stormwater-infiltration-systems/.
Veritec Consulting Inc. 2004. Regional Municipality of Peel Water Efficiency Plan: Final Report. Online
document: http://www.peelregion.ca/watersmartpeel/pdfs/wep-final-report-2004.pdf. Accessed May
15, 2014.
25
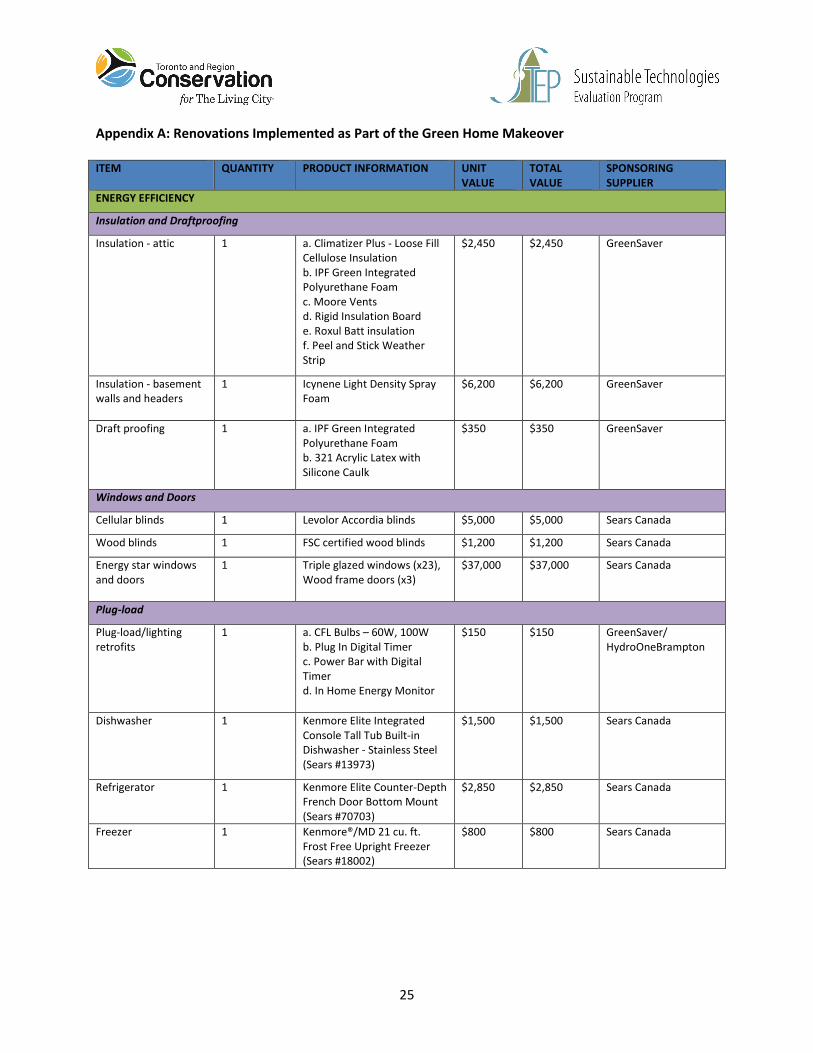
Appendix A: Renovations Implemented as Part of the Green Home Makeover
ITEM QUANTITY PRODUCT INFORMATION UNIT
VALUE
TOTAL
VALUE
SPONSORING
SUPPLIER
ENERGY EFFICIENCY
Insulation and Draftproofing
Insulation - attic 1 a. Climatizer Plus - Loose Fill
Cellulose Insulation
b. IPF Green Integrated
Polyurethane Foam
c. Moore Vents
d. Rigid Insulation Board
e. Roxul Batt insulation
f. Peel and Stick Weather
Strip
$2,450 $2,450 GreenSaver
Insulation - basement
walls and headers
1 Icynene Light Density Spray
Foam
$6,200 $6,200 GreenSaver
Draft proofing 1 a. IPF Green Integrated
Polyurethane Foam
b. 321 Acrylic Latex with
Silicone Caulk
$350 $350 GreenSaver
Windows and Doors
Cellular blinds 1 Levolor Accordia blinds $5,000 $5,000 Sears Canada
Wood blinds 1 FSC certified wood blinds $1,200 $1,200 Sears Canada
Energy star windows
and doors
1 Triple glazed windows (x23),
Wood frame doors (x3)
$37,000 $37,000 Sears Canada
Plug-load
Plug-load/lighting
retrofits
1 a. CFL Bulbs – 60W, 100W
b. Plug In Digital Timer
c. Power Bar with Digital
Timer
d. In Home Energy Monitor
$150 $150 GreenSaver/
HydroOneBrampton
Dishwasher 1 Kenmore Elite Integrated
Console Tall Tub Built-in
Dishwasher - Stainless Steel
(Sears #13973)
$1,500 $1,500 Sears Canada
Refrigerator 1 Kenmore Elite Counter-Depth
French Door Bottom Mount
(Sears #70703)
$2,850 $2,850 Sears Canada
Freezer 1 Kenmore®/MD 21 cu. ft.
Frost Free Upright Freezer
(Sears #18002)
$800 $800 Sears Canada
26
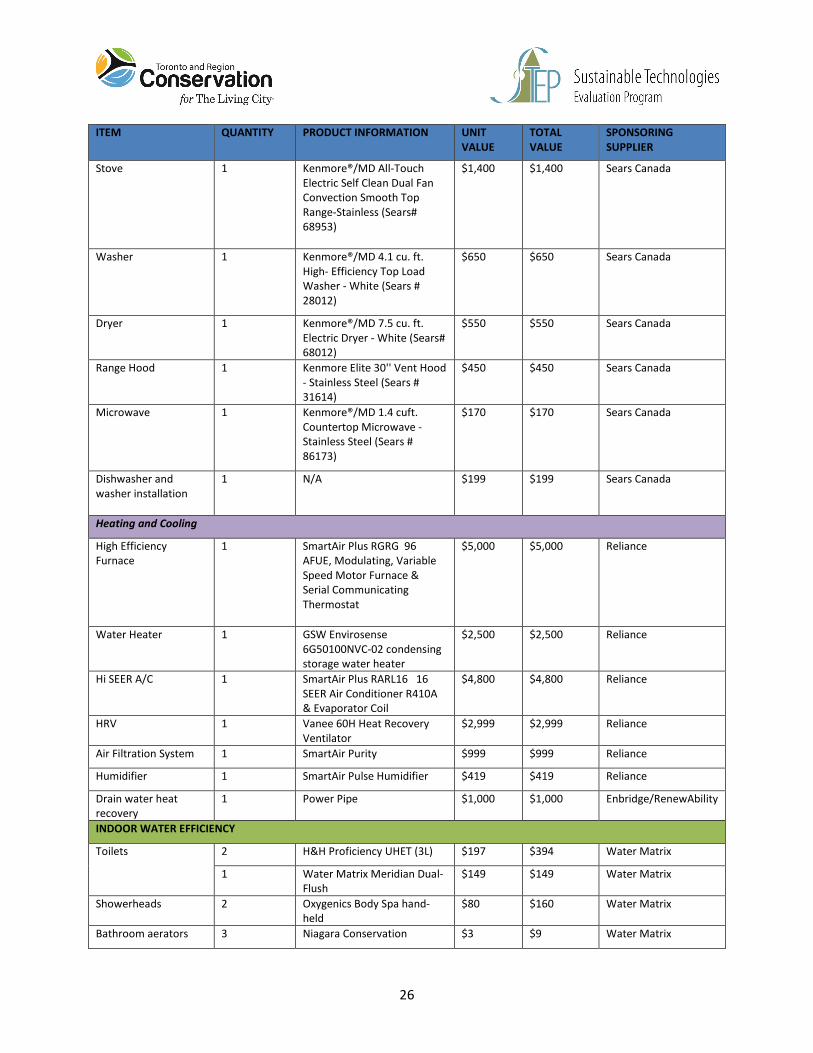
ITEM QUANTITY PRODUCT INFORMATION UNIT
VALUE
TOTAL
VALUE
SPONSORING
SUPPLIER
Stove 1 Kenmore®/MD All-Touch
Electric Self Clean Dual Fan
Convection Smooth Top
Range-Stainless (Sears#
68953)
$1,400 $1,400 Sears Canada
Washer 1 Kenmore®/MD 4.1 cu. ft.
High- Efficiency Top Load
Washer - White (Sears #
28012)
$650 $650 Sears Canada
Dryer 1 Kenmore®/MD 7.5 cu. ft.
Electric Dryer - White (Sears#
68012)
$550 $550 Sears Canada
Range Hood 1 Kenmore Elite 30'' Vent Hood
- Stainless Steel (Sears #
31614)
$450 $450 Sears Canada
Microwave 1 Kenmore®/MD 1.4 cuft.
Countertop Microwave -
Stainless Steel (Sears #
86173)
$170 $170 Sears Canada
Dishwasher and
washer installation
1 N/A $199 $199 Sears Canada
Heating and Cooling
High Efficiency
Furnace
1 SmartAir Plus RGRG 96
AFUE, Modulating, Variable
Speed Motor Furnace &
Serial Communicating
Thermostat
$5,000 $5,000 Reliance
Water Heater 1 GSW Envirosense
6G50100NVC-02 condensing
storage water heater
$2,500 $2,500 Reliance
Hi SEER A/C 1 SmartAir Plus RARL16 16
SEER Air Conditioner R410A
& Evaporator Coil
$4,800 $4,800 Reliance
HRV 1 Vanee 60H Heat Recovery
Ventilator
$2,999 $2,999 Reliance
Air Filtration System 1 SmartAir Purity $999 $999 Reliance
Humidifier 1 SmartAir Pulse Humidifier $419 $419 Reliance
Drain water heat
recovery
1 Power Pipe $1,000 $1,000 Enbridge/RenewAbility
INDOOR WATER EFFICIENCY
Toilets 2 H&H Proficiency UHET (3L) $197 $394 Water Matrix
1 Water Matrix Meridian Dual-
Flush
$149 $149 Water Matrix
Showerheads 2 Oxygenics Body Spa hand-
held
$80 $160 Water Matrix
Bathroom aerators 3 Niagara Conservation $3 $9 Water Matrix
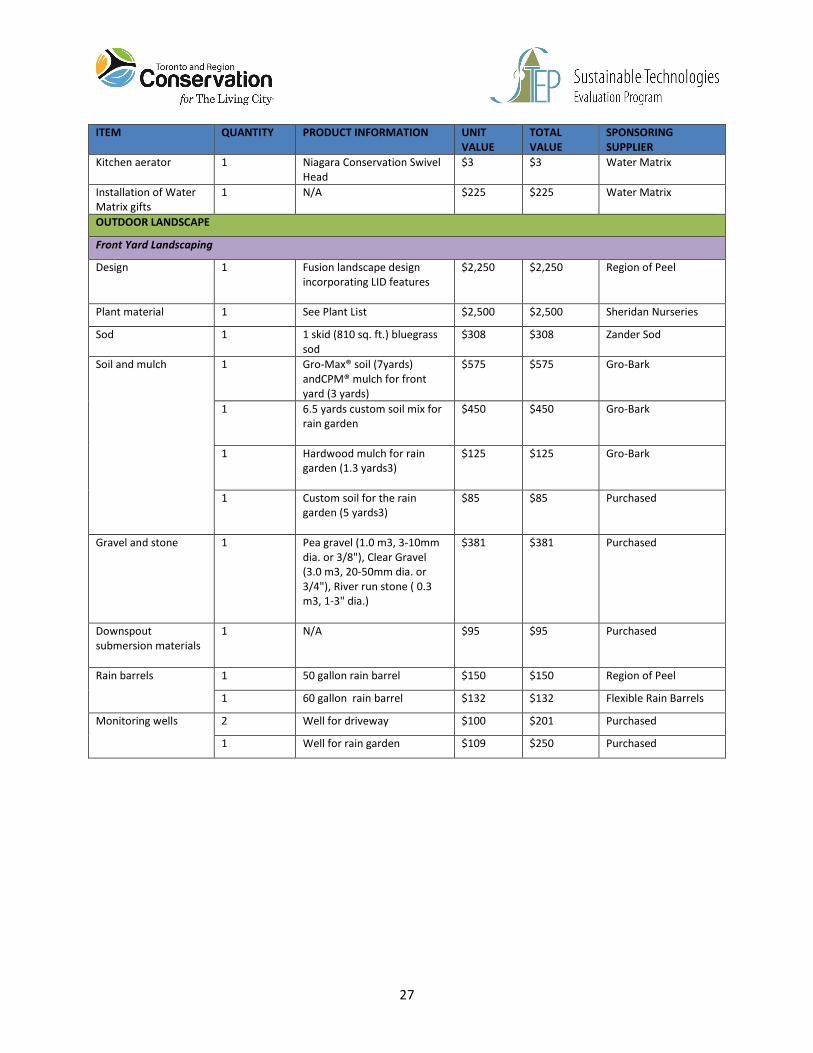
27
ITEM QUANTITY PRODUCT INFORMATION UNIT
VALUE
TOTAL
VALUE
SPONSORING
SUPPLIER
Kitchen aerator 1 Niagara Conservation Swivel
Head
$3 $3 Water Matrix
Installation of Water
Matrix gifts
1 N/A $225 $225 Water Matrix
OUTDOOR LANDSCAPE
Front Yard Landscaping
Design 1 Fusion landscape design
incorporating LID features
$2,250 $2,250 Region of Peel
Plant material 1 See Plant List $2,500 $2,500 Sheridan Nurseries
Sod 1 1 skid (810 sq. ft.) bluegrass
sod
$308 $308 Zander Sod
Soil and mulch 1 Gro-Max® soil (7yards)
andCPM® mulch for front
yard (3 yards)
$575 $575 Gro-Bark
1 6.5 yards custom soil mix for
rain garden
$450 $450 Gro-Bark
1 Hardwood mulch for rain
garden (1.3 yards3)
$125 $125 Gro-Bark
1 Custom soil for the rain
garden (5 yards3)
$85 $85 Purchased
Gravel and stone 1 Pea gravel (1.0 m3, 3-10mm
dia. or 3/8"), Clear Gravel
(3.0 m3, 20-50mm dia. or
3/4"), River run stone ( 0.3
m3, 1-3" dia.)
$381 $381 Purchased
Downspout
submersion materials
1 N/A $95 $95 Purchased
Rain barrels 1 50 gallon rain barrel $150 $150 Region of Peel
1 60 gallon rain barrel $132 $132 Flexible Rain Barrels
Monitoring wells 2 Well for driveway $100 $201 Purchased
1 Well for rain garden $109 $250 Purchased

28
ITEM QUANTITY PRODUCT INFORMATION UNIT
VALUE
TOTAL
VALUE
SPONSORING
SUPPLIER
Driveway and Walkways
Driveway and
malkway materials
1 AquaPave Interlocking Stone,
Joint Stabilizer, Inbetex, AP-
SC1000 Woven GTX, Bedding
Sand, Upper Sub Base
$5,000 $5,000 Hanson Hardscapes
Driveway and
walkway installation
1 Driveway and two walkways $8,500 $8,500 Tassone Landscape
Construction
Poured concrete curb
installation
1 N/A $3,000 $3,000 Purchased
Waste Management
Waste removal,
recycling and disposal
1 Landscape waste removal,
recycling and/or disposal
$10,000 $10,000 1-800-GOT-JUNK
CONSTRUCTION PROJECT MANAGEMENT
General contracting
and project
management
1 Basement wall framing,
home inspection, window
coverings installation, rain
barrel installation (front and
back), building reno permit,
regrading permit, rain garden
materials, 3 downspout
disconnection (garden and
neighbour), painting, fill
around trim.
$16,157 $16,157 Purchased
TOTAL COST $129,735