î&§7«Îm3¢ 1 fÝ9ʸnÛÏ&»x|,Êq¥Íç w ý ~ ¤ æu -...
TRANSCRIPT

The factor structure of the Kouzes and Posner Leadership Practices Inventory (LPI)
revisited in a Norwegian Context
By
Dag Aadne Sandbakken
HWP 0407
Working Paper Series
Henley Management College Greenlands
Henley-on-Thames Oxon RG9 3AU
The opinions and ideas expressed in this paper are those of the author(s) alone. Henley Management College does not necessarily concur with any of the opinions expressed herein. The author(s) invites both comments and discussion from anyone who may read a paper in this series. If you have any suggestions which may be helpful to the author(s), then please write to them, c/o The Editor, at the address shown above. Copyright 2004. All rights reserved. No part of this work may be reproduced without the written permission of the author(s). ISBN 1861811977


1
The construct validity, reliability and factor structure of the Leadership Practices Inventory (Kouzes and
Posner, 1995, 2002) was revisited in a Norwegian context. As part of a doctoral study, 348 Norwegian
leaders were evaluated by their subordinates. The results did not confirm the five-factor structure claimed
by Kouzes and Posner, neither an overarching higher order transformational construct as suggested by
Carless (2001). Rather, the study suggests that transformational leadership practices in Norway, and
possibly elsewhere, best could be interpreted using a three-factor model.
Introduction This article sets out to examine the factor structure of the Leadership Practices Inventory
(LPI) and Kouzes and Posner’s (1987, 1995, 2002) “Five Practices of Exemplary
Leadership” in a Norwegian context. Kouzes and Posner (2002b :14) claim that: “results
from various analysis reveal that the LPI contains five factors”. These five factors are
labelled “Challenging the Process”, “Inspiring a Shared Vision”, “Enabling others to
Act”, “Modelling the Way”, and “Encouraging the Heart”.
A study by Carless (2001) concludes, on the other hand, that the LPI assesses an over-
arching higher order transformational leadership construct, rather than fiver distinct
factors. However, a 3-factor LPI-solution (“Enabling Others to Act”, “Modelling the
Way” and “Encouraging the Heart”) has been found in research by Lam (1998) on a
sample of Hong Kong managers. Recent doctoral research by, Wilberg (2003), suggests a
3-factor LPI solution (“Change and Vision”, “Collaboration and Target setting”, and
“Motivation”) on a sample of Norwegian and Swedish newspapers and editors. This led
this researcher to question and further investigate the factor structure of the LPI in a
Norwegian context. Permission was obtained from the authors to use the LPI (Kouzes
and Posner, 1997) observer questionnaire.
A framework for Factor analysis Data reduction by factor analysis involves summarizing the important information
contained by the data to a fewer number of factors. The purpose of a factor analysis is
twofold; data reduction in order to define the underlying structure of the data (factors),
and provide substantive interpretation with the minimum loss of information (Hair et al.,
1998).

2
A large number of manuals and textbooks offer advice on how to perform factor
analysis. In addition, the SPSS package used for the subsequent analysis has a number of
de-fault functions available. In order to perform the factor analysis in a structural and
consistent manner, a set of guidelines was developed based on the following references:
Norusis (1993), Tabachnik and Fidell (1996), Stevens (1996), Hair et al. (1998), Churchill
(1999), Foster (2002) de Vaus (2002) and Pallant (2002). Of these references, Hair et al.
(1998) was found to be particularly helpful providing a theoretical background, while
Pallant (2002) offered a useful “how to” framework for conducting and interpreting the
SPSS analyses. It is noted, however, that data- and factor analysis are not exact sciences.
Thus, judgements and justifications have been made during the process.
The sample The respondents in this study consist of MBA and Master of Management (MM) alumni
from the Norwegian School of Management/BI who work in a cross-section of private
and public organisations. Given their educational background, their age of 30+ (39.4%
between 30-39 years; 46.8% between 40-49 years, and 12.6% between 50-59 years), and
that 82% had known the leader for two years or more (M = 4,73 years; St.dev. = 4.53), it
could be assumed the respondents had the background, work experience, and knowledge
required to evaluate their immediate leader using the LPI questionnaire. Thus, the sample
constitutes a judgemental, or purposive, sample (Churchill, 1999) where it is expected
that the sample-elements can serve the research purpose because they can offer the
contributions sought. A total of 1439 questionnaires were distributed as part of a larger
doctoral study by mail and e-mail, and responses collected over a one-month period in
October and November 2002. Because some addresses were incorrect, 159
questionnaires were returned to sender, and only 1280 questionnaires could be assumed
to have been received by the respondents. 396 useable responses were returned, giving a
response rate of 30.9%, which can be as viewed satisfactory in relation to previous
doctoral studies by amongst Brett (2000) and Lindgren (2000).
Of the 396 useable responses received, the overwhelming number was, as could be
expected, evaluations of Norwegian leaders. In addition, more than 90% of the
respondents were Norwegians as well. A subsequent elimination of evaluations made of
and by no-Norwegians in order to create a sample less subject to cultural bias, the sample

3
for the research, before correcting for outliers, consisted of 357 cases of Norwegian
leaders.
Missing data were dealt with applying mean substitution (Hair et al., 1998), which has the
advantage of providing all cases with complete information, thus allowing for the whole
sample of Norwegian leaders (N=357) to be included in further analysis. Outliers falling
outside 3 standard deviations are described as atypical for the sample by Hair et al.
(1998), and were deleted. Thus, the final sample for analysis consisted of 348 cases; 298
males, 48 females and 2 cases where gender was not reported.
Hair et al. (1998) put forward as a general rule of thumb that 350 cases are more than
sufficient as a basis to perform data analysis and draw conclusions. For factor analysis,
Tabachnick and Fidell (1996) suggest that it is comforting to have at least 300 cases,
while Foster (2002: 231) advocates no less than 100 cases. According to Hair et al.
(1998), researchers generally would not factor-analyse a sample fewer than 50
observations. Stevens (1996) explains this reduction in sample size requirements by the
increased experience gained over the years. As more research has been done, experience
has shown that reliable results can be obtained with fewer cases. Hair et al., (1998) and
Pallant (2002:152) further recommends it is adequate to have five cases for each factor to
be analysed in most cases. A further rule of thumb suggests that there should be at least
twice as many respondents as variables/items in a scale (Foster, 2002: 231). According to
the criteria mentioned above, the current sample of 348 cases (N=348) evaluated on a
30-item LPI scale provides a data set acceptable for factor analysis.
Initial deletion of items: Inter-item, and item-to-total correlation. For items to be included in the factor analysis, items should have high correlation
coefficients with at least one other item in the matrix. Rules of thumb suggest that the
inter-item correlations should exceed .3 (Hair et al. 1998: 99 and 119; Churchill, 1999;
Pallant, 2002). The data set complied with this requirement. (Correlation matrix in
Appendix 1).
As a rule of thumb, the item-to-total correlations should exceed .5 for items to be
included in the factor analysis (Nunnally, 1978: 279; Caruana et al., 1995: 249; and

4
Hair et al., 1998: 99 and: 118). As LPI item 29 had an item-to-total correlation value of
.4624, it was subsequently deleted from the scale before performing further analysis.
KMO values and Bartlett’s Test of Sphericity The Kaiser-Meyer-Olkin Measure of Sample Adequacy (KMO value) provides a more
formal way of assessing whether a set of variables overall, and each item in particular, is
appropriate for a factor analysis (de Vaus, 2002: 135-137). Ideally, the KMO value
should be .6 or .7 (different researchers advocate different values) or above for a
value/item to be included in the factor analysis (Pallant, 2002: 161).
The Bartlett’s Test of Sphericity value, a statistical test for presence of overall significance
of the correlations among the variables (Hair et al., 1998: 99), should be significant, i.e.
significant values of .05 or smaller (Pallant, 2002:161).
As shown in the Table 1 below, the data set conformed to the criteria described above of
KMO values above .7, and Bartlett’s Test sig. values of .05 or below. Thus, the initial
steps in preparation for factor analysis justified that factor analysis could be applied on
the data set.
Table 1: Summary from initial statistical tests in preparation for factor analysis LPI-29 (N=348) Test Value Kaiser-Meyer-Olkin Measure of Sampling Adequacy (KMO *) .958
Bartlett’s Test of Sphericity (Sig. Value) .000
Factor analysis According to Hair et al. (1998) the objective of a factor analysis is to minimize the
number of significant loadings for each item, and to make the true content of each factor
more obvious (de Vaus, 2002). Items should at least load .3 to be considered retained,
however items loading above .5 should be retained for practical significance (Hair et al.,
1998). De Vaus (2002: 139) further suggests that when one item has acceptable loadings
on more than one factor, the researcher should try to reduce one of these loadings by
rotating the solution, and/or determine that it belongs to the factor with the highest
loading.

5
An initial confirmatory factor analysis of the LPI scale (29 items) was performed using
SPSS (SPSS for Windows, Release 11.5.1, 2002), selecting eigenvalues above 1, factor
loadings of .3 and higher, and a Varimax rotation to assess the degree to which the data
would meet the expected structure (Hair et al.,1998). This analysis gave 4 factors with
eigenvalues above 1, explaining 66.654 % of the total variance. The 5th factor had an
eigenvalue of .869, well below the suggested value of 1. This initial factor analysis did not
lend support to Kouzes and Posner’s (1987, 1995, 2002) suggestion of a 5-factor
solution.
Subsequently, an exploratory factor analysis (Varimax rotation) was chosen in order to
explore and determine the underlying factor-structure of the LPI scale (29 items) based
on the sample of Norwegian leaders. The Scree Plot indicated a 3-factor solution.
However, Churchill (1999:858) suggests that over-factoring by one or two factors has less
severe consequences for the final solution than under-factoring.
As no item loaded less than .4, there were no immediate items for further deletion.
However, four items (15, 16, 20 and 28) loaded less than .5 across three or four factors,
and were deleted. With 25 item remaining, the next factor extraction then produced a 3-
factor solution explaining 64.323% of the total variance. However, item 25 loaded less
than .5 on two factors, and was deleted. The next solution with items 15, 16, 20, 25 and
28 (in addition to item 29) deleted, gave a 3-factor solution explaining 65.421% of the
total variance. In various trials, where single items and combination of items were
removed, no solution produced a better explanation, both with regards to total variance
explained and interpretation of the scale, than deleting all these items.
This final 3-factor solution was consistent with the previously noted latent
root/eigenvalue criteria of 1 or above, with the .5 criteria for practical significance of
items loading on each factor, and with the goal of producing a clean, easily explainable
solution. Increasing the cut-off-point for item-loadings to .55, this solution thus
obtained the goal of producing a clean solution that was well suited for explaining the
data (Hair et al. 1998; Churchill, 1999). Thus, the 3-factor 24-item solution (Tables 3 and
4) was retained as the best outcome obtained by the factor analysis.

6
Table 2: KMO and Bartlett’s Test. LPI 24-item 3-factor solution (N=348)
KMO and Bartlett's Test
.950
6210.822276
.000
Kaiser-Meyer-Olkin Measure of SamplingAdequacy.
Approx. Chi-SquaredfSig.
Bartlett's Test ofSphericity
Table 3: Total Variance explained (Varimax rotation). LPI 24-item 3-factor solution
(N=348)
Initial Eigenvalues
Rotation Sums of Squared Loadings
Component Total % of Variance
Cumulative Variance
Total % of Variance
Cumulative Variance
1 12.31 51.30 51.30 6.66 27.77 27.77 2 3.09 8.71 60.02 5.25 21.88 49.66 3 1.28 5.37 65.39 3.77 15.73 65.39 4 .87 3.63 69.02 24 .16 .66 100.00
Extraction method: Principal

7
Table 4: Varimax rotated Component Matrix for LPI 24-item 3-factor solution (N = 348) # Item wording Factor 1
“Transforming the
Organisation”
Factor 2 “Supporting
Actions”
Factor 3 “Modelling the Way”
21 Experimenting and takes risk in his/her work even when there is a chance of failure
.791
11 Searches outside the formal boundaries of the organisation for innovative ways to improve what we do
.757
2 Talks about future trends that will influence how work gets done
.743
7 Describes a compelling image of what our future will be like
.721
6 Challenges people to try new and innovative approaches to their work
.713
12 Appeals to others to share his/her dream of future possibilities
.710
26 Takes the initiative to overcome obstacles when outcomes are uncertain
.698
1 Seeks out challenging possibilities that test his/her skills and abilities
.692
22 Is contagiously enthusiastic and positive about future possibilities
.676
27 Speaks with genuine conviction about the higher meaning and purpose of work
.580
17 Shows others how it is in their long –term interest to work together toward a common vision
.574
13 Treats others with dignity and respect .785 23 Gives others freedom and choice in making
decisions about issues that affect them .756
10 Makes it a point to let people know about his/her confidence in their abilities
.748
18 Supports the decisions that people make on their own
.732
8 Actively listens to diverse points of view .719 30 Gives the members of the team lots of
appreciation and support for their contributions .646
3 Develops co-operative relationships with the people he/she works with
.637
5 Praises people for a job well done .581 9 Spends time and energy on making certain that
people’s actions are consistent with the values and standards that have been agreed on
.713
24 Takes an active part in making certain that achievable goals, concrete plans, and measurable milestones are set for projects and programs we work on
.702
14 Follows through on promises and commitments that he/she makes
.692
4 Sets personal example of what he/she expects from others
.624
19 Is clear with others about what it means to do one’s best
.588
8
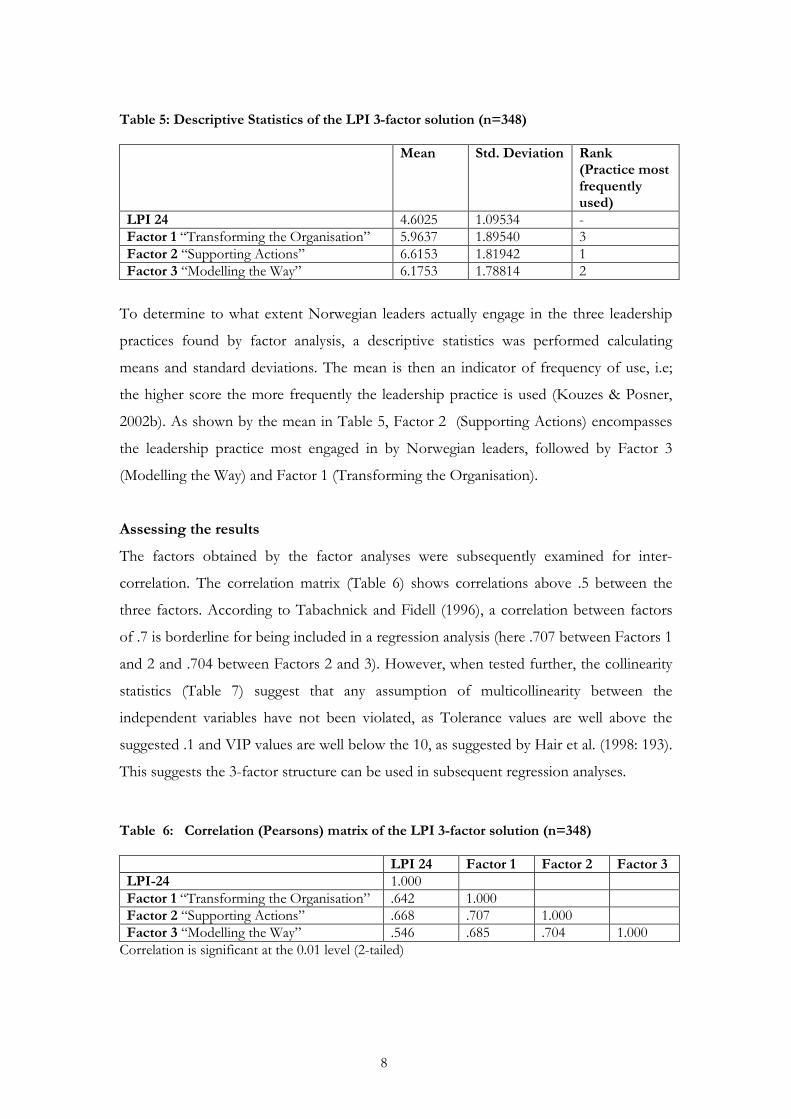
Table 5: Descriptive Statistics of the LPI 3-factor solution (n=348)
Mean Std. Deviation Rank (Practice most frequently used)
LPI 24 4.6025 1.09534 - Factor 1 “Transforming the Organisation” 5.9637 1.89540 3 Factor 2 “Supporting Actions” 6.6153 1.81942 1 Factor 3 “Modelling the Way” 6.1753 1.78814 2
To determine to what extent Norwegian leaders actually engage in the three leadership
practices found by factor analysis, a descriptive statistics was performed calculating
means and standard deviations. The mean is then an indicator of frequency of use, i.e;
the higher score the more frequently the leadership practice is used (Kouzes & Posner,
2002b). As shown by the mean in Table 5, Factor 2 (Supporting Actions) encompasses
the leadership practice most engaged in by Norwegian leaders, followed by Factor 3
(Modelling the Way) and Factor 1 (Transforming the Organisation).
Assessing the results
The factors obtained by the factor analyses were subsequently examined for inter-
correlation. The correlation matrix (Table 6) shows correlations above .5 between the
three factors. According to Tabachnick and Fidell (1996), a correlation between factors
of .7 is borderline for being included in a regression analysis (here .707 between Factors 1
and 2 and .704 between Factors 2 and 3). However, when tested further, the collinearity
statistics (Table 7) suggest that any assumption of multicollinearity between the
independent variables have not been violated, as Tolerance values are well above the
suggested .1 and VIP values are well below the 10, as suggested by Hair et al. (1998: 193).
This suggests the 3-factor structure can be used in subsequent regression analyses.
Table 6: Correlation (Pearsons) matrix of the LPI 3-factor solution (n=348)
LPI 24 Factor 1 Factor 2 Factor 3 LPI-24 1.000 Factor 1 “Transforming the Organisation” .642 1.000 Factor 2 “Supporting Actions” .668 .707 1.000 Factor 3 “Modelling the Way” .546 .685 .704 1.000
Correlation is significant at the 0.01 level (2-tailed)

9
Table 7: Colinearity Statistics LPI 3-factor solution
Colinearity statistics Tolerance VIF
Factor 1 “Transforming the Organisation” .431 2.322 Factor 2 “Supporting Actions” .410 2.442 Factor 3 “Modelling the Way” .435 2.301
According to criteria reported in Hair et al. (1998:188), the reliability analysis (Table 8)
show that the LPI scale with 24 items has good internal consistency with a Cronbach
Alpha coefficient reported of .958. Each of the subscales also showed good internal
consistency with Cronbach Alphas of. .939 (Factor 1), .922 (Factor 2) and .843
(Factor 3).
Table 8: Reliability analysis. LPI 24-item, 3-factor solution
Cronbach Alpha Standardised Alpha Full scale (24 items) .9581 .9582 Factor 1 .9391 .9394 Factor 2 .9224 .9228 Factor 3 .8433 .8430
The factor analysis was validated using a split-sample approach, randomly splitting the
full sample (N=348) into two sub-samples (n=174) and estimating factor models for
each subset (Hair et al., 1998: 115). Comparing the two resulting factor matrices, both
sub-samples gave the same 3-factor structure as the full sample, with items loading on
the same factors. The sub-samples explained 65.6% and 66.4% of the total variance
respectably, compared to 65.4% for the full sample. Thus it can be assumed that the
factor solution is robust across the sample (Hair et al., 1998).
Naming the factors
Factor 1 is a composite factor of Kouzes and Posner’s (1987, 1995, 1997, 2002) practices
“Challenging the Process” and “Inspiring a Shared Vision”. This first factor encompasses
both the leaders personal qualities in challenging status quo and his/her abilities in
mobilizing others to changing for the future. The leader takes risks in searching for
opportunities to change, looks for innovative ways to do things, has both a belief in and
an ability to make a difference, and an ability to create a shared orientation towards the
future. Thus this factor is labelled “ Transforming the Organisation”. With a mean of 5.96,

10
this was found to be the leadership practice least engaged in by Norwegian leaders (see
Table 5).
Factor 2 consists of items classified by Kouzes and Posner (1987, 1995, 1997, 2002) as
belonging to the practices “Enabling others to Act” and “Encouraging the Heart”.
Factor 2 encompasses how the leader treats and collaborates with his/her people in the
everyday work-situation by actively involving them, showing trust in their abilities,
creating mutual respect, and motivating though positive reinforcement and
acknowledgments both on the personal and group level. Thus this factor is labelled
“Supporting Actions”. With a Mean of 6.62, this was the leadership practice most engaged
in by Norwegian leaders.
Factor 3 consists of five of the six items included in Kouzes and Posner’s (1987, 1995,
1997, 2002) concept “Modelling the Way”. This factor encompasses the leader’s
involvement in assuring that achievable goals are reached in ways consistent with agreed
plans, values and standards, as well as emphasising the leader’s integrity and personal
example. Thus this factor is labelled “Modelling the Way”. This was found to be the
leadership practice second most engaged in by Norwegian leaders, with a Mean value of
6.18.
Discussion In many ways the three factors, or leadership practises, “Transforming the Organisation”,
“Modelling the Way” and “Supporting Actions”, found by this study encompasses a
transformational leader’s job in a changing environment (Kotter, 1991; Kouzes and
Posner, 1995, 2002; Waldersee, Simmons and Eagleson, 1995). Although broad concepts,
they can form a frame of reference for leadership practices. In an ever-changing world,
this conceptual framework could be of help for leaders shaping their own leadership
styles when focusing their efforts towards transforming their organisations/teams for
new realities. This is obtained both by a willingness to take risks, have an open mind to
the outside world, as well as being able to enthuse people and create motivation, effort
and direction. In addition, the leaders themselves should act as an example for others and
make sure that agreed actions are followed through. As shown by this research, it is
particularily important for Norwegian leaders to treat others with respect, give their
people freedom to act, trust them and support their actions.

11
Kouzes and Posner (1987, 1995, 1997, 2002) claim five distinct and fundamental
practises/factors of exemplary leadership. This supposition is not supported by this study
based on this sample of 348 Norwegian leaders, which suggests the LPI can be better
interpreted using a 3-factor rather than a 5-factor solution. The relationship between
Kouzes and Posner’s “five practices of exemplary leadership” and the three-factor
solution emerging from this research are shown in Table 9 below. The results from this
study is more in line with research by Lam (1998) and Wilberg (2003), who both support
a 3-factor solution in a Hong Kong and Swedish/Norwegian context respectably.
Wilberg (2003), investigating leadership practices and performance of newspapers in
Norway and Sweden, initially found nine LPI- factors when doing explanatory factor
analysis, but neither this solution, nor the original Kouzes and Posner 5-factor solution
gave satisfactory Cronbach Alphas. Thus Wilberg, underpinned by theory from amongst
other Tichy and DeVanna (1990) and Yukl (2002), combined “Challenging the Process”
and “Inspiring a shared Vision”, “Enabling others to Act” and “Modelling the Way” and
kept “Encouraging the Heart”, thus forming a three-factor LPI construct containing the
original 30 items in order to obtain satisfactory Cronbach Alphas.
Although separate factors in a theoretical context, the three leadership practices found by
this research are simultaneous and continuous aspects of a leader’s responsibilities and
work in the “real world”. Nevertheless, looking at the factors both separately and
together, can help leaders focus on the various aspects of (transformational) leadership,
as well as increase their understanding of the interrelationship between them. Thus, this
three-factor construct of leadership practices could form a frame of reference upon
which the individual leader could exercise his/her leadership.
The reasons for the difference in factor structure between the “five practices” and three-
factor solutions might have a cause in the different cultural context between the US and
Norway/Nordic region, as advocated by amongst other Hofstede (1980) and Gupta,
Hanges and Dorfman (2002). The relatively strong emphasis on “Supportive Actions”
found by this research could be explained by the assumption that Norwegian/Nordic
organisational culture has a small “power distance” between leader and staff, and that
Norwegian leaders generally exhibit a more “feminine” leadership style. Thus, leadership
in the Nordic region is more about “nearby” leaders and what the leaders can do for

12
his/her followers. According to Alimo-Metcalfe and Alban-Metcalfe (2000), this
approach resembles a notion of “leaders as servants”, and is rather similar to the UK
perception of leadership. This in contrast to the US notion, which more emphasizes what
the leader can do to his/her followers. These researchers suggest that US models are
primarily about leaders acting as role models and inspiring the followers. However, more
research should be conducted to further investigate these assumptions.
The results from this study do not support Carless’ (2001) notion that the LPI construct
assesses one overarching transformational leadership factor. However, as shown in Table
9, the factor structure obtained in this study suggests that the leadership practices are
more intertwined in a Norwegian context than suggested by Kouzes and Posner (1995,
2002.). Carless (2001:238) notes: “Although it is possible to identify meaningful
differences among transformational leader behaviours, the high correlations between the
constructs suggest the LPI has weak discriminant validity”. As shown in Table 6, this
might be the case for results obtained by this study as well. Nevertheless, it is hoped that
this study offers additional insight into the factor structure of the LPI construct, and
adds to our knowledge of (transformational) leadership practices in a Norwegian context.
However, further theoretical and empirical research will be needed to validate the
findings from this study in a Norwegian context.
Table 9 : The relationship between the 3-factor solution and Kouzes and Poser's (1987, 1995, 2002) 5-practices/factors.
3-factor solution Kouzes and Posner's 5 Practices of Exemplary Leadership
Factor 1 (11 items) “Transforming the Organisation”
5 items from “Challenging the Process” 6 items form “Inspiring a Shared Vision”
Factor 2, (8 items) “Supporting Actions”
5 items from “Enabling Others to Act” 3 items from “Encouraging the Heart”
Factor 3 (5 items) “Modelling the Way”
5 items from “Modelling the Way”
Summary and conclusions The basic assumption of a factor analysis is that underlying dimensions can be used to
explain complex phenomena. Using as few factors as possible, the solution becomes
simple, meaningful and interpretable (Norusis, 1983:48-49).
13
Carless (2001) concludes that the LPI assesses an overarching higher transformational
leadership construct, although assuming five underlying first-order factors. Kouzes and
Posner (2002b: 14) claim: “Results from various analyses reveal that the LPI contains five
factors.” The 3- factor solution obtained in this study supports neither Carless’ nor
Kouzes and Posner’s claims. However, Carless’ suggestion that the LPI has weak
discriminant validity is noted and partially supported. Kouzes and Posner’s five LPI
factors grouped nicely onto the three factors found in this study (Table 9); two factors on
the first factor, two factors on the second factor, while the last factor (Modelling the
Way) was similar to that of Kouzes and Posner. Thus, this suggests that the “five
practices of exemplary leadership” might be more intertwined in a Norwegian context
than stated by Kouzes and Posner (1998, 2002). As a leader development tool, the “five
practices” might have some advantages over a 3-factor solution, making it easier to focus
on separate behaviours. However, the 3-factor solution found in this study is more in line
with recent research by Lam (1998), who found a 3-factor solution on a sample of Hong
Kong managers (Enabling to Act, Modelling the Way and Encouraging the Heart) and
Wilberg (2003), who formed a 3-factor solution on a sample of Swedish/Norwegian
newspaper editors. This could imply that cultural contexts influence the factor structure,
as previously suggested by amongst other Lim (1997), Miller, Patterson and Kerrin
(1999), and Alban-Metcalfe and Alimo-Metcalfe (2000).
Based on mean scores (Table 5) this study found that Norwegian leaders most frequently
engage in “Supporting Actions”, followed by “Modelling the Way” and “Transforming
the Organisation”. A limitation of this study is that it relates to Norwegian leaders and is
based mainly on male leaders. A further limitation is the possible weak discriminant
validity between the factors. Thus, further research is needed to examine the factor
structure found in this study within various organisational and demographic contexts,
and on their influence on organisational outcomes in a Norwegian context.

14
References Alban-Metcalde, R.J. & Alimo-Metcalfe, B. (2000). The transformational leadership questionnaire (TLQ-LVG): a convergent and discriminant validation study. Leadership & Organization Development Journal, Bradford, 21(6): 280-296. Alimo-Metcalfe, B. & Alban-Metcalfe,R.J. (2000). An analysis of the convergent and discriminant validity of the transformational leadership questionnaire. International Journal of Selection and Assessment, 8(3). Brett, P.O. (2000). The management systems approach: Content Characteristics of an emerging model for managing organisation toward performance excellence. DBA Thesis. Henley Management College / Brunel University. UK. Carless, S.A. (2001). Assessing the discriminant validity of the Leadership Practices Inventory. Jounal of Occupational and Organizational Psychology, 74. The British Psychological Society. :233-239. Caruana, A., Pitt, L.F., & Berthon, P. (1995). “The Excellence-Market Orientation Link: Some Consequences for Service Firms.” Henley Working Paper, 9524, Henley Management College, UK.
Churchill, G.A. (1999). Market Research. Methodological foundations. Seventh Edition. Dryden Press de Vaus, D. (2002). Analyzing Social Science Data. 50 Key Problems in Data Analysis. London, Thousand Oaks, New Dehli. Sage. Foster. J.L. (2002). Data Analysis. Using SPSS for Windows. Sage Publications. London, Thousand Oaks, New Delhi. Gupta,V., Hanges,P.J, & Dorfman,P. (2002), Cultural clusters: methodology and findings. Journal of World Business 37, :11-15. Hair, J.F.jr., Anderson, R.E., Tatham, R.L. & Black, W.C. (1998). Multivariate Data Analysis. Fifth Edition. Prentice Hall. New Jersey. Hofstede, G. (1980). Culture’s Consequences: International Differences in Work Related Values.Beverly Hills. CA: Sage Publications Kotter, J.P. (1995). Leading change: Why transformation efforts fail. Harvard Business Review, 52(5): 56-67. Kouzes, J., & Posner, B, (1987). The leadership challenge: How to get extraordinary things done in organizations. San Francisco, Jossey-Bass. Kouzes, J.M. & Posner, B.Z (1995) The Leadership Challenge. Second Edition. San Francisco, Jossey-Bass Kouzes, J.M. & Posner, B.Z. (1997). Leadership Practices Inventory - Individual Contributor (LPI-IC). Observer Response Sheet. San Francisco, CA: Jossey-Bass/Pfeiffer
15
Kouzes, J.M. & Posner, B.Z. (2002) The Leadership Challenge. Third Edition. San Francisco, Jossey-Bass Kouzes, J.M. & Posner, B. (2002 b). “The Leadership Practices Inventory: Theory and Evidence behind the Five Practices of Exemplary Leaders.” “[Online]”- Available from: www.leadershipchallenge.com/researc. Appendix0512BP.[Accessed June2003]
Lam, S.S.K. (1998). An Assessment of the Reliability and Validity of the Leadership Practices Inventory in Hong Kong. International Journal of Management. Vol 15 No 1. Lim, B. (1997). Transformational leadership in the UK management culture. Leadership & Organization Development Journal, 18(6): 283-290 Lindgren, M. (2000). Strategic flexibility: antecedents and performance implications in turbulent environment. DBA Thesis. Henley Management College / Brunel University. UK. Miller, H., Patterson, F. & Kerrin, M. (1999). Assessing Leadership in Organizations: A Cognitive Mapping Approach. Paper delivered at the BPS Occupational Psychology Annual Conference 1999. Norusis, M.J./SPSS Inc. (1993). SPSS for Windows, Professional Statistics, Release 6.0. SPSS Inc., Chicago, Illinois Nunnally, J.O. (1978). Psychometric Theory. New York: McGraw-Hill. Pallant, J. (2002). SPSS survival manual. A step by step guide to data analysis using SPSS for Windows (Versions 10 and 11). Open University Press. Buckingham /Philadelphia. SPSS for Windows, Release 11.5.1. (16 Nov. 2002). Copyright SPSS Inc. Licenced to BI-user, NSM/BI, 12345. Stevens, J. (1996). Applied multivariate statistics for the social sciences (3rd edition). Mahawah, New Jersey: Lawrence Erlbaum. Tabachnick, B.G., & Fidell, L.S. (1996). Using multivariate statistics (3rd edition). New York: HarperCollins. Tichy, J.B., & Devanna, M.A. (1986). Transformational leadership. New York: Wiley
Yukl G.(2002). Leadership in Organizations. Fifth Edition. Prentice Hall. Waldersee, R., Simmons, R. & Eagleson, G. (1995). Pluralistic leadership in service change programs: Some preliminary findings. Academy of Management Journal, Best Papers Proceedings, 296. Wilberg, E. (2003). An Investigation into Leadership Practices and Performance of Newspapers in Norway and Sweden. DBA thesis. Henley Management College / Brunel Univeristy.UK


17
Appendix 1: LPI Correlation Matrix (N=348) ** Correlation is significant at the 0.01 level (2-tailed). * Correlation is significant at the 0.05 level (2-tailed).
CorrelationsN=348
1 2 3 4 5 6 7 8 9 10 11 12 13 14 15 16 17 18 19 20 21 22 23 24 25 26 27 28 29 30
1 Pearson Correlation 1 0,53 0,45 0,59 0,46 0,6 0,51 0,31 0,4 0,42 0,56 0,52 0,3 0,31 0,51 0,47 0,56 0,4 0,51 0,41 0,62 0,58 0,34 0,45 0,4 0,66 0,56 0,51 0,24 0,45
2 Pearson Correlation 0,53 1 0,43 0,41 0,43 0,64 0,7 0,44 0,37 0,41 0,58 0,6 0,25 0,25 0,54 0,48 0,56 0,4 0,48 0,45 0,52 0,52 0,33 0,31 0,36 0,55 0,53 0,5 0,24 0,4
3 Pearson Correlation 0,45 0,43 1 0,61 0,65 0,51 0,48 0,58 0,47 0,68 0,43 0,45 0,67 0,46 0,54 0,46 0,53 0,52 0,43 0,52 0,31 0,55 0,49 0,48 0,46 0,48 0,55 0,62 0,44 0,66
4 Pearson Correlation 0,59 0,41 0,61 1 0,57 0,51 0,46 0,47 0,52 0,56 0,45 0,46 0,55 0,58 0,59 0,52 0,54 0,45 0,55 0,49 0,43 0,54 0,39 0,57 0,43 0,56 0,51 0,57 0,45 0,58
5 Pearson Correlation 0,46 0,43 0,65 0,57 1 0,57 0,49 0,5 0,43 0,62 0,43 0,45 0,55 0,41 0,56 0,5 0,53 0,54 0,4 0,56 0,4 0,57 0,42 0,44 0,5 0,54 0,49 0,59 0,36 0,78
6 Pearson Correlation 0,6 0,64 0,51 0,51 0,57 1 0,64 0,49 0,42 0,54 0,67 0,63 0,37 0,3 0,6 0,57 0,59 0,49 0,48 0,5 0,56 0,58 0,44 0,43 0,42 0,59 0,55 0,56 0,24 0,55
7 Pearson Correlation 0,51 0,7 0,48 0,46 0,49 0,64 1 0,48 0,41 0,52 0,62 0,61 0,33 0,27 0,57 0,58 0,64 0,49 0,55 0,49 0,51 0,57 0,44 0,45 0,37 0,57 0,64 0,54 0,31 0,48
8 Pearson Correlation 0,31 0,44 0,58 0,47 0,5 0,49 0,48 1 0,44 0,64 0,44 0,45 0,65 0,43 0,5 0,5 0,49 0,62 0,3 0,39 0,29 0,47 0,54 0,41 0,3 0,42 0,47 0,51 0,38 0,52
9 Pearson Correlation 0,4 0,37 0,47 0,52 0,43 0,42 0,41 0,44 1 0,45 0,35 0,39 0,39 0,49 0,47 0,42 0,53 0,39 0,47 0,5 0,23 0,36 0,27 0,56 0,33 0,39 0,46 0,54 0,44 0,43
10 Pearson Correlation 0,42 0,41 0,68 0,56 0,62 0,54 0,52 0,64 0,45 1 0,48 0,49 0,66 0,47 0,59 0,54 0,58 0,66 0,42 0,47 0,37 0,54 0,62 0,44 0,41 0,47 0,53 0,58 0,4 0,69
11 Pearson Correlation 0,56 0,58 0,43 0,45 0,43 0,67 0,62 0,44 0,35 0,48 1 0,62 0,29 0,23 0,55 0,5 0,53 0,5 0,46 0,45 0,6 0,58 0,42 0,38 0,43 0,63 0,48 0,53 0,18 0,47
12 Pearson Correlation 0,52 0,6 0,45 0,46 0,45 0,63 0,61 0,45 0,39 0,49 0,62 1 0,36 0,32 0,55 0,55 0,63 0,42 0,58 0,53 0,51 0,67 0,33 0,39 0,48 0,59 0,56 0,52 0,21 0,5
13 Pearson Correlation 0,3 0,25 0,67 0,55 0,55 0,37 0,33 0,65 0,39 0,66 0,29 0,36 1 0,63 0,46 0,5 0,5 0,61 0,33 0,44 0,21 0,48 0,58 0,45 0,33 0,4 0,46 0,55 0,47 0,59
14 Pearson Correlation 0,31 0,25 0,46 0,58 0,41 0,3 0,27 0,43 0,49 0,47 0,23 0,32 0,63 1 0,44 0,44 0,43 0,45 0,37 0,39 0,12 0,29 0,38 0,53 0,31 0,36 0,38 0,47 0,51 0,48
15 Pearson Correlation 0,51 0,54 0,54 0,59 0,56 0,6 0,57 0,5 0,47 0,59 0,55 0,55 0,46 0,44 1 0,6 0,6 0,49 0,53 0,55 0,51 0,56 0,44 0,45 0,59 0,58 0,52 0,64 0,33 0,62
16 Pearson Correlation 0,47 0,48 0,46 0,52 0,5 0,57 0,58 0,5 0,42 0,54 0,5 0,55 0,5 0,44 0,6 1 0,63 0,51 0,53 0,51 0,42 0,54 0,46 0,5 0,42 0,56 0,55 0,55 0,39 0,54
17 Pearson Correlation 0,56 0,56 0,53 0,54 0,53 0,59 0,64 0,49 0,53 0,58 0,53 0,63 0,5 0,43 0,6 0,63 1 0,51 0,63 0,55 0,45 0,61 0,43 0,49 0,46 0,57 0,67 0,6 0,37 0,58
18 Pearson Correlation 0,4 0,4 0,52 0,45 0,54 0,49 0,49 0,62 0,39 0,66 0,5 0,42 0,61 0,45 0,49 0,51 0,51 1 0,43 0,47 0,41 0,48 0,7 0,43 0,35 0,51 0,41 0,54 0,34 0,56
19 Pearson Correlation 0,51 0,48 0,43 0,55 0,4 0,48 0,55 0,3 0,47 0,42 0,46 0,58 0,33 0,37 0,53 0,53 0,63 0,43 1 0,57 0,41 0,51 0,3 0,54 0,47 0,54 0,6 0,55 0,32 0,44
20 Pearson Correlation 0,41 0,45 0,52 0,49 0,56 0,5 0,49 0,39 0,5 0,47 0,45 0,53 0,44 0,39 0,55 0,51 0,55 0,47 0,57 1 0,38 0,56 0,4 0,41 0,45 0,51 0,57 0,52 0,33 0,59
21 Pearson Correlation 0,62 0,52 0,31 0,43 0,4 0,56 0,51 0,29 0,23 0,37 0,6 0,51 0,21 0,12 0,51 0,42 0,45 0,41 0,41 0,38 1 0,63 0,41 0,31 0,43 0,65 0,46 0,46 0,12 0,41
22 Pearson Correlation 0,58 0,52 0,55 0,54 0,57 0,58 0,57 0,47 0,36 0,54 0,58 0,67 0,48 0,29 0,56 0,54 0,61 0,48 0,51 0,56 0,63 1 0,47 0,4 0,49 0,63 0,62 0,53 0,22 0,59
23 Pearson Correlation 0,34 0,33 0,49 0,39 0,42 0,44 0,44 0,54 0,27 0,62 0,42 0,33 0,58 0,38 0,44 0,46 0,43 0,7 0,3 0,4 0,41 0,47 1 0,39 0,33 0,43 0,46 0,46 0,34 0,52
24 Pearson Correlation 0,45 0,31 0,48 0,57 0,44 0,43 0,45 0,41 0,56 0,44 0,38 0,39 0,45 0,53 0,45 0,5 0,49 0,43 0,54 0,41 0,31 0,4 0,39 1 0,41 0,56 0,48 0,53 0,5 0,43
25 Pearson Correlation 0,4 0,36 0,46 0,43 0,5 0,42 0,37 0,3 0,33 0,41 0,43 0,48 0,33 0,31 0,59 0,42 0,46 0,35 0,47 0,45 0,43 0,49 0,33 0,41 1 0,61 0,43 0,52 0,22 0,55
26 Pearson Correlation 0,66 0,55 0,48 0,56 0,54 0,59 0,57 0,42 0,39 0,47 0,63 0,59 0,4 0,36 0,58 0,56 0,57 0,51 0,54 0,51 0,65 0,63 0,43 0,56 0,61 1 0,61 0,66 0,34 0,54
27 Pearson Correlation 0,56 0,53 0,55 0,51 0,49 0,55 0,64 0,47 0,46 0,53 0,48 0,56 0,46 0,38 0,52 0,55 0,67 0,41 0,6 0,57 0,46 0,62 0,46 0,48 0,43 0,61 1 0,61 0,37 0,55
28 Pearson Correlation 0,51 0,5 0,62 0,57 0,59 0,56 0,54 0,51 0,54 0,58 0,53 0,52 0,55 0,47 0,64 0,55 0,6 0,54 0,55 0,52 0,46 0,53 0,46 0,53 0,52 0,66 0,61 1 0,51 0,67
29 Pearson Correlation 0,24 0,24 0,44 0,45 0,36 0,24 0,31 0,38 0,44 0,4 0,18 0,21 0,47 0,51 0,33 0,39 0,37 0,34 0,32 0,33 0,12 0,22 0,34 0,5 0,22 0,34 0,37 0,51 1 0,42
30 Pearson Correlation 0,45 0,4 0,66 0,58 0,78 0,55 0,48 0,52 0,43 0,69 0,47 0,5 0,59 0,48 0,62 0,54 0,58 0,56 0,44 0,59 0,41 0,59 0,52 0,43 0,55 0,54 0,55 0,67 0,42 1

18