8 evolving approaches and technologies to enhance the role
TRANSCRIPT
8 Evolving Approaches and Technologies to Enhance the Role of Ecological Modeling in Decision Making
ERIC GUSTAFSON, JOHN NESTLER, LOUIS GROSS, KEITH M. REYNOLDS, DANIEL YAUSSY, THOMAS P. IMAXWELL, and VIRGINIA H. DALE
8.1 Introduction
Understanding the effects of management activities is difficult for natural resource managers and decision makers because ecological systems are highly complex and their behavior is difficult to predict. Furthermore, the empirical studies necessary to illuminate all management questions quickly become logistically complicated and cost prohibitive. Ecological models provide a means to formalize our conceptual understanding of how an ecological system works and allow us to check this understanding by testing model predictions. Validated models can then be used to make predictions about the effects of proposed management activities, giving decision makers useful information that would not be available from empirical data.
In this chapter, we discuss evolving modeling approaches and technolo- gies for ecological modeling and application to decision making. We begin by discussing model conceptualization and design and showing how new approaches to model structuring might enhance problem formulation in decision making. We then discuss issues surrounding the construction and implementation of ecological models after the conceptual development has been completed and present evolving approaches that address these issues. Finally, we discuss technologies for communicating the structure of and output from models to improve their relevance and usefulness to decision makers and the stakeholders in the managed system.
8.2 Model Conceptualization and Design
Perhaps the biggest problems facing decision makers are (1) forging a consensus about what the true problems are and (2) agreeing on the data, protocols and analytical tools that will be used to produce the information

136 Eric Gustafson et al.
on which to base decisions. All parties must understand the structure and limitations of a proposed model because models with the appearance of a "black box" will create suspicion and reduce cooperation, Modelers must clearly comunicate to nonmodelers the structure and relationships within the model, and provide a method by which participants can suggest improvements to model design.
8.2.1 Approaches and Technologies 8.2-1.1 Logic-Based Model Specifications
Since the 1960s, ecological modeling has emphasized simulation of process. Early implementations were procedural and based on flow charts Later implementations, trying to better cope with ecological complexity, have tended toward object-oriented models based on the universal modeling language (UML) (Boggs and Boggs 1999) or similar semantic models for object-oriented analysis and design. In either case, these implementations are fundamentally process oriented. However, ecosystem evaluation based on knowledge-based systems theory and logical abstraction shows promise for improving the tractability of ecosystem evaluation (Reynolds et al. 2000). Logic-based networks, flowcharts, and UML are all semantic models (Booch 1994), but logic-based networks are distinct from conceptual models by having a formal grammar and syntax. Two examples of logic- based approaches are fuzzy network models and Bayesian belief networks.
8.2.1.1.1 Fuzzy Network Models
Fuzzy logic networks are a powerful form of knowledge representation, ideally suited to the abstract problems posed by ecosystem evaluation. Similar in concept to a metadatabase, a knowledge base is a formal specification for interpreting information (Walters and Nielsen 1988). NetWeaver is such a knowledge base, having a formal grammar and syntax that makes the knowledge base an executable specification '(Reynolds 1999). A NetWeaver knowledge base graphically represents the ecosystem state as linked networks of propositions.Two key properties of a NetWeaver proposition are its measure of truth (i.e., the degree of support for the proposition) and its logical specification, which is grap~cally constructed from operators (fuzzy, Boolean, and arithmetic), data, and other proposi- tions. The implementation of fuzzy math in NetWeaver facilitates compact and efficient representation of large, abstract problems. For example, a prototype knowledge base evaluates forest ecosystem sustainability as prescribed by the Montreal Process (Reynolds 2001). Also, fuzzy math provides a set-theoretic implementation of uncertainty (see Section 8.4.1.3) as an alternative to the more familiar notion based on probability theory (Zadeh and Kacprzyk 1992).

8. Evolving Approaches and Technologies 137
Fuzzy network models (FT\TMs) for ecosystem evaluation are not a substitute for statistical and process models. Rather, FNMs are most valuable when used as logic frameworks for integrating the outputs from other models. Consider a hypothetical ecosystem evaluation in which 100 statistical models were developed and applied to various dimensions of the analysis and another 20 simulations of other system components were run. A logic framework for integrating all these results might be useful. Because FNMs are formal specifications for interpreting information, they are cognitive maps of the problem specification (Stillings et al. 1987),They help identify questions to be answered, the relevant intermediate states and processes, the information required, and how the results are related to each other. It is important to note that these logic networks are not just specifications, but are themselves models that can be fed data and produce interpretable output. Furthermore, in systems like Netweaver, the specifi- cation provides an intuitive, graphical explanation for the derivation of results so the model is not a black box.
8.2.1.i.2 Bayesian Belief Networks
Another class of semantic models are Bayesian belief networks (BBNs) (Ellison 1996). Bayesian belief networks are based on probability theory, whereas FNMs are based on set theory. The practical implication of this difference is that BBNs are best suited to applications where the problem is relatively narrow and well defined and most conditional probabilities are known, while FNMs are best suited to applications where the problem is broad and abstract and a significant proportion of the conditional proba- bilities are unknown.
8.2.1.2 Data Visualization
Visualization of the relationships and interactions among variables can aid mode1 formulation and design. When the relationships among variables are clearly understood, model design and behavior will be enhanced, and more realistic estimations and predictions will result. Most current sta- tistical packages contain sophisticated graphics packages to allow two- dimensional (2-D) projection of a three-dimensional (3-D) data space. True 3-D viewing is possible with specialized projection systems and eyewear (polarized lenses, alternating liquid-crystal-display lenses, or virtual reality goggles). It is possible to visualize the interactions of five variables in a 3-D representation with length, width, height, color, and animation. For example, consider a representation of tree growth across a region with lat- itude being length, longitude being width, average monthly temperature being height, monthly growth rate being color, and time lapse as the ani- mation. A good source for information on this topic is the Digital Visual- ization Analysis Laboratory of NASA (http://dval-www.larc.nasa.gov).

138 Eric Gustafson et al.
8.2.2 Translating a Conceptual Model into a Logic-Based
To translate a conceptual model provided by a domain expert (or set of experts) into a logic-based network model, we begin with a simple conceptual model, such as that described by Bormann et al. (1994) for evaluating the sustainability of forest ecosystems (see Rgure 8.1). The key concept of this model is that sustainable forest ecosystems can occur within the overlap between what is biophysically feasible and what is socially acceptable.
The model of Bormann et al. (1994) is easily translated into a logical representation (Figure 8.2), where each oval represents a logic network that evaluates a proposition-The ultimate proposition of interest concerns forest ecosystem sustainability, and this proposition depends on two premises: that social values are satisfied and that it is biophysically feasible to maintain the ecosystem in a specified condition. Each premise of forest ecosystem sustainability is abstract, but can be further elaborated by using the concepts discussed by Davis et al. (2001). For example, the proposition concerning the feasibility of biophysical condition depends on premises about maintaining suitable forest structure, composition, and ecosystem processes If this model specification was implemented in Netweaver, which is based on fuzzy math, the specification for biophysical feasibility could
\&%at the current generation desires for itself and for future eenerations
What is biologically
/
physically possible in
I the long term /
Sustainable ecosystems
FIGURE 8.1. Conceptual model of forest ecosyste~n sustainability [adapted from Bomann et aI. (1994)j.

8. Evolving Approaches and Technologies 139
FIGURE 8.2. A logic-based representation of the conceptual model for forest ecosystem sustainability [From Fig. 1 in Bonnann et al. (1994)l extended with con- cepts presented by Davis et al. (2001).
be stated as "the assertion of biophysical feasibility is true to the degree that structure, composition, and processes of the ecosystem are in a suit- able condition,"
The premises providing support for or against biophysical feasibility and social acceptability are still relatively abstract, but, in general, propositions become progressively more specific and concrete as the logic specification is extended to progressively deeper levels (see Figure 8.2). Continued development of the logic structure by the extension of each logic pathway would quickly produce propositions that could be evaluated by comparison to data.
Both the conceptual model (see Figure 8.1) and its translation into a logic-based representation (see Figure 8.2) are useful forms of model visu- alization. The logic-based form is particularly intriguing because it seam- lessly integrates symbolic and spatial reasoning (Stillings et al. 1987). Indeed, when a logic network and its logical antecedents are viewed as propositions and premises, respectively, knowledge-base architectures pro- duced by systems like Netweaver provide an intuitive visual representation of a formal logical discourse (Halpern 1989). With respect to decision making, the logic model provides an intuitive and unambiguous specifica- tion of what is of concern, how elements are logically interdependent, what data are required to evaluate the concern, and, perhaps most importantly, how infomation is to be interpreted to arrive at a conclusion.
140 Eric Gustafson et al.
8.3 Model Implementation
Simulation modeling has traditionally been conducted in the realm of high-level procedural computer programming, creating programs that can be difficult to use and that produce complex output. Long time intervals between the design of a model and its implementation tend to decrease its relevance and utility. Furthermore, the nature of the code produced tends to make linking models problematic and prone to error. Emerging approaches are beginning to overcome limitations in designing, coding, and linking computer models, allowing more flexible implementation of models to answer specific questions posed by decision makers.
8.3.1 , Approaches and Technologies 8.3.1.1 Markov Models
Markov models represent one widely used approach that underlies many ecological models. The main advantage (and also the main limitation) of a Markov model is revealed in the definition of the Markov property: given the present, the future is independent of the past. In such a model, no infor- mation other than the present state is required to predict the future. Markov models are therefore specified by some initial probability distribution of states, and a description of the probability of transition from any partic- ular state to some other state at some future time. These transitions are specified by a transition matrix (for discrete-time models) or a transition probability-density function (for continuous-state models) of the probabil- ities of transition from one state to any other state in one time period.
Because Markov models ignore past history, they are relatively easy to construct from observations of a system. The major limitation is that, in many cases, history does matter, and projecting the future based solely on the current state may be quite inaccurate. For example, if a population is far from demographic equilibrium, then age structure significantly affects overall population growth rates The eEed of the "baby-boom" generation (the generation born between 1946 and 1960) on future demographics in the United States is a good example. Of course, one can extend the state space of the model by including a sequence of past states within the current state to make the Markov assunlption more appropriate. However, this greatly increases the dimensionality of the problem and reduces the advan- tage of the Markov approach.
8.3.1.2 Agent-Based Models
Agent-based models are another class of models related to the Markov framework. Agent-based approaches simulate the autonomous behavior of agents (individuals) by constructing rules governing the physiology and behavior of those individuals As the agents act according to the rules

8, Evolving Approaches and Technologies 141
(moving, feeding, mating, avoiding predators, respiring, etc.), they interact with their surroundings and with other agents. Such models allow study of the relationship between individual actions and complex ecological systems (DeAngelis and Gross 1992). The models can be linked to geographic infor- mation systems (GIs) and to models simulating other speciesThere are few limits to the sophistication of these models. The state of individuals may include location, sex, size, social status, and fat content, and the behavioral rules may be related to environmental factors (e.g., temperature, water, nutrient availability, and habitat condition), other agents, physiological stress, environmental cues, or random actions. Model behavior can often be compared directly with empirical observations.
As an example, an individual-based, landscape-scale model was con- structed to simulate the interaction of dispersing American martens with the spatial variability of energy (i.e., acquisition of prey) and mortality risk (by predation) associated with different habitat types (Gardner and Custafson in press). Movernent decision rules vary with the physiological state of the individual, such that martens tend to select habitats that mini- mize predation risk, except when energy reserves are low, in which case they select habitats that provide increased energy intake. Marten movements are simulated on heterogeneous, grid-cell landscapes, and the movement paths, percentage of dispersing martens killed or starved, and proportion of martens successfully dispersing to a new home range are measufed. The agent-based approach is well suited to modeling the dispersal process because it formalizes the behavior of an individual and allows the study of how that behavior interacts with the landscape structure produced by management, disturbance, and development.
8.3.1.3 New Approaches for Dealing with Scale
A number of studies in theoretical ecology point to the importance of scale in ecological modeling (Kolasa 1989; Rahel1990; Levin 1992; Holling 1992). Levin (1992) argues that "the problem of pattern and scale is the central problem in ecology." Kolasa (1989), Rahel (1990), and Holling (1992) acknowledge that spatial scale and temporal scale are paramount to under- standing community dynamics,
Two scale considerations constrain realistic ecosystem simulation. Fust, ecological systems are comprised of processes that occur across a wide range of spatial and temporal scales. At one extreme lie small-scale, short- time-period processes, such as the collision of molecules. At the other extreme lie large-scale processes, such as global population dynamics (and associated movement patterns), that may span thousands of kilometers in space and decades in time. Studying one extreme or the other cannot provide a comprehensive view of ecological systems. Second, ecological systefns have emergent properties that can only be described across multi- ple hierarchical levels (O'Neill et al. 1989). Hybrid modeling frameworks have been developed to explicitly resolve mismatches of scale.

142 Eric Gustafson et al.
8.3.1.3.1 Coupled EuZerian--Lagmngian Hybrid Models
Ecological-simulation approaches can be broadly separated into those using an Eulerian-reference framework and those using a Lagrangian- reference framework. In an Eulerian-reference framework, a modeler discretizes space into cells and then transports and conserves mass, momen- tum, and energy through a grid of cells (see Figure 8.3A). The subset of ecological processes best simulated using an Eulerian framework occur over small spatial scales and short time steps relative to both the spatial scale of discretization and the time step used to model transfers across cell boundaries. In aquatic systems, such processes can be averaged within cells and dispersed among cells with a relatively small accumulation of errors. For example, the accuracy with which a chemical transformation can be simulated is not substantially affected by changes in cell size as long as the cell size is large relative to the spatial scale of the process (see Figure 8.3A). This assumption appears to hold true for the simulation of chemical transformations, microbial degradation, algal photosynthesis, and other biogeochemical processes that occur over relatively small spatial and temporal scales.
In a Lagrangian-reference framework, the modeler disaggregates reality into smaller control volumes or particles (for brevity, we refer to both as particles) and tracks the changes in the particles through space and time
FIGUE 8.3. Comparison of Euferian (A) and Lagrangian (B) reference frame- works. The grid in @) is for scaling purposes only and does not represent part of the Lagrangian framework.

8. Evolhg Approaches and Technologies 143
(see Figure 8.3B). The Lagrangian framework is required for the subset of ecosystem-level processes that violate Eulerian assumptions because (I) the scale of movement of the simulated process is great relative to that used in the Eulerian representation of the system or (2) movement dynamics associated with the contrasting process are sufficiently complex that they cannot be averaged into an Eulerian framework without propagating substantial error. For example, the effects of a highly mobile and abundant fish species on chemical transformations in a lake cannot be averaged in an Eulerian framework because fish schooling behavior and complex swim- path selection prevent biomass from being accurately distributed into cells at time steps At the scale of discretization (1 m3) used in this example, fish may cross multiple cells in a single time step, or most of the fish may concentrate in a very small part of the physical domain represented by the model grid. The scale of fish movement exceeds the scales of advection and dispersion used to describe fluid motion and chemical transformations. This example requires use of the Lagrangian framework (see Figure 8.3B) because fish-movement capabilities are large relative to the scale of discretization. The agent-based models discussed in the previous section also use the Lagrangian frame of reference.
These two modeling frameworks have been combined into a single, unified framework termed the Coupled Eulerian-Lagrangian Hybrid (CEL Hybrid) Ecological Modeling System. The couple, a generic linking program built on particle-tracking concepts, is the unique information transformationltranslation module of CEL Hybrid models that allows the analysis to switch between the two reference frameworks without infor- mation loss. Particle-tracking algorithms emulate the path made by a neutrally buoyant particle passively transported through a physical domain represented as a 3-D grid. They interpolate discontinuous information represented in an Eulerian grid to intermediate points of interest to gene- rate a nearly continuous Lagrangian pathway (Martin and McCutcheon 1999). Particle-tracking logic enables the modeler to use the strength of a Lagrangian framework to maintain the integrity of individuals as they move through simulated space, while concurrently using the power of the Eulerian framework to sirnulate the physicochemical environment and other characteristics of the system over time and space. For example, Goodwin et al. (2001) describe how fish-movement rules based on particle- tracking logic can be programmed into a water-quality model, and Nestler et al. (2002) describe the accuracy of calibration of such an approach.
Closer examination of the Goodvvin et al. (2001) model illustrates how dynamically coupled Eulerian-based and Lagrangian-based models can overcome scale discrepancies (Figure 8.4). They used a specialized coupling program, the Numerical Fish Surrogate (WS) to simulate the sensory inputs and emergent behavior (Warburton 1997) of adult blueback herring (Alosa aestivalis), a cool-water fish species common in inland and coastal environments. This species moves extensively within a hydrosystem and

144 Eric Gustafson et al.
August 30, 1996 2 am (JDAY 243.08) g;:zd- I Contour
I . . * . .
96 Influence for Time Step
Water Tenrp C73
0 Distance (4 Along Longitudinal Axis of Lake 6OOOO
FIGURE 8.4. Visualization of output from coupled models. Open circles represent virtual fish; shaded Ms represent water temperature ("C); contour lines represent selected dissolved-oxygen concentrations [mgL (ppm)]; arrows represent velocity vectors; bar charts indicate instantaneous fish responses to various environmental factors for each movement direction. V = water velocity, TP = temperature, DO = dissolved oxygen, and RD = random number.
uses different habitats for spawning, rearing, feeding, and refuge, and no single model type is presently adequate to simulate its movement behavior. The Eulerian module is a 2-D (laterally averaged) water-quality model that is used to describe hydraulic and water-quality time histories in a grid framework. The Lagrangian module is a fish-movement model that emulates swim-path-selection behavior by the blueback herring in contin- uous space. The NFS is the coupling module that interpolates and translates information between the Eulerian and Lagrangian modules so that the strengths of each modeling reference framework can be effectively employed. Coupled models offer the potential to increase the accuracy of model predictions because an optimum reference framework can be used for different sets of environmental variables. For the example in Figure 8.4, the fit between modeled predictions and field data, summarized to the nearest meter vertically, was R2 = 0.93. The best fit longitudinally, summa- rized to the nearest 5-km-long segment, was R2 = 0.67.
8.3.1.3.2 Fractal Approaches
Other new approaches for dealing with scale exist. Nestler and Sutton (2000) employed a type of fractal geometry tool, the angle measurement

8. Evolving Approaches and Technologies 145 I
technique, to describe changes at multiple scales in a regulated river to illus- trate a multiscale analysis. They quantified how the distribution of energy at multiple scales in a river cross-section was changed by impoundment. The unregulated river channel possessed an evenly graded distribution of subchannels, each characterized by relatively low energy. Some years after regulation, the river had gradually changed into a high-energy main channel flanked by small-scale subchannels. This multiscale change in channel-bed form could not have been described with more conventional single-scale approaches.
There are substantial advantages to multiscale analysis. First, it is a more accurate representation of reality, so that the causes of and solutions to environmental degradation can be more accurately determined. Second, because scale is incorporated as a metric, different-sized organisms (responding to features at different scales) can be evaluated in a single analysis By performing a spatial analysis as a first step, an investigator can optimally size sampling or simulation to reflect the dominant scales within a river system rather than impose an arbitrarily selected scale of analysis.
8.3.1.4 Declarative Modules
A well-recognized method for reducing conceptual and progra&ng complexity involves structuring a model as a set of distinct modules with well-defined interfaces. Modular design facilitates collaborative model con- struction, allowing teams of specialists to work independently on different modules. Modules can be archived in distributed libraries and serve as a set of templates to speed future development.
The most common approach to model integration, which involves linking procedural models through the use of distributed object formalisms, is greatly limited by the fact that the various submodels are, by their nature, overspecified as modules. That is, in the process of implementing a sub- model in a procedural programming language, the modeler generally "hard codes" many choices, such as programming language, spatiotemporal representation, model control and input/output (VO) interfaces, and computing paradigm (e-g., serial or parallel message passing). These fixed aspects are extremely limiting and irrelevant to the essential dynamics of the model. To improve flexibility, it is useful to develop a formalism for coding archivable modules that allows maximum generality and appli- cability of the modules. This formalism can be accomplished through declarative module specifications containing only enough information to specify the essential dynamics of the module and allowing a wide range of customized procedural implementations (Maxwell 1999; Maxwell and Gostanza 1997a,b). This approach provides the high level of abstrac- tion necessary for maximum generality, yet provides enough detail to allow a dynamic s&ulation to be produced automatically. The approach separates general specifiwtions from site-specific specifications. Because only the universal blueprints are included in the module specification,

146 Eric Custafson et al,
the site-specific specializations can be delegated to a separate model- configuration phase. Examples of declarative-modeling formalisms include the Simulation Module Markup Language (SMML) (Mawell 1999; M m e l l and Costanza 1997b), the Integrated Modeling Architecture being developed at the University of Maryland, and the Modelica modeling lan- guage being developed by EUROSIM (Federation of European Shulation Societies; http:/lws3.atv.tuurien,ac.atleuros~.
As an example of a declarative module specification, consider the follotving SMML declaration representing a deer-population state variable. The specification defines a set of input ports that will be linked to the output ports of other modules with "link" statements and an equation that is used to update the value of DEER-POPULATION in response to event notifi- cations. An SMML-model declaration does not specify IIO configuration, memory allocation, temporal dynamics, and spatial-grid configuration. The code describing these aspects of the model is generated automatically at the initiation of a simulation run based upon site-specific configuration information.
(atom name="DEER-POPULATION7 type="state") (port type-."input" namsuDEER-BIRTHS" /) (port type="input" ~~I~~="DEER-STARVATION'~ /) (port type="input" name="DEATI-FS-FROMMPREDATION77 /) (dynamic event="integra te" type="code" ) (code) ((DEER-BIRTHS-DEER-STARVATION)-DEATHS-FROM-
PREDATION) (Icode)
8.3.1.5 Control Theory Models and Spatial Optimization Models
Spatial dynamics present difficult challenges to ecological modelers. A central issue in computational ecology is Linking the demand for biological resources with the dynamics of those resources (Gross and DeAngelis 2001). These resources do not occur uniformly in space, and managers seek some control over this heterogeneity (Hof and Bevers 1998). Given a variety of criteria for managing a system, how should the "control" of the system be applied spatially in order to optimize the objective?
A large body of literature deals with optimization of outputs that vary as components of the system are controlled (Clark 1976). A comparable body of literature for spatial problems is only beginning to be developed (Hof and Bevers 1998; Jager and Gross 2000). Hof and Bevers (1998) provide examples of spatial optimization on a spatial grid through the use of limited state variables and mixed-integer programming methods to develop management solutions. Management objectives include designing species reserves, maximizing biological diversity, and maintaining population sizes above specific thresholds in stochastic environments The computational limitations in solving optimization problems are both discouraging and encouraging. The size of feasible problems is severely restricted, but the

8. Evolving Approaches and Technologies 147
computational lhitations have prompted the development of new anafy- tical and computational methods (particularly on parallel processors) that are discussed later in this chapter.
Other approaches to spatial optimization include the combinatorial inter- change technique to minimize spatial fragmentation (Loehle 1999) that extends the stochastic search algorithms of Bettinger et al. (1997). This approach cannot readily link to dynamic models to predict population responses to fragmentation, but it is computationally efficient compared to mixed-integer programing methods. A Markov-decision approach can be applied to optimize landscapes for metapopulations ('Ihck and Possingham 2000). This method allows simple dynamics of localized patches to be included, but the size of the problem increases exponentially with the number of states allowed. Other algorithms have been applied to attempt to specify optimal spatial-reserve patterns for biodiversity conservation (Csuti et al. 1997; Pressey et al. 1997), although they ignore population dynamics.
8.3.1.6 New Methods for Developing Statistical Models
New techniques are also being developed to improve our ability to produce ecological statistical models and to handle increasingly large data sets. Traditional multivariate linear-regression tools are useful for finding global effects, especially with sparse data sets. For data mining (finding previously unknown, significant relationships between variables in large data sets), there is no need to assume global structure. Local data can r e h e global rules by adding conditions to global rules. The resulting regression is thereby determined by local conditions. Classification and regression tree analysis (RTA) uses iterative splitting of the data to develop empirical rela- tionships between response and predictor variables without the restrictive distribution assumptions of classical regression analysis. This approach creates models that are fitted by binary recursive partitioning, in which a data set is successively split into increasingly homogeneous subsets (Clark and Pregibon 1992). Regression tree analysis is much more flexible than classic statistical met hods in uncovering structure in data with variables that are hierarchical, nonlinear, nonadditive, or categorical in nature. Regression tree analysis is useful as a means of devising prediction rules for rapid and repeated evaluation, as a screening method for variables, as a diagnostic technique to assess the adequacy of linear models, and for summarizing large multivariate data sets (Clark and Pregibon 1992; Iverson et al. 1999).
Multivariate adaptive-regression splines (MARS) is a multivariate, nonparametric regression procedure that builds flexible regression models by fitting separate splines (or basis functions) to distinct intervals of the predictor variables (Friedman 1991). The variables and interactions to use and the endpoints of the intervals for each variable are optimized

148 Eric Gustafson el al.
simultaneously by evaluating a "loss-of-fit" criterion. Multivariate adaptive- regression splines also search for interactions between variables, allow- ing any degree of interaction to be considered. It uses adaptive regression, guiding the function being estimated by the local nature of the data, W e r e RTA excels at detecting local data structure and marginal interaction effects between predictor variables, MARS excels at detecting global and linear local data structure, flexibly modeling relationships that are additive or that involve interactions between predictor variables (Prasad and Iverson 2001). The discontinuous branching of RTA is replaced with a con- tinuous, smooth response surface. Multivariate adaptive-regression splines provide an automatic, nonlinear stepwise regression tool that is particu- larly useful where variables need transformation and where interaction effects are likely to be relevant.
8.3.1.7 Providing Improved User Interfaces to Make Models Accessible
Ease of use is a key criterion for the acceptance or rejection of a model by managers, and the user interface provides the biggest opportunity for the modeler to improve ease of use. Most users of computer software now expect a graphical user interface (GUI). When the GUI is designed to be intuitive, consistent, and not redundant and to have a logical flow, potential users will be more likely to explore the utility of the model (Jacucci et al. 1996). A large number of GUI-development software packages are avail- able to aid the construction of GUIs for models coded in almost any high- level language. A model GUI may also feature sophisticated graphical or animated output of model results, making them more readily interpreted and allowing more efficient evaluation of multiple model runs (e.g., see Figure 8.4). Object linking and embedding (OLE) and dynamic data exchange (DDE) are capabilities to embed or link data from one appli- cation software within a Ne of another software package. Dynamic data exchange might be used to link a spreadsheet model to a simulation model, for example. Hypertext markup language (HTML) and other Web-oriented code can be used to allow distributed modeling over the Internet. Spatial models are often constructed with a custom user interface (e-g., ArcView extensions). A common result of an enhanced user interface is an improved likelihood that decision makers will apply the model,
8.3.1.8 New Computational Technologies
Our discussion has alluded to the limits of computational technology on the development of ecological models. Computational science has combined elements of computer science, information technology, scientific modeling, and numerical analysis to allow new approaches to old problems previously handled by approximations and to deal with new problems previously considered intractable. Distributed computing combines the computing resources of separate machines that may be collocated or physically distant

8. Evolving Approaches and Technologies 149
from each other. An example is a Monte Carlo simulation in which many repeated stochastic evaluations are distributed to several machines and returned to a single machine for collating and analysis Any resource analy- sis problem involving multiple independent simulations can be conducted in this manner, with the main constraints being the control of the distribu- tion of tasks to various machines and the load balancing required so that
- - - - - - the final compilation of results is not delayed by machines that are slower than others. This method is appropriate to problems like the evaluation of multiple alternative scenarios.
Grid computing is somewhat more complex, involving not just simulta- neous use of processing power, but the heterogeneity of resources available across a grid of machines (Foster and Kesselman 1999). An example would be the activation of and downloading of real-time data from a remote sensor, the automated processing of a query to a database for related data located on one machine, providing all of the assembled data as input to a simulation on a second machine, and processing the output of the simulation for visualization and analysis on a third machine. The major challenge in grid computing is the development of a software interface (middleware) to allow a user to analyze a problem without having to know the details of where the software, databases, available central processing unit (CPU) cycles, and other resources are located on the grid. The ideal system would allow a resource manager to pose a question (with appro- priate constraints) and the middleware to assign appropriate components to different machines on the grid, automatically handling load balancing, error checking, collating, and returning of the results to the user. For example, a question might be posed regarding the effects of different land- use patterns in the future of water demands in a region. The middleware would request land-use history maps from a GIs database, send these to a machine for spatial analysis, and conduct a simulation to project alternative futures [as is done in the LUCAS system; see Hazen and Berry (1997)J.The middleware would concurrently obtain information on water-use history from a different database, correlate this information with land-use patterns, combine the water-use and land-use simulations, and provide the results to the user. Such middleware is well beyond current capabilities, but the soft- ware technology needed is developing rapidly (see the GLOBUS project at http:llwww.globus.org).
Alternatively, parallelization methods speed processing by breaking the problem into pieces that can be processed separately. Many ecological modeling problems clearly fit within this framework, including problems involving repeated simulations with alternative inputs, sensitivity analyses obtained by varying simulation parameters, and uncertainty analyses obtained by including or excluding certain model components or assump- tions. Another benefit of parallel architectures is an improved ability to model situations that are essentially parallel in reality. Ecological systems are inherently parallel because many components vary concurrently in time
150 Eric Gustafson et al.
and space, and interact at numerous scales. Developing appropriate paral- lel implementations to model these interactions is quite difficult, and only limited research has been conducted. However, the availability of parallel architectures for ecological modeling allows one to conceptualize models that may be considerably more realistic than strictly serial implementa- tions would be. For example, Mellott et al. (1999) investigated parallel methods for an individual-based predator-prey model and point out that the parallel implen~entation involved quite different assumptions about individual movements and interactions than were necessary in a prior serial implementation.
8.3.2 Relevance of Advances in Model Implementation for Decision Making The advances in model implementation outlined above will enhance deci- sion making in the long term by allowing modelers to improve the sophis- tication and relevance of models. Public expectations of resource managers are steadily increasing, requiring more-definitive abilities to predict the consequences of management actions. Much of the information currently needed by managers is not available because the models have not yet been developed or provide inadequate information. This void exists, at least partly, because of limitations in computing power or analytical and conceptual-modeling capabilities. A combination of technological advances and improved dialogue between modelers and managers is needed to fully realize the potential of ecological models to enhance environmental decision making.
8.4 Communicating Model Structure and Output
Managers are reluctant to use model results for making decisions unless they are confident that they understand how the model works and that the model, in fact, accurately produces the information they require. Models that are perceived as an incomprehensible black box will not be widely used by managers. Consequently, it is critical that an implemented modeling system be adequately explained and communicated both to managers and to stakeholders affected by management decisions. A number of techniques are available to enhance the communication of models to decision makers, making their structure and function more transparent.
8.4.1 Approaches and Technologies 8.4.1.1 Artificial Intelligence
Artificial intelligence (AI) refers to a branch of computer science focused on problems associated with the acquisition, representation, and utilization

8, Evolving Approaches and Technologies 151
of knowledge (Schmoldt and Rauscher 1996). One goal of A1 research is to program computers to produce seemingly "intelligent" behavior, and this ability has several applications in ecological modeling. A1 can provide an '~nte1ligent'~nterface with a model, providing context-sensitive help and direction in using the model, and it can provide guidance in interpreting the results. Communication of model characteristics can be aided by interfaces that allow users to click on icons of model modules to delve deeper into the structure and assumptions behind each piece of the model. Each icon can be expanded to show the underlying knowledge used to describe the associated process and the interactions between processes. Examples of this kind of representation are the STELLA-based models (Hannon and Roth 1997) and the logic-based models mentioned in Section 8.2.2.
8.4.1.2 Gaming
Communication of model results can also be enhanced when simulation models are used in a gaming environment to determine strategies that are optimal for achieving goals. Came theory involves the mathematical analy- sis of abstract models of strategic competition. Such models are often used in military and economic planning and more recently in land-use decision making. In these games, the rules are clearly set fonvard, but the ramifica- tions of these rules are not always apparent even though (or perhaps because) they are determined by feedback loops within the system. Some- times unexpected or random events (such as storms) are simulated in the models. It is critical that the permissible actions, information available to each participant, and criteria for termination of the game be made clear. Typically, there is no single way to win such a game. Optimal strategies depend upon the goals of the player, and developing a variety of potential actions may help determine appropriate strategies to attain the desired outcome. The advantage of using a gaming approach in environmental decision making is that the options of decision makers can be set forward without the expense or time involved in actually implementing such options. The engaging nature of these games causes the user to become more involved in thinking about the process and interactions than they would without the gaming tool.
8.4.1.3 Dealing with Uncertainty
A key element of model communication involves appropriate attention to the uncertainties in the data, model structure, and model projections. Models always contain some errors and inaccuracies because they are simplifications of reality. One of the critical tasks in the use of models is to identify sources of uncertainty and describe the effects of these uncertain- ties on model predictions so that the output of the model can reliably support decision making.
Two strategies are available for dealing with model uncertainty. Many population models embrace and acknowledge uncertainty by selecting

152 Eric Gustafson et al.
model parameters from a distribution of values instead of choosing a single value for a parameter. With this strategy, a relatively simple mode1 is run numerous times (hundreds or thousands), producing a distribution of possible model outputsne modeler acknowledges uncertainty because the multiple model outputs are generally presented in a statistical form (e.g., 20% of the possible outcomes result in a 10% decrease in population size). In this context, the modeler presents the results in terms of the risk of a certain event occurring. Unfortunately, probabilistic formulations of model outputs may be confusing for decision makers because clear, unequivocal answers are not provided.
An alternative to model-based risk assessment is the use of large, comprehensive models that attempt to duplicate critical natural processes. These models typically have lengthy run times, so that running them hundreds or thousands of times is not feasible. Additionally, these models are typically used for regulatory purposes, where relative answers may be insufficient. These models typically use engineering methods to optimize model parameters and to confirm the performance of the simulation. While it is not possible to remove all sources of error and uncertainty from these models, efforts are generally made to optimize model performance, to iden- tify model sensitivity to key parameters through Monte Carlo simulation (in which certain model parameters are randomly changed), and to describe the error structure of the model by comparing model predictions to observed data. Error analysis helps the modeler identify weaknesses of the model or biases (particuIar scenarios in which certain state variables may be systematically underestimated or overestimated). This explicit representation of uncertainties tends to enhance communication only for modelers who are comfortable with large, comprehensive models (and not necessarily for decision makers).
8.4.1.4 Model Standards
Effective communication of model results depends upon adherence to certain standards in model development. Ecological models are used in at least two ways, conceptual exploration (research) and projection (decision making). Exploratory models are used to better understand complex natural processes so that the driving variables and relationships bet ween variables can be studied. Exploratory models are often highly specialized, and their accuracy is evaluated in terms of the statistical variation explained by a model. Alternatively, models used in a regulatory context to support decisions and determine policies are often developed and applied by the engineering profession. Development of engineering models is usually founded on a mathematical description of conservation of mass and momentum principles Model documentation and confirmation are critical elements in establishing the credibility of a model and its application. It is important that models, particularly those used in a regulatory context, be
8. Evolving Approaches and Techologies 153
described in detail and that important steps in the development of a model be referenced. 'This specification allows users of the model to trace the development of its mathematical formulations and conceptual underpin- nings to ensure that the model is properly applied. Such documentation allows models to be categorized by application, dimensionality, spatial discretization strategy, solution scheme, and temporal strategy. Within each category, efforts should be made to standardize ecological models to increase their ease of use and to increase their reliability. All model appli- cations should undergo a rigorous, documented confinnation process involving parameterization (estimating optimum values for model param- eters), calibration (adjusting model parameters and model formulation to match observed data with model predictions), and validation (verifyiig that the model works correctly on a data set different from the data set used for model calibration).
8.4.1.5 Visual Output
Visualization is a very powerful form of communication, as epitomized in the adage that "a picture is worth a thousand words." For models with a spatial component, GIs provides tremendous communication potential by placing model inputs and intermediate and final results in a spatial context. A good example is a model predicting gray wolf habitat in the northern lake states (Mladenoff et al. 1995). By showing the spatial distribution of input variable values and the results of model calculations, the authors make a compelling case for the utility and validity of their model.
The GIs also provides a framework for integrating information from different modeling paradigms. An example is the development of integrated forest management models, where a GIs provides the integration for timber optimization models and process models predicting wildlife habitat and biological diversity (Naesset 1997). The optimization model produces treat- ment schedules for forest stands, the locations of which are tracked in. the GIs. A spatial model that can access the GIs can assess the potential effects on wildlife when those specific stands are harvested. Fiially, GIs can act as a catalyst for stakeholder involvement (Cornett 19%). People find it much easier to relate to ~sualizations of data and concepts than to text and numbers. Because "seeing is believing," spatial representations of model results can lower skepticism and increase the involvement of stakeholders in the decision-making process. Maps, animations, or virtual reality pictures are understood by most users (Shepard 2000). For example, FORSYS (a cooperative for forest systems engineering) is developing graphical systems to represent the data gathered by the national forests to visually demon- strate alternative management practices (McCaughy 2001).
While model and data visuatizations may be very useful, there are limi- tations. Just as graphs can be constructed in ways that are misleading, the huge variety of color schemes available can cause the same data to be

154 Eric Gustafson et al.
interpreted quite differently. Visualizations of results should take account of the limitations and variations in human sight (Agoston 1987). Up to 8% of some human groups are partially color-blind (color-deficient or dyschro- matopic). Ecological model applications should use color schemes that allow major results to be appropriately interpreted by these individuals (Curnutt et al. 2000).
8.4.2 Communicating Model Assumptions and Results for Decision Making The development of high-quality ecological models will not contribute to decision making unless they provide the information that managers want. To build relevant models, the modeler must consult with managers or stake- holders from the conceptualization stage through validation and use. This level of communication will develop an understanding and trust in the model by the users, giving them a full knowledge of its strengths and weak- nesses, what assumptions were made, what shortcuts were taken, and how all of these affect the validity of the model. If the managers are uncom- fortable with some of the assumptions, they may collect the data needed to fill in the knowledge gaps highlighted by the modeling process. This involve- ment will instill a sense of ownership and trust in the model output.
8.5 Case Studies Using New Modeling Approaches for Decision Making
Two case studies illustrate how intractable resource management problems can become manageable through the use of ecological models.
8.5.2 Computational Fluid Dynamics Model for Fish Movement Detailed fish swim-path selection at small scales can be simulated by coupling a computational fiuid dynamics (CFD) model with a fish move- ment model (NFS) to design fish passages around turbines in a hydroelec- tric dam. The CFD model (the Eulerian-reference framework) describes the physical domain as a fine-scale grid composed of multiple cells. The CFD module provides discrete representations of the flow field (data are presented at cell nodes or cell faces only), and the Lagrangian module provides the framework necessary for depicting movement of individual fish (Figure 8.5).
The linkage between the CFD model and the NFS model is built with a common engineering tool known as a partide tracker (described earlier). With the coupled framework, a fish track can be envisioned as a sequence

8. Evolving Approaches and Technologies 155
Euferian Reference Frame Lagrangian Reference Frame
FIGURE 8.5. Merging CE;D output data that uses a Eulerian reference frame with fish-track data that use a Lagrangian reference frame onto a single geospatial framework creates a coupled Eulerian-Lagrangian frame of reference.
of position pairs comprising an initial and sequential position, with the change in position determined by the sum of two different vector processes, passive transport and volitional swimming. Over short time steps (a second or less), a fish must be swimming headfirst into the current if its displace- ment is less than what would be predicted by passive transport because fish generally do not swim backwards. Conversely, if its displacement was greater than would be predicted by passive transport alone, it must be swim- ming with the current (Figure 8.6).
The simple logical progression presented by Figures 8.5 and 8.6 can become the basis of an analytical or statistical procedure to unravel how fish respond to hydraulic fields. Hydraulic information at nodes from the CFD output can be interpolated to the initial position of each position pair. With this information, it is reasonable to pose the two fundamental ques- tions of fish swim-path selection presented in Figure 8.7: (1) What hydraulic conditions determine whether a fish is oriented with or against the current? (2) What hydraulic conditions determine the magnitude of volition swirn- ming once the fish's orientation is known? Of course, the same logic applies to each of the vector directions.
The swim-path behavior of the virtual fish can be summarized in various ways to support decision making. For example, exit pathways of virtual fish can be summarized as the proportion using a preferred pathway, such as bypass system, versus a less-desirable passage, such as through the turbines. Such predictive simulations can be used to select optimum fish passage or fish protection designs or operations.

156 Eric Gustafson et al.
If totaI movement greater than passive transport, then fish swims with flow:
If total movement less than passive transport, then fish swim against flow:
FIG- 8.6. Hydraulic conditions interpolated to the position of the fish can be used to transport the fish through the CF'D grid as though it were a neutrally buoyant, passive particle. The predicted location of the fish under passive transport can be subtracted from the known position of the fish at the next time step. The difference between the two distances represents the direction and extent of volitional swirn- ming by and the random velocity component of the fish.
of hydraulic variables at position is the best discriminators of headfirst vs tailfirst orientation at position ti+, in
I Position t, l I JF
FIGURE 8.7. By comparing fish total displacement to passive transport, it then becomes possible to ask two fundamental questions.
8, Evolving Approaches and Technologies 157
Update: Fish Locatioflassage i
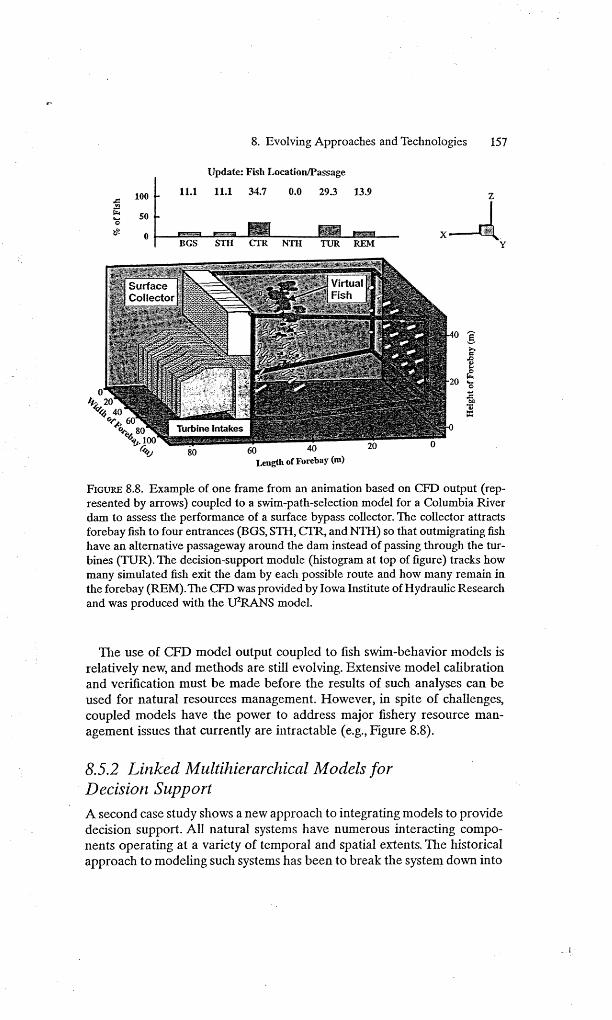
FIGURE 8.8. Example of one frame from an animation based on CFD output (rep- resented by arrows) coupled to a swim-path-selection model for a Columbia River darn to assess the performance of a surface bypass collector. The collector attracts forebay fish to four entrances (BGS, STE-I, CTR, and NTH) so that outmigrating fkh have an alternative passageway around the dam instead of passing through the tur- bines (TUR). The decision-support module (histogram at top of figure) tracks how many simulated fish exit the dam by each possible route and how many remain in the forebay (WM).The Cm> was provided by Iowa Institute of Hydraulic Research and was produced with the WKANS model.
The use of CFD model output coupled to fish swim-behavior models is relatively new, and methods are still evolving. Extensive model calibration and verification must be made before the results of such analyses can be used for natural resources management. However, in spite of challenges, coupled models have the power to address major fishery resource man- agement issues that currently are intractable (e.g., Figure 8.8).
8.5.2 Linked Multihierarclzical Models for Decision Support A second case study shows a new approach to integrating models to provide decision support. All natural systems have numerous interacting compo- nents operating at a variety of temporal and spatial extents. The historical approach to modeling such systems has been to break the system down into

158 Eric Gustafson et al.
interacting subcomponents described by a dynamical system (typically ordi- nary differential equations) and to connect these compartments by Bows of material among them (e.g., biomass and nutrients). However, this method forces the modeler to use only one mathematical approach to structure the system. New methods are developing to allow linkages among system components that take into account differing levels of detail to describe the interactions between them. Advocates of this multimodeling methodofogy argue that the use of a single modeling approach is inappropriate for prob- lems spanning a wide variety of temporal, spatial, and organismal scales. Multimodebg does not refer to multiple models representing the same components of a system to determine the importance of additional detail. Rather, it refers to using different modeling approaches for different components of the system and linking these different models to study the interactions among the components.
One example of such a multimodel is the ATLSS (Across Trophic Level System Simulation) project, constructed to aid analysis of the ecological impacts of planning for the hydrologic restoration of the Everglades of South Florida (DeAngelis et al. 1998). The ATLSS uses a mixture of approaches based upon the inherent temporal and spatial resolution and extent of various trophic components, linked together by spatially explicit information on the underlying environmental (e.g., water and soil-structure), biotic (e-g., vegetation), and anthropogenic (e.g., land-use) factors-The linked components include spatially explicit indices (Curnutt et al. 2000), compartment models, differential equations for structured popu- lations and communities (Gaff et al. 2000), and individual-based models (DeAngelis et al. 2000). Linking models that operate at very different spatial and temporal extents is a major challenge, requiring a variety of spatial interpolation methods (Luh et al. 1997) and careful design of model inter- faces (Duke-Sylvester and Gross 2002). The multimodeling approach can readily be expanded to include economic, land-use, and human-population impacts, although this will require careful error-propagation analysis.
8.6 Lessons Learned from Earlier Modeling Approaches
The application of ecological models by managers has sometimes fallen short of expectations. An analysis of two examples may be instructive for ecoIogical modelers in general.
The FORPLAN linear-programming (LP) model was the primary analyti- cal tool used by the U.S. Department of Agriculture (USDA) Forest Service for natural resource analysis and forest planning in the 1980s (Iverson and Alston 1986). However, FORPLAN fell from favor by the mid-1990s
8. Evolving Approaches and Technologies 159
because three interacting factors collectively undermined the acceptability of FORPLAN solutions.
The first h t o r was the rapidly increasing public interest and participa- tion in natural resource management decision making (Behan 1990; Knopp and Caldbeck 1988; Wondolleck 1988). The second factor was the agency's strategic mistake of reducing all major aspects of the problem to a single LP solution, making the models very large and often requiring dubious transformations of information in the process. But the third factor, the diffi- culty of explaining the derivations of FORPLAN solutions, was perhaps the most problematic (O'Toole 1983). With enormous public interest in the management implications of model solutions, this final factor was a fatal flaw.The lesson for modelers with a stake in resource management is simple: scientifically sound models are a necessary, but not sufficient, condition for successful model application in the modern public arena of resource management. Increasingly, models are expected to explain themselves in convincing and intuitive ways.
8.6.2 Habitat Suitability Index Models Another example of a modeling approach that fell short of expectations is Habitat Suitability Index (HSI) modeling. Such models have been de- veloped for a wide variety of wildlife species as part of a formal habitat- evaluation procedure that was extensively applied by the U.S. Fish and Wildlife Service (Verner et al. 1986). These models focus on providing a simple, formalized method for assessing impacts on wildlife habitat. The HSI models attempt to provide information useful to managers on the site characteristics that affect the use of particular habitats by a species. The models typically consist of simple relationships among habitat quality and multiple characteristics, such as canopy cover, diameter classes of trees and
. shrubs, tree stem densities, area of open water, and distance to forest cover. The objective is to combine these variables to provide an overall index of suitability.
The 13SIs are based on local habitat variables, ignoring species interac- tions except those caused by the indirect effects of related habitat variables. Early HSI models ignored most landscape characteristics, making the models inappropriate for situations where the sizes, shapes, edge effects, and neighborhood relationships of habitats have a greater effect on habitat pre- ference than local forest composition and structure. Because they are based only upon habitat variables, they cannot take account of historical factors driving local abundances, such as demography. Nor can they deal with the absence of species resulting from interactions not described by the given habitat variables, such as restrictions caused by pathogens. Considerable effort to develop new methods to ameliorate some of these limitations have been developed recently, making extensive use of remote-sensing methods (Scott et al. 2001). Though inherently static entities, HSIs can also be extended to include the dynamics of underlying environmental factors,

160 Eric Gustafson et al.
taking account of different scales of species response both temporally and spatially (Gurnutt et al. 2000).
8.7 Recommendations and Conclusions
What do these evolving approaches mean for ecological modelers? Advances in technology have progressively allowed ecological modelers to focus more of their creativity and intellect on the formulation of models (design and structure) and less on the mechanics of modeling (computer coding and debugging). Furthermore, advances in the sophistication and reliability of ecological models have attracted the attention of decision makers, who hope that models may provide critical understanding that is currently lacking. However, a gap remains between the models developed by researchers to answer research questions and the predictive tools needed by managers for sound natural resource management decisions. The ques- tions of interest to researchers may not be directly relevant to resource managers. Our strongest recommendation for ecological modelers who wish to be relevant to managers is to talk to managers! Modelers often fail to build relevant models primarily because their perception of the needs of managers is flawed.
However, new technologies have the potential to revolutionize the field of ecological modeling. Technology is beginning to overcome many of the traditional barriers to linking models and dealing with the thorny scale issues of the past. Technology provides tremendous efficiencies by making collaborative model development easier and allowing model components to be used in multiple ways. However, to fully exploit this potential, mod- elers must constantly strive to think in new ways. It is now possible to con- sider how technology can be used to model systems as they are understood rather than to struggle to represent the system within the limits of the technology. This possibility presents great opportunity.
EcologicaI models will be increasingly scrutinized in the public arena. They must be defensible (perhaps in court), transparent (in assumptions and structure), and thoroughly documented and tested. Consequently, modelers must give more attention to communicating with users, decision. makers, and stakeholders. The risks are high, but the needs for solid ecological models to provide decision support are growing and are critical. The payoff will come in the form of better resource management decisions and increased public support for ecological modeling research.
References Agoston, G.A. 1987. Color Theory and Its Application in Art and Design. 2d edition.
Springer-Verlag, Berlin, Germany. Behan, R.W 1990. RP-A: Solution to a nonexistent problem. Journal of
Forestry 88:20-25.

8. Evolving Approaches and Technologies 161
Bettinger P., J. Sessions, and K. Boston. 1997. Using Tabu search to schedule timber harvests subject to spatial wildlife goals for big game. EcoIogical ModeIiing 94: 11-123.
Boggs, W and M. Boggs. 1999. Mastering UML with Rational Rose. Sybex, San Francisco, California, USA.
Booch, G. 1994. Object-Oriented Analysis and Design with Applications. Benjarnid Cummings Publishing Company, New York, New York, USA.
Bormann, B.T., M.H. Brookes, E.D. Ford,A.R. Kiester, CD. Oliver, and J-EWeigand. 1994. Volume V: A Framework for Sustainable-Ecosystem Management. USDA Forest Service General Technical Report PW-GTR-331. USDA Forest Service,
- Pacific Northwest Research Station, Portland, Oregon, USA. Clark, C-W. 1976. Mathematical Bioeconomics: The Optimal Management of
Renewable Resources. John W e y & Sons, New York, New York, USA. Clark, L.A. and D. Pregibon. 1992. Tree-based models. Pages 377-419 in J.M.
Chambers and T.J. Hastie, editors. Statistical Models S. Wadsworth & BrookslCole Advanced Books & Software, Pacific Grove, California, USA.
Cornett, ZJ. 1994. GIs as a catalyst for effective public involvement in ecosystem management decision-making. Pages 337-345 in V.A. Sample, editor. Remote Sensing and GIs in Ecosystem Management. Island Press, Washington, Distract of Columbia, USA.
Csuti, B., S. Polasky, P.H. Williams, R.L. Pressey, J.D. Camm, M. Kershaw, A.R. Kiester, B. Downs, R. Hamilton, M. Huso, and K. Sahr. 1997. A comparison of reserve selection algorithms using data on terrestrial vertebrates in Oregon. Biological Conservation S0:83-97.
Curnutt, J.L., E.J. Comiskey, M.P. Nott, and L.5. Gross. 2000. Landscape-based spatially explicit species index models for Everglades restoration. Ecological Applications 10: 1849-1860.
Davis, L., K.N. Johnson, P. Bettinger, and T. Howard. 2001. Forest management. 4th edition. McGraw-Hdl, New York, New York, USA.
DeAngelis, D.L. and L.J. Gross, editors. 1992. Individual-Based Models and Approaches in Ecology. Routledge, Chapman and Hall, New York, New York, USA.
DeAngelis, D.L., L.J. Gross, M.A. Huston, W.E Wolf-E, D.M. Fleming, E.J. Corniskey, and S.M. Sylvester. 1998. Landscape modeling for everglades ecosystem restora- tion. Ecosystems 1:64-75.
DeAngelis, D.L., L.J. Gross, W.E WOE& D.M. Fleming, M.P. Nott, and E.J. Comiskey. 2000. Individual-based models on the landscape: Applications to the Everglades. Pages 199-211 in J. Sanderson and L.D. Harris, editors. Landscape Ecology: A Top-Down Approach. Lewis Publishers, Boca Raton, Florida, USA.
Duke-Sylvester, S. and L.J. Gross. 2002. Integrating spatial data into an agent-based modeling system: Ideas and lessons from the development of the Across Trophic Level System Simulation (ATLSS). Chapter 6 in H.R. Gimblett, editor. Integrat- ing Geographical Infomation Systems and Agent-Based Modeling Techniques for Understanding Social and Ecological Processes. Oxford University Press, Oxford, UK.
Ellison, A.M. 1996. An introduction to Bayesian inference for ecological research and environmental decision-making. Ecological Applications 6:1036-1046.
Foster, I. and C. Kesselman, editors. 1999. The Grid: Blueprint for a New Comput- ing Infrastructure. Morgan Kaufmann, San Francisco, California, USA.

162 Eric Gustafson et al.
Friedman, J.H. 1991. Multivariate adaptive regression splines (with discussion). Annals of Statistics l9:l-141,
Gaff, H., D.L. DeAngelis, L.J. Gross, R. Salinas, and M. Shorrosh. 2000. A dynamic landscape model for fish in the Everglades and its application to restoration. Ecological Modelling 127:33-52.
Gardner, R.H. and E.J. Gustafson. Simulating dispersal of juvenile American martens in heterogeneous landscapes. Ecological Modelling (submitted).
Goodwin, R.A., J.M. Nestler, D.P. Loucks, and R.S. Chapman. 2001. Method for simulating mobile populations in aquatic ecosystems ASCE Journal of Water Resources Planning and Management l27:386-393.
Gross, L.J., and D.L. DeAngelis. 2001. Multimodeling: New approaches for linking ecological models Pages 467-474 in J.M. Scott, P.J. Heglund, M. Morrison, M. Raphael, J. Haufler, and B. Wall, editors. Predicting Species Occurrences: Issues of Scale and Accuracy. Island Press, Covello, California, USA.
Halpern, D.F. 1989. Thought and bowledge: An Introduction to Critical Thinking. Lawrence Erlbaum Associates, Hillsdale, New Jersey, USA.
Hannon, B.M. and M. Roth. 1997. Modeling Dynamic Biological Systems. Springer- Verlag, New York, New York, USA.
Hazen, B.C. and M.W: Berry. 1997. The simulation of land-cover change using a distributed computing environment. Simulation Practice and Theory 5:489-514.
Hoi, J. and M. Bevers. 1998. Spatial Optimization for Managed Ecosystems Columbia University Press, Chichester, New York, USA.
Holling, C.S. 1992. Cross-scale morphology, geometry, and dynamics of ecosystems. Ecological Monographs 62:447-502.
Iverson, D.C and R.M. Alston. 1986. The Genesis of FORPLAN. A Historical and Analytical Review of Forest Service Planning Models. USDA Forest Service General Technical Report INT-214. USDA Forest Service, Intermountain Forest and Range Experiment Station, Ogden, Utah, USA.
Iverson, L.R.,A.M. Prasad, B.J. Hale, and E.K. Sutherland. 1999.An Atlas of Current and Potential Future Distributions of Common Trees of the Eastern United States USDA Forest Service General Technical Report NE-265. USDA Forest Service, Northeastern Research Station, Radnor, Pennsylvania, USA.
Jacucci, G., M. Foy, and C. Uhrik. 1996. Developing transportable agricultural decision support systems: Part 1. A conceptual framework. Computers and Electronics in Agriculture 14:291-300.
Jager, H.I. and L.J. Gross 2000. Spatial control: The final frontier in applied ecology. Review of J.G. Hof and M. Bevers. Spatial Optimization for Managed Ekosystems. Ecology 81:1473-1474.
Knopp, T.B. and E.S. Caldbeck. 1988. The role of participatoj democracy in forest management. Journal of Forestry 88:13-18.
Kolasa, J. 1989. Ecological systems in hierarchical perspective: Breaks in community structure and other consequences. Ecology 70:3647.
Levin, S.A. 1992.The problem of pattern and scale in ecology. Ecology 73:1943-1967. Loehle, C. 1999. Optimizing wildlife habitat mitigation with a habitat defragmenta-
tion algorithm. Forest Ecology and Management l20:245-251. Luh, H.-K., C Abbott, M. Berry, EJ. Comiskey, J. Dempsey, and L.J. Gross. 1997.
Parallelization in a spatially-explicit individual-based model. 1. Spatial data inter- polation. Computers & Geosciences 23:293-304.
8. Evolving Approaches and Technologies 163
Martin, J.L. and S.C. McGutcheon. 1999. Hydrodynamics and Transport for IVater Quality Modeling. Lewis Publishers, Boca Raton, Florida, USA.
Maxwell, T. 1999. A Parsi-model approach to modular simulation. Environmental Modeling and Software 1451 1-517.
Maxwell, T. and R. Costanza. 1997a. A language for modular spatio-temporal simulation. Ecological Modening 103:105-113.
h4axwel1, T. and R. Costanza. 19976. An open geographic modelling enviroment. Simulation Journal 68:175-185.
McGaughy, R.J. 2001. Envision Environmental Visualization System. Miscellaneous brochure. USDA Forest Service, Pacific Northwest Research Station, Portland, Oregon, USA.
Mellott, L.E., M.W Berry, E.J. Comiskey, and L.J. Gross. 1999. The design and implementation of an individual-based predator-prey model for a distributed computing environment. Simulation Theory and Practice 7:47-70.
Wadeno% D.J., T.A. Sickley, R.G. Haight, and A.P. Wydeven. 1995. A regional landscape analysis and prediction of favorable gray wolf habitat in the northern Great Lakes region. Conservation Biology 9:279-294.
Naesset, E. 1997. Geographical information systems in long-term forest manage- - ment and planning with special reference to preservation of biological diversity: A review. Forest Ecology and Management 93321-136.
Nestler, J.M. and V.K. Sutton. 2000. Describing scales of features in river channels using fractal geometry concepts. Regulated Rivers: Research and Management 16:l-22.
Nestler, J.M., R.A. Goodwin, D. Degan, and D. Dennerline. 2002. Simulating movement of Blueback herring in a southern impoundment using a CEL hybrid ecological model: Application and evaluation. Transactions of the American Fisheries Society 13:155-169.
O'NeiIl, R.V., A.R. Johnson, and A.W. King. 1989. A hierarchical framework for the analysis of scale. Landscape Ecology 3393-205.
O'Toole, R. 1983. A Citizens' Guide to FORPLAN. Cascade Holistic Economy Consultants, Eugene, Oregon, USA.
Prasad, A.M. and L.R. Iverson. 2001. Predictive vegetation mapping using a custom built model-chooser: Comparison of regression tree analysis and multivariate adaptive regression splines. Proceedings of the Fourth International Conference on Integrating GIs and Environmental Modeling (GISEM4): Problems, Prospects and Research needs (Banff, Alberta, Canada, 2-8 September 2000). CD-ROM. GISEM4, Boulder, Colorado, USA.
Pressey, R.L., H.P. Possingham, and J.R. Day. 1997. Effectiveness of alternative heuristic algorithms for identifying indicative minimum requirements for conser- vation reserves. Biological Conservation 80:207-219.
Rahel, FJ. 1990. The hierarchical nature of community persistence: A problem of scale, The American Naturalist W6:328-344.
Reynolds, K.M. 1999. Netweaver for EMDS Version 2.0 User Guide: A howledge Based Development System. USDA Forest Service General Technical Report PNrilf 471. USDA Forest Service, Pacific Northwest Research Station, Portland, Oregon, USA.
Reynolds, K.M. 2001. A logic framework for biological assessment of forest ecosys- tem sustainability. Journal of Forestry 99:26--30.
164 Eric Gustafson et al.
Reynolds, IS., M. Jensen, J. Andreasen, and I. Goodman. 2000. Knowledge-based assessment of watershed condition, Computers and Electronics in Agriculture 27: 315-333.
Schmoldt, D.L. and H.M. Rauscher. 1996. Building knowledge-based systems for natural resources management. Chapman and Hall, New York, New York, USA.
Scott, J.M., P.J. Heglund, M. Morrison, M. Raphael, J. Haufier, and B. Wall, editors 2001. Predicting Species Occurrences: Issues of Scale and Accuracy. Island Press, Covello, California, USA.
Shepard, S.R.J. 2000. Visualization as a decision-support tool in managing forest ecosystems The Compiler 16:25-40.
Stillings, N.A., M.H. Feinstein, J.L. Garfield, E.L. Rissland, D.A. Rosenbaum, S.E. Weisler, and W.L. Baker. 1987. Cognitive Science, An Introduction. MIT Press, Cambridge, Massachusetts, USA.
Tuck, G.N. and H.P. Possingharn. 2000. Marine protected areas for spatially struc- tured exploited stocks. Marine Ecology Progress Series l92:89-101.
Verner, J., M.L. Morrison, and C.J. Ralph, editors. 1986. Wildlife 2000: Modeling Habitat Relationships of Terrestrial Vertebrates. University of Wisconsin Press, Madison, Wisconsin, USA.
Walters, J.R. and N.R. Nielsen. 1988. Crafting Knowledge-Based Systems. John Wiley & Sons, New York, New York, USA.
Warburton, K. 1997. Social forces in animal congregations: interactive, motivational, and sensory aspects Pages 313-336 in J.K. Parrish and W.M. Hamner, editors. Animal Groups in Three Dimensions Cambridge University Press, New York, New York, USA.
Wondolleck, J.M. 1988. Public Lands Conflict and Resolution: Managing National Forest Disputes. Plenum Press, New York, New York, USA.
Zadeh, L.A. and J. Kacprzyk 1992. Fuzzy Logic for the Management of Uncertainty. John Wiley & Sons, New York, New York, USA.