8.1 - intro to the normal distribution and standardizing...
TRANSCRIPT

MDM4U%–%Module%3:%Statistics%!–!Unit!8:!The!Normal!Distribution!–!Lesson&1& !!!!!!!!!!Date:_________________!
Introduction%to%the%Normal%Distribution%%
A.%Recall…%Histograms!%
For!a!continuous!variable,!we!can!create!intervals,!populate!a!frequency&table,!and!graph!the!resulting!frequencies!as!a!histogram!or!a!polygon.!
A!histogram!can!be!“distributed”!(spread!out)!in!different!ways.!For!example:!!
1. it!can!have!a!“tail”!going!to!the!left!with!one!mode!(called!Negative1Skew)!…!!
! ! ! !!!
2. it!can!have!a!“tail”!going!to!the!right!with!one!mode!(called!Positive1Skew)!…!!
! ! ! !!!
3. it!can!have!more!than!one!mode!(Bimodal,!etc.)!…!!
%!
Images from: Pierce, Rod. (17 Dec 2012). "Normal Distribution". Math Is Fun. Retrieved 10 Mar 2013
from http://www.mathsisfun.com/data/standard-normal-distribution.html
Bimodal!

!
4. it!can!be!symmetric!about!the!mean!…!!
!
! !! There&are&many&cases&where&the&data&is&symmetric&around&a¢ral&value&with&no&bias&left&or&right.&& These&cases&happen&so&frequently,&in&fact,&that&this&type&of&distribution&is&called&a&“Normal1Distribution”.&
%
B.%Properties%of%the%Normal%Distribution%
Many!physical!quantities,!like!height!and!mass,!are!distributed!symmetrically!about!the!mean.!!Statisticians!
observe!this!“bell!curve”!so!often!that!its!mathematical!model!is!known!as!the!normal!distribution.!!
The!physical,!social!and!psychological!sciences!all!make!extensive!use!of!normal!models!!
&Cool&facts&about&the&normal&distribution:&
1. The!symmetric,!unimodal!form!of!the!distribution!makes!the!mode!equal!the!median!equal!the!mean!!
2. 50%!of!the!data!values!lie!below!the!mean!and!50%!of!the!data!values!lie!above!the!mean.!
3. The!normal!distribution!is!a!continuous!curve,!so!the!area!under!the!entire!curve!is!equal!to!1!or!100%.!!
!
Symmetric!
!
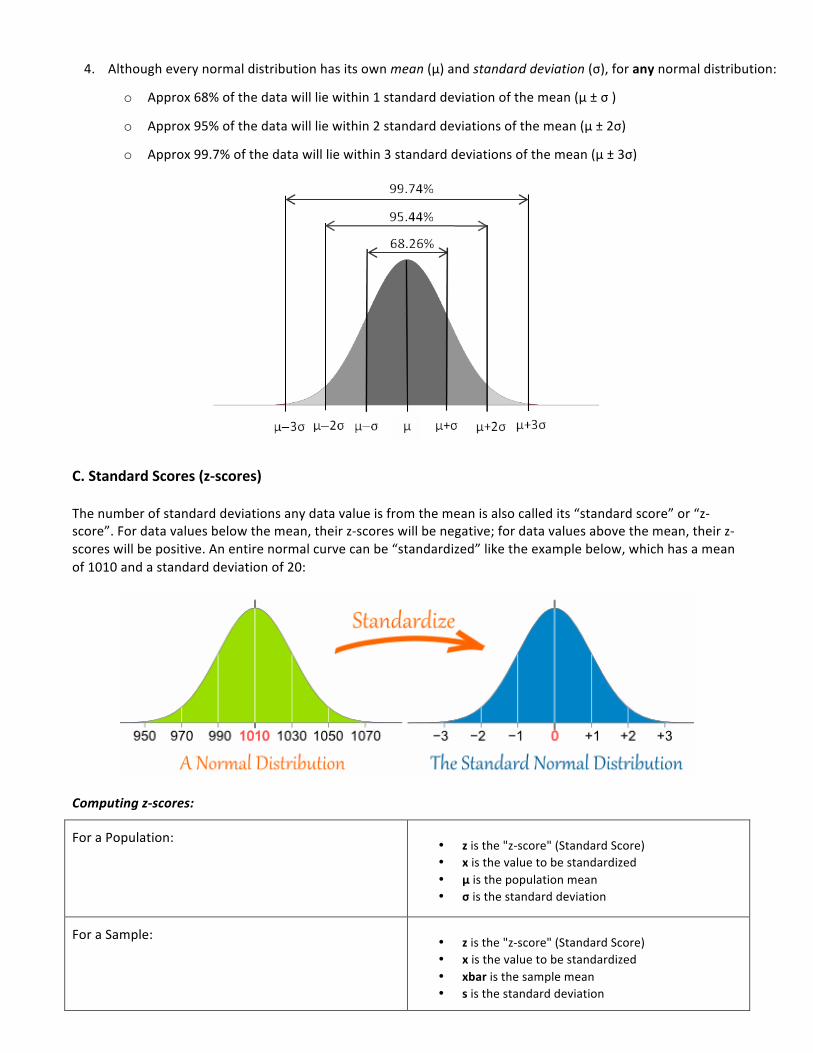
4. Although!every!normal!distribution!has!its!own!mean!(µ)!and!standard&deviation&(σ),!for!any!normal!distribution:!
o Approx!68%!of!the!data!will!lie!within!1!standard!deviation!of!the!mean!(µ!±!σ!)!
o Approx!95%!of!the!data!will!lie!within!2!standard!deviations!of!the!mean!(µ!±!2σ)!
o Approx!99.7%!of!the!data!will!lie!within!3!standard!deviations!of!the!mean!(µ!±!3σ)!
%%
%
%
%
%
%
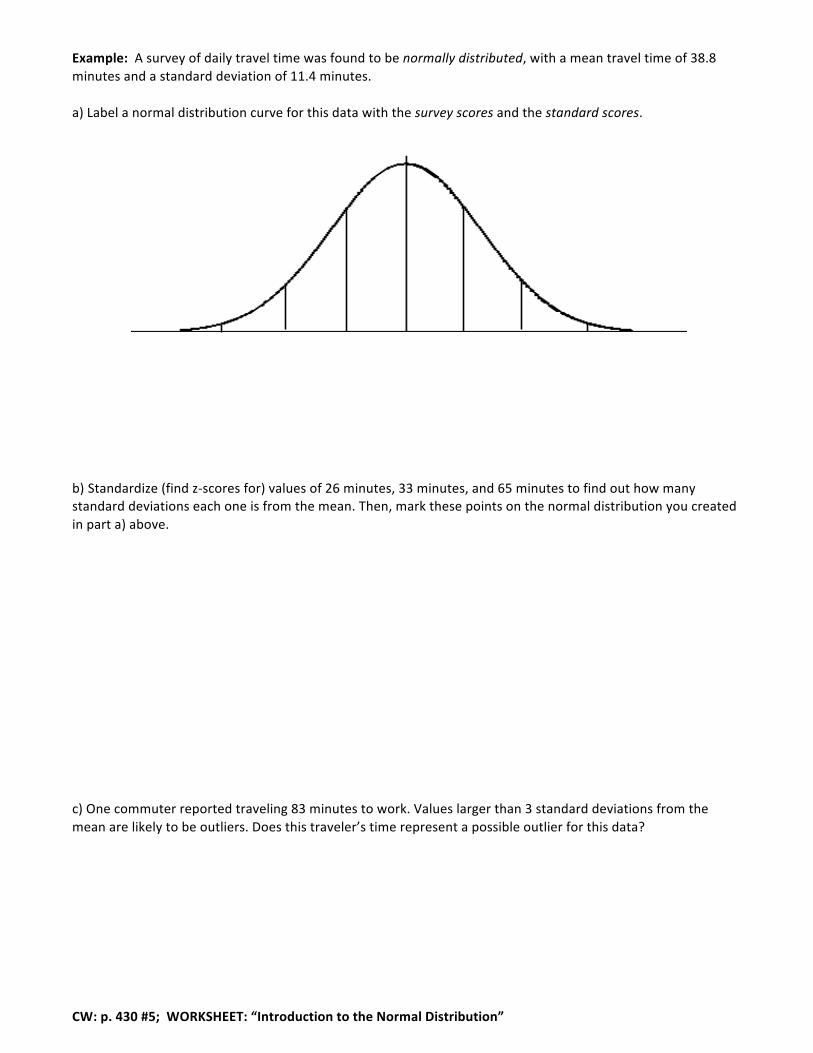
C.%Standard%Scores%(zJscores)%
The!number!of!standard!deviations!any!data!value!is!from!the!mean!is!also!called!its!“standard!score”!or!“z]score”.!For!data!values!below!the!mean,!their!z]scores!will!be!negative;!for!data!values!above!the!mean,!their!z]scores!will!be!positive.!An!entire!normal!curve!can!be!“standardized”!like!the!example!below,!which!has!a!mean!of!1010!and!a!standard!deviation!of!20:!
!
Computing1z>scores:1
For!a!Population:!!!!!!!!!!!!!!!!!!!!!!!!!!!
• z!is!the!"z]score"!(Standard!Score)!• x!is!the!value!to!be!standardized!• μ!is!the!population!mean!• σ!is!the!standard!deviation
For!a!Sample:!!!!!!!!!!!!!!!!!!!!!!!!!
• z!is!the!"z]score"!(Standard!Score)!• x!is!the!value!to!be!standardized!• xbar!is!the!sample!mean!• s!is!the!standard!deviation
!
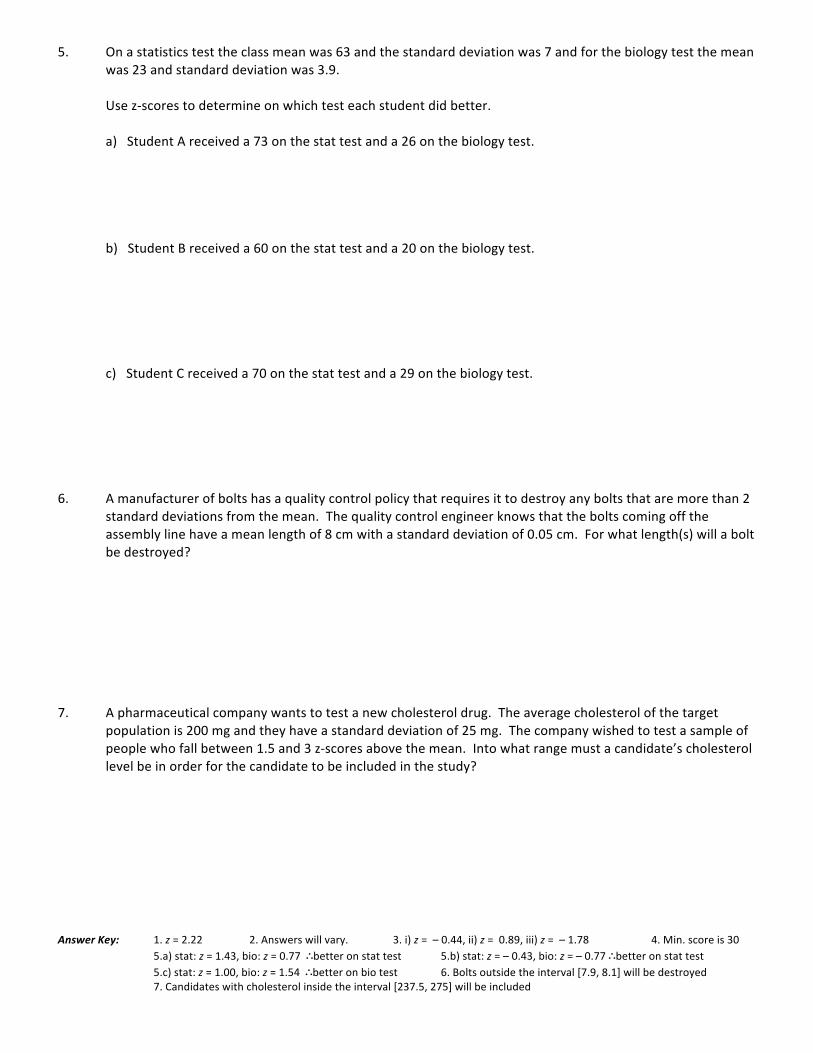
%Example:%!A!survey!of!daily!travel!time!was!found!to!be!normally&distributed,!with!a!mean!travel!time!of!38.8!minutes!and!a!standard!deviation!of!11.4!minutes.!!
a)!Label!a!normal!distribution!curve!for!this!data!with!the!survey&scores!and!the!standard&scores.!
%
!
!
!
!
!
!
%
!
b)%Standardize!(find!z]scores!for)!values!of!26!minutes,!33!minutes,!and!65!minutes!to!find!out!how!many!standard!deviations!each!one!is!from!the!mean.!Then,!mark!these!points!on!the!normal!distribution!you!created!in!part!a)!above.%
%
%
%
%
%%
%
c)!One!commuter!reported!traveling!83!minutes!to!work.!Values!larger!than!3!standard!deviations!from!the!mean!are!likely!to!be!outliers.!Does!this!traveler’s!time!represent!a!possible!outlier!for!this!data?!
%%
%%
%
CW:%p.%430%#5;%%WORKSHEET:%“Introduction%to%the%Normal%Distribution”%

MDM4U%–%Module%3:%Statistics%!–!Unit!8:!The!Normal!Distribution!–!Lesson&1& !!!!!!!!!!Date:_________________!
WORKSHEET:%“Introduction%to%the%Normal%Distribution”%% 1.! Find!the!z<score!corresponding!to!a!grade!of!52!from!a!normal!distribution!with!a!mean!of!48!and!a!standard!
deviation!of!1.8.!
!
!
!
!
!
!
!
2.! In!North!America,!adult!female!heights!have!an!approximate!normal!distribution!with!a!mean!of!65.0!inches!
and!a!standard!deviation!of!3.5!inches.!!Adult!male!heights!have!an!approximate!normal!distribution!with!a!
mean!of!70.0!inches!and!a!standard!deviation!of!4.0!inches.!!!
!
! What!is!your!height!in!inches?!!!!!________________!
!
! Find!the!z<score!of!your!height.!!!!________________!
!
!
!
!
!
3.! A!certain!brand!of!automobile!tire!has!a!life!span!of!35,000!miles!and!a!standard!deviation!of!2250!miles.!!If!
the!life!spans!of!three!randomly!selected!tires!are:!i)!34,000!miles,!ii)!37,000!miles,!and!iii)!31,000!miles.!!Find!
the!z<scores!that!correspond!with!each!of!these!mileages.!!Would!the!life!spans!of!any!of!the!tires!be!
considered!unusual?!!Explain.!
!
!
!
!
!
!
!
!
!
!
!
4.! A!highly!selective!university!will!only!admit!students!who!place!at!least!2<zscores!above!the!mean!on!the!ACT!
that!has!a!mean!of!18!and!a!standard!deviation!of!6.!!What!is!the!minimum!score!that!an!applicant!must!
obtain!to!be!admitted!to!the!university?!
!
!
!
!
!
!
!
!
!
!
!
5.! On!a!statistics!test!the!class!mean!was!63!and!the!standard!deviation!was!7!and!for!the!biology!test!the!mean!
was!23!and!standard!deviation!was!3.9.!
!
! Use!z<scores!to!determine!on!which!test!each!student!did!better.!
!
! a)!!!Student!A!received!a!73!on!the!stat!test!and!a!26!on!the!biology!test.!
!
!
!
!
!
! b)!!!Student!B!received!a!60!on!the!stat!test!and!a!20!on!the!biology!test.!
!
!
!
!
!
!
! c)!!!Student!C!received!a!70!on!the!stat!test!and!a!29!on!the!biology!test.!
!
!
! !
!
!
!
6.! A!manufacturer!of!bolts!has!a!quality!control!policy!that!requires!it!to!destroy!any!bolts!that!are!more!than!2!
standard!deviations!from!the!mean.!!The!quality!control!engineer!knows!that!the!bolts!coming!off!the!
assembly!line!have!a!mean!length!of!8!cm!with!a!standard!deviation!of!0.05!cm.!!For!what!length(s)!will!a!bolt!
be!destroyed?!
!
!
!
!
!
!
!
!
7.! A!pharmaceutical!company!wants!to!test!a!new!cholesterol!drug.!!The!average!cholesterol!of!the!target!
population!is!200!mg!and!they!have!a!standard!deviation!of!25!mg.!!The!company!wished!to!test!a!sample!of!
people!who!fall!between!1.5!and!3!z<scores!above!the!mean.!!Into!what!range!must!a!candidate’s!cholesterol!
level!be!in!order!for!the!candidate!to!be!included!in!the!study?!
!
!
!
!
!
!
!
!!Answer!Key:! 1.!z!=!2.22! 2.!Answers!will!vary.! 3.!i)!z!=!!–!0.44,!ii)!z!=!!0.89,!iii)!z!=!!–!1.78!!!! !!!!!!!4.!Min.!score!is!30!!
! ! 5.a)!stat:!z!=!1.43,!bio:!z!=!0.77!!∴better!on!stat!test! 5.b)!stat:!z!=!–!0.43,!bio:!z!=!–!0.77!∴better!on!stat!test!!! ! 5.c)!stat:!z!=!1.00,!bio:!z!=!1.54!!∴better!on!bio!test! 6.!Bolts!outside!the!interval![7.9,!8.1]!will!be!destroyed!!
! ! 7.!Candidates!with!cholesterol!inside!the!interval![237.5,!275]!will!be!included!!

MDM4U%–%Module%3:%Statistics%!–!Unit!8:!The!Normal!Distribution!–!Lesson&2& !!!!!!!!!!Date:_________________!
Probabilities%and%the%Normal%Distribution%%
A. Probabilities%and%the%Normal%Distribution%
A!probability%distribution!involves!the!probabilities!for!all&possible&outcomes!of!an!experiment.!A!random%
variable%(usually!uppercase!X)!must!be!defined,!which!has!a!single!value!for!each!outcome!(usually!lowercase!x)!in!the!experiment,!i.e.!P(X!=!x)!=!______.!
1. As!the!sample!size!approaches!infinity,!and!the!interval!widths!become!smaller!and!smaller,!the!relative!frequency!polygon!approximates!a!smooth!curve.!!!
!!!!!!!!!!!!! !!!!!!!!!!!!!! !
2. The!relative&frequency!(i.e.!frequency!÷!total)!for!each!interval!is!really!the!probability!of!finding!a!given!value!within!that!interval.!
3. If!we!shrink!the!interval!widths!down!to!an!infinitely!small!gap!(i.e.!they!essentially!represent!discrete!values!for!a!continuous!variable)!then!we!have!an!infinite&number&of&bars,!each!with!a!width!of!essentially!zero,!making!up!the!histogram!!!
4. This!relative!frequency!polygon!can!now!be!referred!to!as!a!continuous!probability!distribution,!where!the!area!under!the!curve!(i.e.!the!sum!of!all!the!bar!heights)!or!the!cumulative&relative&frequency!equals!1!(100%).!
%
B.%Using%the%Normal%Distribution%and%zCscores%to%Find%Probabilities%
• Because!of!the!infinite!number!of!possible!outcomes, the!probability!of!any!individual!outcome!for!a!continuous!random!variable,!X,!is!P(x)!=!______________!=!_____!.!!!!
• The!probability!of!a!range!of!outcomes,!however,!is!defined.!This!means!that!we!can!calculate!the!probability!that!a!given!value!will!fall!within!a!certain!interval![e.g.!P(X!<!5)].!!
• The!probability!for!a!range!of!outcomes!is!simply!the!area!between!these!values!under!the!normalYdistribution!curve.!These!areas!can!be!found!on!a!zCscore%table.!!
Relativ
e!Freq
uency!
Relativ
e!Freq
uency!
Relativ
e!Freq
uency!
Relativ
e!Freq
uency!
Random!Sample! Sample!size!↑;!Interval!width!↓!
Sample!size!↑!further;!Interval!width!↓!further! Normal!Distribution!for!the!Population!
%
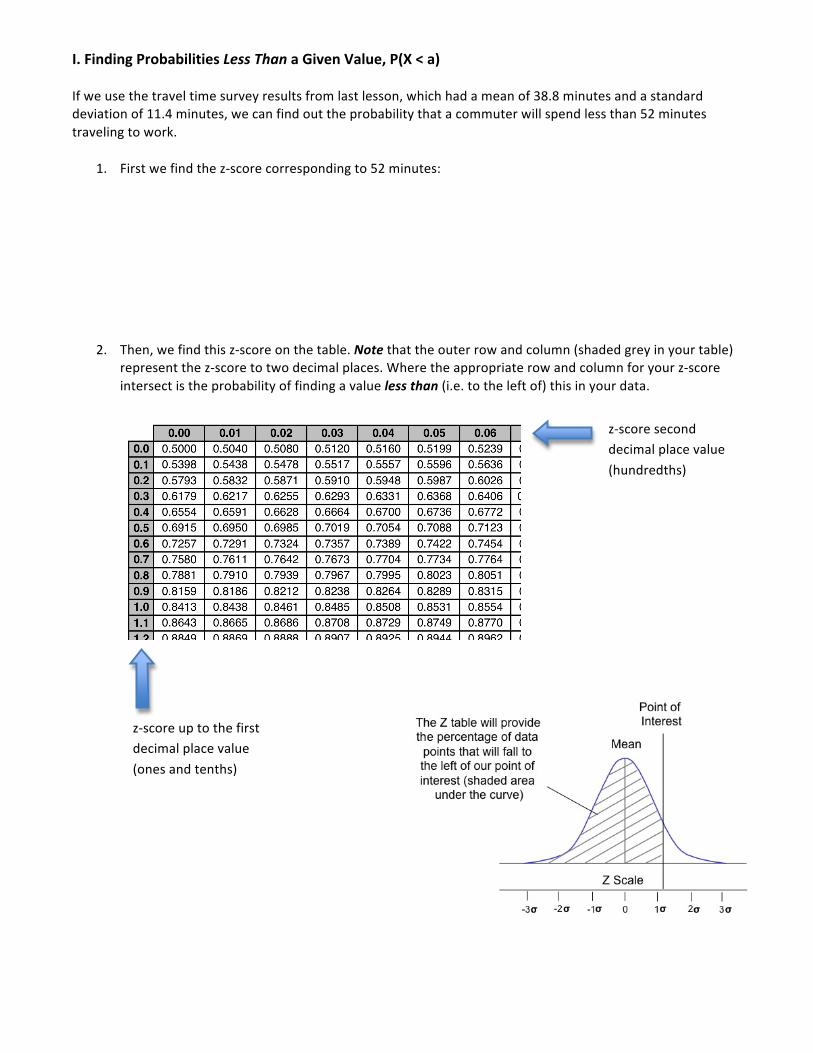
I.%Finding%Probabilities%Less&Than%a%Given%Value,%P(X%<%a)%
If!we!use!the!travel!time!survey!results!from!last!lesson,!which!had!a!mean!of!38.8!minutes!and!a!standard!deviation!of!11.4!minutes,!we!can!find!out!the!probability!that!a!commuter!will!spend!less!than!52!minutes!traveling!to!work.!
1. First!we!find!the!zYscore!corresponding!to!52!minutes:!
!
!!!
!
2. Then,!we!find!this!zYscore!on!the!table.!Note!that!the!outer!row!and!column!(shaded!grey!in!your!table)!represent!the!zYscore!to!two!decimal!places.!Where!the!appropriate!row!and!column!for!your!zYscore!intersect!is!the!probability!of!finding!a!value!less&than!(i.e.!to!the!left!of)!this!in!your!data.!
% %
%
%
%
%
zYscore!second!decimal!place!value!
(hundredths)!
zYscore!up!to!the!first!decimal!place!value!
(ones!and!tenths)!
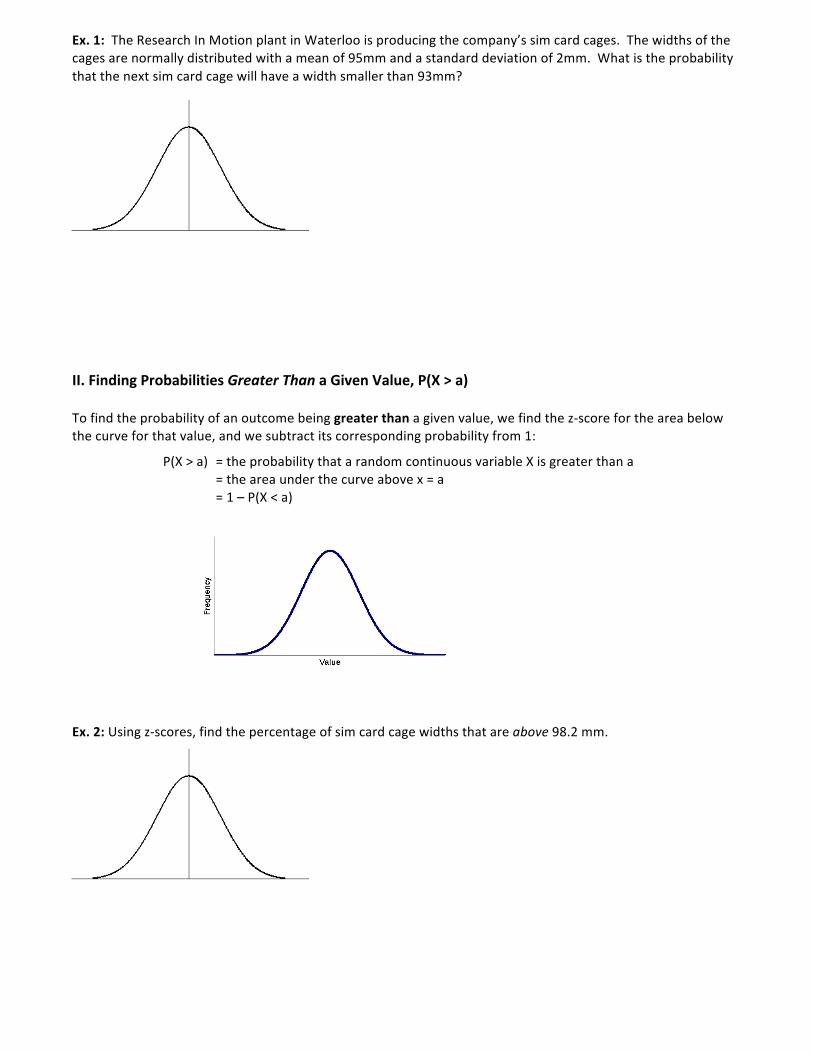
Ex.%1:%!The!Research!In!Motion!plant!in!Waterloo!is!producing!the!company’s!sim!card!cages.!!The!widths!of!the!cages!are!normally!distributed!with!a!mean!of!95mm!and!a!standard!deviation!of!2mm.!!What!is!the!probability!that!the!next!sim!card!cage!will!have!a!width!smaller!than!93mm?%
!
!
!
!
%
%
%
II.%Finding%Probabilities%Greater&Than%a%Given%Value,%P(X%>%a)%%To!find!the!probability!of!an!outcome!being!greater!than!a!given!value,!we!find!the!zYscore!for!the!area!below!the!curve!for!that!value,!and!we!subtract!its!corresponding!probability!from!1:!
! !!!!!!!!!!!!!P(X!>!a)! =!the!probability!that!a!random!continuous!variable!X!is!greater!than!a!! ! ! =!the!area!under!the!curve!above!x!=!a!! ! ! =!1!–!P(X!<!a)!!!
!
!
!
!
!
!
%
Ex.%2:%Using!zYscores,!find!the!percentage!of!sim!card!cage!widths!that!are!above!98.2!mm.%
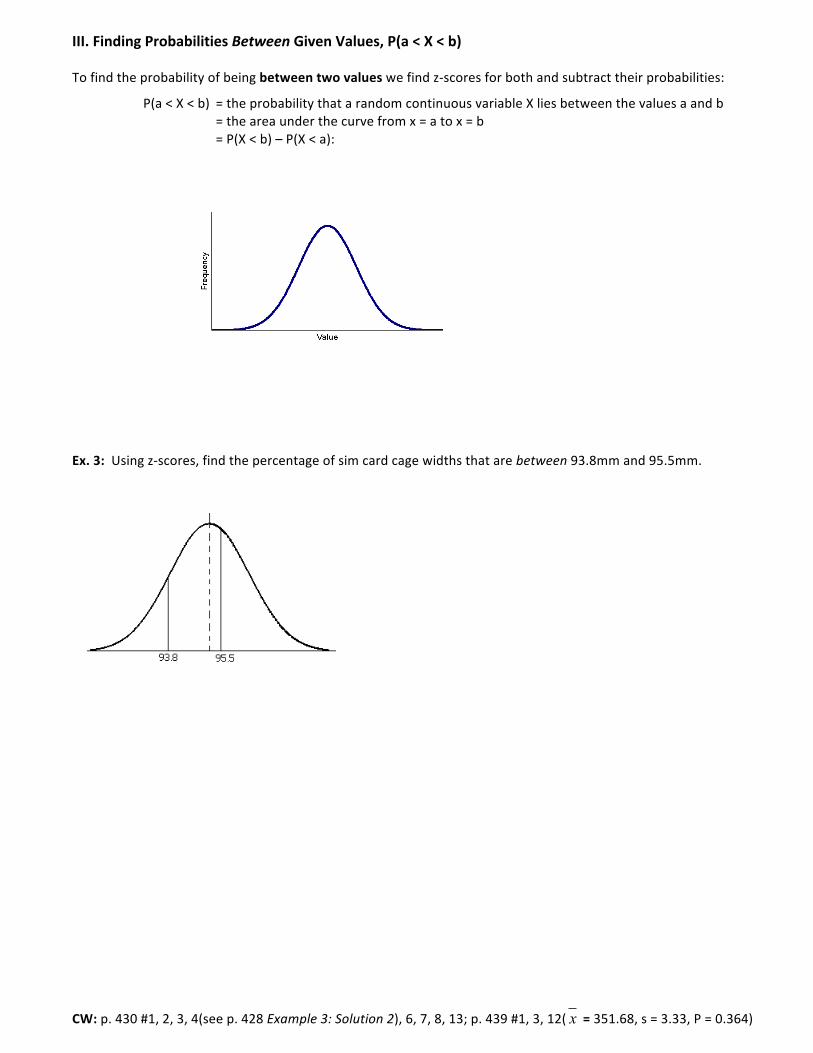
III.%Finding%Probabilities%Between%Given%Values,%P(a%<%X%<%b)%%
To!find!the!probability!of!being!between%two%values!we!find!zYscores!for!both!and!subtract!their!probabilities:!
! !!!!!!!P(a!<!X!<!b)!!=!the!probability!that!a!random!continuous!variable!X!lies!between!the!values!a!and!b!! !!!!!!!! ! =!the!area!under!the!curve!from!x!=!a!to!x!=!b!! !!!!!!!! ! =!P(X!<!b)!–!P(X!<!a):!!!%
%
%
%
%
%
%
%
%
%
%
%
%
%
%
Ex.%3:!!Using!zYscores,!find!the!percentage!of!sim!card!cage!widths!that!are!between!93.8mm!and!95.5mm.!!!%
%
%
%
%
%
%
%
%
%
%
%
%
%
%
%
%
%
%
%
%
%
%
%
%
%
%
%
CW:%p.!430!#1,!2,!3,!4(see!p.!428!Example&3:&Solution&2),!6,!7,!8,!13;!p.!439!#1,!3,!12( x %=%351.68,!s!=!3.33,!P!=!0.364)%

MDM4U%–%Module%3:%Statistics%!–!Unit!8:!Normal!Distribution!–!Lesson&3&&! !!!!!!!!!!!!!!!!!!!!!!!Date:___________!
Confidence%Intervals%
A.%What’s%a%Confidence%Interval?%
Newspapers,!magazines!and!other!forms!of!media!will!often!give!statistics!on!an!issue!and!provide!the!level!of!certainty!or!accuracy!associated!with!the!information.!
Recall:!Suppose!we!want!to!report!on!the!mean!of!our!population.!We!collect!a!sample!so!that!we!can!estimate!the!mean!of!our!population.!!If!we!conduct!a!survey!that!is¬!a!census,!we!cannot!truly!determine!the!population!mean, µ ;!instead,!we!can!determine!a!confidence%interval!that!highlights!ranges!of!values!within!whichµ !is!likely!to!fall.!!Because!the!normal!distribution!is!symmetrical,!these!intervals!are!centered!around!the!sample!mean,!!!.!!(Note:!The!closer!n!gets!to!N,!and!the!smaller!the!standard!deviation,!the!more!confident!we!can!be!about!our!mean!)!
Ex.%1:!The!statement,!“We!can!conclude!with!95%!confidence!that!millionaires!donate!between!12.6%!and!17.4%!of!their!income!to!charity.”!It!is!saying!that:!!There&is&a&_______%&probability&that&millionaires&donate&between&________&and&________&of&their&income&to&charity.!!!Ex.%2:!Interpret!the!statement:!“A!study!showed!that!60%!of!firstWyear!post!secondary!enrollees!do!not!come!directly!from!high!school.!!These!results!are!accurate!± 5%,!19!times!out!of!20”.!
!
!
!
!
B.%%How%do%you%create%confidence%intervals?!
In!this!course,!we!will!only!be!considering!confidence!intervals!of!data!that!follows!a!normal!distribution.!!We!will!use!the!follow!definition:!
CONFIDENCE!INTERVAL!FOR!A!NORMAL!DISTRIBUTION!
€
x − zα2
σ
n
%
& '
(
) * , x + zα
2
σ
n
%
& '
(
) *
%
& ' '
(
) * * or!!!!!
€
x ± zα2
σ
n
$
% &
'
( ) !
The!table!gives!a!list!of!common!confidence!levels!and!their!associated!zWscores:!
CONFIDENCE!LEVEL!!
ZWSCORE,!
€
zα2
!
90!%! 1.645!95!%! 1.960!99!%! 2.576!
€
x__

!
Ex.%3:%%Suppose!we!conduct!a!survey!of!19!millionaires!to!find!out!what!percent!of!their!income!the!average!millionaire!donates!to!charity.!!We!discover!that!the!mean!percent!is!15!with!a!standard!deviation!of!5!percent.!!Assuming!the!distribution!of!all!charity!percents!is!approximately!normal:!
a)!Find!a!95%!confidence!interval!for!the!mean!percent.!
!
!
!
!
!
!
!
!
!
!
b)!Find!a!99%!confidence!interval!for!the!mean!percent.!
!
%%%%%%%%%%%%%%%%%%%%CW:%p.%464%#1%–%4,%7,%8a%%

! !Z#score!Table!for!Areas!Und
er!the
!Normal!Distribution!
This%ta
ble%gives%the%cumulative%prob
ability%up%to%
the%stan
dardized%normal%value%(z8score)%
0.00
0.01
0.02
0.03
0.04
0.05
0.06
0.07
0.08
0.09
0.00
0.01
0.02
0.03
0.04
0.05
0.06
0.07
0.08
0.09
-2.9
0.0019
0.0018
0.0018
0.0017
0.0016
0.0016
0.0015
0.0015
0.0014
0.0014
0.0
0.5000
0.5040
0.5080
0.5120
0.5160
0.5199
0.5239
0.5279
0.5319
0.5359
-2.8
0.0026
0.0025
0.0024
0.0023
0.0023
0.0022
0.0021
0.0021
0.0020
0.0019
0.1
0.5398
0.5438
0.5478
0.5517
0.5557
0.5596
0.5636
0.5675
0.5714
0.5753
-2.7
0.0035
0.0034
0.0033
0.0032
0.0031
0.0030
0.0029
0.0028
0.0027
0.0026
0.2
0.5793
0.5832
0.5871
0.5910
0.5948
0.5987
0.6026
0.6064
0.6103
0.6141
-2.6
0.0047
0.0045
0.0044
0.0043
0.0041
0.0040
0.0039
0.0038
0.0037
0.0036
0.3
0.6179
0.6217
0.6255
0.6293
0.6331
0.6368
0.6406
0..6443
0.6480
0.6517
-2.5
0.0062
0.0060
0.0059
0.0057
0.0055
0.0054
0.0052
0.0051
0.0049
0.0048
0.4
0.6554
0.6591
0.6628
0.6664
0.6700
0.6736
0.6772
0.6808
0.6844
0.6879
-2.4
0.0082
0.0080
0.0078
0.0075
0.0073
0.0071
0.0069
0.0068
0.0066
0.0064
0.5
0.6915
0.6950
0.6985
0.7019
0.7054
0.7088
0.7123
0.7157
0.7190
0.7224
-2.3
0.0107
0.0104
0.0102
0.0099
0.0096
0.0094
0.0091
0.0089
0.0087
0.0084
0.6
0.7257
0.7291
0.7324
0.7357
0.7389
0.7422
0.7454
0.7486
0.7517
0.7549
-2.2
0.0139
0.0136
0.0132
0.0129
0.0125
0.0122
0.0119
0.0116
0.0113
0.0110
0.7
0.7580
0.7611
0.7642
0.7673
0.7704
0.7734
0.7764
0.7794
0.7823
0.7852
-2.1
0.0179
0.0174
0.0170
0.0166
0.0162
0.0158
0.0154
0.0150
0.0146
0.0143
0.8
0.7881
0.7910
0.7939
0.7967
0.7995
0.8023
0.8051
0.8078
0.8106
0.8133
-2.0
0.0228
0.0222
0.0217
0.0212
0.0207
0.0202
0.0197
0.0192
0.0188
0.0183
0.9
0.8159
0.8186
0.8212
0.8238
0.8264
0.8289
0.8315
0.8340
0.8365
0.8389
-1.9
0.0287
0.0281
0.0274
0.0268
0.0262
0.0256
0.0250
0.0244
0.0239
0.0233
1.0
0.8413
0.8438
0.8461
0.8485
0.8508
0.8531
0.8554
0.8577
0.8599
0.8621
-1.8
0.0359
0.0351
0.0344
0.0336
0.0329
0.0322
0.0314
0.0307
0.0301
0.0294
1.1
0.8643
0.8665
0.8686
0.8708
0.8729
0.8749
0.8770
0.8790
0.8810
0.8830
-1.7
0.0446
0.0436
0.0427
0.0418
0.0409
0.0401
0.0392
0.0384
0.0375
0.0367
1.2
0.8849
0.8869
0.8888
0.8907
0.8925
0.8944
0.8962
0.8980
0.8997
0.9015
-1.6
0.0548
0.0537
0.0526
0.0516
0.0505
0.0495
0.0485
0.0475
0.0465
0.0455
1.3
0.9032
0.9049
0.9066
0.9082
0.9099
0.9115
0.9131
0.9147
0.9162
0.9177
-1.5
0.0668
0.0655
0.0643
0.0630
0.0618
0.0606
0.0594
0.0582
0.0571
0.0559
1.4
0.9192
0.9207
0.9222
0.9236
0.9251
0.9265
0.9279
0.9292
0.9306
0.9319
-1.4
0.0808
0.0793
0.0778
0.0764
0.0749
0.0735
0.0721
0.0708
0.0694
0.0681
1.5
0.9332
0.9345
0.9357
0.9370
0.9382
0.9394
0.9406
0.9418
0.9429
0.9441
-1.3
0.0968
0.0951
0.0934
0.0918
0.0901
0.0885
0.0869
0.0853
0.0838
0.0823
1.6
0.9452
0.9463
0.9474
0.9484
0.9495
0.9505
0.9515
0.9525
0.9535
0.9545
-1.2
0.1151
0.1131
0.1112
0.1093
0.1075
0.1056
0.1038
0.1020
0.1003
0.0985
1.7
0.9554
0.9564
0.9573
0.9582
0.9591
0.9599
0.9608
0.9616
0.9625
0.9633
-1.1
0.1357
0.1335
0.1314
0.1292
0.1271
0.1251
0.1230
0.1210
0.1190
0.1170
1.8
0.9641
0.9649
0.9656
0.9664
0.9671
0.9678
0.9686
0.9693
0.9699
0.9706
-1.0
0.1587
0.1562
0.1539
0.1515
0.1492
0.1469
0.1446
0.1423
0.1401
0.1379
1.9
0.9713
0.9719
0.9726
0.9732
0.9738
0.9744
0.9750
0.9756
0.9761
0.9767
-0.9
0.1841
0.1814
0.1788
0.1762
0.1736
0.1711
0.1685
0.1660
0.1635
0.1611
2.0
0.9772
0.9778
0.9783
0.9788
0.9793
0.9798
0.9803
0.9808
0.9812
0.9817
-0.8
0.2119
0.2090
0.2061
0.2033
0.2005
0.1977
0.1949
0.1922
0.1894
0.1867
2.1
0.9821
0.9826
0.9830
0.9834
0.9838
0.9842
0.9846
0.9850
0.9854
0.9857
-0.7
0.2420
0.2389
0.2358
0.2327
0.2296
0.2266
0.2236
0.2206
0.2177
0.2148
2.2
0.9861
0.9864
0.9868
0.9871
0.9875
0.9878
0.9881
0.9884
0.9887
0.9890
-0.6
0.2743
0.2709
0.2676
0.2643
0.2611
0.2578
0.2546
0.2514
0.2483
0.2451
2.3
0.9893
0.9896
0.9898
0.9901
0.9904
0.9906
0.9909
0.9911
0.9913
0.9916
-0.5
0.3085
0.3050
0.3015
0.2981
0.2946
0.2912
0.2877
0.2843
0.2810
0.2776
2.4
0.9918
0.9920
0.9922
0.9925
0.9927
0.9929
0.9931
0.9932
0.9934
0.9936
-0.4
0.3446
0.3409
0.3372
0.3336
0.3300
0.3264
0.3228
0.3192
0.3156
0.3121
2.5
0.9938
0.9940
0.9941
0.9943
0.9945
0.9946
0.9948
0.9949
0.9951
0.9952
-0.3
0.3821
0.3783
0.3745
0.3707
0.3669
0.3632
0.3594
0.3557
0.3520
0.3483
2.6
0.9953
0.9955
0.9956
0.9957
0.9959
0.9960
0.9961
0.9962
0.9963
0.9964
-0.2
0.4207
0.4168
0.4129
0.4090
0.4052
0.4013
0.3974
0.3936
0.3897
0.3829
2.7
0.9965
0.9966
0.9967
0.9968
0.9969
0.9970
0.9971
0.9972
0.9973
0.9974
-0.1
0.4602
0.4562
0.4522
0.4483
0.4443
0.4404
0.4364
0.4325
0.4286
0.4247
2.8
0.9974
0.9975
0.9976
0.9977
0.9977
0.9978
0.9979
0.9979
0.9980
0.9981
-0.0
0.5000
0.4960
0.4920
0.4880
0.4840
0.4801
0.4761
0.4721
0.4681
0.4641
2.9
0.9981
0.9982
0.9982
0.9983
0.9984
0.9984
0.9985
0.9985
0.9986
0.9986
!"#$
%&'()*
+,'