81556736 superformance stocks an investment strategy for the individual investor based on the 4 year...
DESCRIPTION
Stock market investing on the 4 year+ cycleTRANSCRIPT
SuperperformanceStocks
An Investment Strategy forthe Individual Investor
Based on the 4-Year Political Cycle
by Richard S. Love
Prentice-Hall, Inc., Englewood Cliffs, Mew Jersey

Special thanks go out to the guy who makes this possible
I can´t say what a lucky guy I am to met you

Acknowledgments
My sincere thanks to Oscar Collier for his valuableadvice, encouragement and assistance, and to Darrell
Husted for his important editorial contributions.
The Securities Research Company, 208 NewburyStreet, Boston, Mass., 02116, was kind enough to permit
me to reproduce their charts for use in this book. Iacknowledge a debt of gratitude to them.
To the Individual Investor,Whose Security Investments AreManipulated by His Government,Whipsawed by Wall Street Professionals,and Dominated by Institutions.
Superperformance Stocks: An Investment Strategyfor the Individual InvestorBased on the 4-Year Political Cycle
by Richard S. LoveCopyright © 1977 by Richard S. Love
All rights reserved. No part of this book may bereproduced in any form or by any means, exceptfor the inclusion of brief quotations in a review,without permission in writing from the publisher.Printed in the United States of AmericaPrentice-Hall International, Inc., LondonPrentice-Hall of Australia, Pty. Ltd., SydneyPrentice-Hall of Canada, Ltd., TorontoPrentice-Hall of India Private Ltd., New DelhiPrentice-Hall of Japan, Inc., TokyoPrentice-Hall of Southeast Asia Pte. Ltd., SingaporeWhitehall Books Limited, Wellington, New Zealand10 9 8 7 6 5 4 3 2
Library of Congress Cataloging in Publication DataLove, Richard S
Superperformance Stocks.
1. Stocks. 2. Investments. 3. Speculation,I. Title.HG6041.L67 1977 332.6'45 76-57244ISBN 0-13-876151-5
The information in this book has been obtained fromsources believed to be reliable. Discussion of individualstocks and companies is for illustrative purposes only.Nothing in this book is to be taken as advice to buy orsell specific securities. Such advice must always take intoaccount changes in price and current outlook, whichare beyond the function of any book.
Contents
PartiThe Search for a SuccessfulInvestment Strategy
Chapter 1 Buy to Keep or Buy to Sell? 3The Concept of Growth 4The Cyclical Approach 5Evaluate the Political Climate 7Is Institutional Investment Strategy Changing? 9Stock-Price Cycles 10Reading the Long-Term Charts 11Being Wrong Can Be Painful 15The Disadvantages of the Buy-Sell-Buy Approach 16
Part IIWhen Should You Buy Stocks?
Chapter 2 Business Cycles 21
Chapter 3 Washington Policies 25Economic Control Through Fiscal and Monetary
Policies 26Follow the Political Cycle 27Inflationary Policies 28Economic Planning vs. Political Reality 30Federal Monetary Policy and Stock Prices 32Do Not Be Misled by Short-Term Monetary Trends 33
Chapter 4 The Political Cycles 35The Biggest Boom and Bust, 1927-32 39

The Roosevelt Recovery and Recession, 1932-38World War II and Immediate PostwarCycle 1: 1949-53Cycle 2: 1953-57CycleS: 1957-60Cycle 4: 1960-62Cycle 5: 1962-66Cycle 6: 1966-70Cycle 7: 1970-74CycleS: 1974-Summary of the Stock-Price Cycslei
Chapter 5 Look for Low RiskBuy During the Selling ClimaxTrade With the Market's Primary Trend
4044444546484951545556
59
5961
Part IIIWhich Stocks Should You Buy?
Chapter 6 Safety First 67The Biggest Also Decline 67Price Trends of Income Stocks 68Most Stocks Are Price-Cyclical 71Buy for Large Capital Gains 72A Superb Company Does Not Necessarily Have a
Superb Stock 72
Chapter 7 Superperformance Stocks: The Record 75Features of Superperformance Price Action 77Superperformance and Company Earnings 77Superperformance and Company Size 79Superperformance and Subsequent Stock-Price
Action 80Characteristics of Superperformance Stocks 81
Chapters Look for Price Volatility 83Stock Prices Reflect the Law of Supply and
Demand 84A Tale About Volatility and Timing 87Price Distortions by Stock Exchange Specialists 89Look for Rebounds 91Which Stocks Rebound? 92Emotional Selling and Trend Following 94Leverage 96The Dangers in Leverage 99Leverage in Low-Priced Stocks 100Leverage in Warrants 101
Chapter 9 Look for New Earning Power 105Change and Stock Prices 105Change Resulting From Discoveries of Natural
Resources 107Change in Government Policies 107Technological Change 109Growth-Stage Companies 110Mature Companies 112Use Caution When Selecting Growth Stocks 114Good Management Is Vital 115Turnaround Situations 115A Comparison of Two Growth Stocks 116Anticipate Growth 119Earnings Explosions 122Be Skeptical of Reported Earnings 124Reported Earnings Depend on Accounting
Procedures 124Higher Earnings Are Usually Anticipated 125Earning Trends Affect Superperformance Price
Action 125The Role Future Earnings Play in Stock Prices 126Evaluate Reported Earnings 127
Chapter 10 Look for Expandable Price/EarningsRatios 129
Psychology and Stock Prices 131Establishing Stock Values 132Problems in Establishing Values 134Market Price vs. Inherent Value 134Market Price vs. Dividends 138Estimating Price/Earnings Ratios 139The Influence of Price/Earnings Ratios 141The Ideal Situation 147
Chapter 11 Look for Good Sponsorship 149An Example of Sponsorship 151Sponsorship by Institutional Investors 152Trend Following 161Spotting Trends 162The Sequence of Trend Following 163News, Publicity, and Stock Prices 164Buy Stocks You Understand 167
Part IVWhen Should You Sell?
Chapter 12 The Timing Rhythm 171The National Economy and Stock Market Declines 173Presidential Elections and the Stock Market 174Watch Out for Surprises 176To Hold or to Sell? 178Be Alert to Federal Policy Switches 179A Possible Exception 180The Pricing Rhythm 182A Big Problem for Investors: The Stock Exchange
Specialists 183How Specialists Operate 184
Do Call Options Depress Stock Prices?Remember the Political CycleDeclines in Individual Stocks vs. Declines in the
Stock MarketWatch for the Warning Signals
Chapter 13 Selling ShortTiming a Short SaleThe Ideal Time to Sell ShortPatterns of Boom and Bust in Real EstateProfitable Short-Sale Opportunities Have Been
NumerousSelect Short Sales SystematicallyShort Selling by ProfessionalsCovering Short Sales
185185
187188
191192193194
196197200203
PartVThe Strategy for Success
Chapter 14 Sources of Information and IdeasPublications to Review RegularlyLearn to Recognize the CyclesLook for Potential Price MovementIndividual Judgment Is Crucial for Success
Chapter 15 Points to RememberWhen to Buy StocksWhat Stocks to BuyWhen to Sell Stocks
Appendix A: Superperformance Stocks, 1962-74
Appendix B: Superperformance Stocks,October 1974-October 1976
207207211214214
217218219220
223
237
Charts
1. Presidential Elections and Stock Prices 122. Ford Motor 133. Metromedia 144. Federal Budget Deficits and Surpluses 295. Durations of Stock Price Cycles 376. United Financial Corporation of California 637. Dow Jones Utility Average 698. American Telephone and Telegraph 709. Skyline 78
10. General Motors 8511. Jack Eckerd Corp. 8612. Natomas 9513. Trans World Airlines 9814. Holiday Inns 10215. Gulf & Western Industries 10316. Vetco Off shore Industries 10817. Bausch& Lomb 11118. The S-Curve in the Dow Jones Industrial
Average 11319. Chrysler 11720. Polaroid 12021. Kresge 12122. Syntex 12323. McDonald's 14224. International Flavors and Fragrances 14325. International Business Machines 14526. Du Pont E. I. de Nemours 146
27. Athlone28. U.S. Steel29. Burroughs30. Xerox31. Winnebago Industries32. Outboard Marine33. Avon Products34. MGIC Investment35. Grolier36. Rite Aid37. Eastern Airlines38. Thiokol
153158159160172177181195198199201208
Tables
Table 1. The Stock Price Cycles 37
Table 2. Presidential Elections Compared With BeirMarket Lows and Bull Market Highs 56
Table 3. The Disparity Between Book Value andMarket Price 135
Table 4. Book Value Lower Than Market Price 136
Table 5. Book Value Higher Than Market Price 137
Table 6. Accumulation of Xerox by Institutions 157

Part IThe Search
foraSuccessful Investment
Strategy

Chapter 1Buy to Keep or Buy to Sell?
A well-known investment adviser was interviewed by anational magazine a few years ago and asked to sum upthe investment philosophy he would recommend for theperson who still has twenty or thirty years in whichto buy stocks. He advised buying to keep rather thanbuying to sell.
A financial columnist stated in another magazine:"The conventional wisdom of stocks being bought andput away for the long-term has been so discredited thatthere is no need to dwell on it here."
Here are two financial advisers with two opposingopinions. Which one is right? Since the statements weremade prior to the devastating 1973-1974 bear marketwhen almost all stock prices declined severely—theirsteepest declines since 1929—and during a period ofincreasing pessimism concerning the national economy,the investment adviser who said that long-terminvestment has been discredited appears to be right.During that year stocks declined in value about $500billion. However, an investor who bought IBM, or Xerox,or Eastman Kodak, or any of a dozen or so other growthcompanies in the 1950s or early 1960s and has held theshares has certainly done very well.
But there are at least two problems. First, wouldan individual investor have done as well buying andholding even the most consistently strong stocks as bybuying when prices were depressed and selling whenprices appeared high? I believe that the evidence onlong-term charts such as those in this book clearlyindicates that better results are usually obtained by timelyselling, and then repurchasing the stock or a moresuitable one after a bear market has run its course.Second, the best reason for selling when a stock turns
3

weak is simply that many stocks never come back, andothers take many years to return to earlier price levels.
The Concept of Growth
Growth is a word that has triggered off the purchase ofbillions of dollars' worth of stock by millions of Americansfor many years. As far back as the 1920s the belief waswidespread that the way to invest was to buy the stockof a growing company and to hold it. During the 1930ssome investors presumably had second thoughts. But themania for growth reached another peak in the 1960s;the price/earnings levels of most stocks in 1961, forexample, were even higher than in 1929.
But although rapid growth is a highly desirablefeature to find in a company, the relationship of a stock'sprice to the company's rate of growth must be realistic.Investors have paid high prices for growth that was tooccur many, many years in the future, and which oftennever happened at all. Moreover, growth stocks eventuallyreach maturity and the rate of growth slows down.
Too many investors confuse growth stocks withgrowth companies. A company may have rapidly growingsales and earnings over a period of ten years or more, but ifthe stock was extremely overpriced at the beginning ofthat ten-year period because investors were lookingforward to future growth, the price of the stock might risevery little, if at all. Communications Satellite Corporation,or Comsat, is such an example. When the company wasorganized, in 1964, its stock was sold to the public fortwenty dollars a share. There was great public enthusiasmabout the "growth" expected for this stock, and its pricequickly rose to over seventy dollars a share. This happenedseveral years before the company reported any earnings.Although profits were reported in 1968 and have beensteadily rising since then, the stock's price has fluctuatedwidely between eighty-five and twenty-three dollars ashare as recently as 1974 and 1975. In other words, the
stock's price back in 1964 completely discounted anentire decade of growth for the company. Investors arenot willing to pay as much now for a company and itsprospects as they were ten years ago. So although thenation may grow and expand, and an individual companymay grow and expand, this does not necessarily meanthat the company's stock must rise in price.
In recent years there have been hundreds ofcompanies reporting expanding sales and increasingearnings, but declining stock prices. In numerous cases thecombination of rising earnings but declining stock price isa long-term trend that has lasted a decade or longer, andindicates that investors are not as willing to pay as muchfor earnings as they once were. With inflation pushing upthe yields available from bonds and certificates of deposit,many investors are satisfied with placing their moneythere rather than in lower-yielding and riskier stocks.
The concept of growth has been shaken even moreby the increasingly cyclical nature of the Americaneconomy, the result of the higher rate of inflation in recentyears, which has in turn been caused by the numerousbig-spending programs favored by Washington politicians.Big programs require big money, and if the funds squeezedout of the taxpayers are insufficient, the Washingtonmanagers in effect create or borrow whatever additionalmoney is required to pay the bills of the government.
So what does this mean for the individual investor?It means that the concept of steady upward-and-onward"growth" is shaky. Companies might grow, but theirstocks often go through periods of severe price distortion,sometimes being greatly undervalued, then overvaluedtwo or three years later.
The Cyclical Approach
Instead of just looking for "growth," there is a better,more rewarding approach to achieving stock marketprofits, which I discovered by studying the patterns
4 §

made by stock prices plotted on twelve-year charts.These charts reveal that the vast majority of stock pricesmove in four-year cycles of strength and weakness, withstrength occurring prior to and weakness occurring afterpresidential elections. The strength or weakness in stockprices reflects the mass optimism or mass pessimism ofinvestors as they anticipate higher or lower earnings forcompanies.
I nvestors are not the only people who are alternatelyoptimistic and pessimistic. Our economy is cyclical inpart because buyers, too, act in waves of optimism andpessimism. When people are pessimistic concerning theirfuture, they delay making big purchases such as housesand automobiles; but when they all become optimisticand do their buying at the same time, shortages arecreated and prices and wages are raised. Because of theshortages, and to beat rising prices, businessmen-retailers, wholesalers, manufacturers—place larger ordersthan they really need, so their inventories grow. But thenew higher prices cause hesitation on the part of thebuyers. So buying—and business-slow down and masspessimism gradually replaces optimism.
Just as the history of stock prices can be determinedvery quickly by simply glancing at the picture recordportrayed on long-term stock charts, the reason forvolatile stock action at a certain time can be determinedby reviewing the financial magazines and newspapers ofthe period. Thus related to the historical record,long-term charts become a picture of economic history,recording booms and recessions, inflation and internationalcrises. The charts are a reflection of mass behaviorpatterns, as millions of investors react in panic orenthusiasm to the news of the day.
Will the cyclical four-year stock-price patterncontinue? Yes, because it is closely related to thepresidential term of office, and as long as the term ofoffice remains four years the same pattern is likely topersist.
We live in the Age of the Big Spender-the politician
who loves to spend other people's money for everyimaginable cause ranging from foreign aid to Frisbeeresearch. Washington's big spending is the primary reasonfor the large hidden tax—inflation—that afflicts all of us.Until the Federal Government gets its spending undercontrol, if it ever does, the problem of inflation andeconomic instability, with its booms and recessions,spiraling prices and business failures, will be with us. Forthe investor this can spell opportunity or disaster,depending on each individual's insight.
Evaluate the Political Climate
Many thousands of pages have been written aboutfundamental analysis and technical approaches tocommon stock investment. Comparatively little attentionhas been given to the importance of political influences,particularly as they affect the timing of purchases. But itis in Washington that most of the important decisionsare made that will cause you to lose or make money inthe stock market. Washington policymakers will decideif there will be a budget deficit or a possible surplus;Washington policymakers will decide if there will be anychanges in federal taxes; and Washington policymakerswill decide if there is to be a monetary contraction orexpansion. It would be a big mistake, when deciding onstock purchases or sales, to ignore policies beingformulated by the federal government.
Many made-in-Washington decisions are influencedby the necessities of running for political office. Everyfour years there is a presidential election, and the WhiteHouse incumbent knows that he or his political party'snominee will stand a better chance of winning if thenation is prosperous at the time of the election.Politicians consider the "pocketbook" issue to be themost important of all.
The significance to the investor is that he can planon the country being economically strong during an
6 7
election year, and since rising stock prices are associatedwith a strengthening economy, he can expect rising stockprices during the two-year period prior to the election.
But after the election there is no longer thisconcern, and another problem begins to receive increasedattention: inflation. The booming economy of thepresidential election year aggravates the inflationproblem, so after the election—and sometimes just priorto election day—steps are taken to attempt to slow downthe inflation rate. These restrictive moves by the FederalReserve Board may include increases in the rediscountrate, increases in the reserve requirements of memberbanks, and increases in margin requirements.
Such steps are usually effective in gradually slowingthe nation's economy. The stock market reacts to thenew policies more quickly and begins to decline, a slidethat might last as long as two years.
The signal for the end of the stock market declinecomes when Washington begins to adopt policies to fightthe recession that is developing. These steps include newexpansive measures by the Federal Reserve Board, andfiscal policies of increased government spending and taxcuts. These new economic stimuli will not stop the slidein stock prices immediately, since deep pessimism is theprevailing mood at such times. But after a delay ofseveral weeks or months, the market will have a sellingclimax and reverse its direction, though the nation'seconomy is likely to continue weakening for severalmore months.
The upswing in the direction of stock pricesfollowing the selling climax is the beginning of a newprice cycle, which will continue bullish for about two ortwo and a half years, through the next presidentialelection.
That, in general, is what investors should expectbecause of the political cycle and its effect on thenation's economy and stock prices. Federal monetarypolicies, moreover, are likely to become more politicalrather than less, since there are persistent efforts in the
8
Congress to bring the Federal Reserve Board's powerunder the control of congressional committees. Theresult would probably be a still greater increase inmonetary inflation.
The significance of these political-economicdecisions and numerous others emanating fromWashington is that they have a very pervasive influenceon the psychology of investors as well as on theavailability and cost of money.
Before making purchases, then, be sure to assess theprevailing political economic climate. Review thePresident's annual budget message to Congress todetermine whether he expects to be able to balance thebudget or, instead, expects increased governmentspending and another large deficit. The administration'spolicies determine largely whether or not the nationaleconomy will be stimulated or slowed.
Monetary indicators turn up before there is abusiness upswing, and stock should be bought whilebusiness is still going down. One highly regardedinvestment advisory service has stated that every one oftheir major buy signals since 1945 was given before thetrough in the business cycle. Toward the end of theboom period you should be prepared to sell stocks ifweakness develops in monetary indicators, which occursprior to the peaks in the stock market and in business.
Is Institutional Investment Strategy Changing?
On February 9, 1966, the Dow Jones industrial averagereached 1001.11. Almost nine years later, in October1974, the Dow Jones industrial average was as low as573, indicating that investors who had bought and heldstocks were not faring well. Of the thirty large companiesthat comprise the Dow Jones industrials, twenty-eightwere selling at lower prices in October 1974 than theyhad been in February 1966.
Some of the largest institutional investors have
9
started to move away from the one-decision growth-stockinvestment strategy, the buy-and-hold approach toinvesting. The 1973-74 bear market evidently broughtabout this change in the thinking of some portfoliomanagers. In 1974 Forbes Magazine interviewed a banksenior vice-president who supervised $16 billion worthof pension money. Forbes quoted him as saying: "Wedidn't feel that we were smart enough to buy and sellthese stocks when they were going through periods ofover-valuation and then buy them back when they wentdown." But now, he said, "When the degree of valuationbecomes excessive, we will be more willing to share ourholdings with new enthusiasts." So it appears that atleast some large institutional investors are rethinkingtheir investment strategy and will use an intermediateterm buy-sell-buy approach. This investment philosophywill cause even larger swings in stock prices, whichcreates greater opportunities for individual investorswho are alert enough to buy and sell the right stocks atthe right time.
Stock-Price Cycles
If the buy-and-hold approach to investing is unsatisfactory,as it often has been, then the alternative is to buy for resale,preferably at a much higher price. But how are the idealtimes to purchase and sell stocks determined? Theanswer is found in the cyclical pattern of stock prices, apattern that has developed over the past few decades.
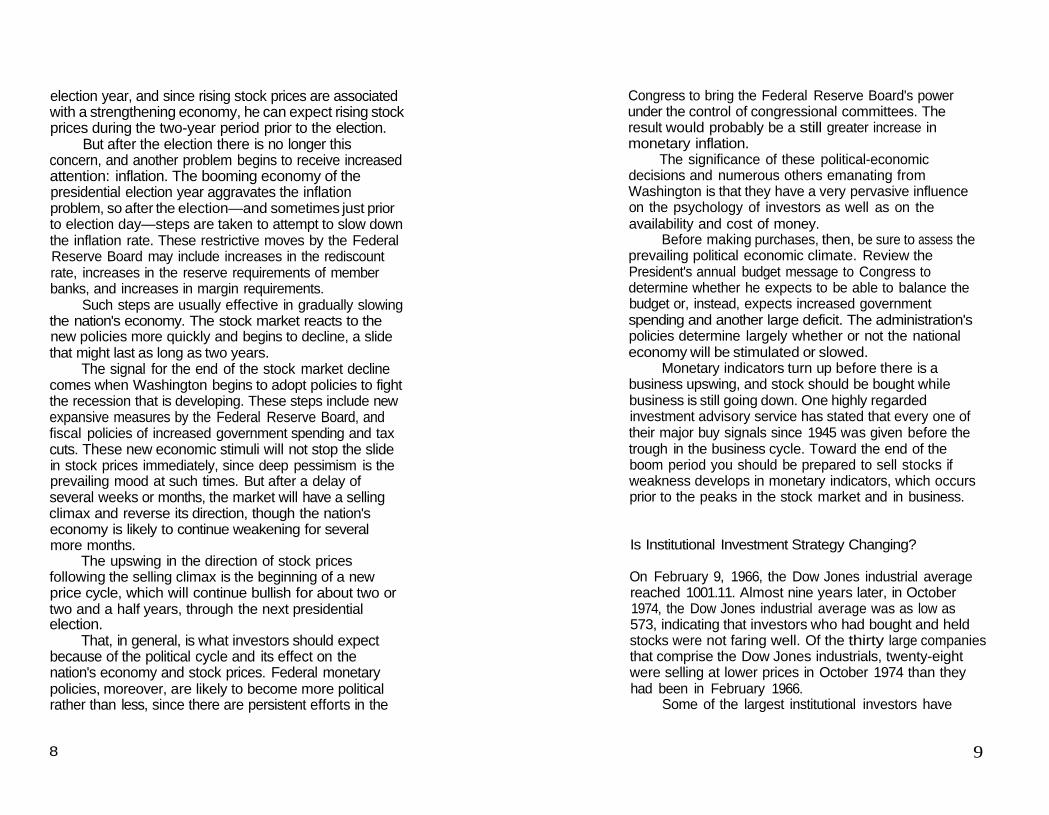
Cycles in stock prices can be readily identified onlong-term charts of market averages, which are valuablefor determining the trend of stock prices in general.Cycles can also be identified on individual stock charts.Chart 1 portrays the record of six market averages,including the Dow Jones industrial average. The cyclicalpattern traced by the Dow Jones industrials clearlyreveals the periods of price weakness as well as the longperiods of advancing stock prices. From 1949 to 1965
10
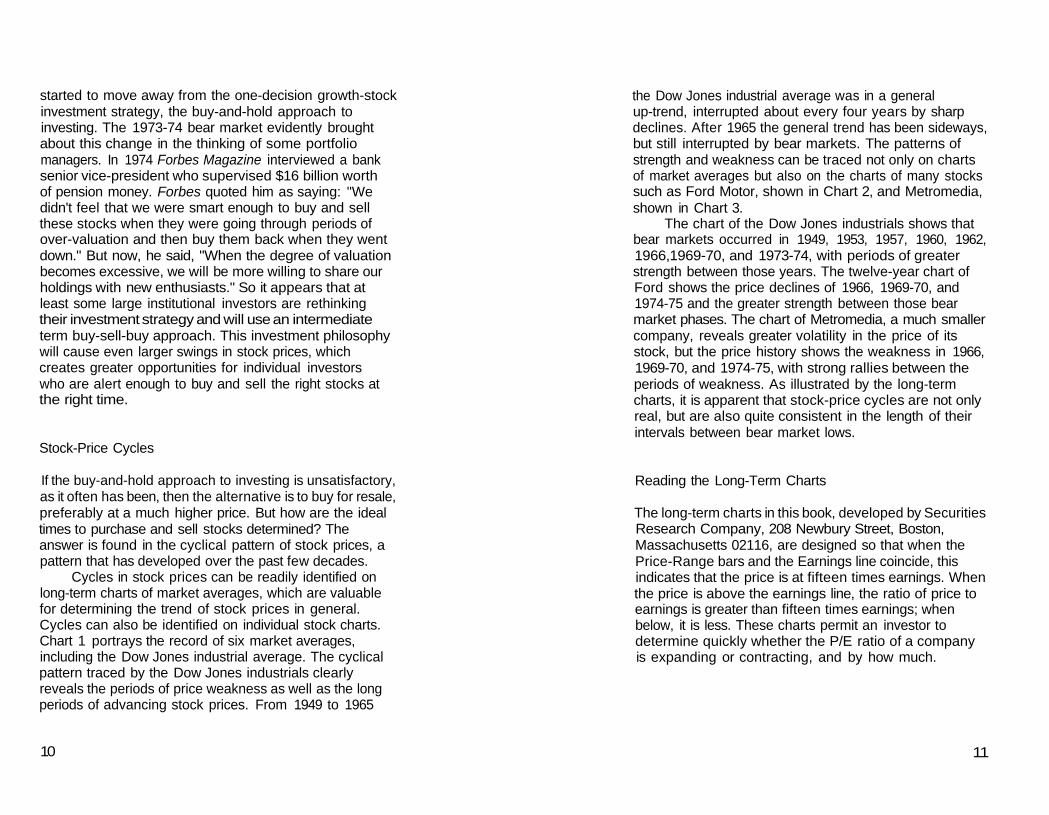
the Dow Jones industrial average was in a generalup-trend, interrupted about every four years by sharpdeclines. After 1965 the general trend has been sideways,but still interrupted by bear markets. The patterns ofstrength and weakness can be traced not only on chartsof market averages but also on the charts of many stockssuch as Ford Motor, shown in Chart 2, and Metromedia,shown in Chart 3.
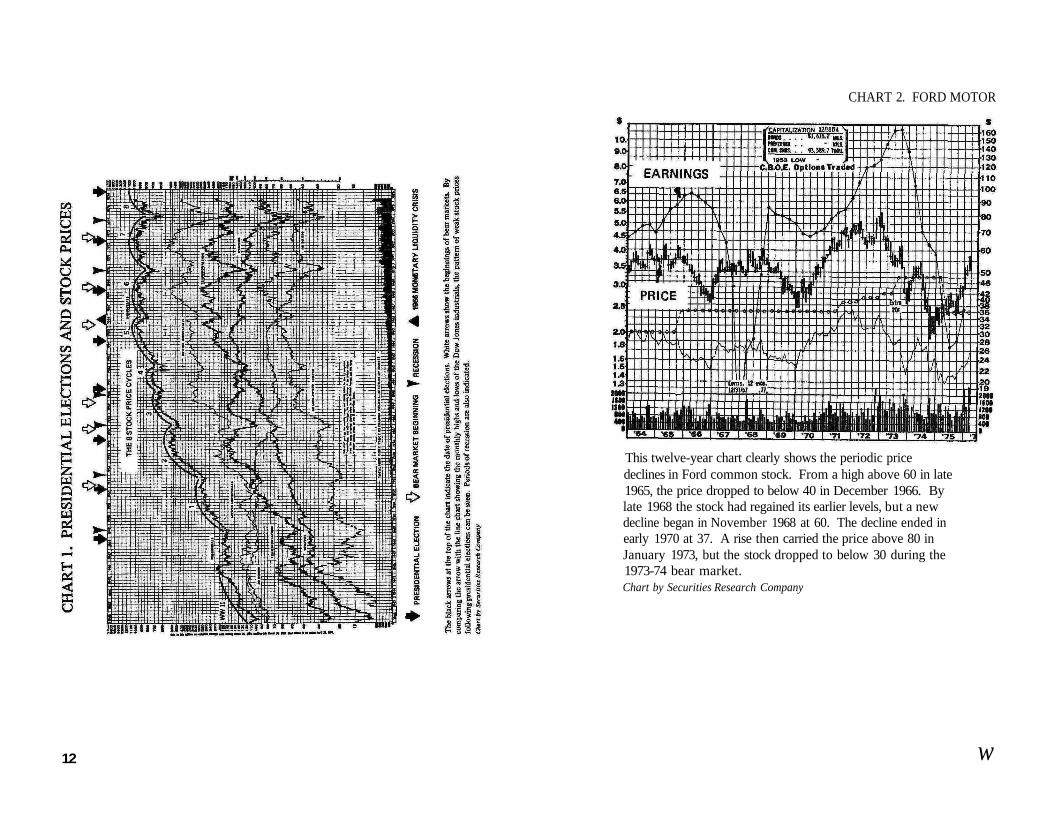
The chart of the Dow Jones industrials shows thatbear markets occurred in 1949, 1953, 1957, 1960, 1962,1966,1969-70, and 1973-74, with periods of greaterstrength between those years. The twelve-year chart ofFord shows the price declines of 1966, 1969-70, and1974-75 and the greater strength between those bearmarket phases. The chart of Metromedia, a much smallercompany, reveals greater volatility in the price of itsstock, but the price history shows the weakness in 1966,1969-70, and 1974-75, with strong rallies between theperiods of weakness. As illustrated by the long-termcharts, it is apparent that stock-price cycles are not onlyreal, but are also quite consistent in the length of theirintervals between bear market lows.
Reading the Long-Term Charts
The long-term charts in this book, developed by SecuritiesResearch Company, 208 Newbury Street, Boston,Massachusetts 02116, are designed so that when thePrice-Range bars and the Earnings line coincide, thisindicates that the price is at fifteen times earnings. Whenthe price is above the earnings line, the ratio of price toearnings is greater than fifteen times earnings; whenbelow, it is less. These charts permit an investor todetermine quickly whether the P/E ratio of a companyis expanding or contracting, and by how much.
11
This twelve-year chart clearly shows the periodic pricedeclines in Ford common stock. From a high above 60 in late1965, the price dropped to below 40 in December 1966. Bylate 1968 the stock had regained its earlier levels, but a newdecline began in November 1968 at 60. The decline ended inearly 1970 at 37. A rise then carried the price above 80 inJanuary 1973, but the stock dropped to below 30 during the1973-74 bear market.Chart by Securities Research Company
12 w
CHART 2. FORD MOTOR

CHART 3. METROMEDIA
The twelve-year chart of this radio, television, and advertisingcompany shows the cyclical nature of its stock. From about 26in early 1966, the price dropped to below 12 in late 1966. Bylate 1968 the price had risen to above 50, but by mid-1970 hadfallen to 9'/z. By mid-1972 the price was back up to 38, butthen dropped to 4% in September 1974. From that level itagain rallied sharply during 1975 and 1976.Chart by Securities Research Company
14
Being Wrong Can Be Painful
The 1973-74 bear market made many investors painfullyaware of the fact that they can be seriously hurt if theyhold stocks while many other stockholders are selling inpanic. During the 1974 plunge, even fire and casualtyinsurance companies were forced into heavy selling fromtheir portfolios. These companies need a surplus usuallyabout equal to 25 percent of the net premiums that theywrite. But the fire and casualty companies had a largeportion of their surplus invested in stocks, and severallost as much as 80 percent of their surplus. They weretherefore forced to sell stocks and losses were severe.The market value decline in the stock portfolios of thefire and casualty insurance companies during the1973-74 bear market has been estimated at severalbillion dollars.
There are other disadvantages to buying and holding.Some stocks never come back after plunging. Otherstake many years to return to their earlier levels. EvenGeneral Motors, usually considered to be among thestrongest of companies, has had its stock sell at pricesfar below those reached in 1965. This has also been trueof other mature companies. American Telephone andTelegraph, for instance, reached a high of 75 in 1964and has been below that price ever since. DuPont hasnot regained its 1965 high, nor has U. S. Steel regainedits 1959 high, or Alcoa its 1956 level. There arenumerous other examples.
But the biggest disadvantage is that bear marketsare injurious to your health and might even kill you,though no warning to that effect is printed on stockcertificates. During the severe sell-offs of the 1969-70bear market a radio commentator reported that the rateof heart attacks had increased, and this was believed tobe related to the plunge in stock prices.
Mental anguish is a severe problem associated withbear markets that most investors do not even consideruntil they are hopelessly entangled in the continuing

dilemma of whether to sell and what to sell and when tosell, while the value of their investments plunges between10:00 A.M. and 3:30 P.M. on five days of the week-allthe while hoping that their stocks will go back up totheir purchase prices so that they can at least get outeven. During such periods there is almost a nationwidesigh of relief when the closing bell rings at the stockexchange. And the arrival of weekends is a reason forwild jubilation, for stock prices do not decline then, andso for two whole glorious days you cannot be hurt.
Living in this kind of constant tension, fear, almostpanic that the impersonal stock market will decree thatan individual's worth will be so many thousands ormillions of dollars less on Friday than on the previousMonday takes its toll, and a number of lives per year.
I knew a man who had built a thriving businessover the years, but who decided to retire when he was inhis late sixties. He sold his business at a good price andinvested the money in various "growth" stocksrecommended by his broker. Within months the markethad started on a steep decline, ending in the severesell-offs of June and October 1962. My friend's stocksdeclined in value to a fraction of their purchase price.He developed hypertension and died of a heart attacktwo years later. Most investors would not be as severelyaffected as this businessman was, but plunging stockprices affect just about everybody who owns stocks—atleast twenty-four million people.
The Disadvantages of the Buy-Sell-Buy Approach
The disadvantages of the buy-sell-buy approach toinvesting are apparent: Commissions must be paid onpurchases and sales; income taxes must be paid on capitalgains, and, in addition, the investor might not feelconfident about his ability to sell and buy back stocks atthe right time. But in spite of these negative aspects, theadvantages of buying and selling in accord with
li
stock-price cycles are so great that in most cases theprofits to be obtained will vastly exceed the capital gainstaxes to be paid. The stock-price history of the past fewdecades reveals that investors who have the talent forbuying and selling stocks at the right times would havebeen much more successful than investors who merelypurchased and held stocks. To answer our initialquestion, the financial columnist who advised thepurchase of stocks for resale rather than to keep iscorrect.
17

Part IIWhen Should You Buy Stocks?

Chapter 2Business Cycles
Stock-price cycles are usually related to cycles in thenational economy. Companies exist to make money.Those that are not profitable do not remain on thenational scene for many years. Stocks are purchased orsold because investors become optimistic or pessimisticabout company earnings. Company earnings are usuallydependent on the state of the nation's economy.
Business cycles result from fluctuations in theeconomic activity of a nation. They consist of a phase ofeconomic expansion followed by contraction. Revival ofbusiness activity emerges from the contraction andbecomes the expansion of the next cycle.
The economy of the United States has experiencedperiods of decline throughout the nation's history. TheNational Bureau of Economic Research has identifiedmore than thirty periods of business contraction, datingas far back as 1834. In European countries cycles ofbusiness have been traced back to earlier periods.According to some economists, the accumulation oflarge amounts of capital appears to be the key factor inthe development of business cycles. Fluctuations in theproduction of durable goods, such as automobiles andcapital equipment for businesses, have been much moresevere than in the production of nondurables. This isbecause durables are frequently purchased on credit.They are also postponable items. Thus, purchases tendto be bunched together in periods of optimisim and easycredit.
An expansion phase of a business cycle mayoriginate from increased spending by business, consumers,or the government. In this phase banks have excessreserves. But as the boom advances, more money isrequired to finance it. Eventually excess reserves
21
disappear and credit sources dry up. Commercial bankscan create more deposits only if they receive additionalreserves. Competition for loans drives interest rates up,and on some occasions money has not been obtainableat any price.
Eventually a slowing down of the boom begins totake place. Production costs rise rapidly; sales stopincreasing; some consumer items become oversupplied;overoptimism is replaced by doubt and a reluctance togo further into debt. The momentum of the businessexpansion finally falters and begins to reverse itself. Toa large extent, then, business cycles result fromwidespread feelings of optimism or pessimism, as well asfrom the cost of and availability of credit.
Tight money policies will slow a boom. But easymoney policies are less effective in pulling an economyout of a slump, although low interest rates and readilyavailable credit will help. Government spending also willbe beneficial, but investment spending is the mostimportant factor. The business contraction can sometimeslast for years.
According to business cycle theory, a ceiling isestablished for cyclical upswings when full employmentis reached; further growth is not possible. Cycle theoryalso presupposes that a floor is established when excessproduction capacity has been worked off. Theexpectation of profit is the strong motivating forcebehind investment decisions. If corporation managementsbelieve that a good profit can be obtained from newmanufacturing facilities, they will probably decide tobuild the facilities. But the cost of money, labor, rawmaterials, and equipment must be sufficiently low tojustify the investment. And a market for the productsmust be anticipated. If these conditions are met, newbusiness investment will occur and a business cycleupswing will take place.
Stock prices anticipate the decline in business byturning down before business begins to decline, just asstock prices anticipate upturns in the business cycle
22
several months in advance. Since World War II severereactions in stock prices have occurred approximatelyevery four years, and the bottom of the price decline hasoccurred most often during the second year following apresidential election but also late in the first yearfollowing the election. The beginning of the decline hasvaried from less than a month following the election toapproximately thirteen months later.
23
Chapter 3Washington Policies
Movements in stock prices, like business cycles, areforecast by political developments and are affected byactions related to the election of a United StatesPresident every four years.
The key to correctly anticipating the direction ofthe national economy and stock prices can be found inWashington. The President and other Washingtonpoliticians and bureaucrats have gained extensive controlover the American economy since the Depression of the1930s.
Anyone who has watched the maneuvers of theWashington Establishment for a long time is aware of theincessant desire of its politicians and bureaucrats tocontrol or manipulate most aspects of American life.They are involved in the nation's education and housing,its transportation, and much of its industry. America'senergy is to a large extent under their control, as isforeign commerce. They also exercise a considerabledegree of control over the nation's economy throughtheir manipulation of the money supply, and throughthe taxing and spending authority of the FederalGovernment.
The severe economic Depression of the 1930s gavean important boost to government interference in theeconomy, interference that has been most closelyassociated with the theories of the British economistJohn Maynard Keynes.
Central to Keynesian economics is the belief thatthe government should stimulate spending if there is atendency to unemployment, and that it should restrainspending if there is a trend toward increased inflation.Keynesian economists believe that the government canregulate spending by varying the level of taxes and
25

subsidies, thereby altering the amount of purchasingpower in the hands of consumers.
Investment spending can be regulated by varyingthe tax rate on profits and by controlling the availabilityand cost of credit. The inducement to invest could thusbe controlled to the extent that it depended on theprospective net rate of return after taxes. Thus, theKeynesian economists concluded, the selection ofdifferent techniques for regulating demand would dependon the goals that the government is pursuing.
This power to slow down or speed up the level ofeconomic activity can lead to many abuses, among themthe possibility that the economy might be stimulatedwhen it serves the purpose of the individuals who havecontrol. Too much stimulation can be destructive, sinceit can trigger serious inflation and result in a severerecession. But these concerns sometimes seem to be ofsecondary importance when compared with the necessityof winning elections with votes bought with thetaxpayer's own money.
Economic Control Through Fiscal and Monetary Policies
Although most investors are probably aware thatbusiness activity has moved in patterns of boom andbust, prosperity and recession for hundreds of years,they are perhaps less aware of the specific influencesthat Washington exercises in determining the timing ofthese phases.
The effects of federal fiscal policy, which is thegovernment's spending and taxing authority, and federalmonetary policy, which is its control over the nation'smoney, have been well established. For over a decadechanges in federal monetary policy, for example, havepreceded changes in the level of the nation's economicactivity. Monetary authorities have taken steps toincrease the availability of credit and to lower its costswhen the nation has been in or close to a recession. They
26
have taken steps to decrease the availability of creditand to increase its cost when inflation has been a seriousthreat to the country's stability. These steps haveusually preceded, and probably influenced, the resultingchanges in the primary trend of stock prices.
Changes in monetary policy are made to controlinflation by switching from a policy of monetary ease toone of monetary restraint, and to fight recession byswitching from monetary restraint to monetary ease. Buttiming of the policy change is sometimes affected bypolitical considerations. Policies of monetary restraint,for example, can be delayed until after presidentialelections so that a plunging stock market and adeteriorating economy will not affect an incumbentPresident's chances of re-election. A comparison oflong-term charts of stock prices with the dates ofmonetary policy changes, federal fiscal actions, and theschedule of presidential elections reveals that there havebeen occasions when federal fiscal and monetary policieswere modified in order to accommodate politicalambitions. The importance of this information to theindividual investor is not only that it can help him toavoid some stock market losses, but that it can assist himin planning a strategy for timing the purchase and sale ofstocks.
Follow the Political Cycle
Since it is possible to anticipate periods when federalauthorities can be expected to take actions detrimentalto stock prices, and also to anticipate times whenfavorable action is expected, an investment strategybased on these political decisions can be successful.
The principal influence that will determine whenyou should buy and sell stocks is the political cycle, thefour-year presidential term. There is a desire on the partof the politicians whose policies determine nationaleconomic trends to have the confidence of the voters
m
at election time, and the most important influence increating confidence is prosperity. To have generalprosperity, then, the business cycle must be in a phasein which the national economy is improving, withproduction and employment increasing and wages rising,resulting in a general feeling of optimism. It is alsoduring this phase of the business cycle that stock pricesare rising, with the primary trend of the stock marketmoving upward.
But as the upward surge in the national economycontinues, prices and wages also accelerate and inflationbecomes a bigger problem. So, after the election,when there is no longer a political angle to consider,anti-inflation policies are initiated, which graduallybring about a shift to the business cycle's next phase:contraction. Preceding the slowdown in the economywill be a downturn in the stock market's primary trend,the basic direction of stock prices over a period ofmonths, interrupted only briefly by temporary dips orrallies.
Inflationary Policies
It is more than coincidental that economic booms occurregularly during presidential years and that recessionsoccur in years between presidential elections. Businesscycles cannot be eliminated, but their timing can beaffected considerably by the fiscal and monetary policiesof the Federal Government.
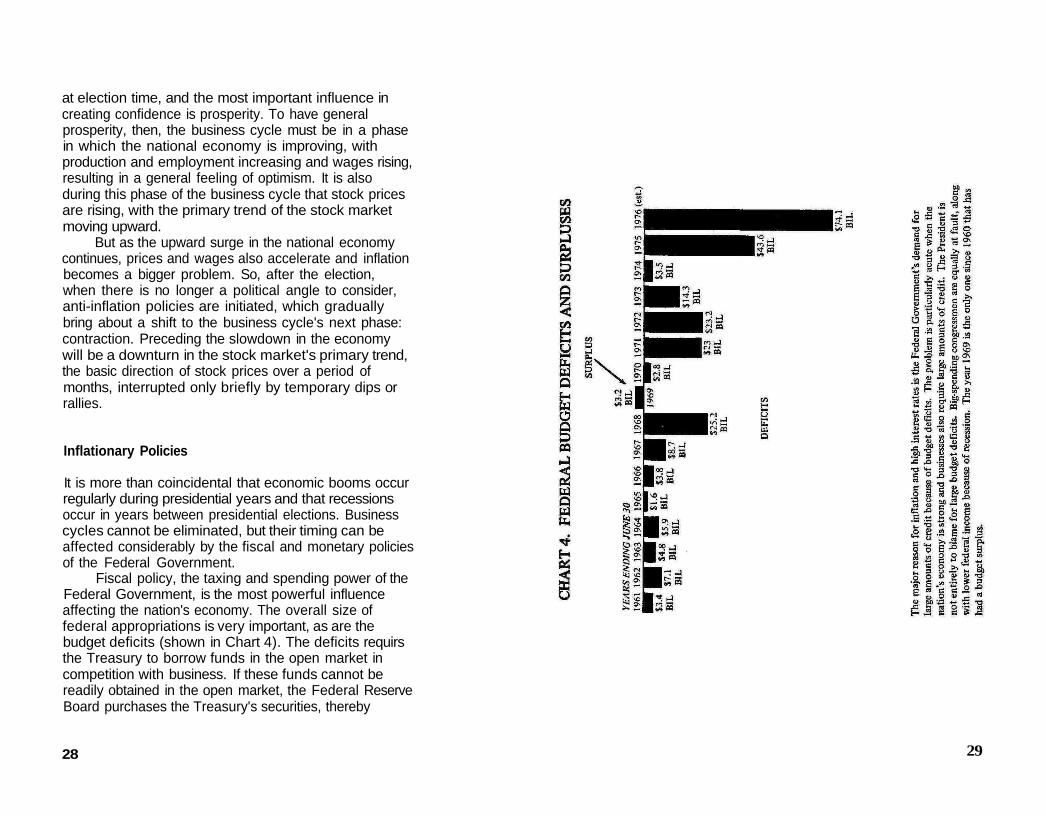
Fiscal policy, the taxing and spending power of theFederal Government, is the most powerful influenceaffecting the nation's economy. The overall size offederal appropriations is very important, as are thebudget deficits (shown in Chart 4). The deficits requirsthe Treasury to borrow funds in the open market incompetition with business. If these funds cannot bereadily obtained in the open market, the Federal ReserveBoard purchases the Treasury's securities, thereby
28 29
"monetizing" the debt, another way of saying that theyare adding new money to the nation's money supply.
A study correlating periods of inflation withsubsequent large federal budget deficits was published inthe July/August 1974 edition of the Financial AnalystsJournal. The author, Mr. Jesse Levin, determined thatthe periods of strong inflation follow periods of largefederal deficits, with a lag of 1 1/2 to 21/2 years. Heconcluded: "Every increase in the federal budget deficitsince 1945 has invariably resulted in a correspondingincrease in the acceleration of inflation; and everysurplus has produced a slow down in this rate. Therehave been no exceptions."
Large deficits in the federal budget also complicatethe Federal Reserve Board's responsibility for maintaininga consistent noninflationary monetary policy. When thefederal budget has a deficit, as it has had continuouslyfor more than a decade, the U. S. Treasury must borrow.In addition, a host of other federal agencies created byCongress also make demands for credit. The Export-Import Bank, the Federal Home Loan Banks, the FederalLand Banks, and the Environmental FinancingAuthority, to name a few, do not have their creditdemands revealed in the budget. The result is that theFederal Reserve is under constant pressure to expandthe money supply.
When the Federal Government spends billions ofdollars more than it receives in taxes, it is necessary tofinance the deficit. To do this the U. S. Treasury sellsbonds to buyers who will underwrite the big federalspending, which will be the cause of more inflation, andwhich will reduce, ironically, the real value of the bondsbeing purchased by the buyers.
Economic Planning vs. Political Reality
Until recent decades a balanced national budget wasconsidered desirable. But the Great Depression of the
30
1930s and Keynesian economics introduced a newattitude toward large-scale government spending. Manypoliticians and economists became convinced that theattainment of full employment was more desirable thana balanced budget.
World War II caused massive government spendingfor military purposes and the accumulation of purchasingpower by businesses and individuals. Following the war,Congress passed the Employment Act of 1946, whichstated that it was the continuing policy and responsibilityof the Federal Government to promote maximumemployment, production, and purchasing power. It wasassumed that fiscal and monetary policies would be usedto attain these objectives.
By the 1960s this approach had gained widespreadacceptance among liberal economists and politicians. Thearguments by economists favoring the use of fiscalaction to control the nation's economy are that increasesin government spending add directly to demand forgoods and service, and that reductions in tax ratesincrease disposable income, thereby increasing demand.Both of these actions have a multiplier effect.
Economists also assumed that an overheatednational economy could be cooled down by reducingfederal spending and increasing taxes. But this theorycollided with hard political reality. Politicians are quickto spend money and reduce taxes, but it is usually verydifficult to convince them that the opposite actions—lessspending and increased taxes—are sometimes necessaryto slow inflation. The unpleasant chore of slowing theeconomy has been left to the Federal Reserve Board,which effectively slows the economy by tighteningcredit.
So, while fiscal policies have been particularlyuseful in stimulating the nation's economy when itneed stimulating, responsibility has fallen upon themonetary policymakers, the Federal Reserve Board, totake steps necessary to combat inflation. The Fedaccomplishes this through its control over reserve
31
requirements—the amount of money that member banksmust hold in reserve as a percentage of deposits—and thediscount rate, which is the interest rate charged memberbanks to borrow from the Federal Reserve. Sinceincreases in the discount rate have the effect of forcingup other interest rates, borrowing by business isdiscouraged. Decreases in the discount rate, on the otherhand, force interest rates down and make borrowingmore attractive.
The Fed can also act to peg interbank loans,called federal funds, at desired levels, and can alsotake action to increase or decrease stock marginrequirements, which affect the potential buying powerfor securities.
Federal Monetary Policy and Stock Prices
There has been a strong correlation between decliningstock prices and restrictive policies by the FederalReserve, and also between rising stock prices and Fedpolicies of monetary ease. The discount rate wasincreased repeatedly during the 1973-74 bear market.But the Fed switched to a policy of monetary ease bylowering the discount rate in December 1974 andJanuary 1975.
During 1927 the Federal Reserve Board had aneasy-money policy that contributed to heavy stockmarket speculation. Bank credit expanded and thecommercial banks overextended themselves in loans forstock purchases. The Fed slowly began restrictive actionby moderately raising discount rates in early 1928 andagain in 1929. Also in 1929 it threatened to refusere-discount privileges to banks having excessive loansbased on securities for collateral.
At that time the Federal Reserve lacked theauthority to slow stock market speculation. It was notuntil after the 1929 crash that the Fed was givenauthority to set margin requirements.
Do Not Be Misled by Short Term Money Trends
One word of warning: It is possible for an investor to bemisled if he attempts to follow weekly trends in themoney stock figures, since there is considerablefluctuation from week to week. The Federal Reservedoes not have the tools to control movements in moneywith precision over the short term. A more accurateapproach would probably be to accept the statedintention of the Federal Reserve as described by theFed's spokesmen. Federal Reserve policy is oftenspelled out in speeches and press conferences by theBoard's chairman and other members. In the past, thesepublic statements have been accurate indicators ofwhether the Fed was moving toward a tighter or easiermonetary policy. For example, late in 1968 the FederalReserve Board stated publicly that it intended to squeezeinflation from the economy. This occurred while stockprizes were still rising strongly. Following the 1966period of tight money, the Federal Reserve announcedthat it was taking steps to make money more readilyavailable. However, although these steps were publicized,the market was quite slow in reacting to the signals,
3332

Chapter 4The Political Cycles
The political cycle, the four-year presidential term ofoffice, has been responsible for the development overthe past three decades of a four-year cycle in stockprices. The pattern had its inception during Franklin D.Roosevelt's term of office in the mid-1930s, but thedomination of the national economy by the demands ofWorld War II prevented the cycle from developing fullyuntil the postwar period.
Chart 5 shows the durations of stock price cyclessince the 1940s. Presidential elections were held duringthe first week of November in 1948, 1952, 1956, 1960,1964, 1968, and 1972. There were declining stockmarkets that bottomed out in 1949, 1953, 1957, 1960,1962, 1966, 1970, and 1974. Of these dates, the onlyone not in a normal cycle is 1960, which was apresidential election year. The weak national economyand declining stock market played significant roles inthe election results that year. All of the bear marketbottoms except 1960 occurred within two years aftereach election.
Since 1949 there have been seven complete cyclesin the primary trend of stock prices, as revealed on thelong-term charts of six stock averages. The beginningand ending months, and the duration of each cycle, areshown in Table 1. Some bear market troughs werecharacterized by "double bottoms," during whichprices plunged a second time following an initialrebound. Three double bottoms are listed (October andDecember 1957, June and October 1962, October andDecember 1974) because at least one stock averagerecorded its bottom during one month while otheraverages recorded their lowest levels during anothermonth.
35

Table 1
Cycle Trough Date Length of Cycle(Trough to Trough)
June 1949
September 1953
October and DecemMi f1957October 1960
June and October 1i82
Dctober 1966
May 1970
Dctober and December1 974
4 years 3 months
4 years 1 month(to October 1957)
3 years(October to October)
1 year 8 months(to June 1962)
4 years 4 months
3 years 7 months
4 years S months
Prior to 1960 the bear market lows occurred duringthe year following a presidential election; after 1960they have occurred in the second year after eachelection; that is, the year of midterm congressionalelections. Since the trough was reached in October inhalf of the bear markets, it is a great temptation toconclude, based on time patterns, that the next bigopportunity for stock purchases could be in October1978.
36 37
The bear market that occurred during the 1960presidential election year probably has had an importantand lasting influence on the timing of Federal Reservemonetary policies. The 1960 bear market reached itsbottom just a few days before the election, timing thatseemed almost designed to have maximum impactagainst the incumbents who were running. Following a$12 billion federal budget deficit in fiscal year 1959,President Elsenhower was determined to leave officewith a balanced national budget. A policy of fiscalrestraint was adopted and fiscal year 1960 had a rarebudget surplus. In addition, the Federal Reserve Boardhad a restrictive monetary policy. The results includedcredit restraints, higher interest rates, a mild recession, adecline in stock prices of 17 percent, and a loss of theelection by Richard M. Nixon to John F. Kennedy by.1 of 1 percent of the vote. The economic policies ofthe Elsenhower Administration and the restrictivepolicies of the Federal Reserve were cited as among theprincipal reasons for the Republican loss.
In order to conclude that there will be in the futurea cycle pattern consisting of a strong presidential-election-year economy with strong stock prices, and a periodbetween elections with a weak national economy anddeclining stock prices, it is necessary to anticipatewhether U. S. Presidents will act in their own self-interestand in the interest of their political party, or whetherthey will disregard this and take actions, as PresidentEisenhower did in 1960, that may help the oppositionparty to elect its candidates.
If we regard the fiscal actions in 1960 of PresidentEisenhower and the Fed as an aberration, then the cyclewould have had a span of four years and eight months,close to the normal span for a price cycle. It isreasonable to conclude that President Eisenhower'selection-year anti-inflation policy was an exception,since most incumbent politicians are expected totake actions that will assist their re-election or thecontinuation in office of their political party.
With the exception of the third stock-price cycle,which began in 1957 and ended in 1960, all of the othersix cycles began prior to the presidential-election yearand ended after the election.
The Biggest Boom and Bust, 1927-32
The severe economic recession of the 1930s had many ofits origins in the boom of the 1920s. When the boomfinally ended the nation's economy began its descentinto the Depression of the 1930s. The pattern ofeconomic boom and bust was to recur many timesduring the following decades, but not on the scale of thelate 1920s and early 1930s.
The boom and bust of the 1920s appear to havehad little relation to the presidential election of 1928.The monetary inflation of the late 1920s originated inthe easy money policies of the Federal Reserve Board ofNew York, which was pressured by the Bank of Englandand other European central banks to inflate theAmerican economy in order to relieve pressure on theircurrencies. The flood of money released in 1927 and1928, combined with a mood of unbounded optimism,led directly to the debacle of 1929.
When stock prices began to decline in late 1929,the pyramid of credit on which purchases had beenmade collapsed, triggering heavy liquidation. Speculatorswho had bought on margin were forced to sell in orderto cover their loans from banks and brokers.
The evaporation of wealth caused by the 1929stock market crash brought about the economicDepression of the 1930s. In Germany the depression waseven more severe than in the United States; one resultwas the rise to power of Adolph Hitler.
It was during the desperate days of the 1930s thatthe first steps were taken to control economic ups anddowns by means of Federal Government actions. Theability to control the nation's economy opened the way
for subsequent abuses, as politicians sought to have astrong economy when it was in their personal interest.
The wild speculation of 1928 and 1929 and theresulting crash were able to occur because the FederalReserve Board did not have the weapons to slow askyrocketing stock market. It was several years after the1929 panic that the Fed was given the authority to setmargin requirements.
Easy credit by banks played a large role in theheavy speculation of those years and in the crash thatfollowed. The Fed's easy-money policy of 1927 was acontributing factor in the rapid expansion of bank creditfor stock market speculation, which allowed commercialbanks to overextend themselves in loans for stockpurchases. During the summer of 1927 the discount ratewas lowered from 4 percent to 3.5 percent. A yearlater, in mid-1928, it was raised to 5 percent. InSeptember 1929 the discount rate was raised to 6percent in New York, but it was lowered to 5 percent onNovember 1 and to 4.5 percent on November 15,1929. This was after stock prices had started their steepplunge. But a large percentage of the selling was forcedselling because of overextended credit. One estimate hasbeen made that more than a million Americans werecarrying about three hundred million shares of stock onmargin.
Mass emotion also moved from euphoria—"Be abull on America" was one slogan of the period—to panic.Inflation quickly changed to deflation and huge losses ofvalues and buying power.
The Roosevelt Recovery and Recession, 1932-38
The depths of the Great Depression were reached in1932, and in that year the nation's economy slowlybegan to move upward. Much of the economic recoverywas the result of policies taken by the new RooseveltAdministration to stimulate the economy. This was the
40
beginning of the New Deal. By 1936 the nation was wellon its way to economic recovery. But it was during thisperiod that the Federal Government gained new controlsover the direction of the nation's economy, controlsthat they quickly learned to abuse.
Federal Government control of the nation'seconomy and the temptation by American presidents tomanipulate the economy for their own purposes startedduring the New Deal era. In 1936 British economistJohn Maynard Keynes wrote his General Theory ofEmployment Interest and Money, which advocatedgovernment control and regulation of the wholeeconomic life of a nation. The principal instruments ofKeynes's policy were to be national budgetary deficitsand surpluses, variations in the rate of interest, and theuse of government-financed projects. A goal was tomanage the economy so that total demand was high, yetnot so high as to drive up prices in an inflationary spiral.
Keynes's theories had widespread impact amongFranklin Roosevelt's New Deal bureaucrats, and theeconomist was admired and respected by FOR himself.Many of the policies advocated by Keynes were acceptedby Washington and have been used extensively since theDepression years.
This period was the beginning of manipulation ofthe nation's economy by politicians, frequently fornarrow partisan purposes. Franklin D. Roosevelt wasprobably the first president to take steps following apresidential election to collapse a booming economydeliberately, after having made efforts to create theboom prior to the election. This began the pattern ofpresidential delight with booming economic conditionsprior to the election and publicized presidential concernabout inflation following the election.
By 1936 the United States was beginning to recoverfrom the Depression. An editorial in The Nation onNovember 7, 1936, commented: "Whether by good luckor good management President Roosevelt went into theelection campaign with economic conditions better, on
41
the whole, than at any time since the end of 1929. Thistide of recovery set in so relentlessly in the last fewmonths that the campaign against the New Deal oneconomic grounds virtually collapsed." The editorialcontinued: "Even before the recent favorableannouncements by the steel companies, the New YorkSun pointed out that the aggregate net earnings of thefirst 113 industrial companies had increased nearly 47percent in the third quarter of 1936 over their earningsin the same period a year ago, while the net profit of thesame companies in the first nine months of 1936 was52 percent higher than in the corresponding months of1935."*
But the cost of living was also rising. Severalmonths after the election, John Maynard Keynes stated:"The time has passed for the government to try tostimulate business activity and ... it should now devoteits efforts to the contrary policy, a deliberate attempt toslow down the forces threatening boom conditions."Keynes's statement was followed by an FOR speech inwhich he warned that "the dangers of 1929 are againbecoming possible, not this week or month but within ayear or two," and also blasted the high prices ofcommodities, particularly copper and steel. His speechreflected his sense that the business of recovery from theDepression was at an end and his new concern withinflation.
The pattern of American presidents waiting untilafter national elections to signal slowdown policies hadbegun. A member of the Federal Reserve Boardannounced that the Government would drop its policyof stimulating heavy industry. The Fed began to tightencredit. Earlier, in August 1936, it had increased memberbank reserve requirements by 50 percent.
Stock prices reacted by declining sharply. Anothereditorial in The Nation on May 8, 1937, commented onthe reaction: "For a few days toward the end of April it
'Reprinted with the permission of The Nation.
seemed as if the scenes of October, 1929, might bere-enacted. Prices had been falling for weeks, fromMarch 6 to April 28 the New York Times index of stockprices declined from 142.12 to 126.76, but most of thatloss occurred within the last week of the month. Whatcaused the decline? Does it herald a slump in businessactivity or, as the financial pages of the newspapers tellus, should we dismiss it as a mere reaction fromover-speculation? Business conditions in general areextremely satisfactory." The editorial continued: "Sincebusiness reports remain excellent, it is evident that weshall have to look elsewhere for the cause of the stockmarket decline. Two sets of influences appear to be atwork, one domestic and the other international. Primaryamong these is the growing belief that the governmentintends to check inflation by various restrictivemeasures. The present recession really started with theannouncement of higher reserve requirements for themember banks of the Federal Reserve System. It hasreceived its greatest impetus from the series of warningswhich the President has issued against price increases andspeculation. These domestic influences have beenreinforced by a worldwide drop in commodity pricescaused, apparently, by the lessening of the danger ofimmediate war in Europe.... As matters stand atpresent, the decline in prices should not be viewedas cause for alarm but as a healthy reaction fromover-speculation. Another possibility remains, however.The decline in prices itself might induce a newdeflationary cycle. Panic, like boom psychology, iscontagious."*
The bear market of 1937 was one of the most severeon record. The Dow Jones industrial average plunged froma high of 195.6 in March 1937 to a low of 98 in March1938. The nation's economy, which had been starting toboom at the time of the 1936 presidential election, fellinto a recession, a newly-coined word. FOR did not want
•Reprinted with the permission of The Nation.
to be accused of dumping the nation into a depression.But steel production declined to only 19 percent ofcapacity.
World War II and Immediate Postwar
The threat of war, and then the outbreak of World War IIand the great armaments production associated with it,propelled the American economy on to a strong newupward course.
World War II dominated the national economyduring the early 1940s, and fear of a postwar recessionwas the dominant influence during the years immediatelyfollowing. Wall Street was bearish. The pessimism causedthe short interest to reach its highest Iqvels since 1933.In November 1948 Harry Truman was re-electedPresident of the United States with a surprise victoryover Thomas E. Dewey. Following the election, stockprices promptly collapsed and continued to decline untilmid-1949, when an economic recession that lasted formost of 1949 began.
Cycle 1: 1949-53
The first postwar stock-price cycle began at the June 14,1949, Dow Jones industrial average low of 160.6. Duringthe spring of 1949 the Federal Reserve decreased marginrequirements, thus increasing investors' purchasingpower, and three times decreased the reserve requirementsof banks that were members of the Federal ReserveSystem, thus increasing the amount of funds availablefor loans. In July, President Truman appraised therecession as "moderate" and proposed stimulating theeconomy.
By 1952 the national economy was booming, aidedby the arms produced for the war in Korea. Personalincomes were at record levels and retail spending was atits highest peak ever. In 1952 consumer credit increased
44
by $3 billion to $23 billion at year's end, and homeconstruction had its second-biggest year on record. Butthere were also warnings of runaway inflation. InDecember 1952 borrowing by member banks of theFederal Reserve System hit a twenty-one-year high.
From the June 1949 low, stock prices advanced forthree years and seven months to a Dow Jones industrialaverage high of 295.06 on January 5,1953, just twomonths after the 1952 presidential election in whichRepublican Dwight D. Eisenhower defeated DemocratAdlai Stevenson.
Within days after taking office, the EisenhowerAdministration began making moves to slow down theinflation rate. The Treasury and Federal Reserve Boardtook steps to trim the expansion of credit. The federalfunds rate—the interest banks charge each other onloans—was increased. Efforts were made to cut thebudget and to decontrol the U. S. economy. In June theFederal Reserve Board raised the discount rate and soldthirty-year government bonds through its open marketoperations, thereby taking money out of circulation.
But the nation's economy was already declininginto a recession that lasted until the summer of 1954.The hard-money policy was reversed. Credit wasexpanded; interest rates were kept from going higher;and the Federal Reserve Board lowered the reserverequirements for member banks.
From their January 1953 high, stock prices declinedfor eight months to a September 15, 1953, low of254.36, which completed the first postwar stock-pricecycle of four years and three months.
Stock-price cycle 1 had a rise of 84 percent (DJI),then a decline of 14 percent.
Cycle 2: 1953-57
The second postwar stock-price cycle began at theSeptember 1953 low. For two years and seven monthsstock prices advanced to a high in the Dow Jones
industrials of 524.4 on April 9, 1956, a presidential-election year. The national economy was again booming.Consumer credit rose sharply. There was an enormousdemand for money, which resulted in rising interestrates. Every economic measure indicated that 1956 hadeclipsed all previous years; the gross national productrose 6 percent. But the cost of living also increased,and inflation was a problem.
Following his 1956 re-election, in January 1957,President Elsenhower stated in his message to Congressthat inflation was the main domestic problem. Severalweeks later he threatened to use wage and price controls.One reaction was a severe dip in stock prices. But byJuly 1957 stock prices rebounded and the Dow Jonesindustrials rose to within a point of their all-time highreached in April 1956. But in July, Federal ReserveBoard chairman William M. Martin stated that "inflation,not deflation, is the real danger." The Fed's tight-moneypolicies slowed the boom. Steel production fell to70 percent of capacity and automobile output alsodeclined. Inventories were at high levels; the rapidexpansion rate of business had created new capacity thathad to be absorbed. By the end of 1957 the Fed wasmoving slowly to make credit more plentiful.
From the July 1957 high, the Dow Jones industrialaverage declined rapidly to a low of 416.2 on October 22,completing the second postwar stock-price cycle, whichlasted four years and one month. The price cycle had arise of 106 percent, then a decline of 21 percent.
Cycle 3: 1957-60
The third stock-price cycle began at the October 1957low of 416.2, a level that was almost duplicated again inDecember, to form a "double bottom" formation onstock charts. In January 1958, during the recession,stock prices began to rise strongly and by year's endwere up 37 percent.
The recession was over by early summer 1958 and
the economy again turned strong. By July 1959employment and personal income were at all-time highs*The U. S. economy was growing rapidly. Housingconstruction was booming, but housing costs wereexperiencing upward pressures.
There was a strong bull market in stocks; by Julythe Dow Jones industrial average had advanced aboutninety points since the first of the year. The strengthcontinued for the rest of 1959, finally peaking onJanuary 4,1960, at 688.2 for the Dow Jones industrials.
The booming economy and the continuing rise incommercial loans caused the Fed to become concernedabout the increasing demand for money. Businessmentend to "bunch up" their demand for credit, overspendingfor capital goods and inventories when business is good.In early September 1959 the Fed increased the discountrate to 4 percent, which was the highest level intwenty-four years, and the fifth increase in the rate sincethe 1957-58 recession, when the Fed set the discountrate at 1 3/4 percent as an aid to recovery.
The tight-money policies were effective in slowingthe economy. Stock prices also declined irregularly forten months. The Dow Jones industrial average reachedits low of 564.2 in October, just a few days before the1960 presidential election. The October low was the endof the third postwar stock-price cycle.
The declining trend of the economy and the stockmarket in 1960 was unusual for a presidential electionyear. Either the cycle timing could not be managedeffectively, or 1960 was one presidential year when toppolicymakers were not trying particularly hard to winthe election. It is possible that the 1957-58 recessionhad occurred too early and that therefore the economyhad also rebounded too soon and with too muchstrength in 1958, thus causing the new cycle to reach itspeak too quickly from the point of view of politiciansrunning for office. If restrictive economic policies arestarted too soon after a presidential election, thedeflation-reflation cycle is likely to run ahead of a
47

politically desirable schedule. But it is often necessary totake the step sooner than is desirable if inflation isaccelerating at a high rate. From a political point of viewa better time to begin slowing the economy is at the endof the first year following a presidential election. Thistiming would permit about a year to fight inflation withslowdown measures and another year of recoveryleading to a highly prosperous period during the nextpresidential election year, which would be near the topof the cycle. But the desire by presidents to boom theeconomy prior to elections has also caused them to takeanti-inflation measures sooner than would be necessarywithout the additional stimulus.
During stock-price cycle 3 the rise was 39 percentand the decline 18 percent.
Cycle 4: 1960-62
The fourth cycle in the stock averages began at theOctober 1960 low, which was 564.2 on the Dow Jonesindustrial average. Expansive monetary measures wereimplemented by the Federal Reserve Board during thesecond half of 1960. The Fed decreased the discountrate twice, decreased margin requirements, and alsotwice decreased the reserve requirements of memberbanks. These measures helped to trigger off a strongstock market. Also effective was the rhetoric ofpresidential candidate John F. Kennedy, who promisedto "get the country moving again."
The result was a very strong stock market in 1961.By late 1961 price/earnings levels were the highest inrecent history, higher even than 1929. Numerous stockswere selling for forty, fifty, or eighty times their annualearnings. But the mania for growth caused prices toreach levels that discounted earnings too far into thefuture. Stock prices were too high relative to presentand prospective earnings.
Business profits were up sharply in 1961 and therise was expected to continue through 1962. There
48
was comparatively little inflation in the economy.Although business was improving, there was noboom.
In December 1961 stocks plunged sharply. Fromthe high of 741.3 on November 15, the Dow Jonesindustrial average declined to 524.6 in April 1962, whichcompleted the fourth stock-price cycle.
Stocks plunged in late 1961 and early 1962primarily because many investors perceived that priceswere too high compared with the price/earningsratios of stocks in the past. Many large investors wereattracted to the yields available from bonds; bond yieldshad increased their spread considerably over theyields available from stocks. Moreover, beginning onJanuary 1, 1962, the Federal Reserve Board allowedcommercial banks to increase their interest rates onsavings accounts. Mutual savings banks, and savings andloan associations, also increased their rates. Someinvestors were probably tempted to take profits andplace their capital in a safe place until another attractivebuying opportunity came along. One did, only sixmonths later, in June 1962.
The price cycle had a rise of 24 percent on theDow, then a decline of 29 percent.
Cycle 5: 1962-66
The fifth cycle in the stock averages began at the June 25,1962, low of 524.6 by the Dow Jones industrials andextended past the 1964 presidential election to 1966.This was a period of buildup for the Vietnam war andthe beginning of "Great Society" domestic programs. InNovember 1963 Lyndon B. Johnson became President ofthe United States following the assassination of PresidentKennedy.
In January 1964, a presidential-election year,President Johnson proposed an income tax cut,planned earlier by President Kennedy. The Presidentand his economic advisers predicted that the cut would
49

spark a boom in business that would add $42 billion tothe gross national product. The main stimulus forthe record boom was expected to be spending byindividuals.
The income tax cut became effective in March 1964.The withholding tax rate dropped from 18 to 14 percent,and the amount withheld from paychecks was reducedimmediately. Retail sales were up; bank credit expanded;the nation's money supply increased. A deliberatelyplanned boom was accelerating.
But by election day, an election that LyndonJohnson won by a landslide against Senator BarryGoldwater, concern was being expressed about theincreasing inflation. Prices were rising for many rawmaterials and manufactured items. Wages were alsorising. Economist Arthur Burns warned that aninflationary psychology was reasserting itself.
During early 1965 the nation's economy continuedto boom. The Federal Reserve Board warned of thedeterioration of credit. But by April the crisis inVietnam had intensified. A bigger war was anticipated.By summer the war in Vietnam had speeded up.The boom in the national economy, which wasproviding both butter and guns, continued toaccelerate.
The stock market rose steadily from its 1962 lowsand continued an upward trend through 1963 and 1964.In April and May of 1965 the Dow Jones industrialaverage dropped about 100 points as a result of thewar's intensification. But stock prices rebounded andreached new highs just over 1,000 in January andFebruary 1966. From there they declined steadily formost of 1966, establishing bear market lows onOctober 10 at 735.7 on the Dow Jones industrialaverage, which completed the fifth postwar stock-pricecycle. The rise was 48 percent (DJI) and the decline26 percent.
The 1966 bear market was not accompaniedby an "official" recession. Nevertheless, the drop
50
in the gross national product was substantial in 1967.
Cycle 6: 1966-70
The sixth postwar stock-price cycle began at the lows setin October 1966; on the Dow Jones industrial averagethis was 735.7. The price cycle peaked about a monthafter the 1968 presidential election.
Like most of the economic booms, the boomof 1967-68 was stimulated by heavy Federal Governmentspending. The fiscal year ending June 30, 1967, hadan $8.7 billion deficit and the fiscal year ending June 30,1968, had a $25.2 billion deficit. This was a period ofbig spending by Washington for the war in Vietnam andother defense programs, and for welfare, education, andthe rebuilding of cities. It was a period of acceleratinginflation, and the main culprits were the FederalGovernment's heavy spending and large deficits, whichrequired it to borrow in competition with individualsand businesses. Commercial banks were forced to relymore on loans from the Federal Reserve. By January1968 even President Johnson had been persuaded that atax increase was necessary. In his State of the Unionspeech he asked Congress to enact a 10 percent taxsurcharge for the 1969 fiscal year, which meant thatmost of the tax would be collected after the November1968 presidential election.
In February, Federal Reserve Chairman Martinwarned of the very dangerous level of speculation in thestock market. He disclosed that the Fed was consideringincreasing the margin requirement. He blamed speculativeexcesses on inflation psychology—the belief thatinflation would continue and become worse. Stocksdeclined sharply but quickly rebounded. Credit wasgradually tightened by the Federal Reserve Board overa period of several months in order to curb inflation andto strengthen the dollar abroad. The chairman of theFederal Reserve warned again of inflation and blamedthe federal budget and its continuing deficits. He
51
predicted that an uncontrollable recession or anuncontrollable inflation would result, and called it theworst financial crisis for the United States since 1931.
By late spring of 1968 rising interest rates and thegrowing tightness of mortgage credit were hamperinghome construction, which was also affected by zoomingconstruction costs. Wages set new record highs and retailsales boomed. Economists announced that the inflationspiral could be stopped only by a sizable slump inbusiness activity, but they noted that political pressuresweighed heavily against such an inflation cure in anelection year. They predicted a recession in 1969.
Meanwhile speculation in stocks was widespreadand the volume of trading reached new high levels. Thestock market surged on the talk of peace in Vietnam.
By August 1968 the money managers in Washingtonwere being pressured from all sides. The Federal ReserveBoard received a vast amount of conflicting advice totighten or to loosen money and credit. Economists ofthe Johnson Administration warned the Fed of anembarrassing slowdown in business as early as electionday. The cost of credit began to decline. Moves weretaken by the Fed to lower the discount rate. High-levelofficials of the Johnson Administration expressed theirdelight at the action of the Federal Reserve.
In the fall of 1968 the business boom remainedstrong. Prices continued to rise. The JohnsonAdministration revealed that it was not able to makethe $8 billion in spending cuts that it had agreed to inthe spring in exchange for cooperation from Congress.Chairman Martin of the Federal Reserve Board stated:"We are in the midst of an inflation that is changing thecharacter of this country." He warned of a possible newtightening of money and credit. But the ChaseManhattan Bank in New York announced a reduction inthe bank's prime rate from 6.5 to 6 percent. Severaldays later another banker stated that the Federal ReserveBoard had turned prematurely toward a stimulativemonetary policy. Other bankers and economists foresaw
52
continued inflation. One pointed out that we have aninflationary bias woven into our system. "Whenunemployment goes up you get into a politicallycontroversial area," he said.
Several days after the 1968 election, which waswon by Richard Nixon over Vice-President HubertHumphrey and George Wallace, one of Nixon's economicadvisers, and the leading authority on business cycles,was interviewed. Dr. Arthur Burns expressed theopinion that expansion in the supply of money andcredit should be slowed and that the most pressingproblem was bringing inflation under control.
By mid-December there were fears of runawayinflation. Money managers began tightening credit again.On December 17 the Federal Reserve Board ordered thediscount rate increased to 5.5 from 5.25 percent.Banks raised their prime rates.
On January 24, 1969, even President LyndonJohnson, in his final economic report to Congress, calledfor a strategy that would slowly reduce inflation and theexcessive boom in business. He recommended aslowdown in Federal Reserve Board money and creditexpansion. The Nixon Administration agreed and theFed proclaimed its intent to curb credit gradually.
The stock averages began to decline in mid-Decemberand the slide continued irregularly until late May 1970,when the climax of a selling panic occurred. The bottomon the Dow Jones industrial average was at 627.5 onMay 26, which was the end of the sixth cycle. The DowJones industrial average rose 26 percent, then dropped37 percent.
A business recession began in late 1969 and lastedfor most of 1970. Fiscal year 1969 had a rare budgetsurplus of $3.2 billion, and fiscal year 1970 had arelatively small budget deficit of $2.8 billion.
The considerable concern and manipulation bytop-level officials in Washington lest the nationaleconomy might not stay healthy long enough to helptheir side in the 1968 presidential election once again
53
points up two facts: A strong economy at election timeis an important goal to high-level politicians, and theyare sometimes inept at attaining that goal. As a resultbusinessmen, employees, stockholders, retirees, andmany other Americans all suffer from too muchinflationary boom prior to elections and too mucheconomic recession following them. A more stableapproach would be to avoid the overstimulus oflarge-scale federal spending and budget deficits, whichwould also permit a more gradual approach whentightening money. Equally important would be planningthe timing of economic downturns so that they occurlater in the political cycle. If a recession occurs too soonafter an election, then the recovery is also likely tooccur ahead of schedule and might begin a downturn aselection day nears. To politicians up for re-election thatis bad news, so they are likely to apply pressure foradditional economic stimuli, such as tax cuts or increasedgovernment spending, even though inflationarypressures would call for the opposite actions.
Cycle 7: 1970-74
The seventh cycle began at the May 1970 trough, whichwas 627.5 on the Dow Jones industrial average. A changein monetary policy toward more plentiful and cheapermoney had been adopted several months before theMay trough was reached, and the Fed continued theexpansionist policy through 1971 and into 1972.Fiscal policy was also inflationary. The deficit in thefederal budget for the fiscal year ending June 30, 1971,was $23 billion, and the deficit for the 1972 fiscalyear was $23.2 billion. Following weakness in late 1971the Dow industrials became strong and trended upwarduntil after the November 1972 presidential election.But inflation was again becoming a large problem, andagain a policy of monetary restraint was adoptedfollowing the presidential election, which resultedin a gradual slowing down of the economy in 1973
and 1974. Stock prices had their greatest declines since1929.
The Dow Jones industrial average reached a peak of1067.2 in January 1 973 before starting a long downtrendto the severe sell-off s of 1974. However, other stockaverages reached their peaks prior to the Dow industrials.The Dow Jones transportation average reached its peak inApril 1972. Standard & Poor's low-priced stock indexpeaked in the spring of 1971, and the American StockExchange market value index reached its peak levels in thespring of 1972. The broadly based New York StockExchange composite index, which includes all of thecommon stocks on that exchange, reached its peakin January 1973, the same month as the Dow Jonesindustrials. The NYSE average is considered to be the bestmarket average that can be constructed, si nee it includesall of the common stocks on the New York StockExchange, and they are also weighted by capitalization,thus taking into account the variations in size ofcompanies. All of the stock averages completed theseventh cycle during the "double bottom" of October andDecember 1974. The lowest levels of some stock averageswere reached in October; others had their lows inDecember. The Dow Jones industrial average reached itslow in December at 570.0; the New York Stock Exchangecomposite index and Standard & Poor's 500-stockaverage had their lowest levels in October.
Stock-price cycle 7 had a rise of 41 percent and adecline of 46 percent.
Cycle 8: 1974-
The eighth stock-price cycle began at the December 1974low in the Dow Jones industrial average and rose sharplyfrom deeply oversold conditions. A few months later, inApril 1975, the nation's economy began to recover fromthe trough of the recession. The economic stimulus camefrom federal policies calling for a large decrease in incometaxes, a record budget, and expansive monetary policies

by the Federal Reserve Board, including decreases in thediscount rate and in the reserve requirements of memberbanks. The results were soaring stock prices and aneconomic recovery prior to the 1976 presidential election.
Summary of the Stock-Price Cycles
During the last two political-business stock-price cycles,policies fostering economic contraction began soon aftereach election and stock prices reacted by declining.Following the November 1968 election the bull markethigh was attained in December 1968, and following theNovember 1972 election the bull market high was reachedin January 1973. But following the 1960 and 1964elections the bull market continued for slightly more thana year in both cases. The bull market high following theNovember 1960 election occurred in November 1961, andthe bull market high following the November 1964election came in February 1966. But in both cases, as inthe two later cycles, a bear market occurred before theeconomy began a new rise prior to the next presidentialelection. The timing of the stock-price cycles is shown inthis table.
Table 2
Bear MarketLow
June 1949Sept. 1953Oct. 1957Apr. 1962Oct. 1966May 1970Oct. 1974
PresidentialElection
Nov. 1952Nov. 1956Nov. 1960Nov. 1964Nov. 1968Nov. 1972Nov. 1976
Bull MarketHigh
Jan. 1953Apr. 1956, July 1957
Nov. 1961Feb. 1966Dec. 1968Jan. 1973
The upper turning point of the stock-price cyclefollowing the November 1952 election occurred inJanuary 1953, two months after the election, but theNovember 1956 election was straddled by a "triple top."Stock prices reached unusual, almost identical, peaksseven months before the election, three months beforethe election, and eight months after the election. Asmore investors became aware of the record of stock-pricedeclines following a presidential election there shouldbe a tendency for stocks to reach their highest levelssooner, perhaps even before election day.
Each of the eight cycles has been assisted in itsinitial price upswing by expansive measures of theFederal Reserve Board. Stimulative monetary policieswere taken in 1949, 1953-54, 1957-58, 1960, 1962,1967, 1970-71, and 1974-75. Each of these periods wasclose to the bottom of a trough in stock prices. Stockprices rose sharply in each case following the adoptionof expansive monetary policy by the Fed.
56

Chapter 5Look for Low Risk
One significance of the stock-price cycle to individualinvestors is that it offers a strategy. Investors shouldknow approximately when to expect opportunities tobuy stocks at relatively low risk.
Stock purchases should be made when the risk ofloss appears to be minimal and the potential for large gainappears to be very good. In the past the best opportunitiesfor large gains with slight risk have been near the bottomsof the bear markets which have occurred regularlyabout every four years. The safest time to invest is whenthe market appears weakest after a long decline. Whenthe national economy is booming and inflation isbeginning to be of concern, stock prices often begin todecline because some investors anticipate federalanti-inflation policies such as tight credit. At bear marketbottoms, however, this does not appear to be true. Stockprices usually continue to decline in bear markets evenafter the Fed has switched from a policy of monetaryrestraint to one of monetary ease. For example, inFebruary and March 1970 there was widespreadexpectation among economists that the Fed would soonease up on credit, and the Fed itself stated that tight-creditpolicies would be relaxed gradually as the year progressed.But it was not until late May that the bear marketplunged to its final low and prices began to rebound.
Buy During the Selling Climax
For a general approach to successful investing, plan topurchase stocks when the market is forming a basefollowing a bear market, and plan to sell stock whenbull markets are beginning to grow old. Many investors

evidently have difficulty taking these actions, particularlywhen it comes to selling stocks. There is vast professionalassistance available in selecting stocks for purchase, butin determining when to sell a stock, the individualinvestor is usually on his own.
If you are interested in purchasing some stock, andthe stock averages are in a bear market, wait until thereis evidence which indicates that the end of the downwardmovement has arrived. The evidence could include verysharp price declines with a big increase in volume, thenumber of stocks declining vastly exceeding thoseadvancing. If you follow stock prices closely, you willrecognize the selling climax when panic selling reaches apeak. Most newspapers will feature the event in bannerheadlines and stock market analysts will be quoted assaying that the Dow Jones industrials will fall another150 points. There will be long lists of new lows but few,if any, new highs. If you miss buying during the sellingclimax, wait a few weeks and you might have a secondchance—the market often tests the earlier low, followinga technical rally. There will be other evidence that thebear market low is at hand or near. The Federal ReserveBoard is likely to begin increasing the nation's moneysupply. Stock market margin requirements are oftenreduced. Policies of the Federal Reserve can stimulatethe stock market; they can also depress it if the boardbelieves that action is desirable.
During bear markets emotions play a very importantrole in the sales of securities, particularly when the bearmarket is in its final selling climax stage. Both sellers andbuyers expect lower prices. Sellers dump their stocks inpanic because they feel certain that the price will continueto decline. Buyers hold back because they expect evenbigger bargains to be available in a few weeks. In thisperiod, when emotions are the dominant influence onstock prices, values become distorted and outstandingbuying opportunities are available.
Although most recent bear markets have endedwith a selling climax and a strong trend reversal, bear
60
markets do not necessarily have to end that way.Sometimes a bear market bottom can be protracted, andthe subsequent bull market recovery slow and gradual.
A more difficult problem arises when youwant to invest but the market is not at a depressed,bargain-basement level. However, stock prices move intrends which, once established, tend to continue. It isimportant to determine whether the trend of the market,as indicated by the various averages, is bullish. The specificstocks that interest you might remain bullish even in ageneral bear market, but the odds are very good that theywill not. In bull markets we usually have a market ofstocks, with some very bullish, some bearish, and someinconclusive. But in a strong bear market almost everystock turns weak. Try to determine whether the FederalReserve Board is tightening or easing credit. Also try todetermine the trend of earnings of corporations. Thecombination of rising earnings and an expanding moneysupply should indicate a continued bull market.
Trade With the Market's Primary Trend
The most influential factor determining the direction ofspecific stock prices is the primary trend of the market.So, to be consistently successful in the stock market, itis important to trade with the market's trend. Do not bea bull in a bear market. When there is a bear market, it iswise to be either in cash, ready for a buying opportunityat the bottom of the decline, or a short seller if you areknowledgeable about selecting good candidates for shortsales. When the primary trend of the stock market isdown, even the best and strongest stocks have difficultybucking the trend.
When an investor is considering the purchase ofsecurities during periods between the major turningpoints at bull market tops and bear market bottoms, oneof the first things he must determine is the direction ofthe primary trend. He must also try to estimate how
61
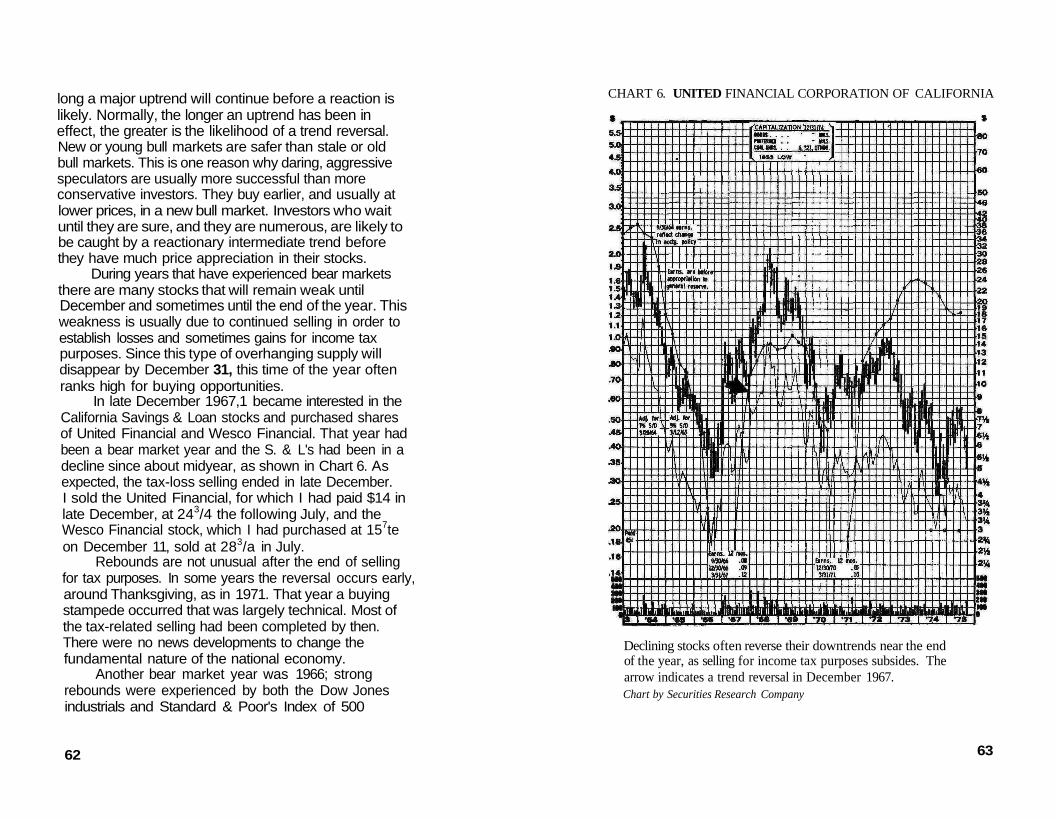
long a major uptrend will continue before a reaction islikely. Normally, the longer an uptrend has been ineffect, the greater is the likelihood of a trend reversal.New or young bull markets are safer than stale or oldbull markets. This is one reason why daring, aggressivespeculators are usually more successful than moreconservative investors. They buy earlier, and usually atlower prices, in a new bull market. Investors who waituntil they are sure, and they are numerous, are likely tobe caught by a reactionary intermediate trend beforethey have much price appreciation in their stocks.
During years that have experienced bear marketsthere are many stocks that will remain weak untilDecember and sometimes until the end of the year. Thisweakness is usually due to continued selling in order toestablish losses and sometimes gains for income taxpurposes. Since this type of overhanging supply willdisappear by December 31, this time of the year oftenranks high for buying opportunities.
In late December 1967,1 became interested in theCalifornia Savings & Loan stocks and purchased sharesof United Financial and Wesco Financial. That year hadbeen a bear market year and the S. & L's had been in adecline since about midyear, as shown in Chart 6. Asexpected, the tax-loss selling ended in late December.I sold the United Financial, for which I had paid $14 inlate December, at 243/4 the following July, and theWesco Financial stock, which I had purchased at 157teon December 11, sold at 283/a in July.
Rebounds are not unusual after the end of sellingfor tax purposes. In some years the reversal occurs early,around Thanksgiving, as in 1971. That year a buyingstampede occurred that was largely technical. Most ofthe tax-related selling had been completed by then.There were no news developments to change thefundamental nature of the national economy.
Another bear market year was 1966; strongrebounds were experienced by both the Dow Jonesindustrials and Standard & Poor's Index of 500
62
CHART 6. UNITED FINANCIAL CORPORATION OF CALIFORNIA
Declining stocks often reverse their downtrends near the endof the year, as selling for income tax purposes subsides. Thearrow indicates a trend reversal in December 1967.Chart by Securities Research Company
63

Composite Stocks. The Dow industrials ended 1966 atabout 780. By early February they were at 871. Similarpatterns can be found near the end of other bear marketyears such as 1957, 1960, and 1962. They offeropportunities for alert investors.
In late 1974 the market averages declined to a bearmarket low on October 4. The market then reboundedstrongly and the Dow Jones industrials gained about 100points. But the market declined again and during thesecond week in December reached levels slightly abovethose of October 4. From the early December lows themarket advanced mildly. Then, after January 1, pricessurged on high volume. The strong market lasted formore than six months. It is interesting to note that therally occurred while the nation's economy was stillsliding into a recession. The strong stock market rallyhappened because almost everyone who was consideringselling would have done so by the end of December, forincome tax reasons. With selling for tax purposes out ofthe way, many investors were aware that the market wasseriously oversold and that a rebound was due in spite ofthe bad economic news. Other buyers anticipated theeconomic recovery following the recession. So stockmarket prices moved, as they so often do, months priorto the actual economic recovery.
In late 1975 stock prices again trended downwardand again made a low—an intermediatejow—duringthe first week in October. This was followed by aneighty-point rally and decline, which ended again inearly December. From early December the marketslowly strengthened and once again exploded in a highvolume rally after January 1,1976. The Dow Jonesindustrial average gained more than 120 points inJanuary, and the volume of trading for the month brokeall records on the New York Stock Exchange. Again theremoval of the supply of stock being sold for taxpurposes was an important cause for the new marketstrength. Many earnings estimates for the next year arealso made in December, an additional stimulus.
64
Part IIIWhich Stocks Should You Buy?

Chapter 6Safety First
The first consideration in buying stock is safety. It isgood policy to allot only a fraction of available funds forinvestment in stocks. It is also important to keep inmind that safety is derived more from the good timingof the purchase and less from the financial strength ofthe company. The stocks of the nation's largest andstrongest corporations have dropped drastically duringgeneral stock market declines.
The Biggest Also Decline
When stock market averages reached a new 1973-74 lowon October 4, 1974, the two-year decline in the value ofstock holdings exceeded $500 billion. The steep declinein market values affected investment companies, mutualfunds, pension funds, insurance companies, foundations,and college endowments as well as millions of individualinvestors. In addition to speculative stocks, the strongestof growth stocks and high-quality stocks of greatfinancial strength were also affected. The drop in marketvalue of IBM exceeded $30 billion, of Sears Roebuck$12 billion, of AT & T $7 billion, and of Exxon $10billion. General Motors and Eastman Kodak bothdeclined more than $14 billion in value.
The two-year price declines of individual stocksincluded Avon Products from 140 to 185/s, Polaroidfrom 143 V2 to 141/8, IBM from 3651/4 to 150 V2,and Sears Roebuck from 123 1/4 to 41 1/2. Numerousother quality stocks suffered declines as severe asthese.
67
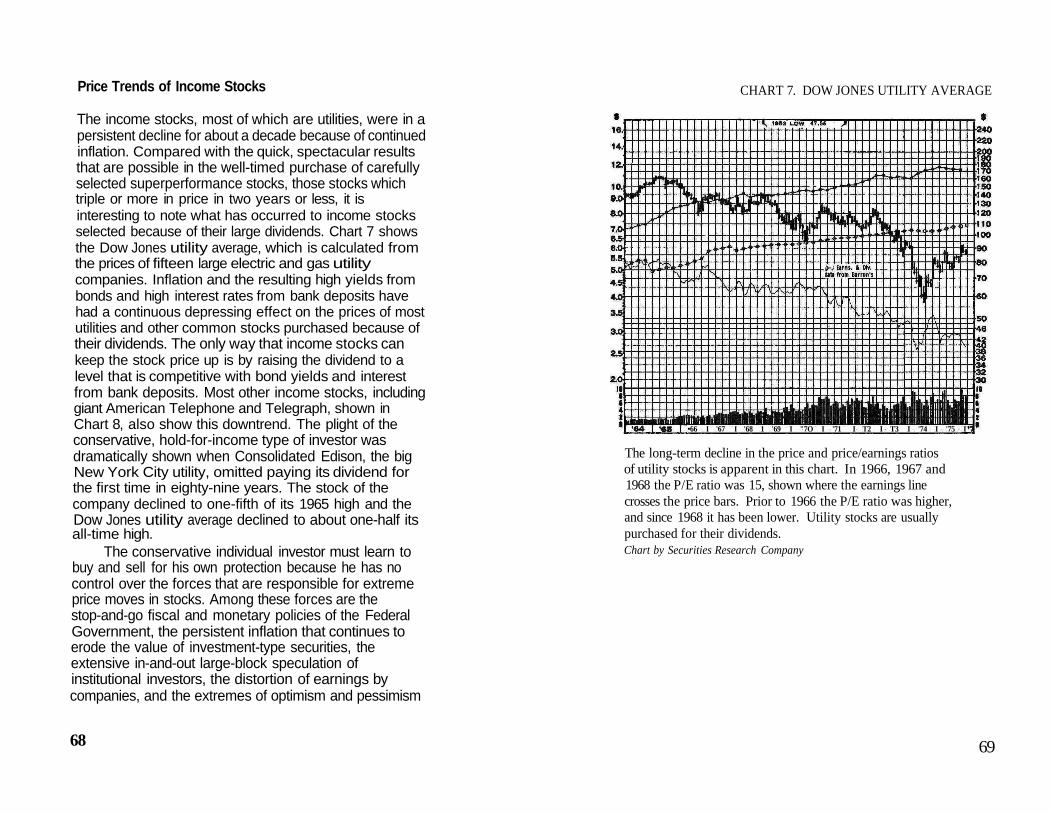
Price Trends of Income Stocks
The income stocks, most of which are utilities, were in apersistent decline for about a decade because of continuedinflation. Compared with the quick, spectacular resultsthat are possible in the well-timed purchase of carefullyselected superperformance stocks, those stocks whichtriple or more in price in two years or less, it isinteresting to note what has occurred to income stocksselected because of their large dividends. Chart 7 showsthe Dow Jones utility average, which is calculated fromthe prices of fifteen large electric and gas utilitycompanies. Inflation and the resulting high yields frombonds and high interest rates from bank deposits havehad a continuous depressing effect on the prices of mostutilities and other common stocks purchased because oftheir dividends. The only way that income stocks cankeep the stock price up is by raising the dividend to alevel that is competitive with bond yields and interestfrom bank deposits. Most other income stocks, includinggiant American Telephone and Telegraph, shown inChart 8, also show this downtrend. The plight of theconservative, hold-for-income type of investor wasdramatically shown when Consolidated Edison, the bigNew York City utility, omitted paying its dividend forthe first time in eighty-nine years. The stock of thecompany declined to one-fifth of its 1965 high and theDow Jones utility average declined to about one-half itsall-time high.
The conservative individual investor must learn tobuy and sell for his own protection because he has nocontrol over the forces that are responsible for extremeprice moves in stocks. Among these forces are thestop-and-go fiscal and monetary policies of the FederalGovernment, the persistent inflation that continues toerode the value of investment-type securities, theextensive in-and-out large-block speculation ofinstitutional investors, the distortion of earnings bycompanies, and the extremes of optimism and pessimism
68
CHART 7. DOW JONES UTILITY AVERAGE
•66 I '67 I '68 1 '69 I "7O I '71 I T2 I T3 I '74 I '75 I
The long-term decline in the price and price/earnings ratiosof utility stocks is apparent in this chart. In 1966, 1967 and1968 the P/E ratio was 15, shown where the earnings linecrosses the price bars. Prior to 1966 the P/E ratio was higher,and since 1968 it has been lower. Utility stocks are usuallypurchased for their dividends.Chart by Securities Research Company
69
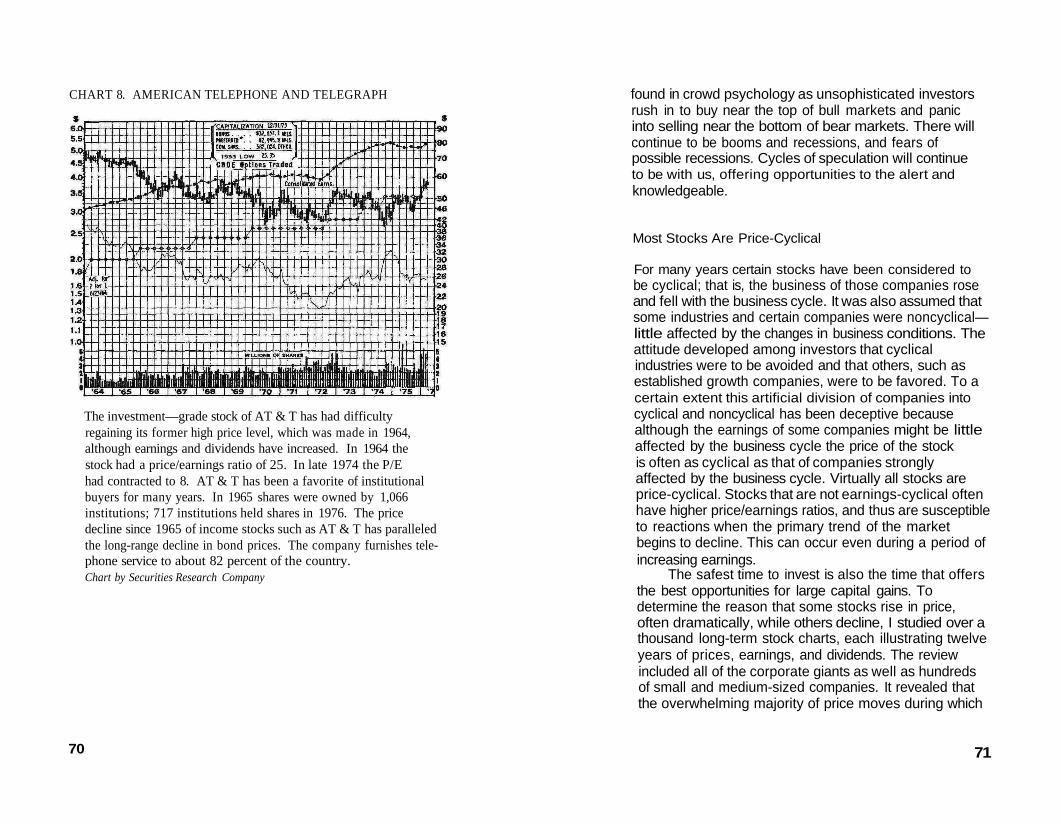
CHART 8. AMERICAN TELEPHONE AND TELEGRAPH
The investment—grade stock of AT & T has had difficultyregaining its former high price level, which was made in 1964,although earnings and dividends have increased. In 1964 thestock had a price/earnings ratio of 25. In late 1974 the P/Ehad contracted to 8. AT & T has been a favorite of institutionalbuyers for many years. In 1965 shares were owned by 1,066institutions; 717 institutions held shares in 1976. The pricedecline since 1965 of income stocks such as AT & T has paralleledthe long-range decline in bond prices. The company furnishes tele-phone service to about 82 percent of the country.Chart by Securities Research Company
70
found in crowd psychology as unsophisticated investorsrush in to buy near the top of bull markets and panicinto selling near the bottom of bear markets. There willcontinue to be booms and recessions, and fears ofpossible recessions. Cycles of speculation will continueto be with us, offering opportunities to the alert andknowledgeable.
Most Stocks Are Price-Cyclical
For many years certain stocks have been considered tobe cyclical; that is, the business of those companies roseand fell with the business cycle. It was also assumed thatsome industries and certain companies were noncyclical—little affected by the changes in business conditions. Theattitude developed among investors that cyclicalindustries were to be avoided and that others, such asestablished growth companies, were to be favored. To acertain extent this artificial division of companies intocyclical and noncyclical has been deceptive becausealthough the earnings of some companies might be littleaffected by the business cycle the price of the stockis often as cyclical as that of companies stronglyaffected by the business cycle. Virtually all stocks areprice-cyclical. Stocks that are not earnings-cyclical oftenhave higher price/earnings ratios, and thus are susceptibleto reactions when the primary trend of the marketbegins to decline. This can occur even during a period ofincreasing earnings.
The safest time to invest is also the time that offersthe best opportunities for large capital gains. Todetermine the reason that some stocks rise in price,often dramatically, while others decline, I studied over athousand long-term stock charts, each illustrating twelveyears of prices, earnings, and dividends. The reviewincluded all of the corporate giants as well as hundredsof small and medium-sized companies. It revealed thatthe overwhelming majority of price moves during which
71
the price increased to three or more times its originalvalue began as rebounds from the bear market lows of1962,1966,1970, and 1974. Not only were thoseperiods the safest times to buy, but they also wereoutstanding buying opportunities for large capital gains.The best time to buy most stocks is when the marketlooks like a disaster. It is then that the risk is lowest andthe potential rewards are highest.
Buy for Large Capital Gains
If you do not seek performance, that is, large increasesin value, why buy stocks? When you buy stocks you aretaking a substantial risk with your capital. It is muchmore likely to be partially lost than to be increased. Tojustify the risk that you are taking, you should expectto be rewarded with big gains. If you do not aspire tobig capital gains, you might as well turn your back onthe stock market and place your capital in a safer haven,for if you do not use a systematic approach toattain large capital gains, if you approach investingconservatively or use a haphazard method, the chancesare good that you will lose much of your investedcapital.
/ believe that an investor should look for stocksthat are capable of tripling in value within two years.Since it is unlikely that the investor will buy the stockat the lowest price and sell it at the highest, it is morelikely that he will double his investment rather thantriple it. Stocks should not be purchased unless there isa good chance of a big move.
A Superb Company Does Not Necessarily Have a SuperbStock
There is one investment attitude that might be called the"Cadillac Fallacy." Assume that an investor knows that
72
his Cadillac is a good car. He knows that General Motorsis a good company. Therefore, he reasons, GeneralMotors is a good stock to buy. A few years ago I listenedon my car radio to a stock market analyst beinginterviewed. During the discussion of the adviser'sinvestment philosophy he stated that investors shouldbuy "quality" stocks.
"What stocks do you recommend?" asked theinterviewer.
"Oh, General Motors, AT & T, stocks like that,"was the reply.
The twelve-year price histories of these stocks areshown in Charts 8 and 10. They have been in downtrendsfor years: General Motors since 1965, AT & T since1964. Keep that in mind when you hear someone say"Buy quality. Stick to the big blue chips." If I hadfollowed that advice in the early 1960s I would not havebought Xerox or Syntex, or Holiday Inns when thatcompany was still an over-the-counter stock.
By November 1974 the price of General Motorsstock had declined to a seventeen-year low, "but" somestock experts say, "quality stocks always come back."Possibly so, but you might have to wait a few decades.
73

Chapter 7Superperformance Stocks: The Record
The selection of common stocks for large capitalgains depends primarily on a search—a search forSuperperformance. Superperformance stocks are thosestocks that make strong, sustained price increases.They are not uncommon; between October 1974 andOctober 1976 about one stock in every five tripled inprice. During the two-year period following the bearmarket lows in late 1974 there were 243 stocks thatI could identify on long-term charts of 1,018 stocks ashaving tripled or more in price, actions I callSuperperformance. I define a Superperformance stockas one that at least tripled in price and increased at aminimum rate of three times during a two-year period.Many stocks had moves that lasted less than two years,and many other stocks had persistent price increasesthat lasted longer than three years. If the rate of priceincrease in each case was greater than three times intwo years, it is included in the Superperformancecategory. A move was considered ended if the pricefailed to reach a new high in less than six months, orif there was a price reaction of 25 percent or more,regardless of the duration of the reaction. There arenumerous cases of brief reactions in stocks that werefollowed quickly by additional strength which multipliedthe price many times.
Superperformance has occurred in well-knowngrowth stocks; it has happened, at one time, in stocks ofcompanies that are now considered to be large, stable,and mature; Superperformance also often occurs in thestocks of companies that are small and little known.It is triggered by many actions, such as a surpriseannouncement of a large increase in a company'searnings, or the decision of one company to merge with
7S
another. But most often it is found in stocks that arerebounding from oversold conditions, such as thosecharacteristic of bear market bottoms.
The 243 superperformance stocks that reboundedfrom the 1974 bear market lows were in addition to434 stocks that had a total of 589 superperformancemoves during the period beginning with the 1962bear market bottom and ending with 1974 bear marketlows. The durations and characteristics of these 589superperformance moves were studied in greaterdetail on long-term charts. All are listed in theAppendix.
The analysis of the superperformance movesrevealed that 407 of them began as rebounds from the1962, 1966, and 1970 bear markets; 207 moves begannear the bottom of the 1966 bear markets; 44 movesbegan near the bottom of the 1962 bear market; and156 began near the bottom of the 1970 bear market.There were 182 superperformance price moves thatbegan at some other time during the period understudy.
There were 57 star performers, superperformancephases that experienced price increases greater than1,000 percent. An additional 162 price moves weregreater than 500 percent.
When you invest in common stocks you must makethree correct decisions: when to buy, which stocks, andwhen to sell. The evidence is overwhelming that thereally good price gains are made by stocks as theyrebound from the lows of four-year cycles.
There has been a wide range in the time span ofsuperperformance phases, from three months tosixty-three, but most of the moves have had durationsof eight to thirty-three months. Eleven of thesuperperformance price moves lasted less than sixmonths; 142 lasted between six and twelve months; 282lasted twelve to twenty-four months; 124 lastedtwenty-four to thirty-six months; and 30 had a durationof more than thirty-six months.
Features of Superperformance Price Action
Superperformance price action is not consistent yearafter year in even the greatest growth stocks. The stockprices usually move rapidly upward for a period ofmonths or several years. This is the superperformancestage. The superperformance stage might be followed bya price reaction, or a sideways price movement. After aperiod of consolidation, which sometimes lasts for years,there might be another superperformance stage.
An example of superperformance as it appears on aline chart is shown in Chart 9, which is a twelve-yearchart of Skyline Corporation, a major producer of mobilehomes and recreational vehicles. The chart shows threesuperperformance phases. The first superperformancemove began near the bottom of the 1962 bear market;the price more than quadrupled in less than a year. Thesecond superperformance phase began at the end of the1966 bear market; the stock multiplied more than adozen times in price during the following two years. Thethird price superperformance phase began at the May 26,1970 bear market low and ended less than two yearslater, in early 1972. The price more than quadrupledduring that move. Price superperformance phases such asthese can be highly rewarding financially in a relativelyshort period of time, but investors who look for stockswith superperformance potential must know what theyare looking for. The search for superperformancecandidates must be thorough and systematic, and thetiming of the purchase and sale are also vital. But forinvestors who can make three correct decisions therewards are often large.
Superperformance and Company Earnings
Many superperformance stock price moves can becorrelated with earnings increases by companies. About38 percent of the superperformance price moves
7776
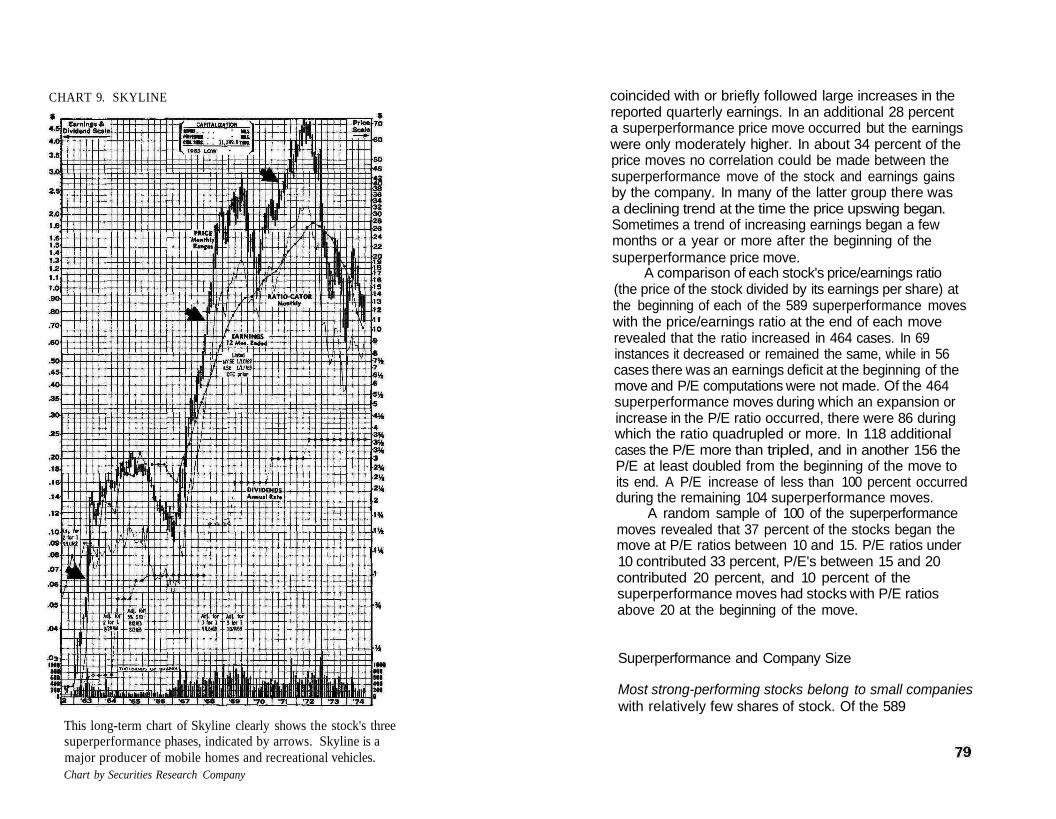
CHART 9. SKYLINE
This long-term chart of Skyline clearly shows the stock's threesuperperformance phases, indicated by arrows. Skyline is amajor producer of mobile homes and recreational vehicles.Chart by Securities Research Company
coincided with or briefly followed large increases in thereported quarterly earnings. In an additional 28 percenta superperformance price move occurred but the earningswere only moderately higher. In about 34 percent of theprice moves no correlation could be made between thesuperperformance move of the stock and earnings gainsby the company. In many of the latter group there wasa declining trend at the time the price upswing began.Sometimes a trend of increasing earnings began a fewmonths or a year or more after the beginning of thesuperperformance price move.
A comparison of each stock's price/earnings ratio(the price of the stock divided by its earnings per share) atthe beginning of each of the 589 superperformance moveswith the price/earnings ratio at the end of each moverevealed that the ratio increased in 464 cases. In 69instances it decreased or remained the same, while in 56cases there was an earnings deficit at the beginning of themove and P/E computations were not made. Of the 464superperformance moves during which an expansion orincrease in the P/E ratio occurred, there were 86 duringwhich the ratio quadrupled or more. In 118 additionalcases the P/E more than tripled, and in another 156 theP/E at least doubled from the beginning of the move toits end. A P/E increase of less than 100 percent occurredduring the remaining 104 superperformance moves.
A random sample of 100 of the superperformancemoves revealed that 37 percent of the stocks began themove at P/E ratios between 10 and 15. P/E ratios under10 contributed 33 percent, P/E's between 15 and 20contributed 20 percent, and 10 percent of thesuperperformance moves had stocks with P/E ratiosabove 20 at the beginning of the move.
Superperformance and Company Size
Most strong-performing stocks belong to small companieswith relatively few shares of stock. Of the 589
superperformance price moves during the period, in 481of the moves the company had a capitalization of lessthan five million shares at the time the price movebegan. In 58 moves the companies had between five andten million shares of common stock, and at the beginningof 41 moves there were between ten and twenty millionshares outstanding. There were only 9 superperformancemoves in the stocks of companies with twenty to thirtymillion shares, and there were only 2 companies withover thirty million that had this type of price action.
Superperformance and Subsequent Stock-Price Action
Most stocks experience declining prices after asuperperformance phase has run its course. A review ofthe price action following the 589 superperformancemoves revealed that in many cases the price decline issevere. Only 85 moves ended without a severe pricereaction. The 85 total includes stocks that moved into asideways price action and stocks that suffered less thana 10 percent retracement of the superperformance move.Of the other 504 moves, within one year 63 began adecline of 100 percent or more of the amount they hadadvanced that retraced the entire bullish move. Anadditional 135 superperformance moves were retracedby 100 percent or more declines that began a year ormore after the end of the superperformance move. Insome cases the decline did not begin until several yearshad elapsed. An additional 84 moves each had 50 to 100percent of the bullish move retraced by a decline thatbegan within one year, and 95 bullish moves had 50 to 100percent of their moves retraced by declines that beganmore than a year after the bullish superperformancemove had ended. Seventy-two moves experienceddeclines of 10 to 50 percent within one year, and 55moves were followed by 10 to 50 percent declinesthat began more than a year after the end of thesuperperformance phase. Many more superperformance
80
phases have ended in the months of December, January,and April than during the other months, which suggeststhat income tax factors play a significant role indetermining when profits are taken.
There appear to be three principal causes for theprice reactions. These include weakness in the stockmarket in general, including the beginnings of a new bearmarket; the overpricing of stocks, which often resultsin profit-taking and a lack of new buying interest;and a drop in a stock's earnings. However, in most of thelatter instances the stock's price began its slide beforethe reported earnings began to decline. In many cases,though, the earnings decline was undoubtedly anticipatedby some investors.
Characteristics of Superperformance Stocks
When stocks begin to regain strength after touching bearmarket lows, which are the stocks that bounce backfastest and strongest? Contrary to a belief held by someinvestment advisers, it is not the big, quality stocks. Therebounds from the 1966 and 1970 bear market lowswere rapid and strong; hundreds of stocks participated.The recovery from the 1962 bear market, however, wasslower. Comparatively few stocks rebounded strongly.There were 44 stocks of the 1,018 studied that begansuperperformance moves that originated at the 1962bear market lows. They were as follows: ACF Industries,American Airlines, Cerro, Chicago Milwaukee, Chrysler,Columbia Broadcasting, Continental Airlines, ControlData, Culligan International, Delta Airlines, Dennison,Dr. Pepper, Evans Products, General Cable, Greyhound,High Voltage Engineering, Hoover, International Flavorsand Fragrances, International Minerals and Chemical,Joy, Massey Ferguson, Motorola, National Airlines,Northwest Airlines, Pan American World Airways, Pasco,Pennzoil, Quaker State Oil Refining, Reading and BatesOffshore Drilling, St. Joe Minerals, Scovill, Skyline,
81
Syntex, Technicolor, Texas Instruments, Textron,Tidewater Marine Service, Time, Trans World Airlines,United Piece Dye Works, UAL (formerly United AirLines), UV Industries, Western Airlines, and Xerox.
This list contains the names of numerous companiesthat later became known as glamour stocks. It has few, ifany, stocks that were considered established blue chipsin 1962. The budding glamour stocks on the list includenine airlines; air travel at that time was a rapidlyexpanding industry, and airline stocks also have financialleverage. Many other stocks were of companies withunique new products: Xerox and Dennison (copiers),Syntex (birth control pills), Texas Instruments(transistors), Skyline (mobile homes), and ControlData (computers). Chrysler had just received a newmanagement team.
Rapidly increasing earnings were characteristic ofmost of the stocks on the list. Another notable feature istheir size; these companies were all quite small in 1962.Only one had more than 10,000,000 shares of stockoutstanding—Massey Ferguson, with about 13,400,000.Twenty-eight of the forty-four companies had less than5,000,000 shares of common stock.
This review of the price history of more than athousand stocks has yielded some good clues regardingthe types of stocks we should look for if we wantto invest for rapid price appreciation. A winningcombination in potential superperformance stock israpidly rising earnings, a small supply of stock, low P/Eratios, and a product that promises strong future growth.
Chapter 8Look for Price Volatility
After an investor has concluded that an ideal time hasarrived for the purchase of stocks, the next question is:"Which stocks?" To answer that question one of thefirst features to investigate is price volatility. By reviewinga set of long-term charts an investor can quickly identifythose stocks that have had a history of high pricevolatility and those that have had little volatility. Thevolatility a stock has experienced in the past tends tocontinue in the future. It is a result of the company'ssize and the nature of the markets for its products, itsfinancial leverage, and the volume of trading in its stock,
A volatile stock's price rises more in bull marketsthan the average stock, as represented by the stockindexes, and declines more in bear markets than theaverage stock. Thus, its price swings are much larger.
The reason for investigating volatility is simply thatit is not logical to pick the perfect time to buy stocks,such as near a bear market bottom, and then select astock that is not likely to rebound strongly because itlacks volatility. Most of the huge, mature corporations,such as the international oils and major utilities, donot have high price volatility; numerous small andmedium-sized companies, on the other hand, do.
Large percentage increase in price is caused by anumber of factors, but particularly by the size of thefloating supply of the stock and the demand for sharesby investors. The demand-supply relationship is themain determinant of whether the price is rising ordeclining, and how fast.
In turn, demand for stock and its availability isdetermined by several factors including the price leveland price action of the stock; the future outlook of thecompany, including its earnings trend; the trend of and
83

current action of stocks in general; the pessimism oroptimism of investors; sponsorship and promotion ofthe stock; the cost and availability of money; and newsdevelopments. Most of these influences should beconsidered before a specific stock is selected andpurchased.
Stock Prices Reflect the Law of Supply and Demand
One of the first subjects covered in a college economicscourse is commercial competition and the law of supplyand demand. Individuals compete in buying and sellingservices and commodities of all kinds. As buyers,individuals seek to pay as little as possible for the goods,services, or property they want. But they find thatothers are also in the market for the same things and, as aresult, they often have to pay more than they hadplanned. As sellers, individuals seek to dispose of theirgoods for the highest possible price, but since manyothers are trying to do the same thing they often have tosettle for less than they had hoped. When the items beingbought and sold are popular common stocks, the supplycan often be insufficient to meet the demand. The resultis an increase in the price of the stock, which bringsforth a bigger supply from sellers and reduces thedemand of buyers so that a temporary equilibrium isachieved.
The supply is determined primarily by the numberof shares in the capitalization of the company. A largecompany like General Motors, shown in Chart 10, hasmore than 285 million shares of common stock, while arelatively small company like Jack Eckerd, shown inChart 11, has only about 17 million shares. Obviously, astrong demand for the shares of Jack Eckerd is going tohave a greater effect in increasing the price of the stockthan a demand of the same size would have on GeneralMotors.
The big demand is caused by many factors, such as
CHART 10. GENERAL MOTORS
Large companies like GM, which has over 285 million sharesof common stock outstanding, usually have relatively stablestock prices. But this chart reveals that even high-quality stockscan be subject to sharp sell-offs. GM declined from about 84 inearly 1973 to 29 in late 1974, a drop of 65 percent.Chart by Securities Research Company
8584
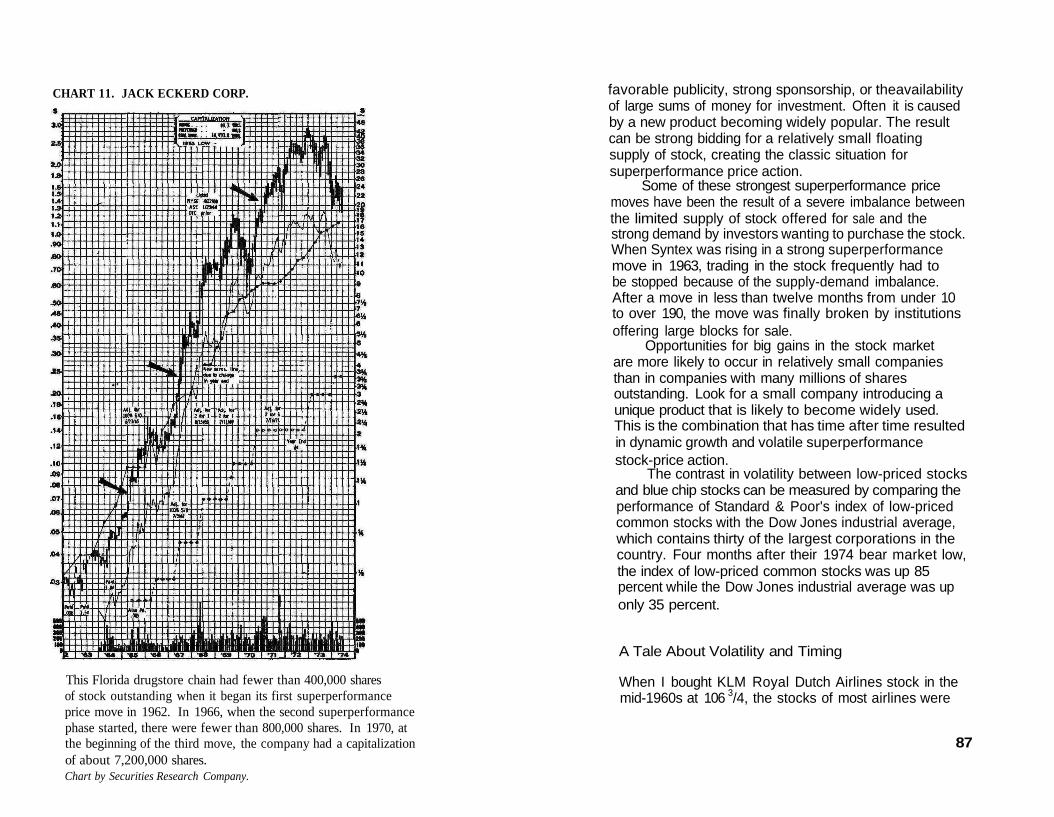
CHART 11. JACK ECKERD CORP.
This Florida drugstore chain had fewer than 400,000 sharesof stock outstanding when it began its first superperformanceprice move in 1962. In 1966, when the second superperformancephase started, there were fewer than 800,000 shares. In 1970, atthe beginning of the third move, the company had a capitalizationof about 7,200,000 shares.Chart by Securities Research Company.
favorable publicity, strong sponsorship, or theavailabilityof large sums of money for investment. Often it is causedby a new product becoming widely popular. The resultcan be strong bidding for a relatively small floatingsupply of stock, creating the classic situation forsuperperformance price action.
Some of these strongest superperformance pricemoves have been the result of a severe imbalance betweenthe limited supply of stock offered for sale and thestrong demand by investors wanting to purchase the stock.When Syntex was rising in a strong superperformancemove in 1963, trading in the stock frequently had tobe stopped because of the supply-demand imbalance.After a move in less than twelve months from under 10to over 190, the move was finally broken by institutionsoffering large blocks for sale.
Opportunities for big gains in the stock marketare more likely to occur in relatively small companiesthan in companies with many millions of sharesoutstanding. Look for a small company introducing aunique product that is likely to become widely used.This is the combination that has time after time resultedin dynamic growth and volatile superperformancestock-price action.
The contrast in volatility between low-priced stocksand blue chip stocks can be measured by comparing theperformance of Standard & Poor's index of low-pricedcommon stocks with the Dow Jones industrial average,which contains thirty of the largest corporations in thecountry. Four months after their 1974 bear market low,the index of low-priced common stocks was up 85percent while the Dow Jones industrial average was uponly 35 percent.
A Tale About Volatility and Timing
When I bought KLM Royal Dutch Airlines stock in themid-1960s at 106 3/4, the stocks of most airlines were
87

doing well. The biggest problem was in selecting theairline stock that would perform best. I chose KLMbecause of its small capitalization; it had less than amillion and a half shares of common stock at that time.In contrast, most of the other airlines then had over sixmillion shares of common. In 1966 KLM was not only astock with a small capitalization, but the floating supplywas even smaller since many of the shares were closelyheld, 71 percent by the Dutch government. There was alarge and growing short interest. The result was greatvolatility. By watching a stock of this type closely, on adaily basis, it is almost possible to predict its volatilemoves. When the price jumped, heavy short sellingwould soon follow. Any price weakness would bring inshort covering, driving the price up again.
The monthly short-interest figures are summarizedand published in the Wall Street Journal and othernewspapers about the twentieth of each month. Manyshort sellers would cover their short positions prior tothe publication of the statistics because they were afraidthat an increase in the published figures would cause thestock to jump again, jeopardizing their short positions.
I finally decided to sell my KLM stock because itschart showed an unsustainable spear pattern, anear-vertical formation, which often means heavyprofit-taking and a price reaction. I decided to sell at aboutten thirty on the morning the short interest was publishedbecause I assumed that panicky short covering would runup the price of the stock on the day prior to the publicationof the statistics and that a certain amount of this actionwould also occur shortly after the figures were released.I called my broker and told him that I wanted to sell allof my KLM that morning because I expected it to bethe final top in the stock. I asked him how the stock wasdoing. "It's up about four points," he said.
"Well," I replied, "if it is still going up there is nopoint in my selling now. I had expected it to top outthis morning. Will you keep an eye on it and call meright away if it starts to drop?"
He replied that he would. By eleven o'clock I hadreceived no phone call. I was beginning to becomeapprehensive because I was absolutely certain, havingwatched the price action of the stock for a fewmonths, that it would reach the final peak that morning.I called my broker again. "How is KLM doing now?" Iasked.
"Down four points," he replied."Sell it. Sell all of it." I told him.That summer morning in 1966 was close to the
final top for KLM. From a price of 155 3/4 in 1966,KLM eventually declined to 131/4 in 1974. This isanother illustration that price superperformance movesin phases. The individual investor must be able toidentify stocks early in their superperformance phaseand sell when there is evidence that superperformance isapproaching its end. When there is new evidence that thefundamentals of a stock, such as earning power, areweaker than previously estimated, the strong demandfor the stock also disappears.
Price Distortions by Stock Exchange Specialists
The normal supply-demand relationship is severelydistorted by the primitive specialist system still permittedto operate at the stock exchanges. The specialists arestock exchange members who buy and sell on the floorof the exchanges and who are assigned by the stockexchange to make a market in specific stocks. In actualpractice they are often the antagonists of the publicinvestors.
When stocks are rallying and the public is buying,the specialists are usually sellers and short sellers. Shortselling is the selling of stock not owned by the seller.It is accomplished by borrowing stock. The short sellerexpects a price decline which would allow him to buyan equal number of shares at a lower price, permittinghim to return them to the lender and to make a
8988

profit from the difference between selling and coveringprices.
Heavy short selling by specialists gives them avested interest in having the stock's price decline to alower level, so that they can cover their short salesand make a profit. The price decline is forced by heavyshort selling at the top of the rally. The forced pricedecline cools buying pressures which might otherwisecontinue.
In spite of heavy short selling, which drives downstock prices, over a longer period of time the normalbuying and selling pressures should be more influential.Short sellers must eventually buy back or "cover" theirshort sales.
Specialists have developed into a fine art theirtechniques for driving stock prices down. Theoreticallythey are supposed to be responsible for maintaining an"orderly market" by minimizing wide fluctuations intheir assigned stocks by purchasing and selling for theirown accounts. But their motivation to support pricesoften does not appear to be as strong as their desire todepress prices. During the spring of 1976 I happened toobserve a stock listed on a regional stock exchange thathad fallen 31/4 points, or about 19 percent in a singletrading session, from 171/4 to 14. The volume oftrading was only six hundred shares, so the specialist didnot appear to be supporting the price, which reboundedthe following day.
On another occasion I noted a news item thatappeared in a financial publication with the headline"Stock Exchange Fines, Censures Specialist." The newsstory described how an individual in a specialist firmallegedly failed to make an orderly market in a stock.He was charged by the exchange with opening thestock at too low a price, thereby triggering the sale ofinvestors' stop orders, which were executed when thestock's price declined to specific levels. The openingprice was the low for the day. It caused stop orders fora substantial number of shares to be executed. These
examples illustrate the hazards investors might facefrom the activities of stock exchange specialists.
Look for Rebounds
The strongest rebounds usually occur when the entirestock market is drastically oversold, as in 1962, 1966,1970, and 1974. When the recovery begins, hundredsof stocks take part in the strong recovery action. Somemanage within months to regain the price level that theypossessed prior to the sell-off. Other stocks might notever regain their former levels. The challenge to theinvestor is in attempting to identify the stocks that willrebound the fastest and the highest.
On October 4,1974, stock market averages reachednew lows in a bear market that had started in January 1973for the Dow Jones industrials, and in December 1972 formore broadly based averages. The Dow Jones industrialsdeclined from a January 11,1973, high of 1067.2 to aDecembers, 1973, energy-crisis low of 783.56. Followinga rally in March 1974 to 878.13, the stock average beganits long decline to the October 4 low near 573. The laststage of the decline included a precipitous drop of morethan 200 points between August 7 and October 4, aFriday. On Monday, October 7, the market staged astrong rally; the Dow Jones industrials advanced 23 points.Following a 4.93 drop on Tuesday, the averages advancedan additional 55.54 points during the next three days tofinish the week at 658.17. This was a typical "buyer'sstampede" caused by large numbers of investorsattempting to buy the bargains created by the severelyoversold condition of the market. On the followingMonday, October 14, the strong advance continued.During the six trading days the Dow Jones industrials hadadvanced more than 100 points. This type of strongrebound is typical of price movements at the bottom ofbear markets. It indicates a major price reversal and isthe best time to make purchases.
§0 91
Which Stocks Rebound?
The big question we have been asking is: "Which stocks?"By studying stock tables closely during this period youcan determine which stocks are rebounding strongly andwhich are not responding. Many of the strong reboundersare likely to become the market leaders. For that reasonit is important to identify those stocks and theircharacteristics.
After reviewing the monthly Security Charts of1,105 leading stocks published by the SecuritiesResearch Company, I was able to determine quickly thestocks with the largest percentage increases during theOctober 4-11 rally. There were seventy-nine stocks thatincreased by at least 35 percent during the six-dayperiod. Although it is not likely that all of theseventy-nine stocks would continue to be so strong thatthey would increase by 300 percent over a two-yearperiod and thus become superperformance stocks, it isvery likely that many potential superperformance stocksare included in the list. The strong-rebound stocks arelikely to include many of the new market leaders for thenext two years.
Stocks that rebounded the most from the October 4,1974, market low included oversold stocks that had beendeclining sharply prior to the rebound. Most werecompanies with strong fundamentals, including risingearnings trends. Small capitalizations were morenumerous than companies with large capitalizations; thelarge, mature, primary blue chips were not represented.
Of the seventy-nine stocks, forty-two hadcapitalizations of fewer than ten million shares, and ofthese twenty-three had fewer than five million shares.Nineteen stocks had between ten and twenty millionshares, seven had twenty to thirty million shares, andeleven had more than thirty million shares. The largestcapitalization was seventy-eight million shares.
Four airlines were among the strong rebounders,but the largest group was the drug companies; ten of
92
them had price increases of over 35 percent. Drug stockswere not the strongest group, however. There were threegroups of stocks that reached their lows two to fourweeks prior to the October 4 lows recorded by themarket averages and the vast majority of stocks. Thesethree groups of stocks included the offshore oil drillingcompanies, which "bottomed" during the third week inSeptember and subsequently rallied stronger than anyother group; the mobile home stocks, which also beganto rally then; and the savings and loan stocks, whichturned strong early in September. These three stockgroups led the rebound in prices. The mobile home andsavings and loan stocks were rebounding from severelydepressed conditions in those businesses, and prospectsfor improvement seemed bright because the FederalReserve Board had adopted policies for easier money.The offshore oil drilling and drug industries had notbeen depressed but these stocks had declined because ofthe general bear market for stocks.
In contrast to the strength shown by these groupsand many other stocks, some large, mature companiescontinued to decline to new lows during the strongupswing in the market averages. The savings and loan,offshore drilling, and mobile home stocks, which werethe most prominent leaders in the advance, are volatile,speculative stocks, not blue chips. Most have smallcapitalizations. Some of the offshore drilling stocksdoubled in price during that brief period.
A large short interest, which is the number ofshares that have not been covered or repurchased,combined with a small capitalization, can often cause astock to jump in price when the market turns bullish.Fifteen of the seventy-nine stocks had short positionsof at least twenty thousand shares when the strong rallybegan.
This review of strong rebounders from theOctober 4, 1974, low does not include all strong stocks,of course, since there were a few stocks which declinedvery little or not at all during the plunge that included
93

most stocks as well as the averages. Although they didnot decline during the strong sell-off that affected moststocks, neither did they rally as strongly during therebound phase.
It appears that many stocks that are relativelystrong during a bear market are in their own up-cycle,with increasing earnings and sales, and a future thatappears bright. But the stock's price trend is dominatedby the bearish primary trend of the general market,which causes the price to decline along with most otherstock prices, but not as severely. When the bearishmarket turns bullish, stocks that are in their ownearnings up-cycle should also turn bullish. This is nottrue of stocks that are in their own bearish cycles,however; even after the primary market trend turnsbullish they are likely to remain relatively weak becauseof their own down-cycle of declining or static earningsand sales, or an unfavorable company outlook.
Emotional Selling and Trend Following
There are many occasions when strong stocks arebattered down to bargain-price levels by the highlyemotional selling typical of a bear market. Chart 12shows the price and earnings record of Natomas, ashipping company that also holds extensive petroleuminterests in the Java Sea and off Sumatra. In 1969 theprice reached a high of 130, then descended to a 1970bear market low of 13, but rebounded to 101 in 1971.Euphoria about a relatively small company discoveringnew oil resources caused the price to zoom up; heavyshort selling followed by panic selling caused the decline.The rebound occurred as short sellers purchased stock tocover their sales. Trend followers saw the stock's pricerising sharply, so they also started buying. News itemsalso played a part.
Natomas is an unusually volatile stock, but thesame situation can be found in regard to many other
94
CHART 12. NATOMAS
One of the strongest rebounds from the 1970 bear marketbottom was made by Natomas, which had a large short interest,a small capitalization, and considerable publicity and sponsor-ship. With large oil reserves in Indonesia, investors were antici-pating a bright future for the company. Superperformancemoves are indicated by arrows.Chart by Securities Research Company
stocks: heavy emotional selling during bear markets instocks that rebound strongly. General market declinessuch as those of 1962 and 1970 create opportunities topick up excellent stocks at bargain prices. Many stocksdecline not from any inherent weakness but becausethey were driven down by heavy short selling followedby panic selling.
When the market is close to a selling climax after along decline, the stocks that are likely to rebound thefastest are often active stocks with strong fundamentalsand small capitalizations that have been sold heavily inthe general market decline.
Leverage
Financial leverage in a stock is often responsible for highvolatility in the stock's price because the company'sreported earnings can fluctuate greatly if there are largeamounts of debt in the capitalization.
Stocks with leverage often present opportunitiesfor profit, but the timing of the purchase and the salemust be good, for a stock with high leverage can berisky. A stock has high leverage if the company has alarge proportion of bonds and preferred stock relative tothe common. If a company has bonds outstanding forseveral million dollars, the bond interest will bededucted from income and the remainder will be left forthe common stock. Assuming that a company hasincome of $500,000 but $400,000 must go for bondinterest, there is $100,000 left for the common stock.But a relatively modest increase in income to $600,000the next year results in a doubling of the amount for thecommon stock, from $100,000 to $200,000.
Perhaps the most familiar use of leverage is in realestate. If a home buyer purchases a $50,000 house andobtains a $40,000 mortgage on it, he is actually investingonly $10,000 of his own capital. If the house rises20 percent in value and is sold for $60,000, a profit
of $10,000, or 100 percent will be realized on theinvestment of $10,000. On the other hand, if the housedrops in value by only 20 percent, and the buyer sellsit for $40,000, he would lose 100 percent of hisinvestment of $10,000.
Leverage is common in the capital structure ofmany industries, such as airlines and utilities. In a utility,bonds and preferred stock may account for two-thirds ofthe invested capital, with the common stock representingthe balance. The result is that the common shareholderenjoys a high degree of leverage. Fixed charges, thepayment of interest on the bonds and dividends on thepreferred stock, must be made before the common stockis entitled to receive any. But once the fixed charges arepaid, the balance goes to common stock. Thus, as totalincome rises, common share earnings begin to show alarger percentage gain than total profits. When earningsdecline, the percentage drop in the common share profitsis larger than the percentage decline in total income.This is the great danger in high-leverage stocks.
Most utilities have a fairly consistent income, butwhen high leverage is combined in a company with anerratic income pattern—such as certain railroads orcompanies strongly affected by the business cycle-volatility in the earnings per share can occur, which isoften reflected in even greater volatility in the price ofthe stock. The earnings record and price performance forTrans World Airlines is shown in Chart 13. The companyhas $958 million of bonds in its capitalization and alsopreferred stock, therefore high financial leverage.
Financial leverage is also a characteristic found instock warrants, stock options, and in many low-pricedstocks, particularly in cases where the stock hasformerly sold at much higher prices and where eachshare of common stock has considerable potentialearning power behind it. In situations where there is ahigh volume of dollar sales relative to shares of commonstock there is operating leverage. Retail stores, such asgrocery chains, often have a high volume of sales but
96 97
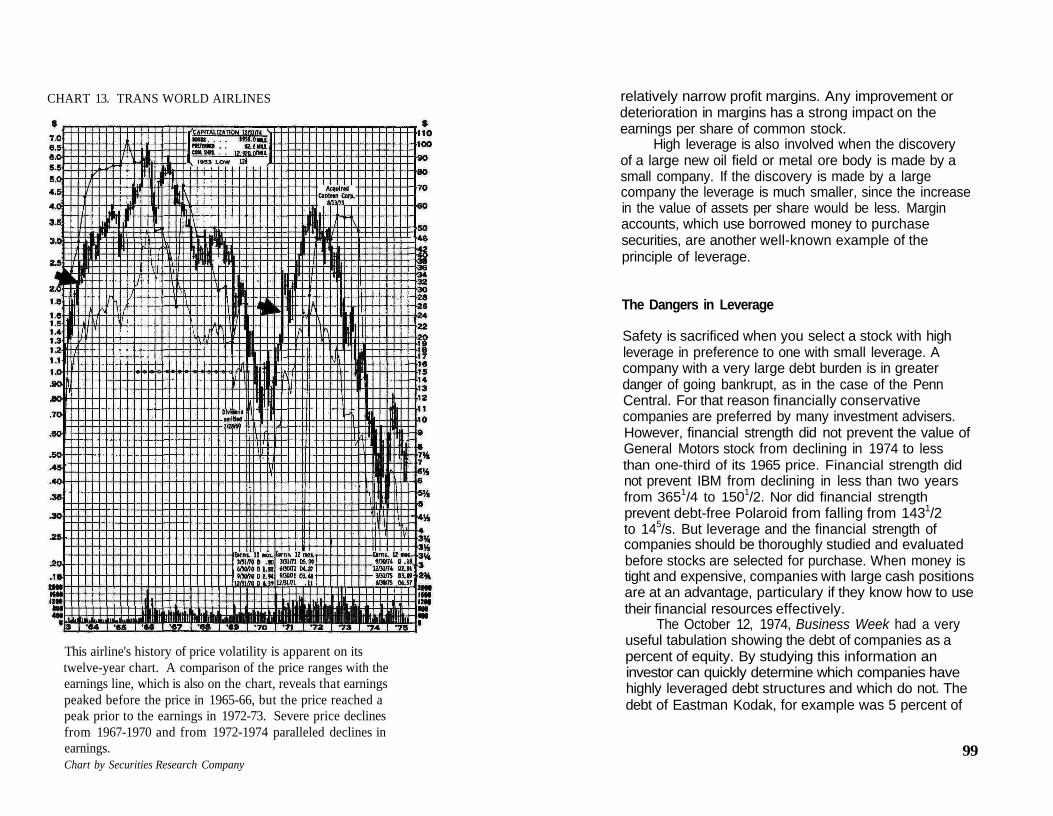
CHART 13. TRANS WORLD AIRLINES
This airline's history of price volatility is apparent on itstwelve-year chart. A comparison of the price ranges with theearnings line, which is also on the chart, reveals that earningspeaked before the price in 1965-66, but the price reached apeak prior to the earnings in 1972-73. Severe price declinesfrom 1967-1970 and from 1972-1974 paralleled declines inearnings.Chart by Securities Research Company
relatively narrow profit margins. Any improvement ordeterioration in margins has a strong impact on theearnings per share of common stock.
High leverage is also involved when the discoveryof a large new oil field or metal ore body is made by asmall company. If the discovery is made by a largecompany the leverage is much smaller, since the increasein the value of assets per share would be less. Marginaccounts, which use borrowed money to purchasesecurities, are another well-known example of theprinciple of leverage.
The Dangers in Leverage
Safety is sacrificed when you select a stock with highleverage in preference to one with small leverage. Acompany with a very large debt burden is in greaterdanger of going bankrupt, as in the case of the PennCentral. For that reason financially conservativecompanies are preferred by many investment advisers.However, financial strength did not prevent the value ofGeneral Motors stock from declining in 1974 to lessthan one-third of its 1965 price. Financial strength didnot prevent IBM from declining in less than two yearsfrom 3651/4 to 1501/2. Nor did financial strengthprevent debt-free Polaroid from falling from 1431/2to 145/s. But leverage and the financial strength ofcompanies should be thoroughly studied and evaluatedbefore stocks are selected for purchase. When money istight and expensive, companies with large cash positionsare at an advantage, particulary if they know how to usetheir financial resources effectively.
The October 12, 1974, Business Week had a veryuseful tabulation showing the debt of companies as apercent of equity. By studying this information aninvestor can quickly determine which companies havehighly leveraged debt structures and which do not. Thedebt of Eastman Kodak, for example was 5 percent of
99
equity. For General Motors it was 10 percent; forLockheed 308 percent; for Trans World Airlines, 249percent; and for McCrory, 799 percent.
During periods of recession, when profits declinefor most businesses, companies that have large amountsof debt sometimes have no profits at all. But as thenational economy emerges from recession, corporatesales and profit margins begin to increase. The percentageincrease in profits can usually be much larger forstocks with large leverage than for stocks with smallleverage. Highly leveraged companies, then, are evenmore business-cycle-sensitive, and often are buyingopportunities when the stock's price is depressed.
Leverage in Low-Priced Stocks
Another type of leverage is that found in low-pricedstocks and warrants.
Of the 152 superperformance moves that began ator within six months of the 1970 bear market lows, 107started from a price below twenty dollars. Only five ofthe superperformance stocks began their rapid rises atprices above fifty dollars. Fourteen began at pricesbetween thirty and fifty dollars; twenty-one of thestocks started between twenty and thirty dollars. Thelargest number of superperformance moves, 71, began atprices between ten and twenty dollars. There were 33moves that began at prices between five and ten dollars,and three that began at less than five dollars a share.
This tabulation indicates that the best place to lookfor potential superperformance stocks is among commonstocks that are selling in the five- to twenty-dollarrange. Comparatively few high-priced stocks move intosuperperformance price action.
Companies that are strongly affected by the businesscycle, such as those in the construction industry, oftenhave abrupt declines in sales and earnings that are onlytemporary. Stock prices react to these business declines,
TOO
however, and sometimes present investors withoutstanding buying opportunities. When the businesscycle shows evidence of turning up, many cyclical stocksalso pick up strength. Many low-priced stocks have lowprices only temporarily, and are capable of regainingmuch higher price levels when the business climateimproves. The important feature to look for is strength.Determine if the company has the resources to reboundand to bring its stock back to its former high esteem.Quite often earnings are only temporarily depressed andwill improve. Other factors, such as announcedexpansions or new products, will sometimes give new lifeto a depressed low-priced security.
One of the quickest ways to identify low-pricedstocks that might have the potential to regain formerhigh price levels is to review a set of long-term charts. Anexample of this type of situation is shown in Chart 14of Holiday Inns. After finding candidate stocks byreviewing charts, evaluate the stock and companythoroughly prior to making a purchase.
Leverage in Warrants
A warrant is an option issued by a company that givesits owner the right to purchase a specific number ofshares of the company's common stock at a specificprice and prior to a specific date. There are a fewwarrants granting a perpetual right to buy stock.Warrants have become numerous in recent years,numbering in the hundreds. They are generally issued inassociation with financing programs, making bonds orpreferred stock more salable. The warrant is detachedand is traded separately.
Warrants are highly leveraged; they can rise muchfaster in terms of percentages than the common stock,and can decline much more rapidly. The value ofwarrants is also determined by the amount of timeremaining before the expiration date, since they become
101
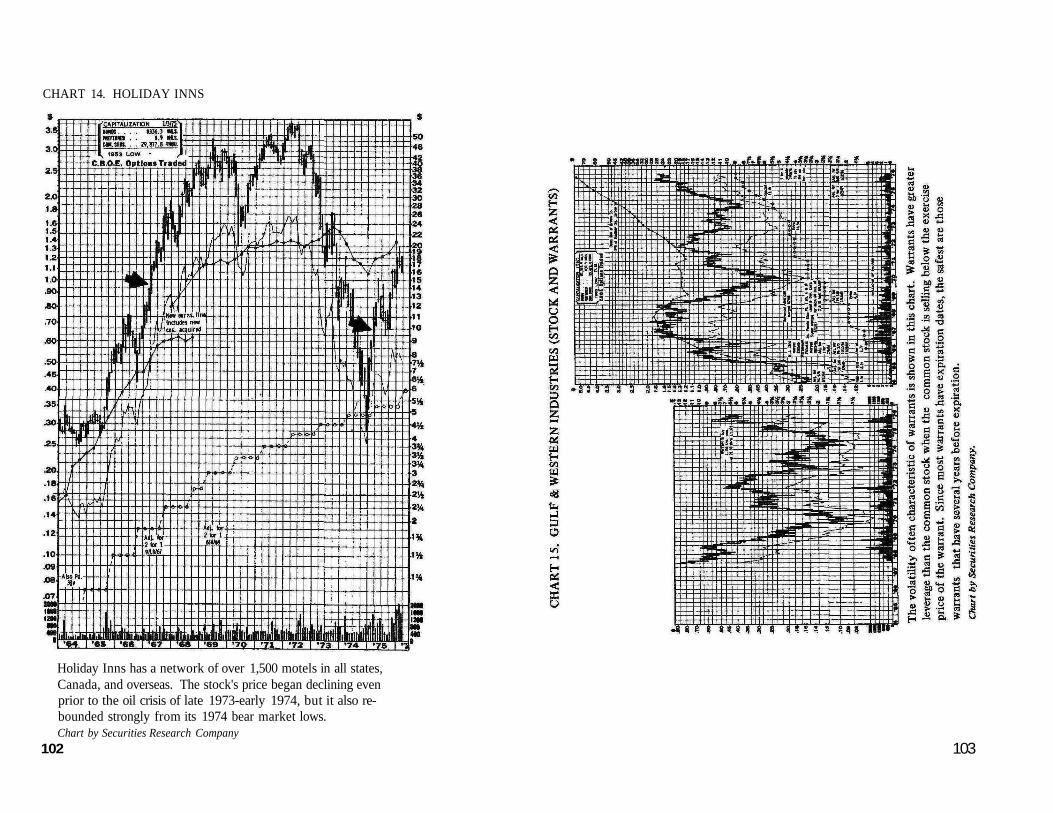
CHART 14. HOLIDAY INNS
Holiday Inns has a network of over 1,500 motels in all states,Canada, and overseas. The stock's price began declining evenprior to the oil crisis of late 1973-early 1974, but it also re-bounded strongly from its 1974 bear market lows.Chart by Securities Research Company
102 103

worthless after that. When a stock is discovered thatappears to be capable of a superperformance move,always check to see if there is also a warrant.
The most important factor in selecting a warrant isthe price movement of the common stock on which thewarrant is based. If the common stock appears to be agood investment, a warrant based on the stock is likelyto be an even better performer. Chart 15 shows therelative performance of the warrants and common stockof Gulf & Western. The stock increased in price fromabout 8 !/2 in late 1974 to 26 in early 1976. During thesame period the warrant increased from 1 V2 to 81/2.During declines the warrant lost much more value thanthe common stock. Between early 1972 and late 1974the warrant declined from 7 to 1 1/2 while the stockdropped from 20 to 81/a. Leverage is a more importantfactor when the common stock is selling below theexercise price for the warrant; above the exercise pricethe stock and warrants move together, point for point.
In addition to the leverage, the other big advantageof the warrant is that less money is required for thesame action. But it is always important to keep in mindthat there is an expiration date. Avoid warrants or stockoptions that have less than a year to go before the rightsexpire and the options become worthless. Requiring aninvestment to perform within a short period of timeseverely limits the possibilities of success.
104
Chapter 9Look for New Earning Power
The primary objective of companies is profit, which isthen used to finance further expansion of the companyor is paid out to stockholders in the form of dividends.
Companies are not in business to make automobilesor soap or television sets or widgets. The reason for theirexistence—the reason that entrepreneurs invest capital,imagination, and energy—is to make money. If therewere no profit motive there would be no reason forenterprising individuals to go to the effort of organizingand building up businesses. Since profit, or earnings, isthe reason for the existence of companies, investorsshould evaluate companies from the point of view oftheir profit-generating potential.
In most well-established companies earnings can bequite accurately forecast from year to year if there havebeen no extensive changes in the business. To a largedegree the forecasting is simply a matter of projectingtrends. In these cases stock prices usually reflect theprofit situation as it exists and as it is expected tocontinue. Most large companies are little affected bychanges such as new products. Their product lines are soextensive that one or two variations make little difference.
But there are numerous smaller companies thatare strongly affected by change, and their stock pricessometimes do not reflect the changes that are takingplace—changes such as the development of a new productor a shift in management. One place to look for newearning power is where change is occurring.
Change and Stock PricesChange means opportunity, and change is one thing thatis certain. Wars begin and wars end eventually. Federal
105
i

monetary policy causes tight money, then policies changeand money becomes plentiful. New presidents are electedand the old retires from the scene. Technology createsnew products for the consumer. Companies are organized,grow, mature, and decline. Many grow very little or notat all before they disappear from the scene. But throughthe entire panorama there is change.
Technological change during the past century hasafforded investors countless opportunities for profit. Ahundred years ago there was railroad building. Then theautomobile was developed; then the airplane; andelectricity; and radio. During the past two decadesfabulous growth has occurred in areas encompassingcomputers, copying, color television, rocketry, electronics,birth control pills, mobile homes, and travel. Well-managedand innovative companies in these fields, and manyothers, have had outstanding growth. Many stockholderswho purchased shares of these companies in their earlystages have profited handsomely. Today there are othercompanies in a similar early stage of development.Finding them requires that the prospective investorconduct a search that must be systematic in order toavoid overlooking a possible winner.
Change taking place in a company might also involvea change in management or the acquisition of anothercompany. It might involve a major mineral or oil fielddiscovery. But change implies the introduction of a newelement that has not been taken into account in theprevious evaluation of the company's worth. Thus are-evaluation occurs, moving the price of a share up ordown in value.
The introduction of new competitive products is achange that can often be particularly significant. Forexample, what will be the significance to Xerox ofIBM's entry into the copier market? What will be thesignificance to Polaroid of Eastman Kodak's competitiveinstant photography? What is the long-range meaningfor Detroit of the sales entry of Japanese automobilesinto the U.S.?
10®
Change Resulting from Discoveries of Natural Resources
Dramatic change occurs and superperformance priceaction takes place when a natural resources companymakes a big oil field discovery or a mining companydiscovers a big new ore deposit. Large strikes dramaticallyincrease the assets and earning power of a company,particularly if it is relatively small. For example, theannouncement in April 1964 by Texas Gulf Sulphurthat it had discovered a major body of copper, silver, andzinc ore in Canada resulted in strong superperformanceprice action in its stock. Purchasers should keep in mindthat it is important to buy early in situations of thistype. The most dynamic part of the action often occursin a matter of days, or even hours. Sometimes in thestock market he who waits too long is likely to be theloser.
One place where change has occurred in recentyears has been in the offshore oil and gas drillingbusiness. The consensus of opinion among drillingcontractors has been that prosperity for the industrywould last at least a decade. Moreover, in order to meetthe anticipated demand for petroleum, the AmericanPetroleum Institute has estimated that world offshoreoil output would have to quadruple by 1982.
The price and earnings record of one of theindependent companies in the industry, Vetco OffshoreIndustries, is shown in Chart 16.
Change in Government Policies
Changes in government policies have a wide-ranginginfluence on stock prices. For example, the FederalReserve Board frequently changes the amount of cashrequired by the customer to purchase stocks on margin.Since 1950 there have been five periods during whichthe margin requirement was set at 50 percent. That is,the customer needed only half of the money required
107
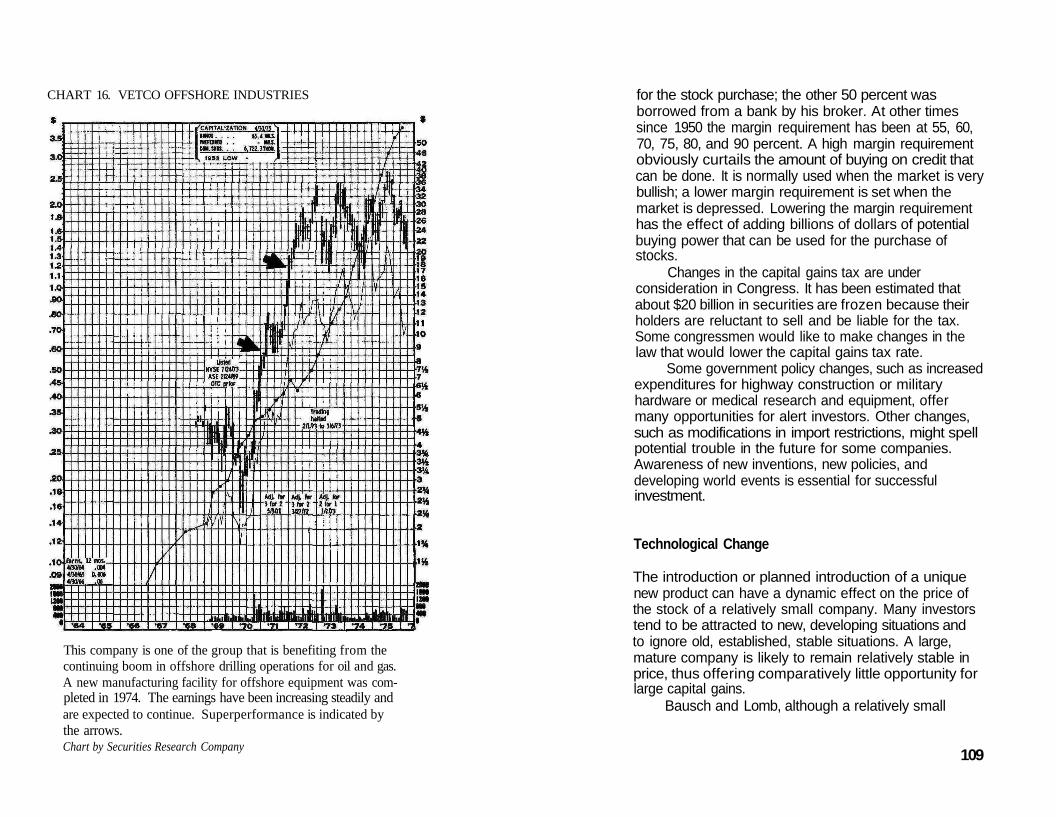
CHART 16. VETCO OFFSHORE INDUSTRIES
This company is one of the group that is benefiting from thecontinuing boom in offshore drilling operations for oil and gas.A new manufacturing facility for offshore equipment was com-pleted in 1974. The earnings have been increasing steadily andare expected to continue. Superperformance is indicated bythe arrows.Chart by Securities Research Company
for the stock purchase; the other 50 percent wasborrowed from a bank by his broker. At other timessince 1950 the margin requirement has been at 55, 60,70, 75, 80, and 90 percent. A high margin requirementobviously curtails the amount of buying on credit thatcan be done. It is normally used when the market is verybullish; a lower margin requirement is set when themarket is depressed. Lowering the margin requirementhas the effect of adding billions of dollars of potentialbuying power that can be used for the purchase ofstocks.
Changes in the capital gains tax are underconsideration in Congress. It has been estimated thatabout $20 billion in securities are frozen because theirholders are reluctant to sell and be liable for the tax.Some congressmen would like to make changes in thelaw that would lower the capital gains tax rate.
Some government policy changes, such as increasedexpenditures for highway construction or militaryhardware or medical research and equipment, offermany opportunities for alert investors. Other changes,such as modifications in import restrictions, might spellpotential trouble in the future for some companies.Awareness of new inventions, new policies, anddeveloping world events is essential for successfulinvestment.
Technological Change
The introduction or planned introduction of a uniquenew product can have a dynamic effect on the price ofthe stock of a relatively small company. Many investorstend to be attracted to new, developing situations andto ignore old, established, stable situations. A large,mature company is likely to remain relatively stable inprice, thus offering comparatively little opportunity forlarge capital gains.
Bausch and Lomb, although a relatively small
109

company, has been an established manufacturer ofoptical products for many years, producing eyeglasslenses and frames, and scientific instruments. Severalyears ago the company announced that it had acquiredthe rights to produce a revolutionary new "SOFLENS"contact lens. The announcement was given a considerableamount of publicity on financial pages. When theinformation was released in early 1971 the volume oftrading in the stock increased tremendously, as can bedetermined from the vertical bars at the bottom ofChart 17. The price of the stock also made a very largejump, quadrupling within a few months.
Similarly, in early 1972, numerous investorssuddenly developed Wankel fever as the new rotaryengine was publicized. The stock of Curtiss-Wright,which holds the North American license for theWankel-type rotary combustion engine, jumped morethan 500 percent on high volume in less than sevenmonths as news stories described interest in the engineby the major automobile manufacturers. Eventually, asinterest in the new engine diminished, the price of thestock declined to its pre-Wankel level.
These two cases illustrate the reaction that investorssometimes have to the introduction of a unique newproduct by a small company. Most newly developedproducts are not as highly publicized as these, but oftenthe new product, sometimes after a number of years,does add substantially to the company's earnings.Widely sold new products can also give sizable boosts tothe sales and earnings of large companies, as thedevelopment and sale of the Instamatic camera did forEastman Kodak. But the effect on the price of the stockof a large company is not as dramatic.
Growth-Stage Companies
Many new companies are born every year; some will notsurvive. Others reach their rapid-growth stage and
CHART 17. BAUSCH AND LOME
The announcement in 1971 that this manufacturer of opticalproducts would produce a new soft contact lens resulted in asuperperformance move in the stock's price and a big volumeof trading, as shown at the bottom of the chart.Chart by Securities Research Company
111
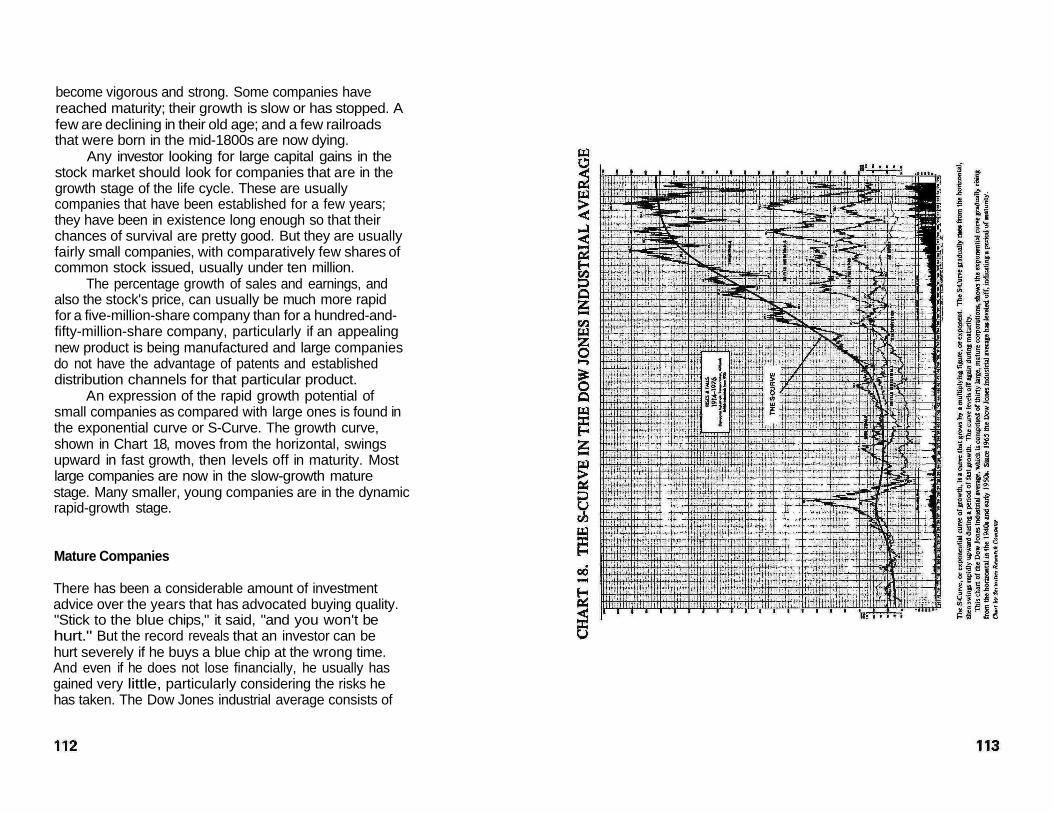
become vigorous and strong. Some companies havereached maturity; their growth is slow or has stopped. Afew are declining in their old age; and a few railroadsthat were born in the mid-1800s are now dying.
Any investor looking for large capital gains in thestock market should look for companies that are in thegrowth stage of the life cycle. These are usuallycompanies that have been established for a few years;they have been in existence long enough so that theirchances of survival are pretty good. But they are usuallyfairly small companies, with comparatively few shares ofcommon stock issued, usually under ten million.
The percentage growth of sales and earnings, andalso the stock's price, can usually be much more rapidfor a five-million-share company than for a hundred-and-fifty-million-share company, particularly if an appealingnew product is being manufactured and large companiesdo not have the advantage of patents and establisheddistribution channels for that particular product.
An expression of the rapid growth potential ofsmall companies as compared with large ones is found inthe exponential curve or S-Curve. The growth curve,shown in Chart 18, moves from the horizontal, swingsupward in fast growth, then levels off in maturity. Mostlarge companies are now in the slow-growth maturestage. Many smaller, young companies are in the dynamicrapid-growth stage.
Mature Companies
There has been a considerable amount of investmentadvice over the years that has advocated buying quality."Stick to the blue chips," it said, "and you won't behurt." But the record reveals that an investor can behurt severely if he buys a blue chip at the wrong time.And even if he does not lose financially, he usually hasgained very little, particularly considering the risks hehas taken. The Dow Jones industrial average consists of

some of the biggest, strongest corporations in thecountry; included are companies like AT&T, duPont,General Electric, General Motors, Goodyear, U. S. Steel.Most are considered blue chip investments. Yet thestock prices of most of these companies reached theirpeaks years ago.
For perspective, let's look back at some stocksavailable to the investor in 1952. There was GeneralMotors with 87,000,000 shares, General Electric with28,800,000. Today General Motors has 285,500,000shares outstanding, U. S. Steel has 54,000,000, andGeneral Electric has. 90,700,000.
But there were also some much smaller companiesavailable in 1952. There was Avon Products with only596,000 shares; today Avon Products has 57,800,000shares. Polaroid was also available in 1952 with 404,000shares. There was also a small company named Haloidthat made photographic papers. It had 189,000 sharesof stock. The capitalization of the company, now calledXerox, has now grown to 78,900,000 shares. IBM'scapitalization has grown from 3,000,000 shares in 1952to about 145,000,000 in 1974. So, although thecompanies that were large in 1952 continued to grow,their growth was exceeded many times over by muchsmaller companies which were little known at that time.
Use Caution When Selecting Growth Stocks
In choosing growth-stage companies, it is necessary tobe very selective. Stock prices can be pushed up quicklybecause of a good promotion or story that usuallydescribes impressive plans for future development. Butin the long run stock prices are based on earning power.So the story has to begin to come true or else disillusionedinvestors will begin to sell their stock and drive downthe price. As long as the story is coming true throughsatisfactorily increasing earnings, most investors willcontinue to hold their stock. Separating fact from fancy
114
is the big job of investors who are searching for growth,and for superperformance price action based on growth.
Good Management Is Vital
Avoid new stock issues. This is one of the surest ways tolose your money. The story might sound terrific, but ittakes more than a story to build a successful business. Ittakes highly capable management and a lot of money tocarry the company through its development stages.
Companies that are in the growth stage of the lifecycle often have more momentum than large, mature,established companies. A few years ago the president ofXerox, Joe Wilson, stated that it was very important forhis company to maintain its momentum. The imagepresented by a company is as important as that presentedby an individual. Momentum in a company indicates thatit is on the move, progressing, with steadily increasingsales and earnings. Momentum indicates an alert,aggressive management willing to listen to new ideas andto try out new methods. Momentum implies that acompany spends money on research and introduces newproducts resulting from that research. A company withmomentum is rewarded for its good performance byinvestors, who often are willing to pay a premium pricefor the stock of a company in motion.
Turnaround Situations
Sometimes companies are reinvigorated, often because anew management team has taken over. When this occurs,the result is a turnaround: A company that has beensliding downhill begins again on a new, upward growthcycle.
In the late 1950s and early 1960s ChryslerCorporation had the image of a company about to goout of business. Year after year the company's share
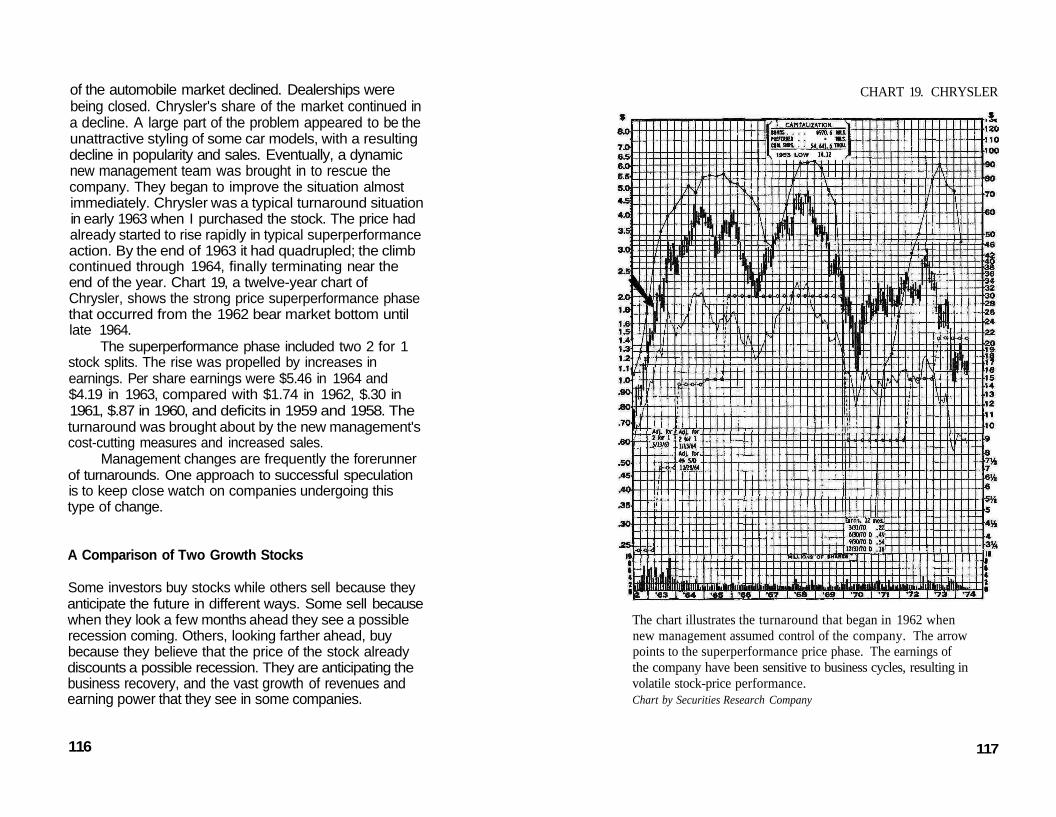
of the automobile market declined. Dealerships werebeing closed. Chrysler's share of the market continued ina decline. A large part of the problem appeared to be theunattractive styling of some car models, with a resultingdecline in popularity and sales. Eventually, a dynamicnew management team was brought in to rescue thecompany. They began to improve the situation almostimmediately. Chrysler was a typical turnaround situationin early 1963 when I purchased the stock. The price hadalready started to rise rapidly in typical superperformanceaction. By the end of 1963 it had quadrupled; the climbcontinued through 1964, finally terminating near theend of the year. Chart 19, a twelve-year chart ofChrysler, shows the strong price superperformance phasethat occurred from the 1962 bear market bottom untillate 1964.
The superperformance phase included two 2 for 1stock splits. The rise was propelled by increases inearnings. Per share earnings were $5.46 in 1964 and$4.19 in 1963, compared with $1.74 in 1962, $.30 in1961, $.87 in 1960, and deficits in 1959 and 1958. Theturnaround was brought about by the new management'scost-cutting measures and increased sales.
Management changes are frequently the forerunnerof turnarounds. One approach to successful speculationis to keep close watch on companies undergoing thistype of change.
A Comparison of Two Growth Stocks
Some investors buy stocks while others sell because theyanticipate the future in different ways. Some sell becausewhen they look a few months ahead they see a possiblerecession coming. Others, looking farther ahead, buybecause they believe that the price of the stock alreadydiscounts a possible recession. They are anticipating thebusiness recovery, and the vast growth of revenues andearning power that they see in some companies.
116
CHART 19. CHRYSLER
The chart illustrates the turnaround that began in 1962 whennew management assumed control of the company. The arrowpoints to the superperformance price phase. The earnings ofthe company have been sensitive to business cycles, resulting involatile stock-price performance.Chart by Securities Research Company
117
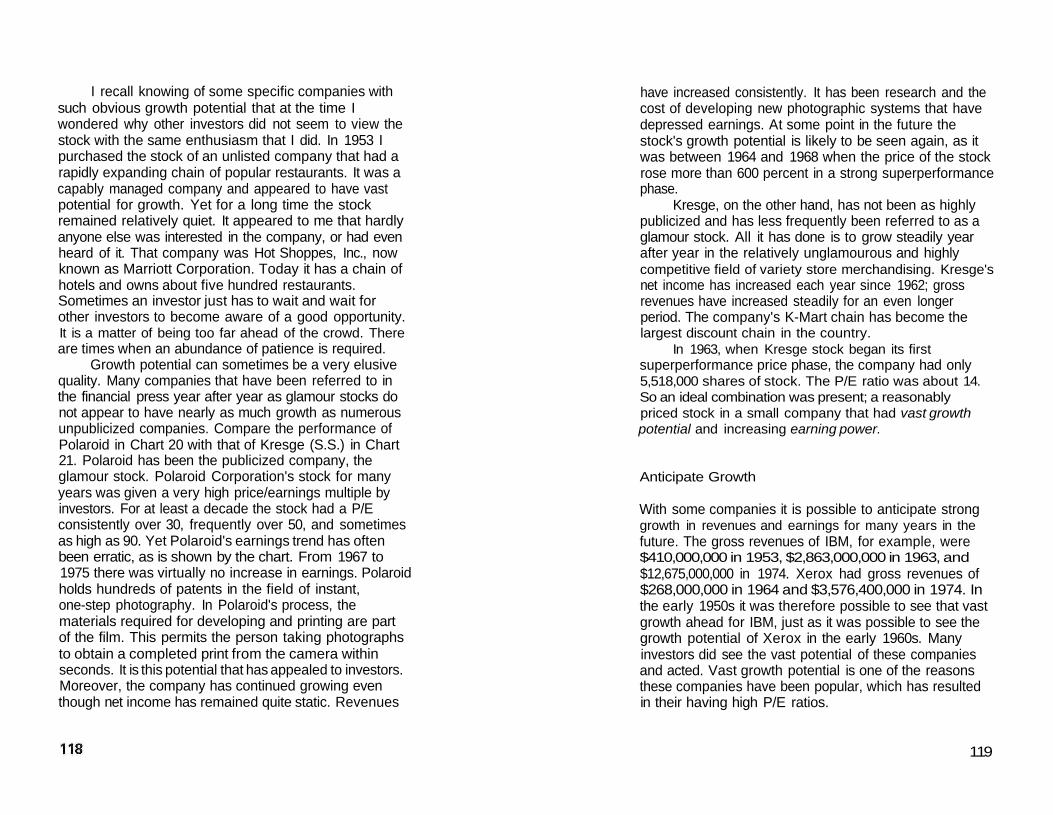
I recall knowing of some specific companies withsuch obvious growth potential that at the time Iwondered why other investors did not seem to view thestock with the same enthusiasm that I did. In 1953 Ipurchased the stock of an unlisted company that had arapidly expanding chain of popular restaurants. It was acapably managed company and appeared to have vastpotential for growth. Yet for a long time the stockremained relatively quiet. It appeared to me that hardlyanyone else was interested in the company, or had evenheard of it. That company was Hot Shoppes, Inc., nowknown as Marriott Corporation. Today it has a chain ofhotels and owns about five hundred restaurants.Sometimes an investor just has to wait and wait forother investors to become aware of a good opportunity.It is a matter of being too far ahead of the crowd. Thereare times when an abundance of patience is required.
Growth potential can sometimes be a very elusivequality. Many companies that have been referred to inthe financial press year after year as glamour stocks donot appear to have nearly as much growth as numerousunpublicized companies. Compare the performance ofPolaroid in Chart 20 with that of Kresge (S.S.) in Chart21. Polaroid has been the publicized company, theglamour stock. Polaroid Corporation's stock for manyyears was given a very high price/earnings multiple byinvestors. For at least a decade the stock had a P/Econsistently over 30, frequently over 50, and sometimesas high as 90. Yet Polaroid's earnings trend has oftenbeen erratic, as is shown by the chart. From 1967 to1975 there was virtually no increase in earnings. Polaroidholds hundreds of patents in the field of instant,one-step photography. In Polaroid's process, thematerials required for developing and printing are partof the film. This permits the person taking photographsto obtain a completed print from the camera withinseconds. It is this potential that has appealed to investors.Moreover, the company has continued growing eventhough net income has remained quite static. Revenues
have increased consistently. It has been research and thecost of developing new photographic systems that havedepressed earnings. At some point in the future thestock's growth potential is likely to be seen again, as itwas between 1964 and 1968 when the price of the stockrose more than 600 percent in a strong superperformancephase.
Kresge, on the other hand, has not been as highlypublicized and has less frequently been referred to as aglamour stock. All it has done is to grow steadily yearafter year in the relatively unglamourous and highlycompetitive field of variety store merchandising. Kresge'snet income has increased each year since 1962; grossrevenues have increased steadily for an even longerperiod. The company's K-Mart chain has become thelargest discount chain in the country.
In 1963, when Kresge stock began its firstsuperperformance price phase, the company had only5,518,000 shares of stock. The P/E ratio was about 14.So an ideal combination was present; a reasonablypriced stock in a small company that had vast growthpotential and increasing earning power.
Anticipate Growth
With some companies it is possible to anticipate stronggrowth in revenues and earnings for many years in thefuture. The gross revenues of IBM, for example, were$410,000,000 in 1953, $2,863,000,000 in 1963, and$12,675,000,000 in 1974. Xerox had gross revenues of$268,000,000 in 1964 and $3,576,400,000 in 1974. Inthe early 1950s it was therefore possible to see that vastgrowth ahead for IBM, just as it was possible to see thegrowth potential of Xerox in the early 1960s. Manyinvestors did see the vast potential of these companiesand acted. Vast growth potential is one of the reasonsthese companies have been popular, which has resultedin their having high P/E ratios.
119
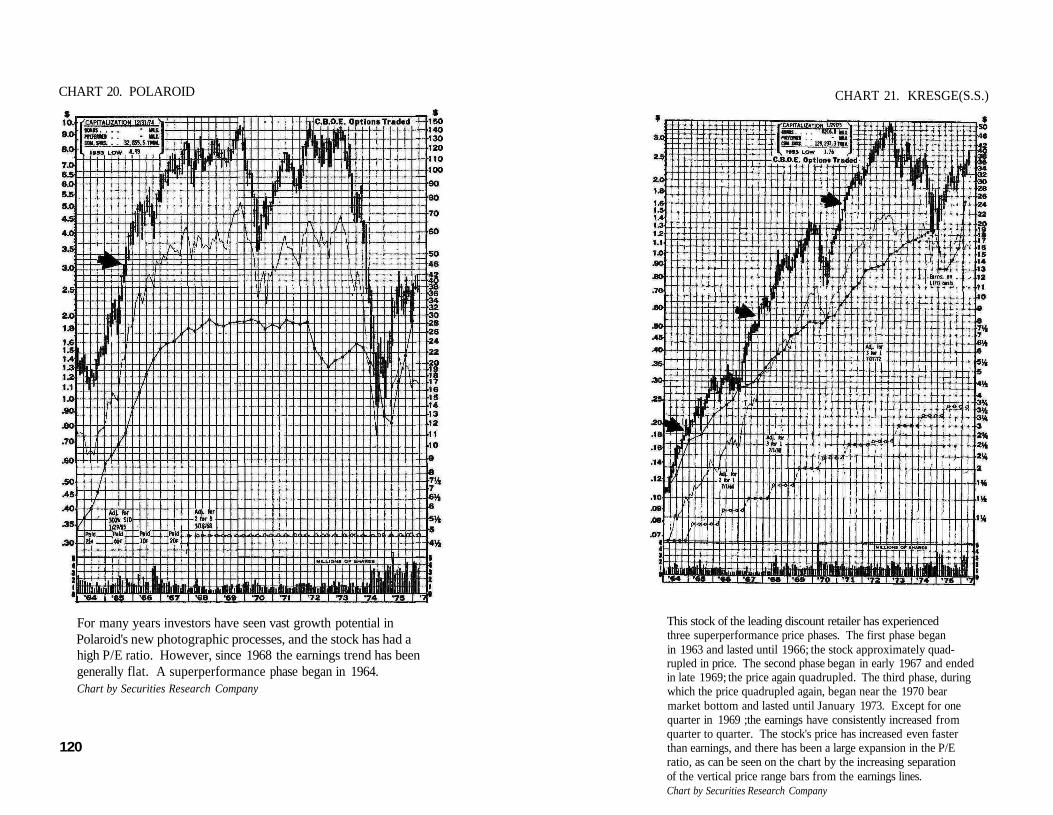
CHART 20. POLAROID
For many years investors have seen vast growth potential inPolaroid's new photographic processes, and the stock has had ahigh P/E ratio. However, since 1968 the earnings trend has beengenerally flat. A superperformance phase began in 1964.Chart by Securities Research Company
120
CHART 21. KRESGE(S.S.)
This stock of the leading discount retailer has experiencedthree superperformance price phases. The first phase beganin 1963 and lasted until 1966; the stock approximately quad-rupled in price. The second phase began in early 1967 and endedin late 1969; the price again quadrupled. The third phase, duringwhich the price quadrupled again, began near the 1970 bearmarket bottom and lasted until January 1973. Except for onequarter in 1969 ;the earnings have consistently increased fromquarter to quarter. The stock's price has increased even fasterthan earnings, and there has been a large expansion in the P/Eratio, as can be seen on the chart by the increasing separationof the vertical price range bars from the earnings lines.Chart by Securities Research Company

Even if it is necessary to wait a number of years fora stock to be recognized, eventually such patience canprove to be very rewarding. Your only real alternative isto find another stock that will have superperformanceprice action sooner.
Earnings Explosions
Earnings explosions are often of great significancebecause they call attention to newly developed earningpower. Recently I ran across a small clipping I had tornfrom a local newspaper in the summer of 1963. Theclipping reads: "Xerox Corporation in 6 months endedJune 30 earned $10,327,031 or $2.66 a share vs.$5,658,165 or $1.74 in 1962 period." That is anexample of an earnings explosion: a large suddenincrease in the profitability of a company.
The earnings explosion occurred just after Xeroxintroduced its new copiers, and the earnings increase wasdirectly traceable to revenues from the new copiers.
At about the same time in 1963 I purchasedanother stock that was beginning to look very interesting,Syntex Corporation, shown in Chart 22. Earlier in theyear Syntex had sold at under $12 a share. By January1964 it had reached as high as $190 per share beforeheavy institutional selling caused a reaction. One of thestrongest forces propelling the price increase was therumor, later confirmed, of a large increase in earnings.In this case the earnings for the 1963 fiscal year weremore than quadruple the earnings for fiscal 1962. Ofeven greater importance than reported earnings,however, was the expectation in the minds of speculatorsthat future earnings would be even larger. Syntex at thattime was one of two companies pioneering thedevelopment of birth control pills. Investors couldanticipate a very large market and increased earnings forthe future. Thus, the expectation of large future earningscaused a buyers' stampede for the stock.
122
CHART 22. SYNTEX
Syntex was a small company that developed a unique newpatent-protected product, birth control pills, which had vastgrowth potential. In 1963 the company had a big increase inearnings and also received extensive publicity. The stock hashad strong sponsorship and institutional interest. The arrowsindicate superperformance phases.Chart by Securities Research Company
123
Be Skeptical of Reported Earnings
Many investors act on the basis of reported earnings,even when the earnings might exist only in theimagination of some creative accountant, or be of amerely temporary nature. Many of these investmenterrors are caused by the fact that companies report theirquarterly earnings to the financial press, where theinformation is printed and widely distributed. But thequarterly figures are unaudited. Moreover, no details aregiven that might help investors to evaluate the figuresand determine whether a reported earnings increaseindicates a new trend or merely a temporary situation.
During the 1970 recession, when stock prices wereseverely depressed, another action occurred. Corporatetreasurers suddenly became ultraconservative, writingdown inventories, buildings, research projects, andfuture costs by setting up reserves. That approachlowered 1970 earnings, but every dollar charged offagainst 1970 added that much to future profits.Corporate officers have justified such an action bystating that it helps shareholders. When write-offs areconcentrated in a single year it assists the stock inrebounding the next year. These accounting practicesprobably reinforce the cyclical action of the earnings ofmany companies and the price action of the stock. Someearnings increases are cyclical in nature and might notindicate newly developed earning power.
Reported Earnings Depend on Accounting Procedures
If an investor is interested in particular groups, such asoil or steel companies, he should keep in mind that allcompanies do not necessarily report their earnings in thesame manner. They might use different accountingprocedures, which of course makes it very difficult tocompare stocks. Among oil companies, for instance,some defer the cost of drilling expenses over the
124
expected life of the properties, while others do not. Inthe case of large oil companies, millions of dollars areinvolved. It points up the fact that reported profits andearnings should often be regarded with skepticism.
The important question for the investor to keep inmind is: "Are the earnings going to continue to increase inthe future?" The best clues are likely to be found in thenature of the business, the plans of management, and thetrends in the volume of sales and revenues. The qualityof earnings increases, in other words, must be evaluated.
Higher Earnings Are Usually Anticipated
But how about earnings that are uncomplicated bymanipulation, that are higher simply because thecompany had a much more profitable year? Let'ssuppose the earnings are reported and they have doubled.The stock should go up in price, right? No, notnecessarily. Not if a dozen mutual fund managers hadexpected earnings to triple, not merely double. Theywould be disappointed and might decide to sell. Otherinvestors who had predicted the earnings increasemight decide to sell on the news. Reports of largeincreases in earnings have their biggest impact whenthey come as a surprise. When that happens, almosteveryone has an opportunity to participate in theresulting rise. Being able to interpret the effect that anearnings report will have on the market is veryimportant. And even more significant is the light itmight cast on the company's prospects for continuedfuture profits. Earning power, real and potential, is themost important feature to look for.
Earning Trends Affect Superperformance Price Action
My review of the long-term charts of 1,018 stocksrevealed that increased earnings trends often are
important influences in superperformance stock-pricemoves. Approximately 38 percent of the stock-pricemoves coincided with or briefly followed large increasesin the reported quarterly earnings. An additional 28percent of the moves appeared to be associated withrelatively moderate earnings increases, but in about 34percent of the price moves no correlation could bemade. There were many cases of declining prices duringperiods of rising earnings, particularly when bear marketconditions prevailed. The long-term chart histories ofprices and earnings indicate that investors overreact toreported or expected earnings increases.
The Role Future Earnings Play in Stock Prices
The movement of individual stock prices, then, isrelated in the long run to the earnings anticipated in thefuture. When certain influences are present, such asimportant news developments or changes in nationalmonetary policies, virtually the entire stock marketmoves in unison in a bullish or bearish direction becauseinvestors anticipate the influence that the newdevelopment will have on future earnings.
But future earnings have not always been soimportant in determining the value of a stock. BenjaminGraham and David L. Dodd in their book SecurityAnalysis, first published in 1934, pointed out that thetrend of earnings concept for valuation developed duringthe latter stages of the bull market culminating in 1929.Formerly, investment in common stocks was based onthree elements: a suitable and established dividendreturn, a stable and adequate earnings record, and assetvalues. This approach to common-stock investment wasconsidered inadequate because past earnings anddividends could no longer be considered an index offuture earnings and dividends. During the 1920s changein the fortunes of companies was rapid, as it is today. Asa result, the idea became dominant that the value of
common stock depended on what it would earn in thefuture, and a good stock would show a rising trend ofearnings. This change in the method of evaluatingcommon stocks resulted in a blurring of the distinctionsbetween investment and speculation, since emphasis wasplaced on the enhancement of principal instead of onthe dividend received from the investment.
Evaluate Reported Earnings
The investor must base his decision to invest or not toinvest on much more information than merely reportedearnings. He must find out what caused the increase inreported earnings and he must determine whether or notthe increase can be expected to continue. A largeincrease in reported earnings can be a one-time thing. Itmight result from tax credits or the sale of property orother assets. Recently one of the nation's largest steelcorporations reported a large increase in earnings, butthis was principally caused by a change in accountingmethods. In another example, in early 1974 theSecurities and Exchange Commission charged Avis, Inc.,with mailing shareholders a false and misleading reportfor 1973's first quarter; Avis had failed to disclose thatabout 70 percent of its earnings had come from vehiclesales.
Since the trend of earnings is followed closely bythe majority of investors, most managements reportearnings quarterly and the information is dutifullyreported in the financial press. The price of thecompany's stock usually reacts quickly to quarterlyearnings reports if the announced figures are differentfrom those that had been anticipated. But the details onwhich the quarterly results are based might not beavailable for study until many, many months later. Thus,investors can be and frequently are misled by thequarterly earnings reported by company managements.
The most creative accountants have mastered the
127
technique of showing minimal earnings to the InternalRevenue people and exploding earnings to the investingpublic. This sleight-of-hand approach calls for bullishpublicity for potential stock purchasers but a large doseof reality later, when income taxes have to be reported.There have been too many people, both in corporatemanagement and on Wall Street, who have regarded theinvestor as a sucker to be taken. They stopped sellingthe Brooklyn Bridge to visitors many years ago. Theobvious reason is that the quick-buck artists discovered amore sophisticated and a much more lucrative place:Wall Street.
So try to anticipate earnings for specific companiesand for the general market. Try to determine the trendand the extent of the increase or decrease in earnings.But remain skeptical and investigate reported figures.Select stocks that seem to be undervalued in relation toprospects for growth.
128
Chapter 10Look for Expandable Price/Earnings Ratios
Most superperformance price moves are caused not bydevelopments such as increased earnings, but rather byoverreaction of investors to those developments. Theoverreaction can be measured quite accurately bycomparing the increase in the price to the increase inearnings—that is, by the expansion in the P/E ratio.Some of the biggest stock market profits are made bygoing along with the crowd while it pushes the priceof a stock higher and higher in nonstop optimism.Superperformance price moves occur in a stock whenlarge numbers of investors all think alike and cause abuying stampede. Stock prices rise rapidly and everyoneis bullish, expecting even higher prices. Supply anddemand forces operate. Many people want to buy andfew want to sell, so the bidding escalates rapidly.
Sometimes the quickest profits are obtained duringthese periods of optimism in very active stocks thateveryone seems to be aware of and many people aretrading. But with this type of stock it is important to bein the action early. Cautious investors often delay theirpurchase until they are absolutely certain that they areright in buying a stock. It is often at this point that thestock, which has been going up in price for some time,is due for a reaction. Do not be too late in joining theaction; it is also important not to overstay a positionthat has turned stale or has started to decline. Be alertfor turns or changes in investor psychology. For yourown protection it is discreet to use stop-loss orders ifthe price of a stock has risen rapidly.
A stop-loss order is an instruction to a stockbrokerto sell a specific number of shares of stock if the pricedeclines to a designated level. The broker will try to sellthe stock at the designated price. Stop-loss orders are
intended to minimize losses. This step is particularlyrecommended if you are not able to follow the marketclosely.
Just as there are times to go along with the bullishenthusiasm of the crowd, there are also times to leave,to stand aside. The time to sell is when the bullish driveis beginning to lose its momentum, to turn stale.
Price superperformance phases do not lastindefinitely. Most of them last only a couple of years,then the stock reacts into a downtrend or sidewaysprice action. The prevailing mood of investors changes,often slowly, from bullish optimism, to doubt andapprehension, to bearish pessimism, and finally to panicas the decline accelerates. As with unbounded optimism,never underestimate the power of negative thinking.Fear and pessimism become so overwhelming at timesthat even the strongest, most bullish-looking stocks arecaught up in the selling deluge. The speculative mood ofinvestors appears to move in waves of pessimism andoptimism that are based on actual economic or politicalconditions but which greatly amplify those conditions.When the national economy becomes strong, the stockmarket often becomes even more bullish than is justifiedby the facts. When the economy turns down andforecasters begin warning of a possible recession, theinvestors become even more pessimistic than is justifiedand they sell stocks down to bargain-price levels.Investment psychology often loses its logic and becomesemotional. The news media play a particularly importantrole in developing moods of mass optimism or pessimism.
The P/E ratio reflects the enthusiastic optimism orgloomy pessimism of investors. At one period in 1961the P/E ratio of the Dow Jones industrials hit 24; atthe end of 1973 the ratio was 10; and in late 1974 it wasas low as 6. The change in the ratio for many individualstocks was much greater. In early January 1973, theDow Jones industrial average reached a bull market peakof 1,067. At that time the P/E ratios of some stocksreached very high multiples, but by 1974 the P/E ratios
of the same stocks had contracted to lower multiples.This contraction in the P/E ratio occurred whileearnings were rising. But the psychological setting hadchanged, for 1973 was the year of Watergate and theenergy crisis, and 1974 brought fear of an approachingrecession. So the real change occurred in the psychologyof investors, from a mood of confidence and optimismto one of doubt and pessimism. The P/E ratio reflectsthat change in attitude.
Psychology and Stock Prices
Of all the forces that influence stock prices, mass fearand mass greed can often be the most dominant. Strongpsychological forces can move prices in individualstocks, and the stock market as a whole, faster and fasterupward and downward than is justified by the news thatusually gives the impetus to the move. By causing pricemoves to go to high and low extremes, psychologicalforces create excellent selling and buying opportunitiesfor alert investors.
It is unrealistic always to be optimistic or always tobe pessimistic. There is a time for optimism and there isa time for pessimism. More important than your mood isyour sensitivity to whether the crowd is optimistic orpessimistic. The rewards are few if you are optimisticwhile the crowd is selling in waves of pessimism. Thecrowd may be wrong, but you cannot fight the crowd byyourself. If you try to buck the stampede, you will betrampled. If you buy a stock too early during a periodof highly emotional selling, you will soon discover thatyou have a loss, and perhaps a large one. The time to becontrary, to sell or to pick up bargains, is after anemotional binge of mass optimism or pessimism has lostmomentum and a reversal is imminent. Soon others willrealize that the future is not as bleak or as rosy as it hadappeared. News developments, particularly the way theyare reported in the media, frequently are the biggest
influence in creating the dominant mood. To aconsiderable degree prices are made by emotions andby the shifting attitudes of large numbers of investors.
Emotions also play a very significant role inselecting a stock for purchase. The image of a companyis projected in its type of business and in its name. If wename a company Planetary Explorations Unlimited, forexample, to start in the business of exploring theuniverse, it will create a different impression in the mindof a prospective investor than, say, a company namedConsolidated Concrete.
Establishing Stock Values
In the late 1940s, when I was a graduate student takingbusiness courses at Columbia University, I recall thatone professor, lecturing on the determination of values,explained that a piece of property is worth as much assomeone is willing to pay you for it. So it is withcommon stock. Find stocks for which you thinksomeone will be willing to pay you a higher price atsome time in the future. This approach is applicable toany type of investment—in a diamond, a painting, abushel of corn or wheat, a house, a piece of land, or ashare of common stock. The market price of the itemreflects the psychological factors—the extremes ofoptimism and pessimism—that can cause the value ofan item to vary widely, sometimes in just a few hours ordays. When the market value of an item is plummeting,it reveals that the fear many people have of lower valuesfor their property is stronger than their hopes for higherprices.
There are several methods for establishing thetheoretical value of a stock as compared with its sellingprice in the market. One is the company's book value,which is determined by adding up the company's assets,subtracting the liabilities, and dividing by the number ofcommon shares outstanding. The large discrepancy thatexists between marketplace value and asset value is
132
clearly pointed up by the closed-end investmentcompanies that have been priced for years at substantialdiscounts from their net asset value. During bearmarkets the discount expands; in bull markets itcontracts.
In the early years of this century assets were usuallygiven greater weight than they are now and investorstraditionally bought stocks for their dividends. Today acompany's earning power, particularly its future earningpower, is the most important consideration.
Another approach to establishing value is tocompare the dividends available from income-payingstocks with the yield available from bonds and othertypes of investments. Until 1958 bond yields wereconsiderably lower than the dividends being paid by thecompanies comprising the Dow Jones industrials. Duringthe years prior to 1956 the average yield of forty bondsfluctuated between 3 and 4 percent. But, beginning in1956, bond yields began to climb irregularly, rising toabove 10 percent in 1974. Dividends paid by the stockswere above 6.5 percent during most of 1951. Stockyields declined steadily after 1951. In 1958 the yieldsfrom bonds became higher than from stocks, and bondyields have been higher ever since, by a wide margin. Theerosion in the value of the dollar through inflation hasbeen responsibile for the large increase in bond yields. Inmore recent years inflation has been the major cause forthe steady price decline of income-type stocks, such asthe utilities and large, mature companies that are notgrowing rapidly but are also not increasing theirdividends sufficiently to justify their purchase asincome-type investments.
Other methods of establishing the value of stockshave been developed, including one which assumes thatthe value of a security is equal to the present worth ofall future payments. Another method attempts toestimate future earnings and dividends for a specificperiod of time, such as ten years. The investor mustbelieve that a fair rate of return, called the discount rate,is a certain percentage, say 9 percent. Thus, if a stock
133
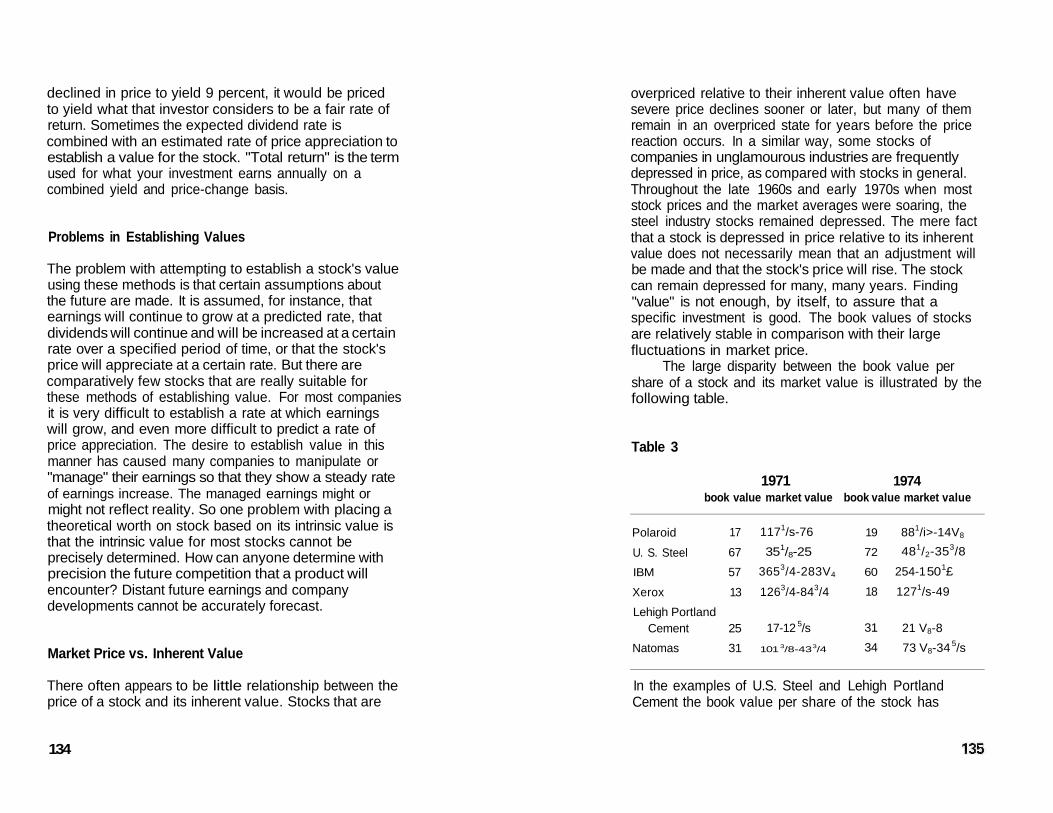
declined in price to yield 9 percent, it would be pricedto yield what that investor considers to be a fair rate ofreturn. Sometimes the expected dividend rate iscombined with an estimated rate of price appreciation toestablish a value for the stock. "Total return" is the termused for what your investment earns annually on acombined yield and price-change basis.
Problems in Establishing Values
The problem with attempting to establish a stock's valueusing these methods is that certain assumptions aboutthe future are made. It is assumed, for instance, thatearnings will continue to grow at a predicted rate, thatdividends will continue and will be increased at a certainrate over a specified period of time, or that the stock'sprice will appreciate at a certain rate. But there arecomparatively few stocks that are really suitable forthese methods of establishing value. For most companiesit is very difficult to establish a rate at which earningswill grow, and even more difficult to predict a rate ofprice appreciation. The desire to establish value in thismanner has caused many companies to manipulate or"manage" their earnings so that they show a steady rateof earnings increase. The managed earnings might ormight not reflect reality. So one problem with placing atheoretical worth on stock based on its intrinsic value isthat the intrinsic value for most stocks cannot beprecisely determined. How can anyone determine withprecision the future competition that a product willencounter? Distant future earnings and companydevelopments cannot be accurately forecast.
Market Price vs. Inherent Value
There often appears to be little relationship between theprice of a stock and its inherent value. Stocks that are
134
overpriced relative to their inherent value often havesevere price declines sooner or later, but many of themremain in an overpriced state for years before the pricereaction occurs. In a similar way, some stocks ofcompanies in unglamourous industries are frequentlydepressed in price, as compared with stocks in general.Throughout the late 1960s and early 1970s when moststock prices and the market averages were soaring, thesteel industry stocks remained depressed. The mere factthat a stock is depressed in price relative to its inherentvalue does not necessarily mean that an adjustment willbe made and that the stock's price will rise. The stockcan remain depressed for many, many years. Finding"value" is not enough, by itself, to assure that aspecific investment is good. The book values of stocksare relatively stable in comparison with their largefluctuations in market price.
The large disparity between the book value pershare of a stock and its market value is illustrated by thefollowing table.
Table 3
1971book value market value
1974book value market value
PolaroidU. S. SteelIBM
XeroxLehigh Portland
CementNatomas
17675713
2531
1171/s-7635 1/8-25
3653/4-283V4
1263/4-843/4
17-12 5/s101 3/8-43 3/4
19
72
60
18
3134
881/i>-14V8
481/2-353/8254-1 50 1£1271/s-49
21 V8-873 V8-34 5/s
In the examples of U.S. Steel and Lehigh PortlandCement the book value per share of the stock has
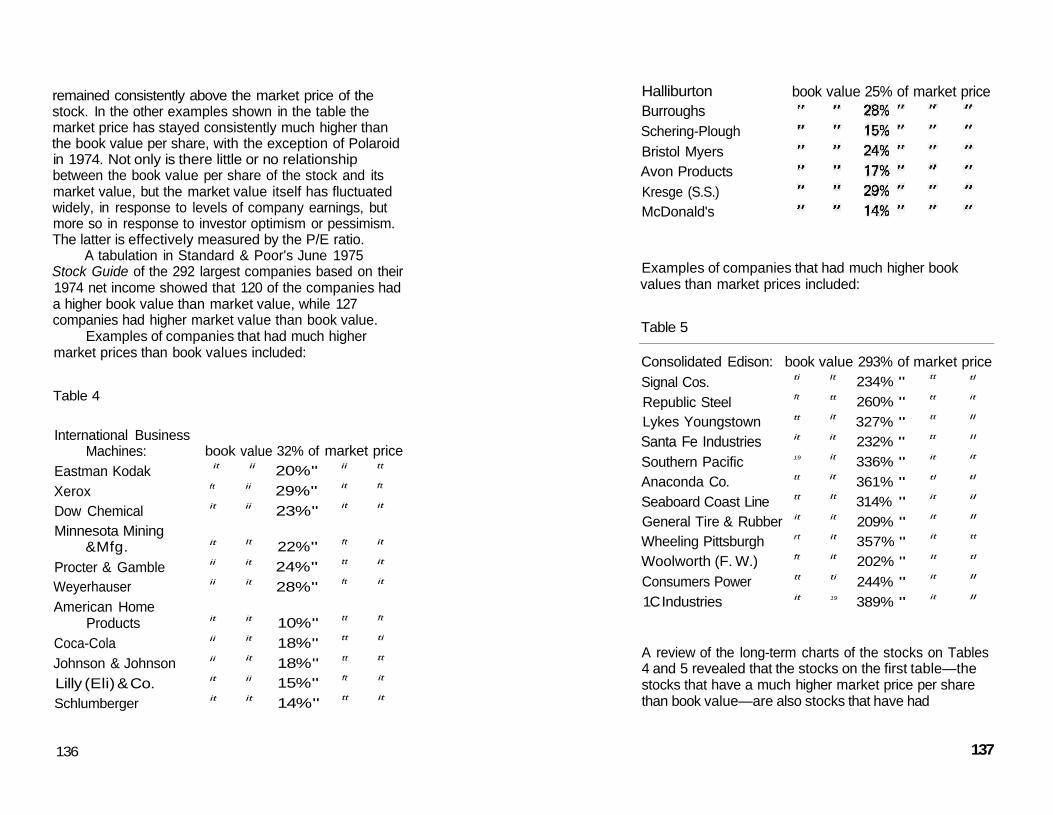
remained consistently above the market price of thestock. In the other examples shown in the table themarket price has stayed consistently much higher thanthe book value per share, with the exception of Polaroidin 1974. Not only is there little or no relationshipbetween the book value per share of the stock and itsmarket value, but the market value itself has fluctuatedwidely, in response to levels of company earnings, butmore so in response to investor optimism or pessimism.The latter is effectively measured by the P/E ratio.
A tabulation in Standard & Poor's June 1975Stock Guide of the 292 largest companies based on their1974 net income showed that 120 of the companies hada higher book value than market value, while 127companies had higher market value than book value.
Examples of companies that had much highermarket prices than book values included:
Table 4
136
Examples of companies that had much higher bookvalues than market prices included:
Table 5
A review of the long-term charts of the stocks on Tables4 and 5 revealed that the stocks on the first table—thestocks that have a much higher market price per sharethan book value—are also stocks that have had
137
International BusinessMachines:
Eastman KodakXeroxDow ChemicalMinnesota Mining
&Mfg.Procter & GambleWeyerhauserAmerican Home
ProductsCoca-ColaJohnson & JohnsonLilly (Eli) & Co.Schlumberger
bookit
ft
it
it
ii
ii
it
ii
ii
it
it
valueii
ii
ii
It
it
it
it
it
it
ii
it
32% of20% "29% "23% "
22% "24% "28% "
10% "18% "18% "15% "14% "
marketii
it
it
ft
tt
ft
tt
tt
tt
ft
tt
pricett
ft
it
it
it
it
ft
ti
tt
it
it
Consolidated Edison: book value 293% of market priceSignal Cos.Republic SteelLykes YoungstownSanta Fe IndustriesSouthern PacificAnaconda Co.Seaboard Coast LineGeneral Tire & RubberWheeling PittsburghWoolworth (F. W.)Consumers Power1C Industries
ti
ft
tt
it
19
tt
tt
it
rt
ft
tt
it
It
tt
it
it
it
it
It
it
it
it
ti
19
234% "260% "327% "232% "336% "361% "314% "209% "357% "202% "244% "389% "
tt
tt
tt
tt
it
tl
it
it
it
It
it
it
tl
it
ll
II
it
tl
il
ll
tt
tl
ll
ll
HalliburtonBurroughsSchering-PloughBristol MyersAvon ProductsKresge (S.S.)McDonald's
book value 25% of market price
consistently rising earnings and a price history thatgenerally followed the upward earnings trend. Theywere also stocks that were heavily favored by institutionalinvestors. They have had high price/earnings ratios aswell as high price/assets ratios.
The stocks on the second table—the stocks withhigh book values per share relative to their market priceper share—are stocks that have had erratic earningsand price records. They have not been favorites ofinstitutional investors.
It is apparent, by comparing these two stockgroups, that stock selections have been made based ongood earnings trends. Large assets have been lessimportant in determining purchases. Will the investmentselection pattern change? In the future will investors,particularly the institutional investors now dominatingcommon stock investment, buy stocks on the basis ofbook value instead of earnings? Probably not. Stockselections will probably continue to be based primarilyon the outlook for the earnings of individual companies.
Market Price vs. Dividends
A review of the long-term charts, which show the levelof dividend payments as well as earnings and pricehistories, also revealed little relationship between thedividend level and the stock's price. In numerousinstances stocks have had declining price trends whiletheir dividends were being increased. There are very fewcases in which a dividend increase appears to havecaused a price increase. The lack of relationship betweenprice and dividend payout can be observed on twoearlier charts—Dow Jones Utility Average, Chart 7, andAmerican Telephone and Telegraph, Chart 8—and onInternational Business Machines, Chart 25, whichappears toward the end of this chapter.
The investment manager of a large universityendowment reported that during 1974's severe bear
138
market eighteen of the twenty-eight stocks in theuniversity's portfolio increased their dividends. But theportfolio decreased 40.5 percent in value during theyear. The investment manager stated that the universityhad erred in maintaining a fully invested position, butacknowledged the lack of timing ability.
Estimating Price/Earnings Ratios
After you have estimated the earnings to be expected bya company, it is necessary to estimate a P/E ratio for thestock. How many times its earnings do you expect thestock might sell for? If you estimate that a company willhave earnings of five dollars a share and that it couldconservatively have a P/E ratio of 10, then the stockshould be expected to sell for fifty dollars at some timein future months. If the current price of the stock isonly seventeen dollars, then the stock might beconsidered a good buy if the primary trend of themarket is upward and is expected to continue climbing.
In my review of the long-term charts I discoveredthat there were a few stocks whose earnings wereincreasing at a faster rate than their price. They were theexceptions. In 464 of the 589 superperformance movesthe P/E ratio at the end of the move was higher than atthe beginning.
P/E ratios expand to higher multiples when thefuture looks very good; they contract to lower multipleswhen the future looks bleak or uncertain. P/E's aresensitive measurements of mass psychology. Theevidence indicates, therefore, that investor psychology isjust the opposite of what it should be for successfulinvestment, since P/E ratios have been high at the end ofsuperperformance moves. But it is after a stock price hasmoved upward for two or three years that caution anda low P/E ratio are called for, since it is at this time thata price reaction is most likely to occur. And even thevery best stocks have price reactions.

My study of the long-term charts also indicatedthat most superperformance price moves begin whenP/E ratios are at a relatively low level, or in stocks thathave relatively low P/E's. Only about 10 percent of themoves began in stocks that had P/E ratios above 20. It isvery difficult for a high P/E ratio, such as 45, to doubleto 90. But it is relatively easy for a stock with a P/Eratio of 10 to double to 20 or even to triple to 30.Stocks with high P/E ratios are more dependent onincreased earnings to bring about higher prices, ratherthan expanding P/E multiples.
P/E ratios reflect the popularity of a stock. If thefuture earnings of a company look good, the P/E ratio islikely to be high, perhaps 20 or 30. If the future of thecompany appears to be fabulous and investors are highlyoptimistic, the ratio might be 50 or 60. But if there areindications of future problems, perhaps portending anearnings decline, the P/E ratio might decline to 10 orless.
So when the earnings of a company are predictedto double, do not expect the price to double. If the P/Eof the company is exceptionally low at the time theestimate is made, the result might be that the price willmore than double. If a share of stock is selling for fivedollars and earnings were one dollar a share, its P/E is5. If earnings are expected to be two dollars, theoptimism generated by this news is likely to cause theP/E to expand, perhaps to 10 or 20 or even higher if therate of earnings increase is expected to continue. Thus astock earning two dollars a share might be expected tosell for twenty dollars with a P/E of 10, or forty dollarsif the P/E expands to 20.
However, take a theoretical example of a stockearning a dollar a share that is expected to doubleearnings to two dollars a share. The stock, however, hasbeen selling for eighty dollars, with a P/E of 80. It istherefore unrealistic to expect the stock to more thandouble in price. The increased earnings are alreadydiscounted in the high price of the stock.
140
In market sell-offs, lower earnings are usually lessresponsible for lower stock prices than are psychologicalinfluences resulting in lower P/E ratios. Thus, a companymight have earnings of $8 a share. With its stock sellingfor $160, the P/E ratio is 20. But let's assume that thenational economy has entered a recession and that thecompany's anticipated earnings for next year areexpected to decline to $4 a share. If the price of thestock declines at the same ratio as the earnings, it mightdecline to 80, retaining the P/E ratio of 20. But becauseof the effect of mass pessimism among stockholders, theP/E ratio might contract to 15 or less. The result mightbe a stock price of $60 or lower.
The P/E ratio can also be expressed as an earningsyield. For example, if a stock earned five dollars duringthe past year and the stock's price is one hundreddollars, the P/E ratio is 20; the earnings yield is 5percent. If the stock's price is fifty dollars, the P/E ratiois 10 and the earnings yield is 10 percent.
McDonald's shown on Chart 23, and InternationalFlavors and Fragrances, on Chart 24, are good illustrationsof companies that have had expanding P/E multiples.McDonald's P/E ratio expanded from 11 in 1966to 90 in 1972. International Flavors and Fragrancesalso revealed its steadily increasing popularity by havingan expanding P/E ratio.
The Influence of Price/Earnings Ratios
A sizable psychological impact may have occurred in1972 when the financial pages of newspapers beganprinting the P/E ratios of stocks. Until then thisinformation was not readily available, and it is unlikelythat many individual investors consistently went to thetrouble of computing the ratios. Of greater significance,perhaps, is the ability to see at a glance how the P/Eratios of various stocks compare. One effect of havingthe P/E ratios seen daily by millions of investors is that
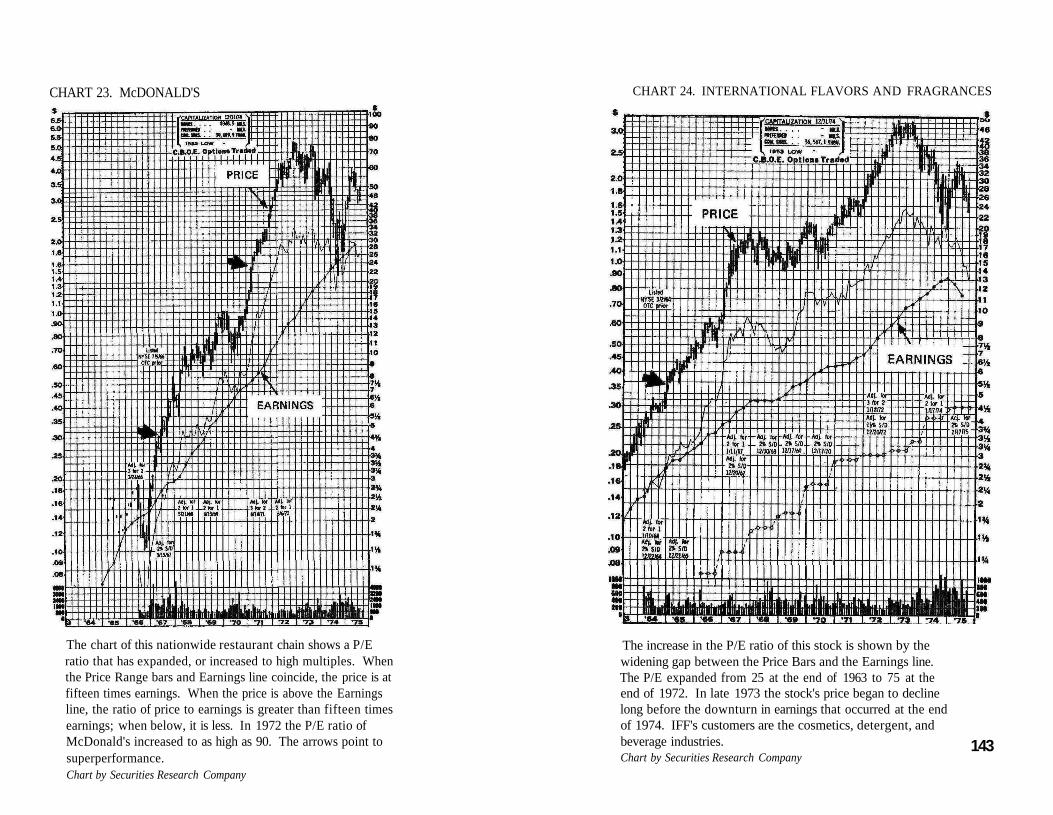
CHART 23. McDONALD'S
The chart of this nationwide restaurant chain shows a P/Eratio that has expanded, or increased to high multiples. Whenthe Price Range bars and Earnings line coincide, the price is atfifteen times earnings. When the price is above the Earningsline, the ratio of price to earnings is greater than fifteen timesearnings; when below, it is less. In 1972 the P/E ratio ofMcDonald's increased to as high as 90. The arrows point tosuperperformance.Chart by Securities Research Company
CHART 24. INTERNATIONAL FLAVORS AND FRAGRANCES
The increase in the P/E ratio of this stock is shown by thewidening gap between the Price Bars and the Earnings line.The P/E expanded from 25 at the end of 1963 to 75 at theend of 1972. In late 1973 the stock's price began to declinelong before the downturn in earnings that occurred at the endof 1974. IFF's customers are the cosmetics, detergent, andbeverage industries.Chart by Securities Research Company
143

they are likely to be more cautious about purchasing astock with a high P/E ratio when they see hundreds ofthem listed with low multiples.
There are times when an investor is justified inbuying a stock with a high P/E multiple. That is whenthe earnings of the company are increasing very rapidlyand show evidence of continuing to increase substantiallyin the years ahead. If the rapid growth is expected tocontinue for years, and it certainly has been predictablefor some companies in their early growth stage, then thestock is a buy. This was the case in early 1963, whenI was contemplating buying Xerox. At the time the P/Ewas 39, which was then very high as compared withmost other stocks. But the rapid growth features of thestock were so obvious that in this case the high P/E wasjustified. Subsequently, the stock continued itssuperperformance price rise and the P/E ratio expandedto as high as 77. The following January the stock wassplit 5 for 1. So a high P/E ratio should not, by itself,discourage an investor from purchasing a stock; it is onlyone element among many to be considered.
Recently I came across an old 1958 tabulation ofstocks that gave their P/E ratios. IBM had a P/E ratioof 48.7 and was owned by 367 institutions; today 1,131hold the stock. Many investors at that time probablythought that the P/E was too high and discounted toomuch future growth. The correct approach for theinvestor is to determine whether the company will haverapid and consistent growth in earnings. If a companyhas that, the P/E usually will not be too high, and yearslater the purchase will be regarded as having been atremendous bargain. In comparison, duPont E. I.de Nemours had a P/E ratio of 31 in 1958. Manyinvestors evidently preferred duPont to IBM, sinceduPont stock was owned by 608 institutions, now 367hold the stock. The performance of the two companiescan be compared by referring to Chart 25 for IBM andChart 26 for duPont.
Higher growth rates justify higher P/E ratios. But it
CHART 25. INTERNATIONAL BUSINESS MACHINES
Over the past decade the rise in the price level of IBMcommon stock has been in concert with increased institutionalownership. The total market value of IBM is over $39 billion.Chart by Securities Research Company
144
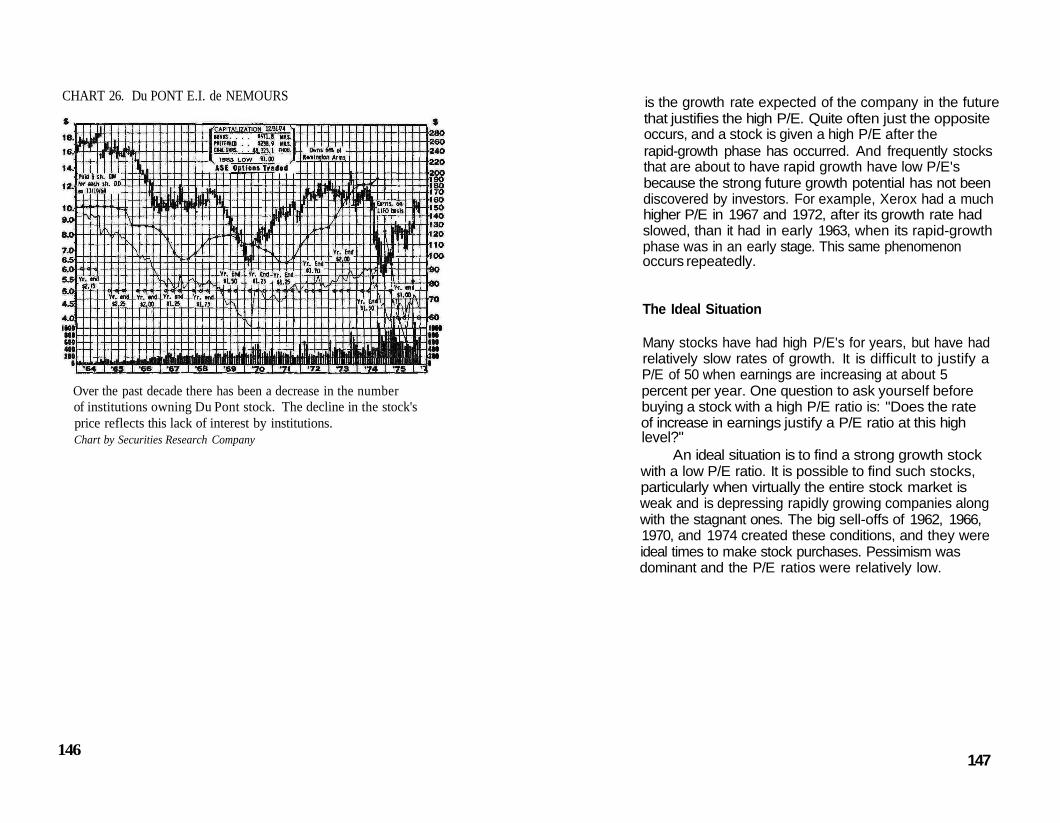
CHART 26. Du PONT E.I. de NEMOURS
Over the past decade there has been a decrease in the numberof institutions owning Du Pont stock. The decline in the stock'sprice reflects this lack of interest by institutions.Chart by Securities Research Company
146
is the growth rate expected of the company in the futurethat justifies the high P/E. Quite often just the oppositeoccurs, and a stock is given a high P/E after therapid-growth phase has occurred. And frequently stocksthat are about to have rapid growth have low P/E'sbecause the strong future growth potential has not beendiscovered by investors. For example, Xerox had a muchhigher P/E in 1967 and 1972, after its growth rate hadslowed, than it had in early 1963, when its rapid-growthphase was in an early stage. This same phenomenonoccurs repeatedly.
The Ideal Situation
Many stocks have had high P/E's for years, but have hadrelatively slow rates of growth. It is difficult to justify aP/E of 50 when earnings are increasing at about 5percent per year. One question to ask yourself beforebuying a stock with a high P/E ratio is: "Does the rateof increase in earnings justify a P/E ratio at this highlevel?"
An ideal situation is to find a strong growth stockwith a low P/E ratio. It is possible to find such stocks,particularly when virtually the entire stock market isweak and is depressing rapidly growing companies alongwith the stagnant ones. The big sell-offs of 1962, 1966,1970, and 1974 created these conditions, and they wereideal times to make stock purchases. Pessimism wasdominant and the P/E ratios were relatively low.
147

Chapter 11Look for Good Sponsorship
Sponsorship is the recommendation or promotion of astock with the intent or expectation that it will rise inprice. Stockbrokers often sponsor stocks, which theyusually recommend widely to their customers andfrequently to the public. Companies sometimes sponsortheir own stock by making purchases in the openmarket. This is frequently done for employee pensionfunds. Widely read investment services also act assponsors when they make purchase recommendations.
One commonly used type of sponsorship is theinvestment or market letter. There are hundreds of thesereports or letters, most of which are mailed weekly to alist of subscribers, usually with specific stocks beingrecommended for purchase. Another type of sponsorshipincludes the recommendations that stockbrokers maketo their customers. In the large brokerage firms thathave offices nationwide the list of stocks recommendedfor purchase is drawn up in a central securities researchoffice, usually in New York. Thus, when thousands ofinvestors in dozens of offices are advised that a specificstock is highly recommended, that action constitutesstrong sponsorship. A third type of sponsorship is thebuying support that a large investor, often an institutionor the company itself, gives to a stock when the stock'sprice declines to a predetermined support level.
The important question to ask yourself when yousee a stock being sponsored is: "How good is thesponsorship?" Some sponsorship can be sound, especiallythat of certain of the large research organizationsthat expend considerable amounts of money and effortin their analyses of companies. But there are somemarket letters that can do the investor more harm thangood. Evaluate their recommendations carefully. In
149
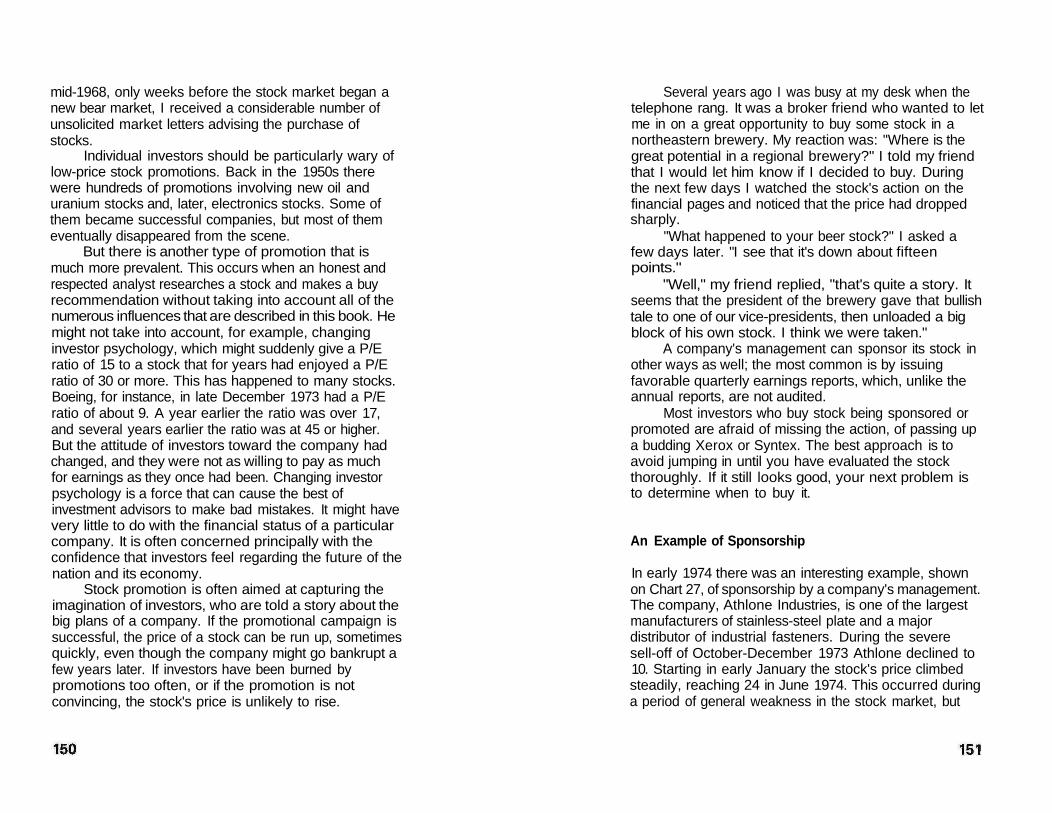
mid-1968, only weeks before the stock market began anew bear market, I received a considerable number ofunsolicited market letters advising the purchase ofstocks.
Individual investors should be particularly wary oflow-price stock promotions. Back in the 1950s therewere hundreds of promotions involving new oil anduranium stocks and, later, electronics stocks. Some ofthem became successful companies, but most of themeventually disappeared from the scene.
But there is another type of promotion that ismuch more prevalent. This occurs when an honest andrespected analyst researches a stock and makes a buyrecommendation without taking into account all of thenumerous influences that are described in this book. Hemight not take into account, for example, changinginvestor psychology, which might suddenly give a P/Eratio of 15 to a stock that for years had enjoyed a P/Eratio of 30 or more. This has happened to many stocks.Boeing, for instance, in late December 1973 had a P/Eratio of about 9. A year earlier the ratio was over 17,and several years earlier the ratio was at 45 or higher.But the attitude of investors toward the company hadchanged, and they were not as willing to pay as muchfor earnings as they once had been. Changing investorpsychology is a force that can cause the best ofinvestment advisors to make bad mistakes. It might havevery little to do with the financial status of a particularcompany. It is often concerned principally with theconfidence that investors feel regarding the future of thenation and its economy.
Stock promotion is often aimed at capturing theimagination of investors, who are told a story about thebig plans of a company. If the promotional campaign issuccessful, the price of a stock can be run up, sometimesquickly, even though the company might go bankrupt afew years later. If investors have been burned bypromotions too often, or if the promotion is notconvincing, the stock's price is unlikely to rise.
Several years ago I was busy at my desk when thetelephone rang. It was a broker friend who wanted to letme in on a great opportunity to buy some stock in anortheastern brewery. My reaction was: "Where is thegreat potential in a regional brewery?" I told my friendthat I would let him know if I decided to buy. Duringthe next few days I watched the stock's action on thefinancial pages and noticed that the price had droppedsharply.
"What happened to your beer stock?" I asked afew days later. "I see that it's down about fifteenpoints."
"Well," my friend replied, "that's quite a story. Itseems that the president of the brewery gave that bullishtale to one of our vice-presidents, then unloaded a bigblock of his own stock. I think we were taken."
A company's management can sponsor its stock inother ways as well; the most common is by issuingfavorable quarterly earnings reports, which, unlike theannual reports, are not audited.
Most investors who buy stock being sponsored orpromoted are afraid of missing the action, of passing upa budding Xerox or Syntex. The best approach is toavoid jumping in until you have evaluated the stockthoroughly. If it still looks good, your next problem isto determine when to buy it.
An Example of Sponsorship
In early 1974 there was an interesting example, shownon Chart 27, of sponsorship by a company's management.The company, Athlone Industries, is one of the largestmanufacturers of stainless-steel plate and a majordistributor of industrial fasteners. During the severesell-off of October-December 1973 Athlone declined to10. Starting in early January the stock's price climbedsteadily, reaching 24 in June 1974. This occurred duringa period of general weakness in the stock market, but

Athlone received a considerable amount of favorablepublicity during the period. On April 5,1974, the ValueLine Investment Survey ranked Athlone highest forprobable market performance during the next twelvemonths. At the time, the stock's price was fourteendollars, its yield was 6.6 percent, and the P/E ratio was3. Value Line included Athlone in a new industry group,"Specialty Steels." The evaluation of the SpecialitySteels stated that the outlook for stainless steel wasmore favorable than in many years.
On April 30,1974, Athlone announced that it hadrepurchased 132,000 of its common shares since thebeginning of the year. On May 31 the companyannounced that it had purchased 25,000 shares of itscommon stock for $468,750, bringing the company'spurchases that year to 157,000 shares. At the annualmeeting on May 17 the company chairman estimated1974 sales at $240,000,000 up from 1973 sales of$187,970,000. He estimated that net income per sharemight exceed $7.50 and could conceivably double1973's results.
During the 1974 period the company also placedadvertisements in the Wall Street Journal and was thesubject of a feature story in Forbes. Standard & Poor'sStock Reports on June 24, 1974, predicted a substantialearnings gain and stated that the shares were appraisedconservatively. Stay alert for sponsorship of this kind,where the fundamentals of a company appear to beexcellent, where the management is actively supportingthe stock, and respected advisory services recommendits purchase or retention.
Sponsorship by Institutional Investors
Purchases by institutional investors can also give strongsponsorship to stocks. The trick is to select stocks thatthey are buying or will buy, and to avoid stocks thatthey are selling or will sell. So it is often wise to avoid
CHART 27. ATHLONE INDUSTRIES
This is an example of an exceptionally strong stock thatmoved higher, against the downward trend of the vicious 1974bear market. Most stocks move with the primary trend. Athlonereceived strong sponsorship early in 1974 and had a very largeincrease in earnings.Chart by Securities Research Company
153
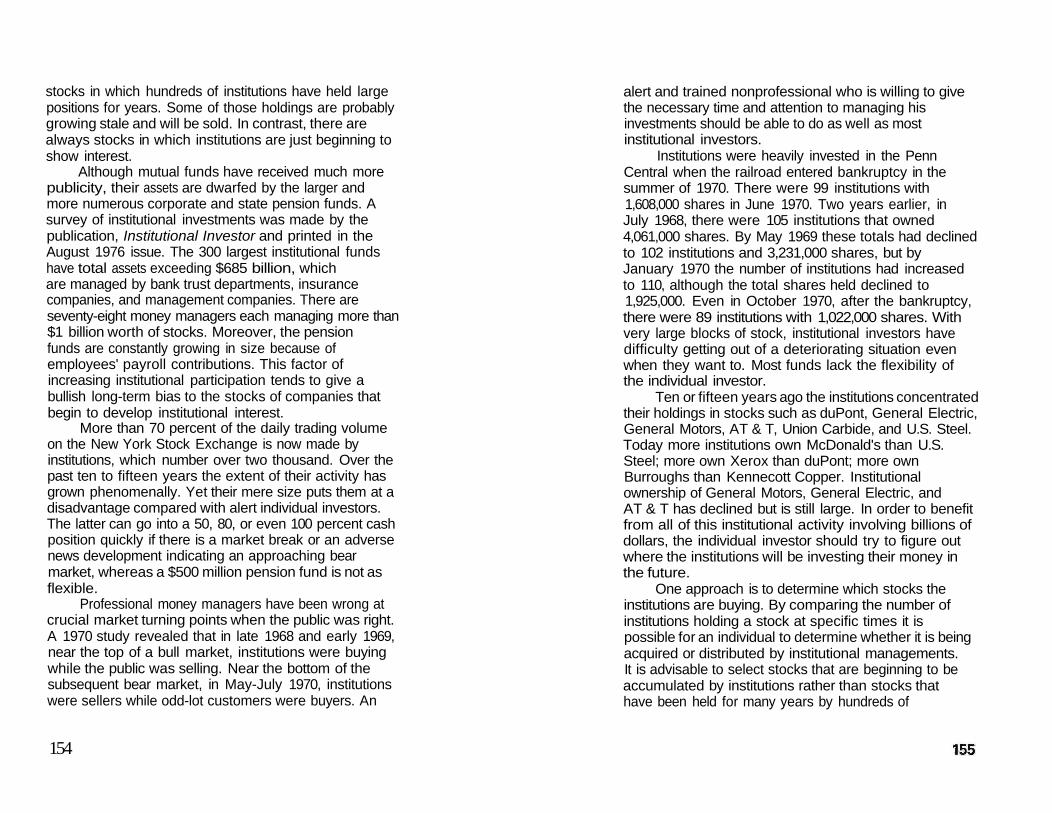
stocks in which hundreds of institutions have held largepositions for years. Some of those holdings are probablygrowing stale and will be sold. In contrast, there arealways stocks in which institutions are just beginning toshow interest.
Although mutual funds have received much morepublicity, their assets are dwarfed by the larger andmore numerous corporate and state pension funds. Asurvey of institutional investments was made by thepublication, Institutional Investor and printed in theAugust 1976 issue. The 300 largest institutional fundshave total assets exceeding $685 billion, whichare managed by bank trust departments, insurancecompanies, and management companies. There areseventy-eight money managers each managing more than$1 billion worth of stocks. Moreover, the pensionfunds are constantly growing in size because ofemployees' payroll contributions. This factor ofincreasing institutional participation tends to give abullish long-term bias to the stocks of companies thatbegin to develop institutional interest.
More than 70 percent of the daily trading volumeon the New York Stock Exchange is now made byinstitutions, which number over two thousand. Over thepast ten to fifteen years the extent of their activity hasgrown phenomenally. Yet their mere size puts them at adisadvantage compared with alert individual investors.The latter can go into a 50, 80, or even 100 percent cashposition quickly if there is a market break or an adversenews development indicating an approaching bearmarket, whereas a $500 million pension fund is not asflexible.
Professional money managers have been wrong atcrucial market turning points when the public was right.A 1970 study revealed that in late 1968 and early 1969,near the top of a bull market, institutions were buyingwhile the public was selling. Near the bottom of thesubsequent bear market, in May-July 1970, institutionswere sellers while odd-lot customers were buyers. An
154
alert and trained nonprofessional who is willing to givethe necessary time and attention to managing hisinvestments should be able to do as well as mostinstitutional investors.
Institutions were heavily invested in the PennCentral when the railroad entered bankruptcy in thesummer of 1970. There were 99 institutions with1,608,000 shares in June 1970. Two years earlier, inJuly 1968, there were 105 institutions that owned4,061,000 shares. By May 1969 these totals had declinedto 102 institutions and 3,231,000 shares, but byJanuary 1970 the number of institutions had increasedto 110, although the total shares held declined to1,925,000. Even in October 1970, after the bankruptcy,there were 89 institutions with 1,022,000 shares. Withvery large blocks of stock, institutional investors havedifficulty getting out of a deteriorating situation evenwhen they want to. Most funds lack the flexibility ofthe individual investor.
Ten or fifteen years ago the institutions concentratedtheir holdings in stocks such as duPont, General Electric,General Motors, AT & T, Union Carbide, and U.S. Steel.Today more institutions own McDonald's than U.S.Steel; more own Xerox than duPont; more ownBurroughs than Kennecott Copper. Institutionalownership of General Motors, General Electric, andAT & T has declined but is still large. In order to benefitfrom all of this institutional activity involving billions ofdollars, the individual investor should try to figure outwhere the institutions will be investing their money inthe future.
One approach is to determine which stocks theinstitutions are buying. By comparing the number ofinstitutions holding a stock at specific times it ispossible for an individual to determine whether it is beingacquired or distributed by institutional managements.It is advisable to select stocks that are beginning to beaccumulated by institutions rather than stocks thathave been held for many years by hundreds of

institutions; in the latter situation distribution of stockis as likely as additional purchases. Back in 1962 therewere 575 institutions that owned U.S. Steel commonstock; by the end of 1972 the number owning U.S. Steelhad declined to 63. The stock's performance duringthe period is shown in Chart 28. In contrast, Chart 29is of a stock that has been a favorite of institutionalinvestors during the past decade. At the beginning of1965, Burroughs stock was in the portfolios of 39institutions and had a P/E ratio of about 17. At the endof 1973 Burroughs was held by 316 institutions and itsP/E ratio was over 40. The Earnings line reveals that thecompany has had an earnings trend that generally hasbeen consistently rising, a feature that attractsinstitutional interest.
The institutional holdings of stocks are publishedon a monthly basis and it is not difficult for anindividual investor to determine if institutions areaccumulating or distributing the stock of a particularcompany. It is reassuring to an investor to know that astock he is about to purchase is being accumulatedsteadily by institutional investors. During weak marketstheir strong financial resources have tended to supportthe stocks in which they are interested.
Xerox, shown on Chart 30, is a stock that has hadstrong institutional sponsorship for about ten years. In1964, when Xerox split its stock 5 for 1, there werenewspaper stories saying that the action would permitincreased institutional participation. It is interesting tosee the extent of that participation since then, as shownin the following table. The information was derivedfrom Standard & Poor's monthly Stock Guide.
156
Table 6
Date
September 1963January 1964May 1965May 1966November 1966June 1967January 1968July 1968May 1969January 1970March 1970June 1970October 1970August 1972December 1973November 1974December 1975September 1976
Number of Institutions
8889
125213278314387450437488500504637485579647580575
The various periods listed are not precisely comparablesince the number of institutions surveyed varied. Inearlier years fewer institutions were surveyed than inmore recent periods.
It is more important to determine the trend ofinstitutional investment in a stock than to be concernedwith the number of institutions owning it. After a stockhas been in a portfolio for a long time and has notperformed as well as expected, investment managers, as
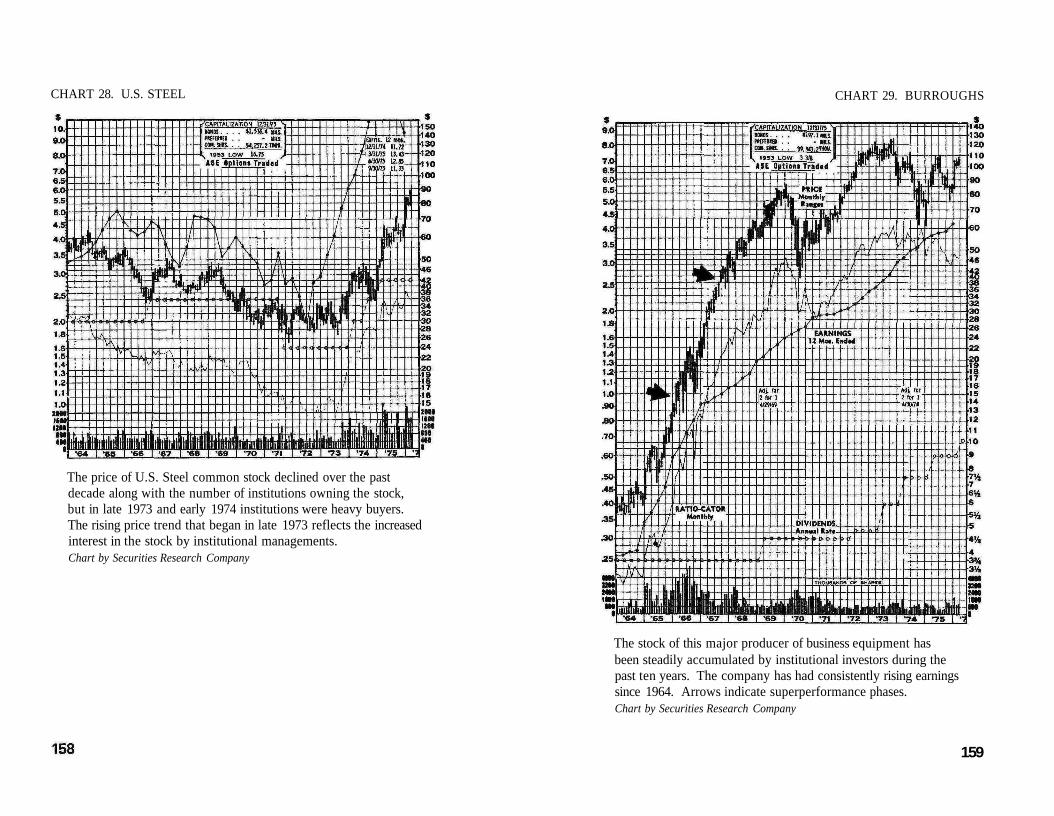
CHART 28. U.S. STEEL
The price of U.S. Steel common stock declined over the pastdecade along with the number of institutions owning the stock,but in late 1973 and early 1974 institutions were heavy buyers.The rising price trend that began in late 1973 reflects the increasedinterest in the stock by institutional managements.Chart by Securities Research Company
CHART 29. BURROUGHS
The stock of this major producer of business equipment hasbeen steadily accumulated by institutional investors during thepast ten years. The company has had consistently rising earningssince 1964. Arrows indicate superperformance phases.Chart by Securities Research Company
159
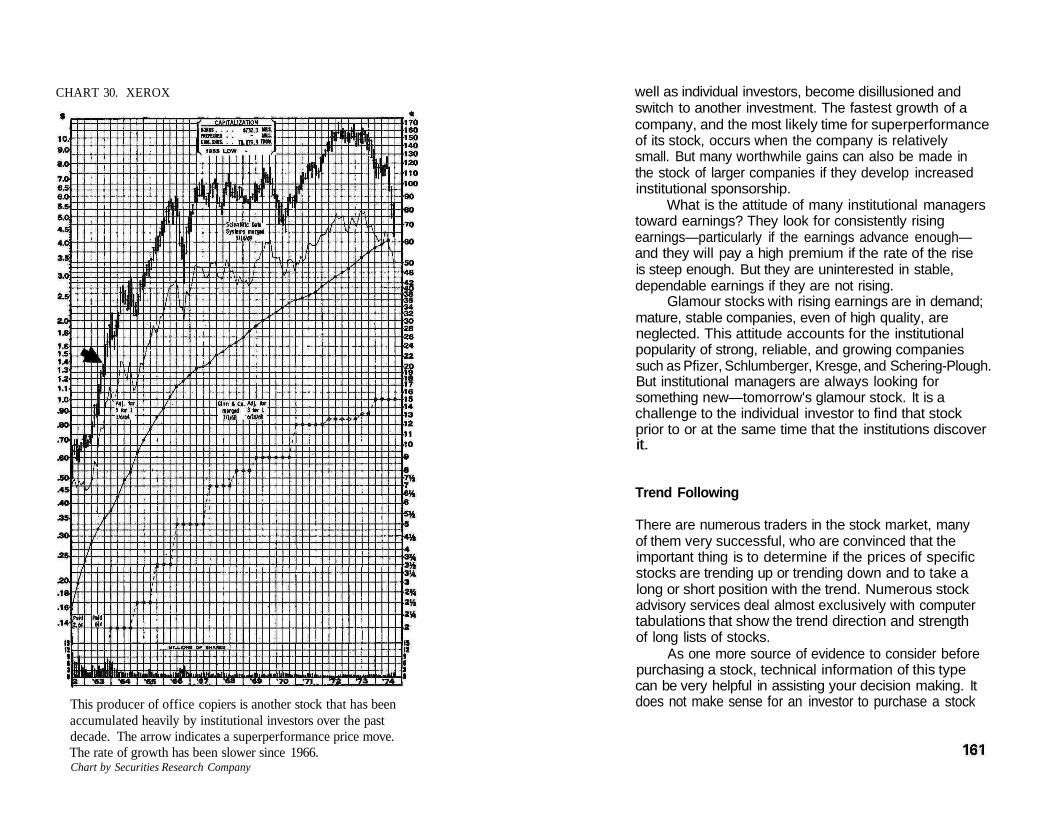
CHART 30. XEROX
This producer of office copiers is another stock that has beenaccumulated heavily by institutional investors over the pastdecade. The arrow indicates a superperformance price move.The rate of growth has been slower since 1966.Chart by Securities Research Company
well as individual investors, become disillusioned andswitch to another investment. The fastest growth of acompany, and the most likely time for superperformanceof its stock, occurs when the company is relativelysmall. But many worthwhile gains can also be made inthe stock of larger companies if they develop increasedinstitutional sponsorship.
What is the attitude of many institutional managerstoward earnings? They look for consistently risingearnings—particularly if the earnings advance enough—and they will pay a high premium if the rate of the riseis steep enough. But they are uninterested in stable,dependable earnings if they are not rising.
Glamour stocks with rising earnings are in demand;mature, stable companies, even of high quality, areneglected. This attitude accounts for the institutionalpopularity of strong, reliable, and growing companiessuch as Pfizer, Schlumberger, Kresge, and Schering-Plough.But institutional managers are always looking forsomething new—tomorrow's glamour stock. It is achallenge to the individual investor to find that stockprior to or at the same time that the institutions discoverit.
Trend Following
There are numerous traders in the stock market, manyof them very successful, who are convinced that theimportant thing is to determine if the prices of specificstocks are trending up or trending down and to take along or short position with the trend. Numerous stockadvisory services deal almost exclusively with computertabulations that show the trend direction and strengthof long lists of stocks.
As one more source of evidence to consider beforepurchasing a stock, technical information of this typecan be very helpful in assisting your decision making. Itdoes not make sense for an investor to purchase a stock

if its price is in a pronounced downtrend. There is nofinancial future in fighting the market. Look instead forstrong new uptrends.
There are, however, certain problems associatedwith trends. If you are considering purchasing a stockthat is in a price uptrend, you should be concerned withhow long the trend will continue. If the uptrend hasbeen in effect for a long period of time there might be anumber of stockholders, including performance-mindedfunds, who are planning to sell. Keep in mind that thesales volume normally peaks out before the price.Following a trend can be very rewarding if you buy thestock early and sell it when the uptrend is broken. Evenmore rewarding is the ability to anticipate trend changes.Be willing to take profits when a stock's price becomesunrealistically high.
Computerized trend information is of little or novalue when stocks are in the process of changing theirtrends. I have received computer printouts designatingstocks as buys on the basis of projected trends on thevery day that the stocks have sold off sharply andreversed trend. Moreover, at the best possible buypoint—at the very bottom of a bear market—trendstudies are of no help. So do not stray from the bigstrategic picture while engrossed in analyzing technicaldetails.
Spotting Trends
One of the quickest methods of selecting candidates forpurchase is to review sets of line charts. Look for stocksthat are beginning new uptrends with an increase in thesales volume. Then quickly learn all you can about thesestocks. Ask your broker for information. Check referencesources in your library. From your research you shouldbe able to determine almost everything you need toknow about each company in order to make anintelligent appraisal. You will learn many details of the
company's business, its capitalization, its incomestatistics for the past ten years, its present and past P/Eratios, the trend of the company's earnings, and thecompany's near-term and long-term prospects. Perhapsmost important, you will have a recommendation ortwo if the shares appear to have potential long-termappreciation.
It is important to determine the reason for a newuptrend. If it is caused by increased earnings, as manyare, the new trend will carry much farther based on, say,a doubling of reported earnings than in cases where theincrease was much smaller. To determine what triggeredthe action it might be necessary to obtain financialnewspapers for the day on which the strong new uptrendbegan. It might also be necessary to enlist the assistanceof your broker. When you have determined its cause youwill be in a better position to estimate how strong andenduring the new uptrend will be.
Although some stocks remain in strong uptrendsfor many years, most stock prices are much more erraticin their trends. Stocks often have personalities which arereflected in their long-term charts.
In summary, when you see stocks that are beginninguptrends on a line chart, you should follow up thisinformation by reviewing other material, including thepoints described in this book, and apply it to thatspecific stock.
The Sequence of Trend Following
The following sequence of events sometimes occurswhen a stock begins a new uptrend. A large purchaser,usually an institution, begins to accumulate the availablesupplies of stock for sale. Traders and trend followersdiscover the new activity in the stock and buy to bewhere the action is. This causes the sales volume toincrease and the price to continue rising. Many moretrend followers buy with the trend. Shares are being
162 163
purchased because someone else is buying the stock. Thecontinued rise becomes a phenomenon of masspsychology. Eventually some individualist, probably thefund manager who started the uptrend by buying thestock when it was depressed and unwanted, decides totake profits. He sells a large block. Other institutions,seeing the new weakness and afraid of losing their paperprofits, suddenly decide that they prefer cash too. Theshare price is knocked down and now a downtrendbegins. It is therefore important not to be late. Buywhen the new rising trend is in an early phase and sellwhen there is evidence that deterioration is beginning.
When you select a stock only on the basis of itstape action or chart action, you are buying it becausesomeone else thinks it is a good buy. If, on the otherhand, the fundamentals of the company also appear tobe bullish and if there is an earnings uptrend, anexpandable P/E ratio, and a large potential sales growth,then there is probably justification for the stockpurchase. But never become a slave of the computer;do not buy simply because the computer says "buy."No one has told the computer about the newsdevelopments and trend reversals that lie just ahead. Donot become overly optimistic; stay alert for possiblestock distributions and the resulting price reaction.
News, Publicity, and Stock Prices
News and publicity have a strong influence on stockprices, particularly when widely disseminated, as is thecase in the United States today with nationwidetelevision network news and nationally distributedmagazines and newspapers.
The type of news that often upsets investors is thatwhich makes the future uncertain. Investors areconcerned with the future, with anticipated events.Sudden, good, and unanticipated news can trigger wildbuying enthusiasm. Bad news, such as the 1962
164
Cuban missile crisis, often causes severe sell-offs.The constant repetition of news or a particular
viewpoint often appears to have greater influence than ifthe information is printed or broadcast a single time. In1963, when the newly developed birth control pills werebeing introduced, the flood of often repetitive stories innewspapers and magazines added tremendously to thefast, volatile run-ups in Syntex and, to a lesser extent, inSearle—the two companies that first introduced the pills.An investor who owns stock in a company that receivesfavorable widespread publicity is likely to benefitenormously from the quick run-up in the price of theshares.
Sometimes publicity can also lead an investor intoa trap, as with the notorious Penn Central case. Therailroad stock had received a considerable amount offavorable comment prior to the company's bankruptcyin the summer of 1970. One widely read financialwriter for a magazine enthusiastically described in hiscolumn the great future for the railroad, then sellingat 67 1/2. He stated that the nonrailroad assets of the$6.5 billion corporation constituted one of the largestreal estate enterprises in the world, and he went on tosay that the stock offered a most interesting combinationof huge assets and excellent management.
Another columnist, writing in a large metropolitannewspaper a few months prior to the railroad'sbankruptcy, interviewed a Penn Central director. Thecolumnist quoted the director, who is also a stockbroker,as saying that the Penn Central had the greatestprospects of any stock he knew about, and adding thathe did not know of any other stock that could go up inprice to five times its present value. He referred to areport on the company by his investment researchdepartment that referred to Penn Central's enormousassets per share of $124. The report estimated that thereal estate holdings alone were worth in excess of $50 ashare, and that transportation investments wereprobably worth at least $20 to $25 a share.
Publicity, then, favorable and unfavorable, can havea strong influence on the price of any company's stockby persuading investors to buy or to sell. Unfavorablepublicity can depress the stock's price; favorablepublicity can cause the price to rise. And news andpublicity not only play a role in the movement ofindividual stock prices, but are also very influential incausing the waves of optimism and pessimism that oftensweep through large numbers of investors. During theVietnam war periods of pessimism often alternated withperiods of optimism. When the Arab oil embargo wasimposed in 1973 the barrage of negative, repetitive newsand opinion broadcast by the national televisionnetworks and by other news media brought about notonly sell-offs in stocks directly affected by the embargobut also declines in stocks with little or no connectionto the problem.
On May 27, 1970, at the very bottom of a severebear market, with the Dow Jones industrials at 627,financial experts on both television and radio werequoted as expecting the averages to decline at leastanother 100 points. I wondered at the time how manyunthinking people acted on the opinions. Similaropinions, predicting additional severe declines, havebeen expressed on television near the bottoms of otherbear markets. Thus, the news networks are instrumentalin causing many investors to sell, often shortly before abear market hits bottom and stocks begin their rebound.Sometimes the reverse is true, of course, and thenational news discovers a bull market and gives itpublicity just as it is about to top out and start adecline. The best course for an individual investor is tobe very wary of financial news on the national televisionnetworks and in national news magazines. The result ofthe barrage of publicity, particularly in promoting bearmarkets by reiterating the reasons for impending disaster,is that impressionable persons become more and morefearful, so much so that frequently they sell theirsecurities near the bottom of a bear market.
Buy Stocks You Understand
There are some stocks that can be easily understood bymost investors, and there are stocks that even highlyqualified experts find difficult to understand. Theeasiest stocks to understand usually belong to companiesthat are relatively uncomplicated, such as a growingchain of motels or a business with a new product that iswell-protected by patents.
Stocks that are difficult to understand, such asmost electronics stocks, I tend to avoid. The electronicsindustry has had tough competition and a history ofcompany failures. However, quite a few years ago Ibecame interested in the stock of a small electronicscompany that manufactured a variety of componentsfor electronics systems. The stock had very strongsponsorship from a widely read technical market letterand also from a highly respected stock advisory service. Ipurchased the stock based on their recommendationsand on the fact that the stock was in a strong uptrend ona chart. In short, I was buying blindly on the basis ofsponsorship and an early uptrend. But the stock alwaysbothered me because I could not figure out the potentialmarket for its products, which were in competition withthose of bigger companies. So I sold the stock at a smallprofit after a few months. Eventually the stock's pricewent into a decline from which it has not recovered.
When it comes to evaluating high-technology stocksthe investor can have a problem. Most of us are notexperts in electronics, physics, or engineering. Moreover,estimating the profit potential of new products is oftencomplicated. High P/E ratios and erratic earnings trendsare features found in many of these stocks.
Another type of company that is difficult toanalyze is the conglomerate. Trying to determine thetrends in its various businesses can be very complicatedfor most investors. There is one conglomerate that is inthe following businesses: sulfur production, hearing aidsand instruments, boats, natural gas distribution,
166

antipollution devices, and real estate development. Howdoes an individual investor get insight regarding thefuture of a company like that? I have had some successby noting that the management was trying to raise theprice of the company's stock by increasing the earningsper share. This can be accomplished not only byincreasing earnings but by decreasing the number ofshares outstanding. The reduction is accomplished bytechniques such as offering to exchange debentures forcommon stock, or by having the company purchase itsown shares on the open market. Since conglomeratesoften acquire other companies by exchanging stock,their managements sometimes appear to be stronglymotivated to take steps that will increase the price ofthe common stock.
New information is significant if you have anunderstanding of the particular company or industrythat is affected. But without that understanding youwill not see the significance of new facts or developments.In order to see significance in news developmentsthat might relate to specific stocks, it is necessary tounderstand those stocks. For example, if you own thestock of a company engaged in home construction andyou read in the newspaper that the chairman of theFederal Reserve has indicated that the Fed is intent onreining in the nation's expansion of credit, you shouldbe able to see significance in that statement as it relatesto your company. So it is important that you buystocks that you understand.
All investors read the same financial and economicnews in newspapers, magazines, and investment advisoryservices. The difference between individuals is in theway they react to identical information. Some seesignificance and meaning; others do not.
168
Part IVWhen Should You Sell?

Chapter 12The Timing Rhythm
At some point a superperformance stock will cease to bea superperformance stock, as Chart 31 of WinnebagoIndustries dramatically reveals. Even IBM has had pricereactions as high as 50 percent. When it appears that asizable reaction is likely to occur, the prudent approachusually is to sell and then start searching for the nextopportunity to buy superperformance at depressedprices.
While safety of investment is derived from the goodtiming of the purchase, and performance is derived fromprice volatility, profits and the preservation of capitalare derived from the good timing of the sale. And timingthe sale is more difficult than timing the purchasebecause stocks reach their bear market lows simultaneously,but their bull market highs are attained independently.Following the stock averages and selling when theprimary trend turns down is often unsatisfactory, sincenumerous stocks reach their peaks prior to the peaks inthe averages. The price and volume trend for each stockmust be studied independently and action takenaccordingly.
Just as an investor should try to make purchaseswhen a stock is depressed in price, he should attempt tosell after a stock's price has surged. Just as stocks aretechnically strongest when the price has been depressedfor a long time and everyone who might sell has alreadysold, a stock is technically weakest after prices haverisen steadily for a considerable period of time; thenumber of investors who have paper profits and who aretempted to cash in rises as the stock's price rises.
One of the most effective methods used todetermine when to sell a stock is to follow its action ona chart daily. If the price begins to decline and breaks a
171
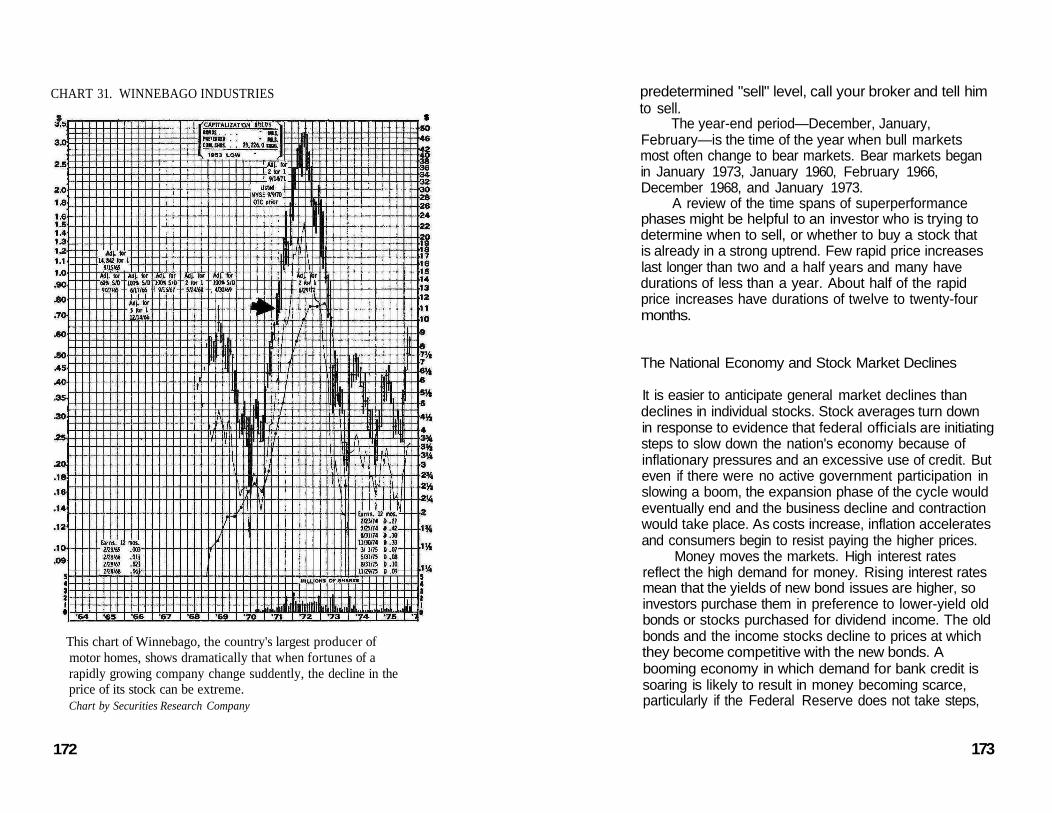
CHART 31. WINNEBAGO INDUSTRIES
This chart of Winnebago, the country's largest producer ofmotor homes, shows dramatically that when fortunes of arapidly growing company change suddently, the decline in theprice of its stock can be extreme.Chart by Securities Research Company
172
predetermined "sell" level, call your broker and tell himto sell.
The year-end period—December, January,February—is the time of the year when bull marketsmost often change to bear markets. Bear markets beganin January 1973, January 1960, February 1966,December 1968, and January 1973.
A review of the time spans of superperformancephases might be helpful to an investor who is trying todetermine when to sell, or whether to buy a stock thatis already in a strong uptrend. Few rapid price increaseslast longer than two and a half years and many havedurations of less than a year. About half of the rapidprice increases have durations of twelve to twenty-fourmonths.
The National Economy and Stock Market Declines
It is easier to anticipate general market declines thandeclines in individual stocks. Stock averages turn downin response to evidence that federal officials are initiatingsteps to slow down the nation's economy because ofinflationary pressures and an excessive use of credit. Buteven if there were no active government participation inslowing a boom, the expansion phase of the cycle wouldeventually end and the business decline and contractionwould take place. As costs increase, inflation acceleratesand consumers begin to resist paying the higher prices.
Money moves the markets. High interest ratesreflect the high demand for money. Rising interest ratesmean that the yields of new bond issues are higher, soinvestors purchase them in preference to lower-yield oldbonds or stocks purchased for dividend income. The oldbonds and the income stocks decline to prices at whichthey become competitive with the new bonds. Abooming economy in which demand for bank credit issoaring is likely to result in money becoming scarce,particularly if the Federal Reserve does not take steps,
173
which are inflationary, to compensate for the increaseddemand. The cost of money increases and stock pricesbecome depressed as money moves out of stocks andinto bonds.
Although the nation's economy is usually strongwhen presidential elections are held, business contractionsoften occur near the time of midterm congressionalelections. The business contractions that frequentlyoccur approximately midway through a presidentialterm are probably a principal reason why the politicalparty in control of the White House loses congressionalseats in midterm elections. Midterm congressionalelections were held in 1946, 1950, 1954, 1958, 1962,1966, 1970, and 1974. Economic recessions occurred in1945, 1949, 1953-54,1957-58, 1960-61, 1970, and1974-75. In 1966, moreover, there was a period of tightmoney and declining business which was not labeled anofficial recession. A comparison of these two lists revealsthat there is a close correlation between the years ofmidterm congressional elections and years in whichrecessions occurred.
Presidential Elections and the Stock Market
The four-year bull market-bear market pattern cannotbe guaranteed to continue in the future, but there is agood, specific reason for believing that it will. Thepolitical party that is in control of the White House andthe executive branch of the Federal Government isunderstandably reluctant to lose the office because ofvoter dissatisfaction with poor economic conditions inthe country, such as high unemployment, decliningbusiness profits, and falling stock prices. As a result,most recent presidential-election years have beenprosperous years and incumbent administrations willtry to make them prosperous in the future. But after theelection there is less concern for maintaining a high levelof prosperity and there is increased determination to
174
fight inflation, so anti-inflation measures are usuallytaken.
Individual investors should be aware of thisgovernment-related cyclical pattern or scenario in orderto plan the timing of purchases and sales moreeffectively. Presidential-election years are likely towitness a strong stock market, but a bear market is likelyto begin during the first two years following thepresidential election. By anticipating government fiscaland monetary policies you will be able to stay ahead ofthe technical evidence that most of the experts use as abasis for decisions.
The key factor determining whether or not stockprices will remain strong after a presidential election liesin the results of the election. If investors perceive that anew president is likely to start a new wave of inflationharmful to stock prices, they are likely to react byselling. In fact, stock prices can begin to turn weak evenprior to presidential elections if the investing publicbelieves that they know who the winner will be, andknow that his policy positions will be detrimental toinvestment in stocks.
The results of elections sometimes catch investorsby surprise, as in 1948 when Harry Truman defeatedThomas E. Dewey. The day after the election, stockprices dropped sharply and continued to decline formonths.
A general strategy for timing stock purchases andsales could consist of buying stocks during the bearmarket between presidential elections and selling stocksaround election time. The general strategy should bemodified whenever market conditions do not appear tobe following this theoretical pattern.
Although investors should plan purchases and saleswithin a general strategy that takes into account thefour-year political and stock-price cycles, they shouldalso be alert and willing to change their strategy ifimportant events or surprises occur. After all, if a majorwar breaks out, the entire scenario is radically changed.
175

It is a matter of being in tune with the times, of beingaware of the ebb and flow of national interest, money,and effort. Always be ready for the unexpected.
Watch Out for Surprises
Surprises are sudden, unexpected changes. The Cubanmissile crisis of 1962 and the Arab oil embargo of 1973were surprises. No one had advance information. Thestock market could not discount the event in advance.The professional has no advantage over the individualinvestor when a surprise news development occurs. Infact, he is at a decided disadvantage: Most individualscan sell their comparatively small holdings quickly, ifnecessary, but it is more difficult for a fund manager todispose of or even reduce his much larger portfolio.Surprises usually trigger a new price trend, so beprepared to take action quickly.
Because of the element of surprise, it can be riskyfor an investor ever to be excessively bullish or bearish.We live in an age when the Dow Jones industrialsfrequently move twenty points or more in a day. Volatilestocks often move ten points or more in a single session,and low-priced stocks sometimes gain or lose one-fourthor one-third of their value. Bad news that comes as asurprise results in a sharp stock market sell-off. Thesurprise war in the Middle East and resulting Arab oilembargo caused a two-hundred-point drop in the DowJones industrials in just twenty-eight trading sessions, orin slightly over a month, which was one of the sharpestsell-offs on record. The average loss per day of the DowJones industrials was over .7 percent—almost the samerate of decline that occurred in 1929 over sixty-fivetrading sessions. Individual stocks declined even moresharply. An example of a stock that sold off verysharply on the surprise news is shown on Chart 32,Outboard Marine.
Looking ahead, investors should consider how their
176
CHART 32. OUTBOARD MARINE
The surprise energy crisis affected some stocks much moreseverely than others. Outboard Marine, the nation's largestproducer of outboard motors, was especially hard hit by thesudden development in early October 1973.Chart by Securities Research Company
177
stocks will react if Congress modified tax laws to treatcapital gains as regular income. By anticipating possiblefuture events and taking precautionary action before theevents occur, the element of surprise is reduced andstock market losses may possibly be minimized oraverted.
To Hold or to Sell?
There are some individuals who hold on to their stocksindefinitely. It was estimated recently that many billionsof dollars' worth of stocks are held by investors whoconsider themselves to be locked in because they do notwant to pay taxes on their capital gains. In some casesthe profits simply disappear.
My review of the price action following the 5891962-1974 superperformance price moves revealed thatonly 85 of the price moves ended without a severe pricereaction of 10 percent or more, and that 198 of the bullmoves were eventually canceled by declines as large as orlarger than the superperformance price move.
If he is to be successful in the stock market theindividual investor must not be late in carrying outbuying and selling decisions. Buying good stocks at thewrong time causes problems for more investors thanpurchases of hopelessly poor stocks. Likewise, it isobviously a mistake to delay selling in a market that hasturned bearish. There are times when it is good policy tosell a stock simply because it has stopped going up. Butthis decision has to be made by studying the specificstock, its price and earnings history, its potential, andnumerous other factors. Once the decision has beenmade to sell, do not delay. The bottom can sometimesbe a long way down, as is revealed by some of the chartsin this book. Some stocks never come back, and forthose that do return to former price levels, the waitingperiod can sometimes be long.
Often investors continue to hold a stock after it has
178
had a substantial run-up in price. Sometimes it is helpfulin determining whether you should continue holding astock to ask yourself if you would be willing to buy thestock now, after the price run-up. If the answer is no,why expect someone else to buy it? A stock that showssigns of deterioration or appears to be overpriced shouldbe sold.
When purchasing a stock investors usually considerthe risk involved versus the profit potential, oftenreferred to as the risk/reward ratio. But after they haveowned a stock for a few years, many investors ceaseevaluating it. Usually this is the time that the risk ofpotential loss should be considered, for the reasonsjustifying the stock's purchase may no longer be valid.
Be Alert to Federal Policy Switches
Just as the Federal Reserve System can encourage thestock market by loosening credit and stimulatingspending in the national economy, the Federal Reservecan also depress bull markets by restricting the supply ofcredit, inhibiting spending. Not all bull markets endbecause of U.S. Government monetary and fiscal policies,however. Prices in the 1961 bull market apparentlyreached such high levels that they could not go any higher,because the prices of many stocks were discountingdevelopments too many years in the future. When theyreach price levels that are unrelated to tangibles such asearnings, prices fall even if there is no depressing influencesuch as a threatened recession. Evidently there are enoughinvestors who, realizing that prices are out of linecompared with traditional values, decide to take profits.The market in general is too high when adverse newstriggers a psychological reaction that results in high-volumeselling. If bad news occurs when the market is relativelylow, the reaction is usually not as severe. In other words,the stock market is too high when investors perceive itto be too high, and the market is not too high if
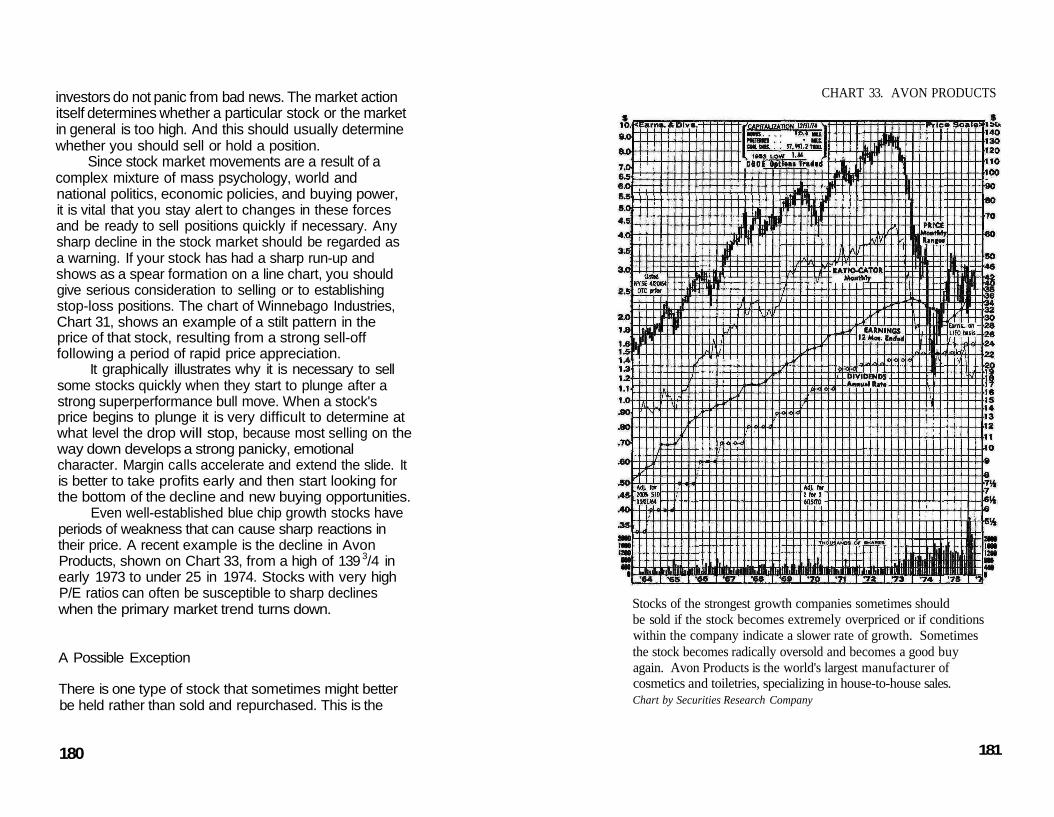
investors do not panic from bad news. The market actionitself determines whether a particular stock or the marketin general is too high. And this should usually determinewhether you should sell or hold a position.
Since stock market movements are a result of acomplex mixture of mass psychology, world andnational politics, economic policies, and buying power,it is vital that you stay alert to changes in these forcesand be ready to sell positions quickly if necessary. Anysharp decline in the stock market should be regarded asa warning. If your stock has had a sharp run-up andshows as a spear formation on a line chart, you shouldgive serious consideration to selling or to establishingstop-loss positions. The chart of Winnebago Industries,Chart 31, shows an example of a stilt pattern in theprice of that stock, resulting from a strong sell-offfollowing a period of rapid price appreciation.
It graphically illustrates why it is necessary to sellsome stocks quickly when they start to plunge after astrong superperformance bull move. When a stock'sprice begins to plunge it is very difficult to determine atwhat level the drop will stop, because most selling on theway down develops a strong panicky, emotionalcharacter. Margin calls accelerate and extend the slide. Itis better to take profits early and then start looking forthe bottom of the decline and new buying opportunities.
Even well-established blue chip growth stocks haveperiods of weakness that can cause sharp reactions intheir price. A recent example is the decline in AvonProducts, shown on Chart 33, from a high of 139 3/4 inearly 1973 to under 25 in 1974. Stocks with very highP/E ratios can often be susceptible to sharp declineswhen the primary market trend turns down.
A Possible Exception
There is one type of stock that sometimes might betterbe held rather than sold and repurchased. This is the
180
CHART 33. AVON PRODUCTS
Stocks of the strongest growth companies sometimes shouldbe sold if the stock becomes extremely overpriced or if conditionswithin the company indicate a slower rate of growth. Sometimesthe stock becomes radically oversold and becomes a good buyagain. Avon Products is the world's largest manufacturer ofcosmetics and toiletries, specializing in house-to-house sales.Chart by Securities Research Company
181

stock of a budding growth company that has not had aprice run-up. Typically, it might be a small companythat is beginning to market a unique new product butwhose stock price has not increased substantially.Examples are Xerox and Syntex when they were in theirvery early stages and had not started to benefit, in termsof stock price, from their vast growth potential.
The Pricing Rhythm
Not only is there a timing rhythm to stock prices, butalso a pricing rhythm. Stock prices move through stages,as can be readily seen on some of the charts in this book.The sequence of action consists of, first, the establishmentof a base, formed sometimes over a period of years.Gradually the price begins to rise, then accelerates intoan upswing stage with the price consistently advancing.The upswing stage is gradually replaced by a stage duringwhich the price stops advancing, but moves irregularlysideways. This stage is the top, and professionals oftenrefer to a stock as looking "toppy." Stocks in this stageof price movement should be sold, for the fourth andlast stage is the downtrend. The declines in many stocksretrace their entire advancing stage, as was indicated inChapter 7. Eventually the price of the stock declines toa new base, and it might remain at that level for years.
The stages of base, upswing, top, and decline oftenresult from patterns of accumulation and distribution byprofessionals, who accumulate stock when it is in a baseand sell when the price has advanced. Their buyingactivity often triggers interest in the stock by technicalanalysts and investors, who watch computer printoutsand charts to learn what "big money" is doing. After aprice advance has occurred and the public has becomeinterested in the stock, the professionals begin to sell, or"distribute." The price ceases to advance, but tradingvolume can be heavy. The third stage, the "top," hasbeen reached. The professionals have sold their stock
182
and there is no longer any motive for supporting themarket. As the price starts to decline the public beginsto sell, accelerating the decline. Eventually the pricereaches a new base, at which level the process ofaccumulation begins again.
It is therefore desirable to buy stock just as anupswing is beginning and to sell after the price hasstopped advancing. It is very important not to be latebuying and not to be late selling. In this Wall Streetversion of musical chairs anyone who is caught owningstock when the music stops is a dunce.
A Big Problem for Investors: The Stock ExchangeSpecialists
Defenders of the use of specialists by the exchangescontend that they support stocks from declines. Thisargument is obviously phony. Where was the support in1974 during the biggest price decline since 1929? Wherewas their support of Avon Products, which droppedfrom 140 to under 20? Where did the specialists supportPolaroid—at 14 Vs after it had plunged from 143 1/4?Specialists and stock exchange insiders are more likelyto be the cause of sharp declines. Most investors wouldbe better off without help from the friendly stockexchange specialist. They would prefer to keep theirshares of those big trading profits in their own pockets.
An ideal time for individual investors to sell stockis therefore before the stock exchange insiders begin toknock prices down with their heavy short selling. Butthe advantage is all with the exchange specialist andhis buddies on the trading floor. Their books of buyand sell orders tell them the magnitude of the buyingand selling pressures, so they know precisely when tobegin selling short. The individual investor does nothave this advantage. But after a stock has had asharp price run-up, a protective stop-loss order can beentered a few points lower. If the stock is bombed
183
by large-block short Sailing the position- will be soldautomatically.
How Specialists Operate
Since stock exchange specialists and insiders have a veryimportant influence on the direction of stock prices, itmight be helpful to analyze the actions that they shouldtake in order to maximize their own profits. Near thebottom of a bear market they accumulate stock inpreparation for the approaching rising market. As stockprices rise the insiders are sellers, taking profits onpositions they had accumulated at lower prices. Asprices continue to rise they become short sellers, havingdistributed their supply. Their self-interest then dictateslower prices, which are brought about by timely shortselling to drive prices down.
The actions of the exchange specialists illustrate atechnique that individual investors should learn—that is,to buy stocks when they are quiet, inactive, and depressed,and to sell stocks when the demand for them is strongand prices are surging on high volume. The precise timeto sell is when the price and volume surge is ending.
Movements involving price run-ups and shakeoutsfollowing heavy short selling are price cycles ofshort-term or intermediate-term duration that occurwithin the longer-term four-year cycles brought aboutby presidential, congressional, or Federal Reserve Boardpolicies related to the four-year political cycle.
Declines in stock prices do not always occurbecause stockholders have decided to sell. Often theprice decline results from short selling by hedge funds,stock exchange specialists, or other big traders. The1973 Securities and Exchange Commission complaintagainst Avis revealed that one hedge fund had sold short25,400 shares of Avis stock, and that the short seller hadbeen given access to information that had not beendisclosed to the public. When a speculator sells stock
184
short, he sells borrowed stock and assumes that priceswill decline so that the borrowed stock can be coveredlater by purchasing the shares at a lower price. The priceof Avis shares declined from $33.50 on May 16 to under$21 dollars on June 6, 1973, when Avis confirmed theprofits from vehicle sales in the company's earnings.
When there are negative news developments orother evidence that a stock should be sold, the publicstockholders are often much slower in learning of thedevelopments and in taking action than are theprofessional traders who stay close to the action on thestock exchange floor. When there is a surprise developmentindicating that stocks or a stock should be sold, thetraders usually manage to sell short or dispose of theirholdings before the public has that opportunity.
Do Call Options Depress Stock Prices?
Call options on about 150 stocks are sold on the ChicagoBoard Options Exchange, the American Stock Exchange,the Pacific Exchange, and the Philadelphia Exchange. Acall option is a right permitting the buyer to purchase astated number of shares of stock at a specific pricewithin a limited time period, usually up to six months.The big disadvantage of such an option is the limitedtime period in which it can be exercised.
Since it is the public that buys options, hoping fora price rise, the sellers are usually professionals. It is notin the interest of professionals to permit a rise in theprice of the stock, so stocks with options are probablydepressed in price more than they would be if calloptions were not traded against them.
Remember the Political Cycle
Individual investors dance to tunes played by Wall Streetinsiders and big institutional investors. But the music is

arranged in Washington. There will continue to bepolitical cycles and business cycles. As a result, there willcontinue to be widely—and wildly—swinging stock pricesas Wall Street insiders try to grab large profits and thepublic sells in an emotional panic or buys in anemotional euphoria. And in the widely swinging stockmarkets there will always be superperformance stocks.
A new primary bear market is most likely to startduring the period of about fifteen months from the dateof presidential elections through the entire firstpostelection year until the following February. Everyprimary bear market of the past fifty years, except1960, has started during that fifteen-month period. Ifthe nation's economy is undergoing a severe inflationaryboom when the election is held, measures will be takento slow the boom and to reduce inflation within a fewmonths following the election; this occurred followingthe presidential elections of 1937, 1952, 1956, 1968,and 1972. But if the economy is not overinflated, therestrictive policies might be delayed for as much as ayear. Following the 1964 presidential election,restrictive actions were not taken until late 1965, abouta year afterward.
From the point of view of an incumbent presidentwho wants the nation's economy to be booming at thetime of his campaign for re-election, a bear market instocks and a recession might occur too soon if restrictivemonetary policies are taken immediately after hiselection. For if the bear market and recession begin andend too soon, it would mean that the next bull marketin stocks and a booming economy would also occur toosoon and they might start another decline before thenext election. This is exactly what happened between1956 and 1960.
Presidential-election year 1956 was a boom yearwith a strong economy and rising prices. But after theelection President Eisenhower expressed fear about therate of inflation. The Federal Reserve Board began apolicy to restrict credit. The result was the 1957-58
recession. Employment reached a peak in mid-1957 andbegan to decline sharply.
But the stock market turned strong in early 1958,during the depths of the recession, and remained strongfor the rest of that year and through 1959. The economyalso turned strong. By the time presidential-election year1960 arrived, however, the economy and stock markethad started to decline again, an undesirable prospectfrom the point of view of an incumbent political party.
A similar pattern happened in 1968, as PresidentJohnson and his economic advisers desperately tried tokeep the nation's economy booming until election daythat year. But shortly after the election he advocatedslowing down the economy because of the threat ofaccelerating inflation.
Declines in Individual Stocks vs. Declines in the StockMarket
Stocks decline for a variety of reasons related to eachspecific company and its future prospects. Sometimesearnings are expected to decline and sometimes thestock is simply overpriced.
The stock market, on the other hand, as representedby market averages that include many companies,declines most often because of Federal Governmentpolicies such as increasing income taxes, which causescompany profits to decline. But the government policymost often used has been to increase the cost of creditand decrease its availability, which is effective in slowingdown business activity. Other reasons for declinesinclude the overpricing of numerous stocks, as in late1961 and late 1968, and widespread investor pessimism,as during the period between 1946 and 1949.
Declines can also be triggered by heavy shortselling. This has occurred most often, however, prior tointermediate declines within a primary bull market, asprofessionals try to drive prices down to levels at which
187

they can cover short sales and re-establish long positions.They are successful because many stockholders arefrightened into believing that the price of their stockwill decline even further, and therefore decide to sell.
Bear markets can also occur because of the collapseof a pyramid of credit, as happened in 1929. Today'sregulations covering credit for stock purchases shouldprevent widespread forced selling as occurred in thatdebacle.
Watch for the Warning Signals
The main warning signals for an individual investor tolook for, therefore, are the signs of a government-inducedslowdown in business activity, which would affectcompany profits and stock prices.
To find the warning signals it is important tofollow the financial news closely, paying particularattention to statements from Federal Reserve Boardmembers and from Administration leaders andeconomists. But it is also necessary to anticipateeconomic and political conditions several months ahead.If inflation is becoming a bigger problem, expect thatsteps will be taken to slow it.
Two key indicators to watch for sell signals are thediscount rate, which is set by the Federal Reserve Board,and the interest-sensitive utilities averages. Changes in thediscount rate often signal the Fed's intentions to expandor contract the money supply. A rising utilities averageis favorable, but be cautious if it has turned down. Acomparison of the Dow Jones utility and industrialaverages reveals that the utility average began to declinebefore the industrial average in four of the last six bearmarkets.
Successful stock market investments are morelikely to result from the use of a logical strategy forbuying and selling than from a random approach orfrom the "one decision" method that has been widely
188
accepted by many institutional investors and individuals.The one-decision approach ignores the extreme pricevolatility that occurs regularly as stock prices move inwaves of strength and weakness. The one-decisionpurchase of Polaroid by institutional investors mighthave appeared sound in 1971 or 1972, when the stockwas selling above $140 a share, but the weakness of theapproach was apparent when Polaroid declined tounder 20 in 1974. There have been hundreds of similarcases.
To be successful it is necessary to buy the rightstock at the right time and to sell it at the right time.You should think like a speculator, but instead ofbuying today and selling next week, think of buyingand selling in terms of the four-year cycles in stockprices. Plan to sell stocks during presidential-electionyears, when there is very likely to be a strong stockmarket based on a prosperous economy resulting fromexpansionist federal fiscal and monetary policies. Planto purchase stocks close to the bottom of the bearmarket that occurs regularly during the period betweenpresidential elections. To do this you must followfinancial developments very closely in order to determinewhen the Federal Reserve Board has changed from apolicy of monetary firmness to a policy of monetaryease. Moreover, you must be aware of the shift in thepsychological attitude of investors from extremepessimism to optimism.
Investors who are fully invested must sell stockand take profits in order to have sufficient fundsavailable to buy attractive situations after the nextsell-off. This is the way fortunes are made in the stockmarket. You must sell stocks when prices are high inorder to have the money to buy attractive stocks whentheir prices are way down. So do not overstay a bullmarket. Knowing when to sell your stocks is one of thesecrets of success. Regardless of what you, the individualinvestor, wish to do, stock prices will continue to havebear cycles and bull cycles reflecting business conditions
and anticipated business conditions, tight money andplentiful money, increasing earnings and decreasingearnings, booms and recessions. For survival, anticipate.Always stay one jump ahead.
Chapter 13Selling Short
I recall the evening of the 1968 presidential election,when Richard Nixon defeated Hubert Humphrey in aclose vote, not so much because of the details of theelection but because of my own activities that evening.As the election returns were being reported, I wasseated at a table studying stock charts and companyfundamentals. The result of my research was a long listof stocks that I considered to be candidates for shortsales. This was the time, I had decided, to sell stocks,without regard to which politician won the election.
The year 1968 experienced a wave of fear-of-inflation psychology. Stock market letters advisedreaders to "buy stocks now before it is too late." Manystocks were extremely overpriced, but I was convincedthat they were also about to be deflated. They were. Afew weeks after the 1968 presidential election theFederal Reserve Board adopted policies of increasedmonetary restraint. The stock market averages reachedtheir peaks in December and the long descent began tothe May 1970 bear market lows.
Profits in the stock market can usually be madefaster by selling stocks short than by buying them. Thereason is that price declines are usually much steeperthan price rises, which occur more gradually, over alonger period of time, and are usually accompanied by ahealthy amount of pessimism that gradually lessens thelonger the price rise continues. Price declines, on theother hand, contain an element of panic that increases asstock prices plunge lower.
A short sale is the sale of borrowed stock, which isarranged for a customer through his stockbroker. Aprofit or loss is realized when the short sale is covered bya purchase. The short interest—the number of shares that
191

have been sold short and not covered by purchases—ispublished for New York and American Stock Exchangestocks about the twentieth of each month. The figuresare listed in the Wall Street Journal, The New YorkTimes, Barren's, and other newspapers.
"Bulls" in the stock market are many times morenumerous than "bears." Comparatively few people sellstock short when they expect a decline in prices. A highpercentage of short selling is done by the stock exchangespecialists on the trading floor. Yet during about oneand a half years of each price cycle the primary trendof the stock market is down. In recent years theopportunities for making money fast by selling short inbear markets have been more numerous than theopportunities for rapid capital appreciation in bullmarkets. During the bear markets that reached theirclimaxes in 1970 and 1974 there were thousands ofstocks which declined to a fraction of their formerlevels.
One reason for the much smaller number of shortsellers is that comparatively little information orassistance is available on the subject. Brokers are orientedtoward furnishing information and recommendations forbuying stocks, not for selling or short selling.
Timing a Short Sale
The timing of the short sale is of crucial importance. Ifa stock with a highly volatile price history is sold shortat the wrong time, the result could be some quick andsizable losses. Therefore, ask yourself certain questionsbefore you venture to sell a stock short. The questionsshould include: What stage are we in of the political,business, and stock-price cycles? Are we near the top ofa bull market? Which stocks are leading candidates forshort sales when prices start to decline? It is importantto recognize the end of a bull market and the beginningof a bear market because it is during that transition
192
period that the best opportunities occur for profitableshort selling.
The time to sell short is not necessarily identicalwith the time to take profits in long positions. Stocks do:not all reach their final bull market tops at the sametime. Moreover, the stock market averages usually forma top which on charts is shown as a broad, trendlesspattern often lasting for months, in contrast with stockmarket bottoms, which are sharp "V" patterns.
In addition, stocks selected for short selling are notlikely to be the same stocks that were owned whenmarket prices were rising. Therefore, the action sequenceis likely to be to sell stocks that have been owned, waitfor the market's primary trend to turn down, then selectcandidates for short sales. When an investor sells a stockthat he has owned for a couple of years and in which hehas a sizable profit, he should try to sell out at a pricenear the top, but the exact highs are much more difficultto predict than are the exact lows at the bottom of abear market. Usually the most that can be expected isto be able to sell the stock in its high range during thelast phase of the bull market.
The safest time to establish short sales, on theother hand, is after stock prices have started to declineand investor psychology is beginning to change frombullish to bearish.
The Ideal Time to Sell Short
How would the stock market be acting when conditionsare ideal for selling short? Under ideal short-sellingconditions the Dow Jones industrial averages would bestarting to decline after making new highs. Fewerindividual stocks would be making new highs. During thebull market that peaked in January 1973 for the stockaverages, numerous stocks started price declines earlier.Some examples shown in this book are Skyline (Chart 9),Holiday Inns (Chart 14), and Winnebago (Chart 31).
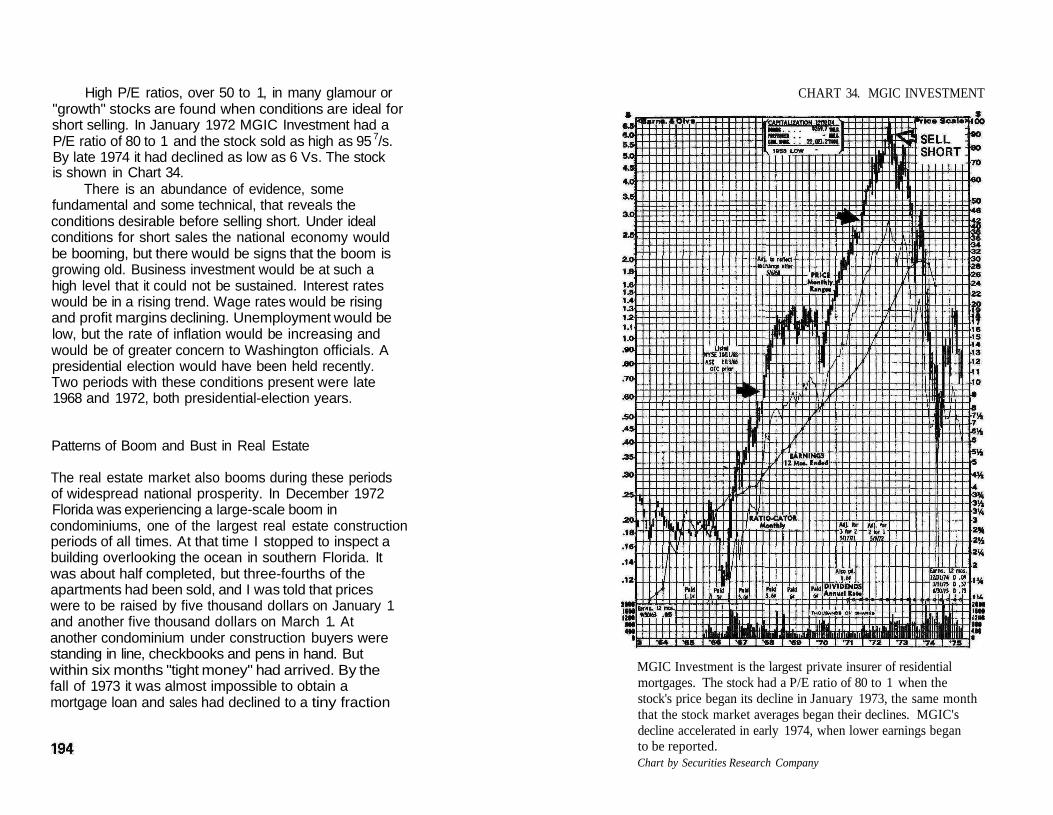
High P/E ratios, over 50 to 1, in many glamour or"growth" stocks are found when conditions are ideal forshort selling. In January 1972 MGIC Investment had aP/E ratio of 80 to 1 and the stock sold as high as 95 7/s.By late 1974 it had declined as low as 6 Vs. The stockis shown in Chart 34.
There is an abundance of evidence, somefundamental and some technical, that reveals theconditions desirable before selling short. Under idealconditions for short sales the national economy wouldbe booming, but there would be signs that the boom isgrowing old. Business investment would be at such ahigh level that it could not be sustained. Interest rateswould be in a rising trend. Wage rates would be risingand profit margins declining. Unemployment would below, but the rate of inflation would be increasing andwould be of greater concern to Washington officials. Apresidential election would have been held recently.Two periods with these conditions present were late1968 and 1972, both presidential-election years.
Patterns of Boom and Bust in Real Estate
The real estate market also booms during these periodsof widespread national prosperity. In December 1972Florida was experiencing a large-scale boom incondominiums, one of the largest real estate constructionperiods of all times. At that time I stopped to inspect abuilding overlooking the ocean in southern Florida. Itwas about half completed, but three-fourths of theapartments had been sold, and I was told that priceswere to be raised by five thousand dollars on January 1and another five thousand dollars on March 1. Atanother condominium under construction buyers werestanding in line, checkbooks and pens in hand. Butwithin six months "tight money" had arrived. By thefall of 1973 it was almost impossible to obtain amortgage loan and sales had declined to a tiny fraction
CHART 34. MGIC INVESTMENT
MGIC Investment is the largest private insurer of residentialmortgages. The stock had a P/E ratio of 80 to 1 when thestock's price began its decline in January 1973, the same monththat the stock market averages began their declines. MGIC'sdecline accelerated in early 1974, when lower earnings beganto be reported.Chart by Securities Research Company
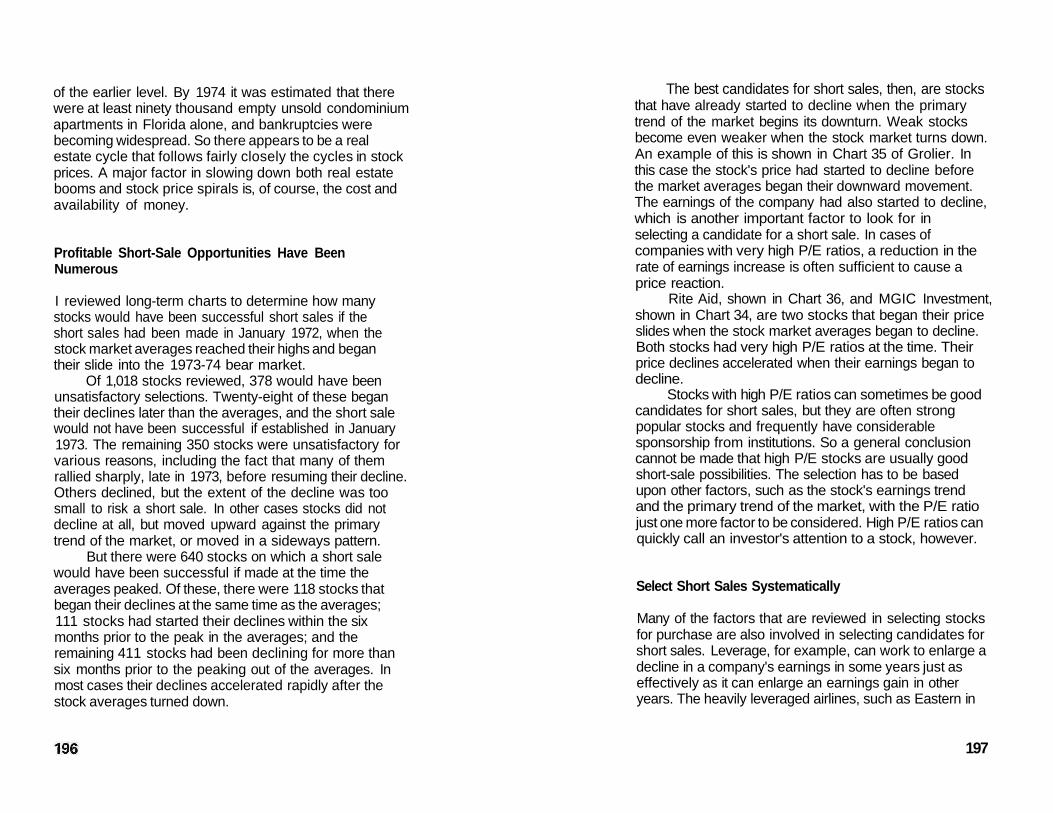
of the earlier level. By 1974 it was estimated that therewere at least ninety thousand empty unsold condominiumapartments in Florida alone, and bankruptcies werebecoming widespread. So there appears to be a realestate cycle that follows fairly closely the cycles in stockprices. A major factor in slowing down both real estatebooms and stock price spirals is, of course, the cost andavailability of money.
Profitable Short-Sale Opportunities Have BeenNumerous
I reviewed long-term charts to determine how manystocks would have been successful short sales if theshort sales had been made in January 1972, when thestock market averages reached their highs and begantheir slide into the 1973-74 bear market.
Of 1,018 stocks reviewed, 378 would have beenunsatisfactory selections. Twenty-eight of these begantheir declines later than the averages, and the short salewould not have been successful if established in January1973. The remaining 350 stocks were unsatisfactory forvarious reasons, including the fact that many of themrallied sharply, late in 1973, before resuming their decline.Others declined, but the extent of the decline was toosmall to risk a short sale. In other cases stocks did notdecline at all, but moved upward against the primarytrend of the market, or moved in a sideways pattern.
But there were 640 stocks on which a short salewould have been successful if made at the time theaverages peaked. Of these, there were 118 stocks thatbegan their declines at the same time as the averages;111 stocks had started their declines within the sixmonths prior to the peak in the averages; and theremaining 411 stocks had been declining for more thansix months prior to the peaking out of the averages. Inmost cases their declines accelerated rapidly after thestock averages turned down.
The best candidates for short sales, then, are stocksthat have already started to decline when the primarytrend of the market begins its downturn. Weak stocksbecome even weaker when the stock market turns down.An example of this is shown in Chart 35 of Grolier. Inthis case the stock's price had started to decline beforethe market averages began their downward movement.The earnings of the company had also started to decline,which is another important factor to look for inselecting a candidate for a short sale. In cases ofcompanies with very high P/E ratios, a reduction in therate of earnings increase is often sufficient to cause aprice reaction.
Rite Aid, shown in Chart 36, and MGIC Investment,shown in Chart 34, are two stocks that began their priceslides when the stock market averages began to decline.Both stocks had very high P/E ratios at the time. Theirprice declines accelerated when their earnings began todecline.
Stocks with high P/E ratios can sometimes be goodcandidates for short sales, but they are often strongpopular stocks and frequently have considerablesponsorship from institutions. So a general conclusioncannot be made that high P/E stocks are usually goodshort-sale possibilities. The selection has to be basedupon other factors, such as the stock's earnings trendand the primary trend of the market, with the P/E ratiojust one more factor to be considered. High P/E ratios canquickly call an investor's attention to a stock, however.
Select Short Sales Systematically
Many of the factors that are reviewed in selecting stocksfor purchase are also involved in selecting candidates forshort sales. Leverage, for example, can work to enlarge adecline in a company's earnings in some years just aseffectively as it can enlarge an earnings gain in otheryears. The heavily leveraged airlines, such as Eastern in
197
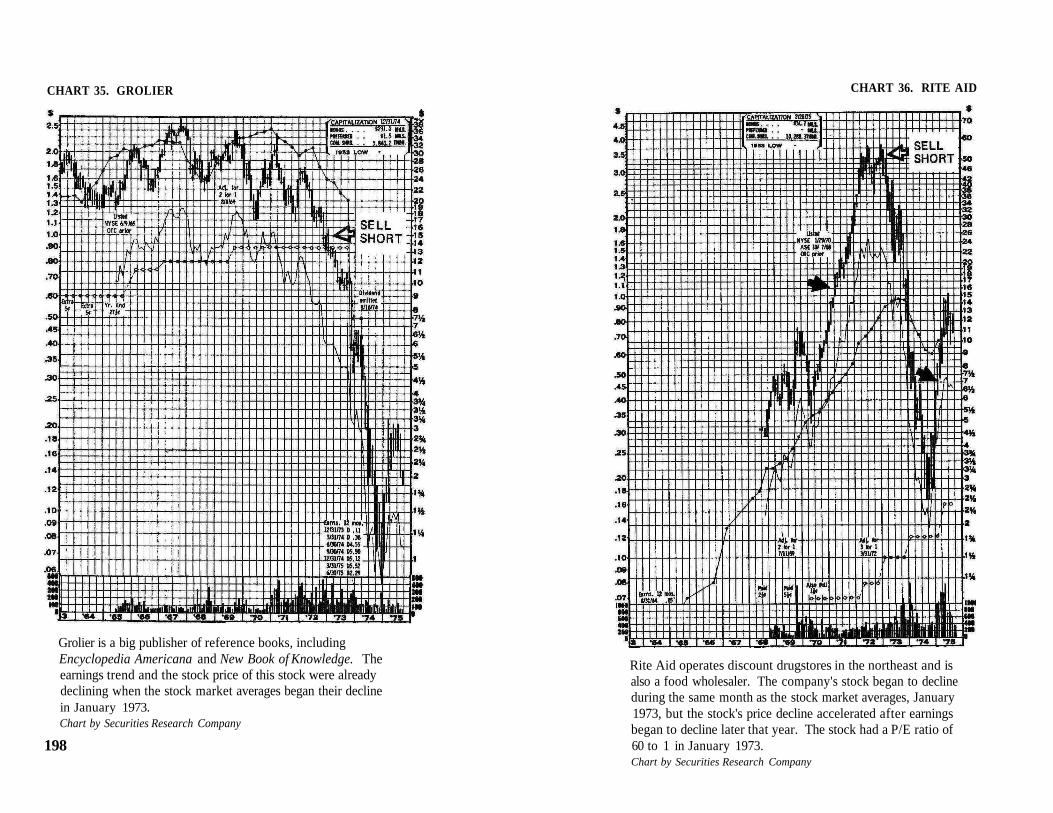
CHART 35. GROLIER
Grolier is a big publisher of reference books, includingEncyclopedia Americana and New Book of Knowledge. Theearnings trend and the stock price of this stock were alreadydeclining when the stock market averages began their declinein January 1973.Chart by Securities Research Company
198
CHART 36. RITE AID
Rite Aid operates discount drugstores in the northeast and isalso a food wholesaler. The company's stock began to declineduring the same month as the stock market averages, January1973, but the stock's price decline accelerated after earningsbegan to decline later that year. The stock had a P/E ratio of60 to 1 in January 1973.Chart by Securities Research Company
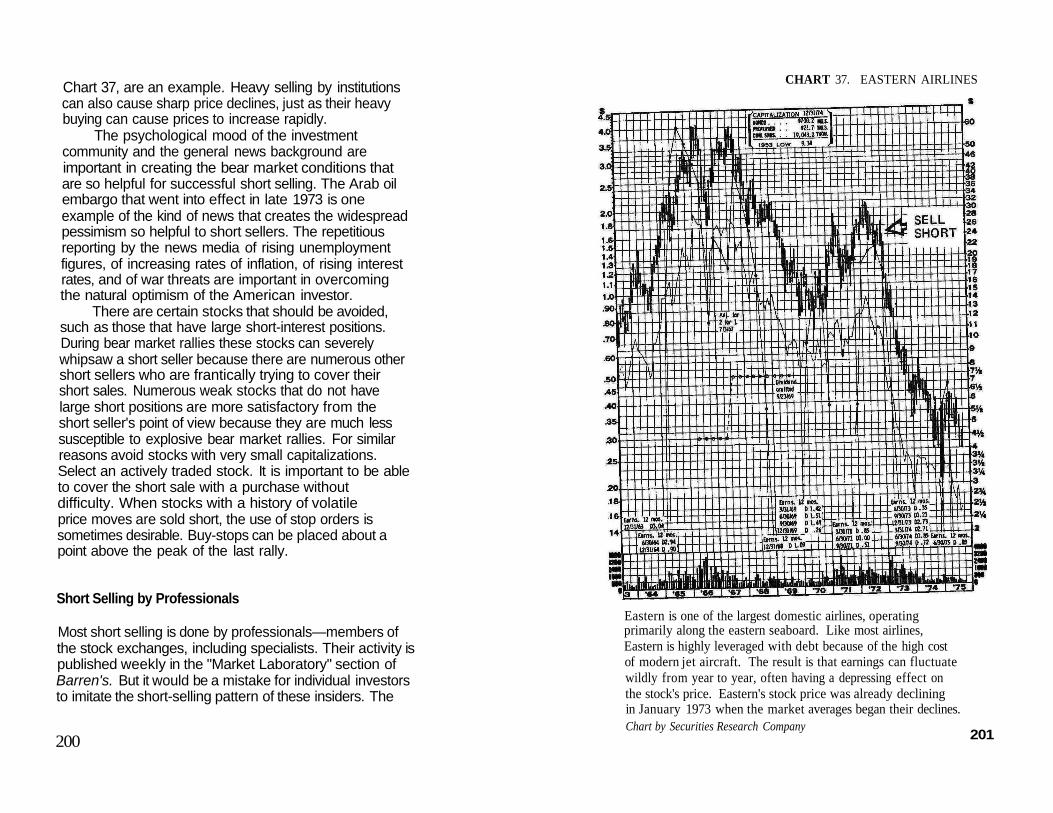
Chart 37, are an example. Heavy selling by institutionscan also cause sharp price declines, just as their heavybuying can cause prices to increase rapidly.
The psychological mood of the investmentcommunity and the general news background areimportant in creating the bear market conditions thatare so helpful for successful short selling. The Arab oilembargo that went into effect in late 1973 is oneexample of the kind of news that creates the widespreadpessimism so helpful to short sellers. The repetitiousreporting by the news media of rising unemploymentfigures, of increasing rates of inflation, of rising interestrates, and of war threats are important in overcomingthe natural optimism of the American investor.
There are certain stocks that should be avoided,such as those that have large short-interest positions.During bear market rallies these stocks can severelywhipsaw a short seller because there are numerous othershort sellers who are frantically trying to cover theirshort sales. Numerous weak stocks that do not havelarge short positions are more satisfactory from theshort seller's point of view because they are much lesssusceptible to explosive bear market rallies. For similarreasons avoid stocks with very small capitalizations.Select an actively traded stock. It is important to be ableto cover the short sale with a purchase withoutdifficulty. When stocks with a history of volatileprice moves are sold short, the use of stop orders issometimes desirable. Buy-stops can be placed about apoint above the peak of the last rally.
Short Selling by Professionals
Most short selling is done by professionals—members ofthe stock exchanges, including specialists. Their activity ispublished weekly in the "Market Laboratory" section ofBarren's. But it would be a mistake for individual investorsto imitate the short-selling pattern of these insiders. The
200
CHART 37. EASTERN AIRLINES
Eastern is one of the largest domestic airlines, operatingprimarily along the eastern seaboard. Like most airlines,Eastern is highly leveraged with debt because of the high costof modern jet aircraft. The result is that earnings can fluctuatewildly from year to year, often having a depressing effect onthe stock's price. Eastern's stock price was already decliningin January 1973 when the market averages began their declines.Chart by Securities Research Company 201
reason is that much short selling by stock exchangespecialists is associated with their market-makingactivities. They "lean against" the direction of the market.They often sell short heavily when the market averages arerising rapidly. On the occasions when individual investorsshould be selling short—that is, as prices begin majordeclines—short sales totals by specialists and insidershave been lower than during market rallies.
One of the heaviest periods of short selling occurredin late 1974, when the stock market averages and moststocks were severely depressed. A severe sell-off occurredin mid-1974, which reached a selling climax on October 4.Stock prices rebounded strongly from the selling climaxand regained 100 points on the Dow Jones industrialaverage within two weeks. It was during this period ofstrongly rebounding prices that short selling by stockexchange members and specialists was exceptionally heavy.
During the week ending October 11, 1974, forexample, total short selling reached 12,105,900 shares, avery high level. Of that total, 8,651,800 shares were soldshort by stock exchange members, and of that number5,432,700 short sales were by stock specialists. The heavyshort selling continued for several weeks. The figures forthe week ending October 18, 1974, were 9,769,300shares sold short, of which 7,001,300 were by exchangemembers—4,510,300 of these by stock specialists. Forthe week ending October 25, total short sales were7,317,500, of which 5,147,400 were by stock exchangemembers; of this number, 3,176,400 were by specialists.Heavy short selling continued during the week endingNovember 1, 1974. Short sales totaled 8,178,000 shares,of which 5,926,800 were by exchange members and3,706,300 of that total were by specialists.
The heavy short selling was effective, andreversed the direction of the market. During the weekending November 8, 1974, the Dow Jones industrialsdropped 40 points and by the end of the first weekin December the decline was more than 170 points.From that level the market began again to rally,
202
as the 1975-76 bull market started to gain strength.The heavy short selling of October and early
November 1974 occurred when stock prices were rising,which is typical of most short selling by professionals.At bull market tops the volume of short selling by stockspecialists and other stock exchange members has beensomewhat lower. For the week ending December 6,1968, which was the week when a bull market reached apeak and began the bear market that ended in May 1970,short sales by exchange members totaled 3,219,500shares, a relatively moderate level of short selling.
The next bull market top for the Dow Jonesindustrials occurred on January 11, 1973. The volumesof short selling for the week ending January 12, 1973,totaled 5,496,600 shares, of which 4,691,500 were byexchange members; of this latter figure 3,187,800 wereby specialists. For comparison, a year earlier, whenstock prices were rising sharply from the November1971 intermediate low of 790.6 on the Dow Jonesindustrial average, the week ending December 3, 1971,had these figures: total short sales 8,571,700; short salesby exchange members 7,000,100; of the latter total,5,148,600 were by specialists.
From late November 1971 the market averagesclimbed steeply for five months. The Dow Jonesindustrial average rose more than 170 points duringthe period. Anyone who sold short during the lateNovember-early December 1971 period could have beenhurt financially. Heavy short selling by stock specialists,then, is more often associated with rising prices, and itcan be unwise for individual investors to do as thespecialists do. A safer time for short sales is when stockprices have started major declines.
Covering Short Sales
The best way to select short-sale candidates is by studyinglong-term charts for direction of price movements,
203

P/E ratios, and earnings trends. Select stocks that arealready declining. As with stock purchases, safety isfound in the good timing of the short sale.
When should the short sale be covered? Formaximum profits do not cover the short sale until thebear market has run its full course. During the 1969-70bear market short sales would have been made when themarket's primary trend, as revealed by the stockaverages, turned down in December 1968; the short salewould have been covered in May 1970 at the bottom ofthe bear market. Again, in January 1973 the stockmarket averages began their cyclical decline and shortsales would have been made. The covering purchaseswould have been made during the panic stage of thebear market in October 1974. So short sales should becovered during periods with economic conditionssimilar to those of May 1970 and October 1974.
The most important economic news of thoseperiods was that Washington political leaders weretaking steps to stimulate the national economy. Theirmoves included increased government spending,advocacy of lower income taxes, and a Federal ReserveBoard policy of monetary ease. But at bear marketbottoms pessimism is so pervasive that there is usually aperiod of weeks or months before the stock marketreacts to the new stimulative policies.
One reason for new stimulative policies by federalofficials is that unemployment figures are high andrising, industries are not operating at full capacity, thenext presidential election is two years away, and it istime to get the economy moving again. These are thesignals that the bear market will end soon.
Bear markets end in an emotional panic phaseduring which prices often plunge dramatically in just afew days. For maximum profits the short sale should becovered during this selling-climax phase. It is usuallyat that point, of course, that new commitments forpurchases should be made, and a new stock-price cyclebegins.
204
PartVThe Strategy for Success
Chapter 14Sources of Information and Ideas
Where do you look to find superperformance stocks?Many different places. I discovered Marriott (then HotShoppes) by dining in the company's restaurants atabout the time the first public offering of stock wasmade in the early 1950s. I first discovered Holiday Innswhen I stayed overnight in one of their motels on a tripto Florida. That was in the late 1950s and the stock wasan over-the-counter security at that time.
Extensive reading or browsing in libraries sometimesbrings about the discovery of a promising company. Ipurchased Thiokol in the mid-1950s after reading articlesin technical magazines describing new developmentsin missile systems. Thiokol, shown on Chart 38, was oneof the pioneers in the development of solid propellantmotors.
Leads to many other superperformance stocks werefound as a result of systematic searching. The search canbe accomplished in many different ways. Here are a fewof them.
Regularly review sets of long-term line charts suchas those in this book. Review the charts for the variouscharacteristics I have outlined—that is, for pricevolatility, expandable P/E ratios, and price and volumetrends. Stocks that are undervalued compared withprevious periods can be easily identified on the charts.
Publications to Review Regularly
It is important for anyone who has common stockinvestments also to invest a relatively small amount ofmoney in financial publications. It is the only way tostay abreast of the latest decisions by Washington
207
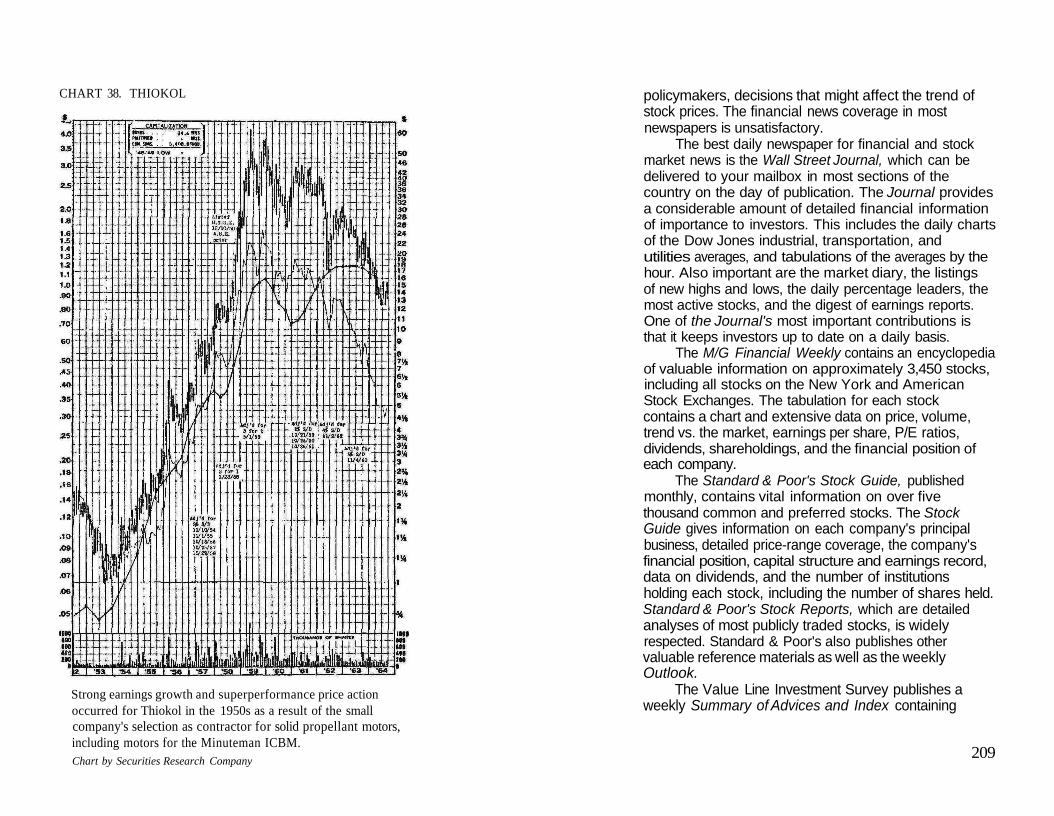
CHART 38. THIOKOL
Strong earnings growth and superperformance price actionoccurred for Thiokol in the 1950s as a result of the smallcompany's selection as contractor for solid propellant motors,including motors for the Minuteman ICBM.Chart by Securities Research Company
policymakers, decisions that might affect the trend ofstock prices. The financial news coverage in mostnewspapers is unsatisfactory.
The best daily newspaper for financial and stockmarket news is the Wall Street Journal, which can bedelivered to your mailbox in most sections of thecountry on the day of publication. The Journal providesa considerable amount of detailed financial informationof importance to investors. This includes the daily chartsof the Dow Jones industrial, transportation, andutilities averages, and tabulations of the averages by thehour. Also important are the market diary, the listingsof new highs and lows, the daily percentage leaders, themost active stocks, and the digest of earnings reports.One of the Journal's most important contributions isthat it keeps investors up to date on a daily basis.
The M/G Financial Weekly contains an encyclopediaof valuable information on approximately 3,450 stocks,including all stocks on the New York and AmericanStock Exchanges. The tabulation for each stockcontains a chart and extensive data on price, volume,trend vs. the market, earnings per share, P/E ratios,dividends, shareholdings, and the financial position ofeach company.
The Standard & Poor's Stock Guide, publishedmonthly, contains vital information on over fivethousand common and preferred stocks. The StockGuide gives information on each company's principalbusiness, detailed price-range coverage, the company'sfinancial position, capital structure and earnings record,data on dividends, and the number of institutionsholding each stock, including the number of shares held.Standard & Poor's Stock Reports, which are detailedanalyses of most publicly traded stocks, is widelyrespected. Standard & Poor's also publishes othervaluable reference materials as well as the weeklyOutlook.
The Value Line Investment Survey publishes aweekly Summary of Advices and Index containing
209
sixteen hundred stocks in which industry groups andindividual stocks are ranked on their probable marketperformance for the next twelve months. Value Linealso estimates each stock's price range for a period ofthree to five years in the future. Detailed analyses ofeach stock are published on a rotating basis in the"Ratings and Reports"section. A weekly "Selection &Opinion" section contains information on currentdevelopments in the stock market and a stock-of-the-week selection.
Moody's is another of the large financial advisoryservices. Of particular value to investors is Moody'sHandbook of Common Stocks, which is publishedquarterly. The volume contains reports of 1,500 stocksin tabular form and 1,010 arranged alphabetically. Foreach of the latter there is a chart portraying its marketprice history for the past twenty years and a descriptionof the company and its business. A package of statisticsand other facts on the stock are also included.
Other publications that are valuable sources ofideas are Barren's, Business Week, Forbes, U.S. News &World Report, and the Wall Street Transcript. There aremany technical publications which can be of great valuein providing the names of companies that are developingnew products or are active in other ways that will havean important bearing on the company's growth.
Barren's contains advertising by numerous stockadvisory services. The market letters of some of theseservices often contain important information on newdevelopments in specific companies as well as purchaserecommendations.
If you find stocks that seem worth investigating,write directly to each company for information,including copies of annual reports. You might find aprize investment.
The intelligent use of reference materials is one ofthe keys to success. A helpful method is to keep filesand notebooks containing the names of stocks beinginvestigated. Add to the file as important information
210
becomes available. Then evaluate the stock and takeaction when the time arrives to buy stocks.
Many of my best investments have been made as aresult of periodic sessions reviewing the information andevaluations in these publications of the stock advisoryservices. They can be found in most public libraries aswell as stockbrokers' offices. Most brokers will supplycustomers with copies of reports on individualcompanies.
Learn to Recognize the Cycles
In the stock market there are repeated cycles ofaccumulation and advance, then distribution and decline.When the public is selling in panic at bear marketbottoms, the insiders—the stock exchange specialistsand other professionals—are buying. When the public isenthusiastically buying at much higher prices, theprofessionals are selling. It is through observing,understanding, and anticipating these buying and sellingpressures that the individual investor can plan asuccessful investment strategy of well-timed stockpurchases and sales.
Within the bull market stage of each stock-pricecycle there are phases consisting of dramatically risingprices and phases in which prices are moving irregularlysideways or into decline. The most dynamic rise occurswhen stock prices rebound upward from the bottom ofbear markets. It is at this time, when pessimism iswidespread, that large capital gains are made quickly.The new dynamic bull market is triggered becauseexperienced professional traders realize that stocks are"sold out"—that is, anyone who might be scared intoselling has already done so. The professionals concludethat they will not be surprised by additional heavyselling.
Cycles within the four-year political cycles areoften caused by selling for income tax purposes. There
211
have been many strong rallies that have started near theend of a year as selling for tax purposes was concluding.Exceptionally strong rallies began in January 1976,January 1975, December 1971, December 1970, andJanuary 1967. Since the tax-selling cycle is dependentupon the one-year reporting period for federal incometaxes, the cycle is limited in duration. Purchases madeby Thanksgiving in stocks that are being sold heavily fortax purposes can often show good capital gains byFebruary.
One question for investors to consider is to whatextent the self-interest of the stockbroker, who desiresto have a steady income, conflicts with that of theindividual investor, whose interest is to receive amaximum return for his investment. A broker is likelyto recommend a stock at any time. But my review ofstock charts revealed that the best time to buy moststocks during the past fourteen years was near thebottom of the bear markets of 1962,1966,1970, and1974. These periods lasted only a few months. It isprimarily during these low-risk/high-reward periods,when the stock market is beginning to recover from abear market, that investors should buy, and secondarilyduring the periods of market weakness that occur fromOctober through December in years when there is sellingto establish losses for income tax purposes.
So should we buy stocks to keep, or buy and sellwith the stages of the cycles? Based on the experienceof the past three decades the greater financial rewardswould undoubtedly have gone to those investors whowere adept at buying and selling at the right times. Butnot all investors have the ability or desire to buy and sellwith the cycles.
Some investors do not buy at the proper time,when prices are depressed, because they fear the riskinvolved. They fail to perceive that risk is lessened whenstock prices are depressed and that risk is increasedduring periods of high prices. The principal reason fortheir imperfect perception of risk is the news atmosphere
characteristic of market troughs and tops. When stockprices are depressed there is usually a barrage of newsregarding an approaching recession. Television newsprograms and the daily newspapers are filled withinformation regarding rising unemployment and decliningsales and production. Usually there is an insinuation thatconditions will become worse. Many investors find itpsychologically difficult to buy stocks during theseperiods of deep pessimism.
On the other hand, declines in stock prices beginduring periods of widespread optimism, when the nationis prosperous and the economy is booming. During theseperiods sales and production are high and little concernis voiced regarding unemployment. But it is during theseperiods of prosperity that investors who wish to decreaserisk should sell stock.
Even astute Wall Street professionals have madebad guesses regarding which of the twin devils, recessionor inflation, the Fed has decided to fight. Hundreds ofmillions of dollars were lost in March and April of 1974because of plummeting bond prices, including the pricesof corporate and municipal bonds and government agencyissues. Bond dealers, which are banks and big securitiesfirms, had loaded up in anticipation of higher prices. Bondprices rise when interest rates and bond yields fall; bondprices fall when interest rates and yields rise. The bondmarket had expected that the cost of money would declinein 1974 as a result of an easing of credit policy by theFederal Reserve and by declining demand for loans. Butinterest rates climbed as the demand for loans increasedand the Federal Reserve Board tightened credit.
Stocks purchased for their dividend income may beparticularly susceptible to Federal Reserve Boardpolicies of monetary restraint. When the expansion ofthe nation's money supply slows down, credit becomesmore difficult to obtain and interest rates rise. Sincedividends from income-type stocks would be at adisadvantage compared with the higher bond yields,money-sensitive common stocks decline.
213
Look for Potential Price Movement
It is generally true that the stocks of big, maturecompanies with large capitalizations are not likely todecline as rapidly as the stock prices of smallercompanies. However, a slow decline is more likely tocause complacency and a failure to sell at a time whenthe stock has gone into a price decline. The purchase ofa quality stock is likely to give its purchaser a sense ofsecurity that might not be justified. In mid-September1974, for example, IBM had declined 58 percent fromits 1973 high; General Motors had declined 57 percent,Sears Roebuck 55 percent, General Electric 60 percent,and Texaco 49 percent. Some of these declines were inaddition to declines from even higher prices establishedin the 1960s. Rather than "quality," the importantthing to look for in a stock is potential price movement.Keep in mind that at some prices even the stock of thehighest quality can be overpriced, and that at someprices even low-quality stocks can be underpriced.
Individual Judgment Is Crucial for Success
Common stock investment is almost entirely speculation.Today very few stocks are purchased solely for theirdividends. In most cases the purchaser of commonstocks is speculating that he can sell them at a higherprice some time in the future—that is, for capital gains.
Traditionally, many investment counselors havebelieved in a buy-and-hold approach to the stockmarket, with safety obtained through diversification andthe purchase of quality stocks. Traditionally, Wall Streethas considered the speculator to be a risk taker,someone who would buy a stock today and plan to sellit in six months or a year at a higher price. It wasassumed that he was willing to assume greater risk in thehope of larger gain by selecting more volatile, weakerstocks for purchase. Traditionally, Wall Street has
214
considered the investor to be a more conservative man,,an individual more interested in safety and dividendincome than in taking a risk that might bring a largecapital gain but might also cause the loss of theinvestment.
These traditional viewpoints are incorrect. Realsafety lies more in the good timing of purchases andsales than in the size or the financial strength ofcompanies selected for purchase. The stocks of many ofthe nation's largest companies have been in persistentdowntrends for a decade or more. Among them arecompanies shown on charts in this book, such as AT & T,General Motors, duPont, and U.S. Steel, as well as mostutilities. Conservative investors who purchased thesestocks for their safety and income have suffered largelosses for many years. Inflation has been taking its toll.The dividends offered by utilities and other income-typestocks have not been large enough to compete withyields from bonds, U.S. Treasury bills, certificates ofdeposit, and other mediums. The result has beenlong-term downtrends in conservative stocks. The safetyfeature considered so desirable did not exist. Onthe other hand, the well-timed purchase of carefullyselected speculations has been highly rewarding to thoseindividuals who have had the determination to spendthe time and effort required to study the stock marketand individual securities in a systematic manner.
The critical test in managing investments isindividual judgment—the ability to interpret informationcorrectly. An investor can have all the latest factsbut if he does not have the ability to arrive at thecorrect conclusion, he is bound to have trouble.Generally speaking, most investors have basically thesame information available to them. It is differinginterpretations that cause individuals to buy differentstocks, or some investors to buy the stock that othersare selling.
215

Chapter 15Points to Remember
The strategy to be followed for successful stock marketinvestment can be summarized as follows:
1. Buy when stock prices are extremely depressedfollowing a steep decline. These periods have occurredabout every four years, usually within a few months ofthe midpoint of a presidential term of office.
2. Hold long positions during the uptrend in stockprices as the market recovers from depressed levels.Stock averages usually continue to rise for at least twoyears, although the rise for numerous individual stockscan be much shorter.
3. Sell after stocks have had a considerable rise inprice, particularly if a presidential election has been heldrecently—usually an indication of a possible change innational economic policy.
4. Sell short or remain in cash as stock pricesdecline from high prices and as a result of federalpolicies. Do not re-enter the market as a buyer too soon.Wait until the selling climax has been reached.
5. In the immediate future bear markets might notbe as severe as those of 1969-70 and 1973-74 becauseinvestors are likely to be more cautious than they werein 1968 and 1972 about running up stock prices to highlevels. Moreover, a large market has developed in optionsfor people who have an urge to gamble.
6. Future market action also depends to a largeextent upon who is elected President of the UnitedStates, because federal spending policies and anti-inflationmeasures depend considerably on presidential positions,which vary with the individual who occupies theseat of power. But the average presidential incumbentrunning for re-election can be expected to followthe usual inflationary policies prior to an election,
217

and then tell the^ttecs: "Vote forme, I gave youprosperity."
When to Buy Stocks
To assist you in determining when to buy stocks, keepthese points in mind:
1. Follow the financial news closely to determinewhen the Federal Reserve switches from a restrictivemonetary policy to a policy of ease.
2. During bear markets do not buy until sellingreaches the climax stage as fear-stricken investors dumptheir securities on the market. This occurs after marketaverages have declined a couple of hundred points ormore over a period of at least nine months. The sellingclimax will consist of two hundred or more stocksmaking new lows for the year and no stocks making newhighs. The Dow Jones industrial average will decline bytwenty points or more, then suddenly rebound asprofessionals cover short positions and begin toreaccumulate long positions at depressed prices.
3. The biggest stock-price gains are made whenprices begin to rebound from depressed levels. In thepast this has most often occurred about midway througha presidential term of office.
4. The final test of whether a stock is a "buy" isthe price action of the stock itself. Check to see if it isbeginning to rebound strongly from its depressed pricelevel.
5. Lower than expected company earnings oftencause stock prices to decline to attractive levels. This isthe time to buy stocks, which will turn up as earningsreturn to a normal rate. But be sure to select companiesthat have sufficient strength and bright futures-companies that will bounce back.
6. One of the safest times to buy is in December ofyears that have experienced severe bear markets.Although the selling of stocks to establish losses for tax
218
purposes can occur through December 31, the heaviestselling usually takes place a month or two earlier, andstock prices often have started to rebound by December.Major trend reversals occur when all the heavy sellinghas at last run its course.
7. The investor must be able not only to estimatefuture profits for a company but also to anticipate thevalue that the market will place on those profits, asreflected by the P/E ratio.
8. Large capital gains from common-stockinvestments are obtained by buying the right stock atthe right time and selling it at the right time. The righttime for the purchase and sale is dependent to a greatextent on the stages of political cycles, which determinethe timing of business and stock-price cycles.
What Stocks to Buy
To assist you in determining which stocks to buy, keepthese points in mind:
1. Successful investment depends on anticipatingthe value that other investors will place on specificsecurities in future years. The most important ability foran investor to have, therefore, is the ability to forecastfuture trends and developments correctly.
2. Prior to purchasing a stock, review on charts itsprice and earnings history for the past several years. Thisis a quick way to gain perspective. Determine also thecurrent price trend—whether it is down or up.
3. When stocks are rebounding from depressedprice levels, the stocks most likely to rebound the fastestand the highest are those with strong prospects.
4. To determine which stocks are currently beingsponsored or promoted, review the literature ofinvestment advisory services, ask your broker for thenames of stocks rated as "buys" by his company, andcarefully read the financial press for stocks beingfavorably publicized.
219

5. Future earning power is one of the mostimportant features to consider when evaluating stocksfor purchase.
6. Stay up-to-date on proposed policies emanatingfrom Washington that might affect specific securities.
7. Better investment results are usually foundamong dynamic small or medium-sized growth-stagecompanies than among the giants of industry.
8. Stocks being accumulated by institutionalinvestors should show better results than stocks beingsold on balance by institutions or those in which there isno institutional interest.
9. The potential reward is too small in most stocksmost of the time to justify the risk taken by the investorwith his capital.
10. Look for opportunities to make largepercentage gains.
11. Do not buy a security until you haveinvestigated and evaluated it thoroughly. Knowledge andinsight are gained through careful research.
12. Whether you call it investment or speculation,keep in mind that when you buy any common stocksyou are taking a calculated risk.
13. It is important that every individual who buysor is contemplating buying common stock be aware ofhow much of a financial risk he can afford to take. Asecurity might look like an outstanding opportunity inall respects, but each individual must also relate the riskto his own financial situation. He should ask himselfhow much of a loss he can afford. Frequently acompany contains only the possibility of great futuregrowth, not the assurance of it.
When to Sell Stocks
To assist you in determining when to sell, keep thesepoints in mind:
1. Determine the stages of the political, business,
220
and stock-price cycles. The strongest stock-priceadvances often take place during the year prior to thepresidential-election year. Stock prices have frequentlystarted to decline within a year following the presidentialelection.
2. Stock prices discount the future; prices movebecause of economic conditions expected many monthsahead. Stock prices often reach their peaks beforebusiness prosperity reaches its highest levels; theyrebound from their bear market lows while business isstill sliding into a recession.
3. Changes in monetary policy, as announced byofficials of the Federal Reserve, are strong signals of achange in the direction of stock prices.
4. News is a strong influence in the movement ofstock prices. Since about five million people read theWall Street Journal every day, information and articlesin that newspaper can and often do have an effect onprices.
5. When good news no longer pushes up the priceof a stock, the stock might be a sell candidate.
6. Determine if the downside risk is greater thanthe potential profit.
7. When the upward momentum of a stock's pricehas slowed or stopped, consider whether the stockshould be sold.
8. Ask yourself if you would be willing to buy thesecurity at its present price. If you would not be willingto buy, why expect someone else to?
9. Stocks do not all reach their final high pricessimultaneously. Some might top out several monthsprior to the final top in the market averages.
10. A goal of many institutional investors-continuous, uninterrupted growth—is unrealistic. Thereal world consists of cycles.
11. Stock prices do not just decline; many areforced down by heavy short selling on the part ofprofessional traders.
12. Stockbrokers have a strong bullish bias.
221
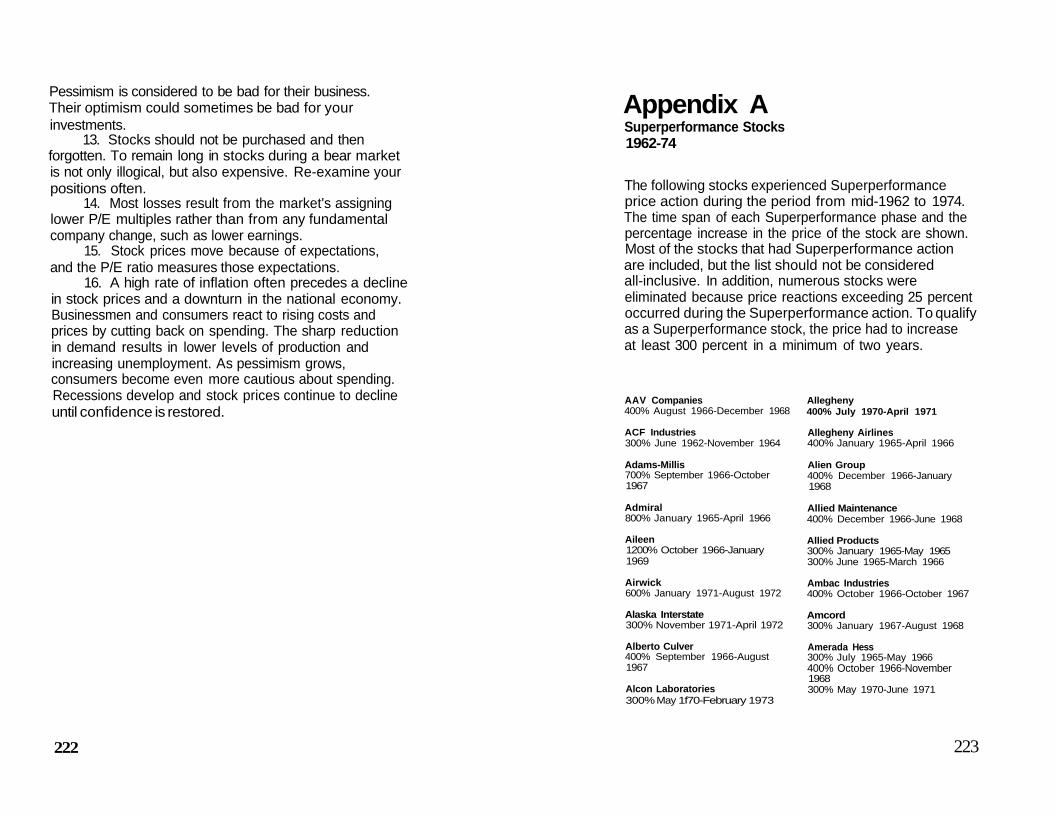
Pessimism is considered to be bad for their business.Their optimism could sometimes be bad for yourinvestments.
13. Stocks should not be purchased and thenforgotten. To remain long in stocks during a bear marketis not only illogical, but also expensive. Re-examine yourpositions often.
14. Most losses result from the market's assigninglower P/E multiples rather than from any fundamentalcompany change, such as lower earnings.
15. Stock prices move because of expectations,and the P/E ratio measures those expectations.
16. A high rate of inflation often precedes a declinein stock prices and a downturn in the national economy.Businessmen and consumers react to rising costs andprices by cutting back on spending. The sharp reductionin demand results in lower levels of production andincreasing unemployment. As pessimism grows,consumers become even more cautious about spending.Recessions develop and stock prices continue to declineuntil confidence is restored.
222
Appendix ASuperperformance Stocks1962-74
The following stocks experienced Superperformanceprice action during the period from mid-1962 to 1974.The time span of each Superperformance phase and thepercentage increase in the price of the stock are shown.Most of the stocks that had Superperformance actionare included, but the list should not be consideredall-inclusive. In addition, numerous stocks wereeliminated because price reactions exceeding 25 percentoccurred during the Superperformance action. To qualifyas a Superperformance stock, the price had to increaseat least 300 percent in a minimum of two years.
AAV Companies400% August 1966-December 1968
ACF Industries300% June 1962-November 1964
Adams-Millis700% September 1966-October1967
Admiral800% January 1965-April 1966
Aileen1200% October 1966-January1969
Airwick600% January 1971-August 1972
Alaska Interstate300% November 1971-April 1972
Alberto Culver400% September 1966-August1967
Alcon Laboratories300% May 1f70-February 1973
Allegheny400% July 1970-April 1971
Allegheny Airlines400% January 1965-April 1966
Alien Group400% December 1966-January1968
Allied Maintenance400% December 1966-June 1968
Allied Products300% January 1965-May 1965300% June 1965-March 1966
Ambac Industries400% October 1966-October 1967
Amcord300% January 1967-August 1968
Amerada Hess300% July 1965-May 1966400% October 1966-November1968300% May 1970-June 1971
223

American Airlines300% October 1962-March 1964
American Building MaintenanceIndustries800% February 1967-July 1968300% June 1970-March 1972
American District Telegraph300% May 1970-March 1972
American Express450% May 1970-January 1973
American Greetings400% June 1970-July 1972
American Hospital Supply300% October 1966-June 1968
American Medical International1500% November 1966-October1967400% March 1968-January 1969300% May 1970-March 1971
American Petrofina500% August 1966-May 1969
American Safety Equipment400% September 1964-May 1965
American Standard300% October 1966-December1968
Ametek300% January 1967-September1967
AMF400% May 1970-April 1972
Amrep2000% January 1967-May 1969300% July 1970-February 1971
Angelica300% March 1968-April 1969
Ansul300% December 1964-February1966
Anthony Industries1200% December 1966-May 1969800% August 1971-July 1972
224
Apache500% November 1966-June 1968
APL Corp.300% August 1964-October 1964400% November 1966-June 1967
Archer-Daniels-Midland300% April 1972-September 1973
Asamera Oil400% March 1965-April 1965500% November 1968-June 1969
Athlone Industries1200% October 1966-December1968
Atlas300% December 1966-August 1967
A-T-O300% November 1966-January 1968
Automated Building Components400% December 1966-December1968300% June 1970-April 1971
Automatic Data Processing1400% August 1965-December1967300% March 1968-January 1970
Avco300% January 1967-August 1967
Avery Products800% November 1965-January 1970
Avnet500% October 1966-December 1967
Aztec Oil & Gas300% June 1970-July 1971
Babcock & Wilcox300% June 1970-April 1971
Baker Oil Tools500% May 1970-December 1972
Bally Manufacturing1200% December 1970-November1972
Bangor Punta300% October liiB-JSttuWy t@6l
Banister Continental300% July 1970-February 1971400% November 1971-December1972
Bath Industries500% December 1966-June 1968700% July 1970-April 1972
Bausch & Lomb600% July 1970-January 1972300% April 1973-October 1973
Baxter Laboratories700% July 1964-September 1967
Belco Petroleum400% October 1966-November1967
Benguet Consolidated600% February 1967-February1968
Berkey Photo300% November 1963-April 1964300% June 1965-April 1966
Blessings400% May 1964-April 1965
Block (H & R)1400% October 1966-December1968
Boeing500% July 1963-January 1966
Boise Cascade500% October 1966-May 1968
Braniff International1500% January 1964-June 1966
Browning Ferris300% December 1970-April 1972
Brunswick500% July 1970-April 1972
Bucyrus-Erie500% November 1963-February1966
Bunker Ramo300% October 1918-duMs 1967
Burndy400% October 1964-April 1966
Burns International Security Services600% October 1966-October 1968
Burnup & Sims1200% July 1970-January 1973
Burroughs300% May 1965-August 1966500% October 1966-January 1970
Buttes Gas & Oil1200% December 1966-February1969
Caldor400% July 1970-February 1972
California Computer Products600% October 1966-July 1967
Campbell Chibougamau Mines300% August 1965-April 1966
Capital Cities Communications300% January 1964-January 1966300% May 1970-March 1972
Carlisle400% July 1965-July 1967
Castle & Cooke300% July 1966-December 1968
Cerro300% November 1962-November1964
Certain-Teed Products400% July 1970-May 1972
Champion Home Builders1000% December 1967-May 19692600% July 1970-July 1972
Chelsea Industries900% January 1967-August 1968
Chicago Bridge & Iron1000% June 1970-November 1973
Chicago Milwaukee500% October 1962-November 1964
Chock Full O'Nuts300% December 1966-December 1967
225
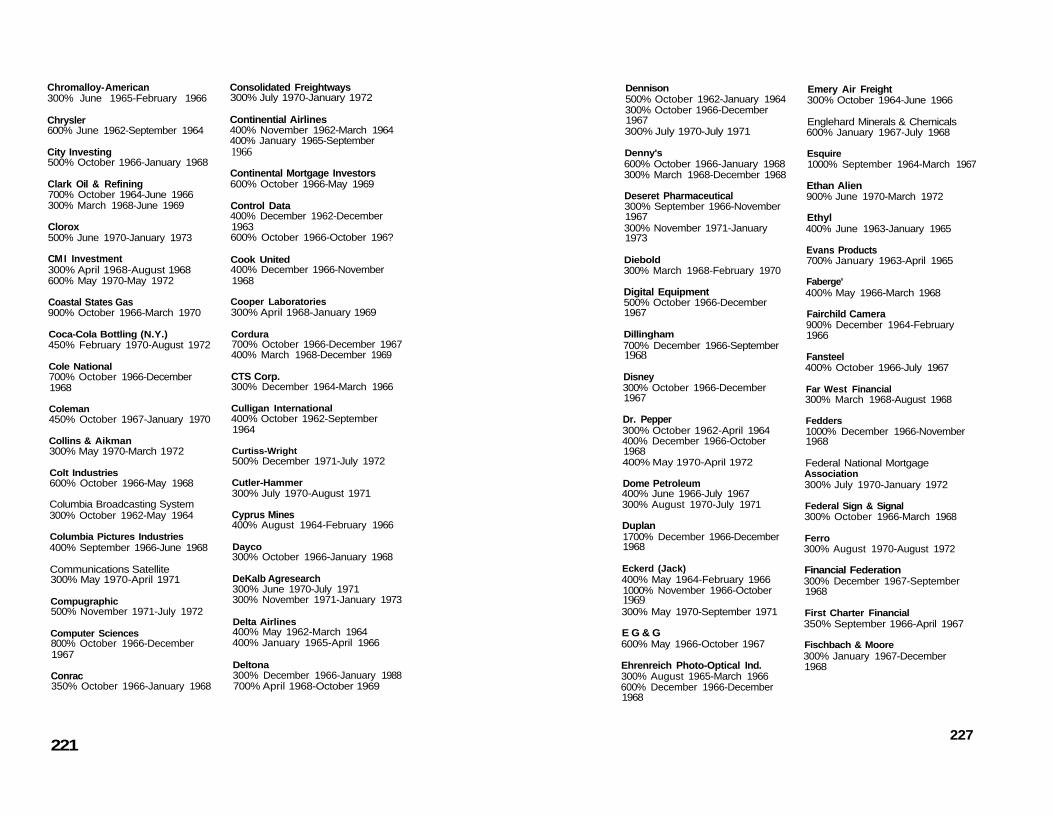
Chromalloy- American300% June 1965-February 1966
Chrysler600% June 1962-September 1964
City Investing500% October 1966-January 1968
Clark Oil & Refining700% October 1964-June 1966300% March 1968-June 1969
Clorox500% June 1970-January 1973
CM I Investment300% April 1968-August 1968600% May 1970-May 1972
Coastal States Gas900% October 1966-March 1970
Coca-Cola Bottling (N.Y.)450% February 1970-August 1972
Cole National700% October 1966-December1968
Coleman450% October 1967-January 1970
Collins & Aikman300% May 1970-March 1972
Colt Industries600% October 1966-May 1968
Columbia Broadcasting System300% October 1962-May 1964
Columbia Pictures Industries400% September 1966-June 1968
Communications Satellite300% May 1970-April 1971
Compugraphic500% November 1971-July 1972
Computer Sciences800% October 1966-December1967
Conrac350% October 1966-January 1968
221
Consolidated Freightways300% July 1970-January 1972
Continential Airlines400% November 1962-March 1964400% January 1965-September1966
Continental Mortgage Investors600% October 1966-May 1969
Control Data400% December 1962-December1963600% October 1966-October 196?
Cook United400% December 1966-November1968
Cooper Laboratories300% April 1968-January 1969
Cordura700% October 1966-December 1967400% March 1968-December 1969
CTS Corp.300% December 1964-March 1966
Culligan International400% October 1962-September1964
Curtiss-Wright500% December 1971-July 1972
Cutler-Hammer300% July 1970-August 1971
Cyprus Mines400% August 1964-February 1966
Dayco300% October 1966-January 1968
DeKalb Agresearch300% June 1970-July 1971300% November 1971-January 1973
Delta Airlines400% May 1962-March 1964400% January 1965-April 1966
Deltona300% December 1966-January 1988700% April 1968-October 1969
Dennison500% October 1962-January 1964300% October 1966-December1967300% July 1970-July 1971
Denny's600% October 1966-January 1968300% March 1968-December 1968
Deseret Pharmaceutical300% September 1966-November1967300% November 1971-January1973
Diebold300% March 1968-February 1970
Digital Equipment500% October 1966-December1967
Dillingham700% December 1966-September1968
Disney300% October 1966-December1967
Dr. Pepper300% October 1962-April 1964400% December 1966-October1968400% May 1970-April 1972
Dome Petroleum400% June 1966-July 1967300% August 1970-July 1971
Duplan1700% December 1966-December1968
Eckerd (Jack)400% May 1964-February 19661000% November 1966-October1969300% May 1970-September 1971
E G & G600% May 1966-October 1967
Ehrenreich Photo-Optical Ind.300% August 1965-March 1966600% December 1966-December1968
Emery Air Freight300% October 1964-June 1966
Englehard Minerals & Chemicals600% January 1967-July 1968
Esquire1000% September 1964-March 1967
Ethan Alien900% June 1970-March 1972
Ethyl400% June 1963-January 1965
Evans Products700% January 1963-April 1965
Faberge'400% May 1966-March 1968
Fairchild Camera900% December 1964-February1966
Fansteel400% October 1966-July 1967
Far West Financial300% March 1968-August 1968
Fedders1000% December 1966-November1968
Federal National MortgageAssociation300% July 1970-January 1972
Federal Sign & Signal300% October 1966-March 1968
Ferro300% August 1970-August 1972
Financial Federation300% December 1967-September1968
First Charter Financial350% September 1966-April 1967
Fischbach & Moore300% January 1967-December1968
227

Fisher Foods450% December 1966-January1968400% April 1968-February 1969
Fleetwood Enterprises2400% January 1967-December1968700% May 1970-April 1972
Flexi-Van500% September 1967-November1968300% July 1970-March 1972
Fluor400% June 1964-January 1966300% October 1966-June 1967
Flying Tiger450% June 1965-April 1966300% October 1966-July 1967400% July 1970-April 1971
Foster Wheeler300% October 1966-July 1967300% December 1972-January1974
Franklin Mint300% July 1968-February 1969400% September 1970-April 1971
Fuqua500% July 1966-June 1967
GAF350% July 1970-March 1972
Gannett400% June 1970-August 1972
Garan1100% November 1966-December1968600% June 1970-January 1972
GCA Corp.400% October 1966-September1967
General Cable550% October 1962-April 1966
General Cinema800% June 1967-December 1968300% May 1970-April 1971
228
General Development900% October 1966-May 1969
General Instrument550% September 1964-August 1966
Genuine Parts450% May 1970-May 1972
Georgia-Pacific350% October 1966-December1968
Giant Food350% October 1966-November1968
Giddings & Lewis350% October 1966-June 1967
Gino's2400% December 1966-November1969300% August 1970-June 1972
Global Marine450% June 1966-January 1968
Gordon Jewelry350% September 1964-March 1966700% October 1966-December1968
Grainger400% June 1970-December 1972
Gray Drug Stores300% April 1964-January 1966350% December 1966-November1968
Great Lakes Chemical300% October 1966-April 1967
Greyhound300% June 1962-April 1964
Grumman300% June 1964-February 1966
Guardian Industries400% December 1971-May 1972
Gulf Resources450% June 1965-March 1966300% September 1966-August1967
Gulf & Western Industries500% June 1964-April 1966300% October 1966-February 1967300% May 1970-April 1971
Gulton Industries300% June 1965-June 1966350% October 1966-December1967
Halliburton500% May 1970-January 1973
Handleman400% October 1966-January 1968
Harland (John H.)500% May 1970-April 1972
Heller (Walter E.)300% December 1966-October1968
Helmerich & Payne400% October 1966-January 1968
Hewlett-Packard300% August 1964-April 1966450% July 1970-January 1973
High Voltage300% September 1962-September1963
Hilton Hotels900% October 1966-November1968
Hoffman Electronics300% August 1970-March 1971
Holiday Inns400% October 1966-December1967
Home Oil350% August 1968-May 1969400% May 1970-September 1971
Hoover350% May 1962-March 1964
Horizon2100% October 1966-October 1969350% July 1970-December 1970
Howard Johnson500% July 1970-May 1972
Howmet900% April 1965-October 1967
Huffman Manufacturing300% November 1967-February1969
Humana500% February 1968-December1968
Huyck900% September 1966-January1970
Hygrade Food Products400% March 1968-December 1968
ICN Pharmaceutical900% December 1966-January 1968
Imperial Corporation of America300% December 1967-March 1968
Imperial Oil300% May 1970-December 1972
Interco350% October 1966-July 1968
International Flavors and Fragrances1300% June 1962-July 1966
International Minerals & Chemical470% October 1962-February 1966
International Rectifier500% May 1965-April 1966
Interstate United600% June 1967-November 1968
Iowa Beef Processors300% July 1965-February 1966
Ipco Hospital Supply300% October 1966-January 1968
Itek300% April 1963-January 1964300% July 1965-August 1966
Japan Fund400% March 1968-May 1969
Jim Walter800% October 1966-December1968
229

Johnson & Johnson300% May 1970-May 1972
Johnson Products300% May 1970-December 1970
Josten's300% December 1966-May 1968
Joy650% October 1962-February 1966
Kaiser Industries300% October 1966-January 1968
Katy Industries600% December 1966-January1968
Kauf man & Broad2600% October 1966-March 1970
Kawecki Berylco300% October 1966-June 1967
King's Department Stores400% December 1966-May 1968300% June 1970-May 1971300% June 1963-March 1965
KLM Royal Dutch Airlines400% August 1965-March 1966
Knight Newspapers350% July 1970-August 1972
Kresge (S.S.)300% September 1963-December1965400% January 1967-October 1969450% July 1970-January 1973
Lafayette Radio Electronics400% October 1966-June 1968400% May 1970-July 1971
Lear Siegler300% December 1964-April 1966
Leaseway Transportation650% August 1970-June 1972
Leslie Fay500% June 1964-April 1966
Lenox500% January 1967-February1969
230
Levitz Furniture1300% May 1970-May 1972300% July 1968-December 1968
Loews200% October 1966-January 1968300% July 1970-July 1971
Longs Drug Stores400% December 1966-December1968400% May 1970-February 1972
LTV Corp.600% October 1966-August 1967
Lubrizol300% December 1966-December1968
Lucky Stores700% October 1966-April 1971
Lykes-Youngstown300% June 1967-May 1968
Madison Square Garden400% October 1966-July 1967
Magnavox300% June 1965-Aprii 1966
Malone & Hyde300% May 1970-June 1972
Mapco300% October 1966-October 1968450% July 1970-January 1973
Marathon Manufacturing500% November 1967-January1969
Marcor300% December 1967-June 1969
Maremont1300% July 1970-November 1972
Marion Laboratories800% October 1966-October 1968350% July 1970-July 1972
Marley1000% April 1965-June 1968300% July 1970-April 1972
Marriott400% August 1966-December 1968350% July 1970-May 1972
Mary Kay Cosmetics300% August 1971-January 1973
Masco600% November 1966-October1968400% May 1970-April 1972
Massey Ferguson300% November 1962-November1964
Mattel)1300% December 1966-September1968
Mav Department Stores300% July 1970-January 1972
McCulloch Oil400% January 1967-August 1967450% May 1970-April 1971
McDermott (J. Ray)600% May 1964-May 1968
McDonald's500% October 1966-December1967750% September 1970-December1972
McDonnell Douglas300% October 1966-July 1967300% July 1970-March 1971
Me Lean Trucking Company400% October 1966-February 1969
Melville Shoe400% October 1966-December1968
Menasco800% October 1966-December1967300% July 1970-February 1971300% November 1971-August 1972
Metro-Goldwyn-Mayer400% July 1965-October 1967
Metromedia300% October 1962-October 19^3;300% July 1970-March 1971
MGIC Investment1100% December 1966-May 196i800% May 1970-January 1973
Microdot600% October 1966-September1967
Microwave Associates300% June 1965-August 1965600% October 1966-October 1967
Milgo Electronics300% March 1968-June 1968350% November 1971-May 1972
Milton Bradley600% October 1966-June 1968900% May 1970-June 1972
Mobile Home Industries1000% May 1970-April 1972
Mohasco Industries300% July 1970-April 1972
Mohawk Data Sciences2200% December 1965-December1967
Monarch Machine Tool300% December 1966-November1967
Monroe Auto Equipment900% October 1966-March 1970300% July 1970-March 1972
Motorola700% October 1962-March 1966
Murphy Oil350% November 1971-October1973
Murray Ohio Manufacturing400% October 1966-April 1969
Nashua400% October 1966-December1968
National Airlines1800% June 1962-April 1966
National Chemsearch400% June 1970-January 1973500% October 1966-January 1968
231

National Semiconductor400% July 1973-October 1973800% October 1966-September1967
National Union Electric450% December 1964-April 1966300% December 1970-August 1971
Natomas800% April 1968-May 1969500% May 1970-September 1970
New England Nuclear700% May 1970-August 1972
New Process900% December 1966-November1969700% May 1970-January 1972
Norris Industries350% October 1966-July 1967400% July 1970-March 1972
Northrup. King300% November 1971-June 1972
Northwest Airlines2000% October 1962-June 1966
Northwest Industries1300% October 1962-April 1966400% June 1970-April 1972
Norton Simon300% December 1966-January1968
Occidental Petroleum450% October 1966-November1967
Ogden400% October 1966-January 1968
Outboard Marine450% July 1970-March 1972
Overnight Transportation300% October 1966-June 1968700% May 1970-September 1971
Pacific Petroleums500% October 1966-June 1969
Pan American World Airways500% October 1962-April 1964300% July 1965-June 1966
232
Papercraft300% August 1966-January 1968
Pargas350% December 1963-March 1965
Pasco400% October 1963-April 1965400% October 1966-November1967300% July 1970-October 1970
Peabody Galion450% April 1968-March 1969800% May 1970-July 1972
Perm-Dixie Industries300% October 1966-October 1967
Pennzoil400% October 1963-April 1965350% October 1966-June 1968
Perkin-Elmer450% November 1970-June 1972
Petrie Stores550% May 1970-January 1973
Philip Morris500% May 1970-January 1973
Phillips Industries2000% November 1966-December1968
Pickwick International1500% September 1966-May 1969350% July 1970-May 1972
Pittston300% July 1969-April 1971
Pizza Hut500% August 1971-January 1973
Polaroid500% June 1964-August 1966
Ponderosa System4500% May 1970-June 1972
Quaker State Oil Refining450% October 1962-March 1966400% August 1970-December1972
Ramada Inns400% December 1966-January1968300% May 1970-July 1971
Ranco300% June 1967-December 1968
Raymond International500% October 1966-August 1968
Reading & Bates Offshore Drilling700% October 1962-April 1965300% May 1970-September 1970
Reliance Group1400% October 1966-December1968
Research-Cottrell300% November 1967-May 1968500% May 1970-May 1972
Reserve Oil and Gas400% January 1967-January 1968
Resistoflex300% October 1966-October 1967
Revco D. S.500% August 1966-July 1968300% May 1970-April 1972
Rite Aid1000% May 1970-April 1972
Robins (A. H.)350% November 1970-January1973
Rockower Brothers800% June 1967-May 1969
Rohm & Haas400% July 1970-February 1973
Rohr Industries300% June 1964-December 1965
Roll ins1000% March 1964-April 1965500% October 1966-November1968300% July 1970-July 1972
Rorer-Amchem300% October 1966-May 1968
Rosario Resources500% November 1971-March 1974
Royal Crown Cola300% October 1970-December1971
Royal Industries400% September 1963-February1966400% August 1966-July 1967
Russ Togs300% October 1966-June 1968300% July 1970-March 1971
Ryder System600% October 1966-February 1969300% October 1970-August 1972
Ryan Homes300% May 1970-April 1972
St. Joe Minerals300% October 1962-January 1965
Sanders Associates500% August 1965-July 1966650% November 1966-December1967
Sangamo Electric300% January 1965-December1965300% October 1966-November1967
Sante Fe International450% June 1966-November 1968300% May 1970-April 1971
Sav-A-Stop500% August 1964-February 1966350% October 1967-November1969
Savin Business Machines700% April 1968-April 1969
Saxon Industries550% December 1965-June 1966300% September 1966-June 1967300% March 1968-December 1968
Schlitz (Jos.) Brewing300% November 1970-November1972
233

Schlumberger400% January 1967-September1969800% May 1970-December 1973
SCM Corp.500% June 1965-April 1966
Scott and Fetzer500%June1970-May 1972
Scott Foresman300% June 1964-June 1966
Scovill500% October 1962-April 1966
Seaboard Coast Line Industries300% July 1970-October 1971
Seaboard World Airlines350% June 1965-April 1966
Searle (G.D.)300% July 1970-July 1972
SEDCO600% July 1970-November 1972
Seven-Up300% April 1968-March 1970
Servomation300% June 1970-October 1971
Sheller-Globe300% December 1963-April 1965
Simmons Precision Products2500% February 1965-April 1966
Simplicity Pattern300% October 1966-October 1967
Skaggs Companies500% October 1966-October 1968
Skyline900% November 1962-September19632100% January 1967-December1968400% May 1970-October 1971
Smith International1000% August 1964-December1968
234
Sony400% July 1965-March 1966600% January 1968-November1969450% November 1971-January1973
Southland350% January 1967-December 1968
Southwest Forest Industries450% January 1968-April 1969
Spencer550% April 1968-January 1969
Sperry Rand300% October 1966-December1967
Sprague Electric400% June 1965-January 1967
Standard Brands Paint650% December 1966-February1970400% May 1970-February 1972
Stokely-Van Camp350% December 1966-Octobe1967
Sundstrand800% July 1965-December 1967
Sunshine Mining350% December 1963-September1964
Supermarkets General300% April 1964-February 1966300% May 1970-September 1971
Superscope500% October 1966-June 1967
Syntex2100% October 1962-January 1964350% June 1965-February 1966600% July 1970-March 1972
Systran Donner300% October 1966-December1967
Taft Broadcasting300% January 1964-JarHjary 1068300% July 1970-March Is971
Talley Industries450% February 1965-July 1966400% October 1966-September1967Tandy300% July 1964-May 1965500% November 1966-January1968300% March 1968-November 1969300% July 1970-February 1972
Tappan300% December 1967-December1968350% July 1970-April 1972
Technicolor300% October 1962-October 1963400% January 1967-July 1967
Teledyne400% July 1965-June 1966500% October 1966-October 1967
Teleprompter300% October 1966-May 1967
Telex300% October 1966-August 19671700% April 1969-January 1970
Tesoro Petroleum400% March 1968-December 1968
Texasgulf400% July 1963-April 1964
Texas Instruments700% October 1962-August 1966
Texas Oil & Gas400% September 1966-April 1968
Textron900% October 1962-December1967
Tidewater Marine Service1000% December 1962-December1964300% August 1970-March 1971
Time500% October 1962-December1965
Tokheim300% December 1966-June 1968300% December 1971-July 1972
Tonka900% October 1966-May 1968
Town & Country Mobile Homes800% March 1967-September 1968
Transamerica350% October 1966-December1968
Trans World Airlines750% October 1962-March 1965300% November 1970-April 1971
Transcon Lines300% July 1970-December 1971
TRE Corp.500% August 1966-February 1967700% August 1970-February 1972
Tropicana Products1400% May 1970-May 1972
Twin Fair1000% October 1966-February1968
Tyco Laboratories750% November 1966-January 1968300% November 1971-January 1972
Tyler500% August 1970-April 1972
UAL350% September 1964-April 1966350% July 1970-April 1971
Unarco300% June 1964-June 1965
United Aircraft350% February 1964-January 1966
United Brands1000% December 1966-January1968
United Financial of California300% September 1966-February1967300% December 1967-September1968
United Nuclear400% October «66-October 1967
235
United Piece Dye Works800% November 1962-August 19631000% October 1966-May 1968700% May 1970-March 1971
U.S. Filter400% June 1965-January 1966300% October 1966-May 1967
U.S. Industries400% October 1966-January 1968
U.S. Leasing400% October 1966-December1967450% August 1970-March 1972
U.S. Radium750% March 1964-November 1965
Unitrode300% December 1970-May 1972
Upjohn600% May 1970-August 1973
Uris Buildings500% December 1966-May 1969
UV Industries400% June 1962-February 1963350% August 1965-April 1966
Valley Metallurgical Processing1100% July 1965-February 1966500% October 1966-August 1967
Varian Associates400% June 1964-April 1966
Vetco Offshore Industries500% May 1970-April 1971400% August 1971-December 1973
Victor Comptometer350% April 1964-October 1965
Vornado500% December 1964-April 1966300% May 1970-March 1971
Wackenhut300% December 1966-December1967
Ward Foods350% December 1965-February1966600% October 1966-December1968
236
Watkins-Johnson600% October 1966-July 1968300% July 1970-March 1971
Webb (Del E.)700% December 1966-May 1969
Wells, Rich, Greene500% August 1970-March 1971
Western Airlines650% May 1962-May 1964500% July 1970-April 1971
Wheelabrator-Frye400% October 1966-August 1968
White Consolidated Industries1000% December 1963-August1966
Williams1100% February 1964-January1966400% October 1966-January 1968300% May 1970-April 1971
Winnebago Industries1200% December 1970-April 1972
Wyly3700% October 1966-November1968
Xerox700% June 1962-October 1964
XTRA1400% November 1964-April 1966600% October 1966-June 1968
Yates450% March 1968-March 1969
Zale600% December 1966-December1968
Zapata1100% April 1963-July 1966700% October 1966-July 1968300% July 1970-July 1971
Zayre800% February 1964-October 1965
Zurn700% November 1966-May 1968
Appendix BSuperperformance StocksOctober 1974-October 1976
During the two-year period following the bear marketlows of October and December 1974 there were 243stocks that had superperformance price action bytripling or more. The stocks were:
Abbott LaboratoriesAdams-MillisAddressograph-MultigraphAileenAircoAkzonaAlaska InterstateAlien GroupAllied StoresAllis-ChalmersAmbacAmcordAmerican Air FilterAmerican AirlinesAmerican BakeriesAmerican Building MaintenanceAmerican FamilyAmerican SeatingAmerican StandardAmpexAnthony IndustriesAPL Corp.Archer-Daniels-MidlandArlen Realty & DevelopmentAsamera OilAtlasAutomatic Data Processing
AvcoBaker IndustriesBangor PuntaBeckman InstrumentsBeech AircraftBendixBig Three IndustriesBlue BellBoise CascadeBrockway GlassBurns International SecurityServicesBurndyBurnup & SimsCaldorCapital Cities CommunicationsCentronics Data ComputerChemetronCluett, PeabodyCNA FinancialColemanCollins & AikmanColumbia PicturesCombustion Equipment AssociatesCompugraphicComputer SciencesCongoleumConrac

Consolidated FreightwaysCook UnitedCooper IndustriesCraneCrouse-HindsCTS Corp.CubicCurtiss-WrightDanaDart IndustriesData GeneralDayton HudsonDenny'sDeseret PharmaceuticalDiamond ShamrockDigital EquipmentDisney (Walt) ProductionsEagle-PichetEascoEastern Gas and Fuel AssociatesEdison Brothers StoresEMI Ltd.EnvirotechEthan AlienEvans ProductsFairchild Camera & InstrumentFalcon SeaboardFarahFeddersFederal SignalFieldcrest MillsFirst Charter FinancialFisher ScientificFleetwood EnterprisesFluorFort Howard PaperFranklin MintGCA Corp.General Cinema
238
General DevelopmentGeneral DynamicsGeneral InstrumentGeneral MedicalGeneral SignalGerber ProductsGino'sGray Drug StoresGreat Lakes ChemicalGulf & WesternGulf Resources and ChemicalGulton IndustriesHanesHanna MiningHarrisHeubleinHilton HotelsHoliday InnsHospital Corporation of AmericaHost InternationalHouse of FabricsHouston Natural GasHouston Oil & MineralsHoward JohnsonHumanaImperial Corporation of AmericaInternational RectifierIowa Beef ProcessorsIpco Hospital SupplyItekItelJim WalterJonathan LoganJoy ManufacturingKane MillerKaufman & BroadKidde (Walter)KoehringKoppers
Leaseway Transportation'LeesonaLevi StraussLevitz FurnitureLitton IndustriesLockheed AircraftLykesMacy (R. H.)Magic ChefMapcoMaremontMarleyMay Department StowsMCAMcCordMcKee (Arthur G.)McLean TruckingMelvilleMenasco ManufacturingMerrill LynchMervyn'sMetro-Goldwyn-MayerMetromediaMicrowave AssociatesMidland-RossMilgo ElectronicsMilton BradleyMobile Home IndustriesMoore McCormack ResourcesNarco Scientific IndustriesNational Medical CareNational SemiconductorNeptune InternationalNew ProcessNorris IndustriesNorthropNorthwest AirlinesNorton SimonNVF Co.
Occidental PetroleumOlinPan American World AirwaysPay Less Drug Stores NorthweslPetrolanePhilips IndustriesPickwick Internationa,PittstonPizza HutPonderosa SystemPurolatorRaymond InternationalRCAResearch-Co ttrellRevco D.S.RexnordRiegel TextileRio Grande IndustriesRite AidRockower BrothersRollinsRyan HomesRyder SystemSt. Joe MineralsSambo's RestaurantsSanders AssociatesSavin Business MachinesScott & FetzerSeaboard World AirlinesSeligman & LatzSeven-UpSheller-GlobeSimmonds Precision PrraiJuctiSSkaggsSmith InternationalSuperscopeTandyTektronixTeledyne
23g
TeleprompterTelexTiger InternationalTokheimTRE Corp.Trinity IndustriesTropicana ProductsTRWTwentieth Century-Rax FilmTyco LaboratoriesUnited BrandsUnited NuclearUnited RefiningU.& FilterU.S. ShoeUnited Technologies
UnivarValley IndustriesValmac IndustriesVarian AssociatesViacom InternationalWallace-MurrayWal-Mart StoresWarner CommunicationsWatkins-JohnsonWheelabrator-FryeWhite ConsolidatedWoolworth (F. W.)Yellow Freight SystemZayreZenith RadioZurn Industries
240