828 829 c29 co 874636 - mr. pelton sciencepeltonscience.weebly.com/uploads/4/6/7/2/46721149/...main...
TRANSCRIPT

Butterfly nebula
Pulsar
Supernova
BIG Idea The life cycle of every star is determined by its mass, luminosity, magni-tude, temperature, and composition.
29.1 The SunMAIN Idea The Sun contains most of the mass of the solar system and has many features typical of other stars.
29.2 Measuring the StarsMAIN Idea Stellar classifica-tion is based on measurement of light spectra, temperature, and composition.
29.3 Stellar EvolutionMAIN Idea The Sun and other stars follow similar life cycles, leaving the galaxy enriched with heavy elements.
GeoFacts
• The last gasp of a dying star, the Butterfly nebula erupts as a pair of jet exhausts.
• A runaway thermonuclear reac-tion results in a star exploding into a supernova, throwing matter away from the collapsed core.
• When a massive star collapses, it becomes a pulsar, a rapidly rotating object that has a mag-netic field a trillion times that of Earth.
828
Stars
(t)STScI/NASA/Science Source , (c)STScI/NASA/Science Source , (b)Mark Garlick/Photo Researchers , (bkgd)NASA/ESA/J. Hester/A. Loll
828_829_C29_CO_874636.indd 828828_829_C29_CO_874636.indd 828 2/12/07 3:49:12 PM2/12/07 3:49:12 PM

Section 1 • XXXXXXXXXXXXXXXXXX 829
Start-Up ActivitiesStart-Up Activities
ChromospherePhotosphere
Chapter 29 • Stars 829
LLAAUUNCH NCH LabLabHow can you observe sunspots?Although the Sun is an average star, it undergoes many complex processes. Sunspots are dark spots that are visible on the surface of the Sun. They can be observed moving across the face of the Sun as it rotates.
Procedure
WARNING: Do not look directly at the Sun. Do not look through the telescope at the Sun. You could damage your eyes.
1. Read and complete the lab safety form.2. Observe the Sun through the telescope that
your teacher has set up. Note that the tele-scope is pointed directly at the Sun, but the eyepiece is casting the shadow of the Sun on a clipboard.
3. Move the clipboard back and forth until you have the largest image of the Sun on the paper. Trace the outline of the Sun on your paper.
4. Trace sunspots that appear as dark areas on the Sun’s image. Repeat this step at the same time each day for a week.
5. Measure the movement of sunspots.
Analysis1. Calculate Use your data to determine the
Sun’s period of rotation.2. Determine What is the estimated rate
of motion of the largest sunspot?
STEP 1 Fold a sheet of paper in half lengthwise.
STEP 2 Cut along every third or fourth line of the top flap to form nine tabs.
STEP 3 Label the tabs as you read.
FOLDABLES Use this Foldable with Section 29.2. As you read this section, record key vocabulary terms and their definitions.
Stars Make the following Foldable that features the key vocabulary terms associated with stars.
Visit glencoe.com to
study entire chapters online;
explore animations:
• Interactive Time Lines
• • Interactive Figures
• • Interactive Tables
access Web Links for more information, projects, and activities;
review content with the Interactive Tutor and take Self-Check Quizzes.
828_829_C29_CO_874636.indd 829828_829_C29_CO_874636.indd 829 2/12/07 3:49:32 PM2/12/07 3:49:32 PM

Table 29.1Relative Propertiesof the Sun
Sun Earth Jupiter
Diameter (km) 1.4 × 10⁶ 1.3 × 10⁴ 1.4 × 10⁵
Mass (kg) 2.0 × 1030 6.0 × 1024 1.9 × 1027
Density (kg/m3) 1.4 × 10³ 5.5 × 10³ 1.3 × 10³
Interactive Table To explore more about the Sun, visit glencoe.com.
Objectives
◗ Describe the layers and features of the Sun.
◗ Explain the process of energy production in the Sun.
◗ Define the three types of spectra.
Review Vocabularymagnetic field: the portion of space near a magnetic or current-carrying body where magnetic forces can be detected
New Vocabularyphotospherechromospherecoronasolar windsunspotsolar flareprominencefusionfission
The Sun
MAIN Idea The Sun contains most of the mass of the solar system and has many features typical of other stars.
Real-World Reading Link Have you ever had a sunburn from being outside too long on a sunny day? The Sun is more than 150 million km from Earth, but the Sun’s rays are so powerful that humans still wear sunscreen for protection.
Properties of the SunThe Sun is the largest object in the solar system, in both diameter and mass. It would take 109 Earths, or almost 10 Jupiters, lined up edge to edge, to fit across the Sun. The Sun is about 330,000 times as massive as Earth and 1048 times the mass of Jupiter. In fact, the Sun contains more than 99 percent of all the mass in the solar sys-tem. It should not be surprising, then, that the Sun’s mass controls the motions of the planets and other objects.
The Sun’s average density is similar to the densities of the gas giant planets, represented by Jupiter in Table 29.1. Astronomers deduce densities at specific points inside the Sun, as well as other information, by using computer models that explain the observa-tions they make. These models show that the density in the center of the Sun is about 1.50 × 10⁵ kg/m3, which is about 13 times the density of lead. A pair of dice as dense as the Sun’s center would have a mass of about 1 kg.
Unlike lead, which is a solid, the Sun’s interior is gaseous throughout because of its high temperature — about 1 × 10⁷ K in the center. At this temperature, all of the gases are completely ion-ized, meaning the interior is composed only of atomic nuclei and electrons. This state of matter is known as plasma. Though partially ionized, the outer layers of the Sun are not hot enough to be plasma. The Sun produces the equivalent of 4 trillion trillion 100-W lightbulbs of light each second. The small amount that reaches Earth is equal to 1.35 kilowatt/m2.
Section 229.9.1 1
830 Chapter 29 • Stars
830_836_C29_S1_874636.indd 830830_836_C29_S1_874636.indd 830 2/12/07 3:51:01 PM2/12/07 3:51:01 PM

The Sun’s AtmosphereYou might ask how the Sun could have an atmosphere when it is already gaseous. The outer regions are organized into layers, like a planetary atmosphere separated into different levels, and each layer emits energy at wavelengths resulting from its temperature.
Photosphere The photosphere, shown in Figure 29.1, is the visible surface of the Sun. It is approximately 400 km thick and has an average temperature of 5800 K. It is also the innermost layer of the Sun’s atmosphere. You might wonder how it is the visible sur-face of the Sun if it is the innermost layer. This is because most of the visible light emitted by the Sun comes from this layer. The two outermost layers are transparent at most wavelengths of visible light. Additionally, the outermost two layers are dim in the wave-lengths they emit.
Reading Check Explain why the innermost layer of the Sun’s atmo-sphere is visible.
Chromosphere Outside the photosphere is the chromo-sphere, which is approximately 2500 km thick and has a tempera-ture of nearly 30,000 K. Usually, the chromosphere is visible only during a solar eclipse when the photosphere is blocked. However, astronomers can use special filters to observe the chromosphere when the Sun is not eclipsed. The chromosphere appears red, as shown in Figure 29.1, because its strongest emissions are in a sin-gle band in the red wavelength.
Corona The outermost layer of the Sun’s atmosphere, called the corona, extends several million kilometers from the outside edge of the chromosphere and has a temperature range of 1 million to 2 mil-lion K. The density of the gas in the corona is very low, which explains why the corona is so dim that it can be seen only when the photosphere is blocked by either special instruments, as in a corona-graph, or by the Moon during an eclipse, as shown in Figure 29.2. The temperature is so high in these outer layers of the solar atmo-sphere that most of the emitted radiation occurs at ultraviolet wave-lengths for the chromosphere, and X rays for the corona.
Section 1 • The Sun 831
■ Figure 29.1 Sunspots appear dark on the photosphere, the visible surface of the Sun. The chromosphere of the Sun appears red with promi-nences and flares suspended in the thin layer. The white-hot areas are almost 6000 K while the darker, red areas are closer to 3000 K.Deduce why the images look so different.
Photosphere Chromosphere
■ Figure 29.2 The Sun’s hottest and outermost layer, the corona, is not normally seen unless the disk of the Sun is blocked as by this solar eclipse.
(tl)K
ent
Woo
d/P
hoto
Res
earc
hers
, (t
c)S
OH
O (
ES
A &
NA
SA
) , (
br)F
red
Esp
enak
/Pho
to R
esea
rche
rs
830_836_C29_S1_874636.indd 831830_836_C29_S1_874636.indd 831 2/12/07 3:51:06 PM2/12/07 3:51:06 PM

Solar wind The corona of the Sun does not have an abrupt edge. Instead, gas flows outward from the corona at high speeds and forms the solar wind. As this wind of charged particles, called ions, flows outward through the entire solar system, it bathes each planet in a flood of parti-cles. At 1 AU — Earth’s distance from the Sun — the solar wind flows at a speed of about 400 km/s. The charged par-ticles are deflected by Earth’s magnetic field and are trapped in two huge rings, called the Van Allen belts. The high-energy particles in these belts collide with gases in Earth’s atmosphere and cause the gases to give off light. This light, called the aurora, can be seen from Earth or from space, as shown in Figure 29.3. The aurora are generally seen from Earth in the polar regions.
Solar ActivityWhile the solar wind and layers of the Sun’s atmosphere are permanent features, other features on the Sun change over time in a process called solar activity. Some of the Sun’s activity includes fountains and loops of glowing gas. Some of this gas has structure — a certain order in both time and place. This structure is driven by magnetic fields.
The Sun’s magnetic field and sunspots The Sun’s magnetic field disturbs the solar atmosphere periodi-cally and causes new features to appear. The most obvious features are sunspots, shown in Figure 29.4, which are dark spots on the surface of the photosphere. Sunspots are bright, but they appear darker than the surrounding areas on the Sun because they are cooler. They are located in regions where the Sun’s intense magnetic fields penetrate the photosphere. Magnetic fields create pressure that coun-teracts the pressure from the hot, surrounding gas. This stabilizes the sunspots despite their lower temperature. Sunspots occur in pairs with opposite magnetic polari-ties — with a north and a south pole similar to a magnet.
832 Chapter 29 • Stars
■ Figure 29.3 The aurora is the result of parti-cles from the Sun colliding with gases in Earth’s atmosphere. It is best viewed from regions around the poles of Earth. Infer When can you see the aurora?
Aurora from Earth
Aurora from space
■ Figure 29.4 Sunspots are dark spots on the surface of the photosphere. Each sunspot is accompa-nied by a bright, granular structure. The light and dark areas are associated with the Sun’s magnetic field. Sunspots typically last about two months.
(tl)H
inric
h B
Óse
man
n/dp
a/C
OR
BIS
, (c
l)NA
SA
/Pho
to R
esea
rche
rs ,
(br)
John
Chu
mac
k/P
hoto
Res
earc
hers
830_836_C29_S1_874636.indd 832830_836_C29_S1_874636.indd 832 2/12/07 3:51:09 PM2/12/07 3:51:09 PM

Solar activity cycle Astronomers have observed that the number of sunspots changes regularly, reaching a maximum number every 11.2 years. At this point, the Sun’s magnetic field reverses, so that the north magnetic pole becomes the south magnetic pole and vice versa. Because sunspots are caused by magnetic fields, the polarities of sunspot pairs reverse when the Sun’s magnetic poles reverse. Therefore, when the polarity of the Sun’s magnetic field is taken into account, the length of the cycle doubles to 22.4 years. Thus, the solar activity cycle starts with minimum spots and progresses to maximum spots. The magnetic field then reverses in polar-ity, and the spots start again at a minimum num-ber and progress to a maximum number. The magnetic field then switches back to the original polarity and completes the solar activity cycle.
Reading Check Determine how often the Sun’s magnetic poles reverse themselves.
Other solar features Coronal holes, only detectable in X-ray photography and shown in Figure 29.5, are often located over sunspot groups. Coronal holes are areas of low density in the gas of the corona and are the main regions from which the particles that comprise the solar wind escape.
Highly active solar flares are also associated with sunspots, as shown in Figure 29.5. Solar flares are violent eruptions of particles and radiation from the surface of the Sun. Often, the released particles escape the surface of the Sun in the solar wind and Earth gets bombarded with the particles a few days later. The largest recorded solar flare, which occurred in April 2001, hurled particles from the Sun’s surface at 7.2 million km/h.
Another active feature, sometimes associated with flares, is a prominence, which is an arc of gas that is ejected from the chromosphere, or is gas that condenses in the inner corona and rains back to the surface. Figure 29.5 shows an image of a prominence. Prominences can reach temper-atures greater than 50,000 K and can last from a few hours to a few months. Like flares, promi-nences are also associated with sunspots and the magnetic field, and occurrences of both vary with the solar-activity cycle.
Section 1 • The Sun 833
■ Figure 29.5 Features of the Sun’s surface include coronal holes into the surface and solar flares and prominences that erupt from the surface.
Solar prominence
Solar flares
Coronal holes
(t)S
OH
O (
ES
A &
NA
SA
) , (
c)S
OH
O (
ES
A &
NA
SA
) , (
b)D
etle
v va
n R
aven
swaa
y/P
hoto
Res
earc
hers
830_836_C29_S1_874636.indd 833830_836_C29_S1_874636.indd 833 2/12/07 3:51:13 PM2/12/07 3:51:13 PM

834 Chapter 29 • Stars
■ Figure 29.7 Energy excites the elements of a substance so that it emits different wave-lengths of light.Infer what the colors of a spectrum represent.
The Solar InteriorYou might be wondering where all the energy that causes solar activity and light comes from. Fusion occurs in the core of the Sun, where the pressure and temperature are extremely high. Fusion is the combination of lightweight, atomic nuclei into heavier nuclei, such as hydrogen fusing into helium. This is the opposite of the process of fission, which is the splitting of heavy atomic nuclei into smaller, lighter nuclei, like uranium into lead.
Energy production in the Sun In the core of the Sun, helium is a product of the process in which hydrogen nuclei fuse. The mass of the helium nucleus is less than the combined mass of the four hydrogen nuclei, which means that mass is lost during the process. Albert Einstein’s special theory of relativity shows that mass and energy are equivalent, and that matter can be converted into energy and vice versa. This relationship can be expressed as E = mc2, where E is energy measured in joules, m is the quantity of mass that is converted to energy measured in kilograms, and c is the speed of light measured in m/s. This theory explains that the mass lost in the fusion of hydrogen to helium is converted to energy, which powers the Sun. At the Sun’s rate of hydrogen fusing, it is about halfway through its lifetime, with approximately 5 billion years left. Even so, the Sun has used only about 3 percent of its hydrogen.
Energy transport If the energy of the Sun is produced in the core, how does it get to the surface before it travels to Earth? The answer lies in the two zones in the solar interior illustrated in Figure 29.6. In the inner portion of the Sun, extending to about 86 percent of its radius, energy is transferred by radiation. This is the radiation zone. Above that, in the convection zone, energy is transferred by gaseous convection currents. As energy moves out-ward, the temperature is reduced from a central value of about 1 × 10⁷ K to its photospheric value of about 5800 K. Leaving the Sun’s outermost layer, energy moves in a variety of wavelengths in all directions. A tiny fraction of that immense amount of solar energy eventually reaches Earth.
■ Figure 29.6 Energy in the Sun is transferred mostly by radiation from the core outward to about 86 percent of its radius. The outer layers transfer energy in convection currents.
Continuous spectrum
Absorption spectrum
Emission spectrumPrism
PrismThin cloud of cool gas
Source:a hot solid, liquid,
or dense gas
Prism
830_836_C29_S1_874636.indd 834830_836_C29_S1_874636.indd 834 2/12/07 3:51:17 PM2/12/07 3:51:17 PM

Based on Real Data*Interpret Data
Can you identify elements in a star? Astronomers study the composition of stars by observing their absorption spectra. Each element in a star’s outer layer produces a set of lines in the star’s absorption spec-trum. From the pattern of lines, astrono-mers can determine what elements are in a star.
Analysis1. Study the spectra of the four elements.2. Examine the spectra for the Sun and
the mystery star.3. To identify the elements of the Sun
and the mystery star, use a ruler to help you line up the spectral lines with the known elements.
Think Critically4. Identify the elements that are present
in the part of the absorption spectrum shown for the Sun.
5. Identify the elements that are present in the absorption spectrum for the mys-tery star.
6. Determine which elements are common to both stars.
*James B. Kaler. Professor Emeritus of Astronomy. University of Illinois. 1998.
Data Analysis labData Analysis labSolar energy on Earth The quantity of energy that arrives on Earth every day from the Sun is enormous. Above Earth’s atmosphere, 1354 J of energy is received in 1 m2/s (1354 W/m2). In other words, 13 100-W lightbulbs could be oper-ated with the solar energy that strikes a 1-m2 area. However, not all of this energy reaches the ground because some is absorbed and scattered by the atmosphere, as you learned in Chapter 11.
SpectraYou are probably familiar with the rainbow that appears when white light is shined through a prism. This rainbow is a spectrum (plural, spec-tra), which is visible light arranged according to wavelengths. There are three types of spectra: continuous, emission, and absorption, as shown in Figure 29.7.
A spectrum that has no breaks in it, such as the one produced when light from an ordinary bulb is shined though a prism, is called a continuous spec-trum. A continuous spectrum can also be pro-duced by a glowing solid or liquid, or by a highly compressed, glowing gas. The spectrum from a noncompressed gas contains bright lines at certain wavelengths. This is called an emission spectrum, and the lines are called emission lines. The wave-lengths of the visible lines depend on the element being observed because each element has its own characteristic emission spectrum.
Reading Check Describe continuous and emission spectra.
A spectrum produced from the Sun’s light shows a series of dark bands. These dark spectral lines are caused by different chemical elements that absorb light at specific wavelengths. This is called an absorption spectrum, and the lines are called absorption lines. Absorption is caused by a cooler gas in front of a source that emits a continu-ous spectrum. The pattern of the dark absorption lines of an element is exactly the same as the bright emission lines for that same element. Thus, by comparing laboratory spectra of different gases with the dark lines in the solar spectrum, it is pos-sible to identify the elements that make up the Sun’s outer layers. You will experiment with identi-fying spectral lines in the GeoLab at the end of this chapter.
Section 1 • The Sun 835
Hydrogen
Helium
Sodium
Calcium
Sun
Mystery star
830_836_C29_S1_874636.indd 835830_836_C29_S1_874636.indd 835 2/12/07 3:51:19 PM2/12/07 3:51:19 PM

Self-Check Quiz glencoe.com
Solar CompositionAlthough scientists cannot take samples from the Sun directly, they have learned a great deal about the Sun from its spectra. Using the lines of the absorption spectra like fingerprints, astronomers have identified the elements that compose the Sun. Sixty or more elements have been identified as solar components. The Sun consists of hydrogen (H), at about 70.4 percent by mass, helium, (He) 28 percent, and a small amount of other elements, as illustrated in Figure 29.8. This composition is similar to that of the gas giant planets. It sug-gests that the Sun and the gas giants represent the composi-tion of the interstellar cloud from which the solar system formed. While the terrestrial planets have lost most of the lightweight gases, as you learned in Chapter 28, their heavier element composition probably came from a contribution to the interstellar cloud of by-products from long extinct stars.
The Sun’s composition represents that of the galaxy as a whole. Most stars have proportions of the elements similar to the Sun. Hydrogen and helium are the predominant gases in stars, and in the rest of the universe. Even dying stars still have hydrogen and helium in their outer layers since their internal temperatures might only fuse about 10 percent of their total hydrogen into helium. All other elements are in small propor-tions compared to hydrogen and helium. The larger the star’s mass at its inception, the more heavy elements it will produce in its lifetime. But, as you will read in this chapter, there are different results when a star dies. As stars die, they return as much as 50 percent of their mass back into interstellar space, to be recycled into new generations of stars and planets.
836 Chapter 29 • Stars
Section 2299..11 AssessmentSection Summary ◗◗ Most of the mass in the solar system
is found in the Sun.
◗◗ The Sun’s average density is approxi-mately equal to that of the gas giant planets.
◗◗ The Sun has a layered atmosphere.
◗◗ The Sun’s magnetic field causes sun-spots and other solar activity.
◗◗ The fusion of hydrogen into helium provides the Sun’s energy and composition.
◗◗ The different temperatures of the Sun’s outer layers produce different spectra.
Understand Main Ideas1. MAIN Idea Identify which features of the Sun are typical of stars.
2. Describe the outer layers of gas above the Sun’s visible surface.
3. Classify the different types of spectra by how they are created.
4. Describe the process of fusion in the Sun.
5. Compare the composition of the Sun in Figure 29.8 to the gas giant planets composition in Chapter 28.
Think Critically6. Infer how the Sun would affect Earth if Earth did not have a magnetic field.
7. Relate the solar activity cycle with solar flares and prominences.
Earth Science
8. Create a trifold brochure relating the layers and characteristics of the Sun.
Element Composition of the Sun by Mass
O 0.756%C 0.278%Ne 0.169%Fe 0.123%N 0.0814%Si 0.0696%Mg 0.0645%S 0.0479%
He 28%
H 70.4%
■ Figure 29.8 The Sun is composed primar-ily of hydrogen and helium with small amounts of other gases.
830_836_C29_S1_874636.indd 836830_836_C29_S1_874636.indd 836 2/12/07 3:51:21 PM2/12/07 3:51:21 PM

OrionHercules
Northernhemisphere
summer
Sun
Northernhemisphere
winter
Section 2 • Measuring the Stars 837
Section 2299..2 2
Objectives
◗ Determine how distances between stars are measured.
◗ Distinguish between brightness and luminosity.
◗ Identify the properties used to classify stars.
Review Vocabularywavelength: the distance from one point on a wave to the next corresponding point
New Vocabularyconstellationbinary starparallaxparsecapparent magnitudeabsolute magnitudeluminosityHertzsprung-Russell diagrammain sequence
Measuring the Stars
MAIN Idea Stellar classification is based on measurement of light spectra, temperature, and composition.
Real-World Reading Link As you ride in a car on the highway at night and as a car approaches you, its lights seem to get larger and brighter. Distant stars might be just as large and just as bright as nearer ones, but the distance causes them to appear small and dim.
Groups of StarsLong ago, many civilizations looked at the brightest stars and named groups of them after animals, mythological characters, or everyday objects. These groups of stars are called constellations. Today, astronomers group stars by the 88 constellations named by ancient peoples. Some constellations are visible throughout the year, depending on the observer’s location. In the northern hemi-sphere, you can see constellations that appear to rotate around the north pole. These constellations are called circumpolar constella-tions. Ursa Major, also known as the Big Dipper, is a circumpolar constellation for the northern hemisphere.
Unlike circumpolar constellations, the other constellations can be seen only at certain times of the year because of Earth’s changing position in its orbit around the Sun, as illustrated in Figure 29.9. For example, the constellation Orion can be seen only in the north-ern hemisphere’s winter, and the constellation Hercules can be seen only in the northern hemisphere’s summer. For this reason, constel-lations are classified as summer, fall, winter, and spring constella-tions. The most familiar constellations are the ones that are part of the zodiac. These twelve constellations lie in the ecliptic plane along the same path where the planets are seen. Different constellations can be seen in the northern and southern hemispheres, but the zodiac can be seen in both. Ancient people used the constellations to know when to prepare for planting, harvest, and ritual celebrations.■ Figure 29.9 Different constellations are
visible in the sky due to Earth’s movement around the Sun.
FOLDABLES
Incorporate information from this section into
your Foldable.
837_846_C29_S2_874636.indd 837837_846_C29_S2_874636.indd 837 2/12/07 3:54:24 PM2/12/07 3:54:24 PM

838 Chapter 29 • Stars
■ Figure 29.10 Star clusters are groups of stars that are gravitationally bound to one another. The Pleiades is an open cluster group and M13 is a globular cluster.
Pleiades M13
■ Figure 29.11 Sirius and its com-panion star are the simplest form of stellar grouping, known as a binary.
Star clusters Although the stars in constellations appear to be close to each other, few are gravitationally bound to one other. The reason that they appear to be close together is that human eyes cannot distinguish how far or near stars are. Two stars could appear to be located next to each other in the sky, but one might be 1 trillion km from Earth, and the other might be 2 trillion km from Earth. However, by measuring distances to stars and observ-ing how their gravities interact with each other, scientists can determine which stars are gravitationally bound to each other. A group of stars that are gravitationally bound to each other is called a cluster. The Pleiades (PLEE uh deez) in the constellation Taurus, shown in Figure 29.10, is an open cluster because the stars are not densely packed. In contrast, a globular cluster is a group of stars that are densely packed into a spherical shape, such as M13 in the constellation Hercules, also shown in Figure 29.10. Different kinds of clusters are explained in Figure 29.12.
Reading Check Distinguish between open and globular clusters.
Binaries When only two stars are gravitationally bound together and orbit a common center of mass, they are called binary stars. More than half of the stars in the sky are either binary stars or members of multiple-star systems. The bright star Sirius is half of a binary system, shown in Figure 29.11. Most binary stars appear to be single stars to the human eye, even with a telescope. The two stars are usually too close together to appear separately, and one of the two is often much brighter than the other. Astronomers are able to identify binary stars through the use of several methods. For example, even if only one star is visible, accu-rate measurements can show that its position shifts back and forth as it orbits the center of mass between it and the unseen compan-ion star. Also, the orbital plane of a binary system can sometimes be seen edgeways from Earth. In such cases, the two stars alter-nately block each other and cause the total brightness of the two-star system to dip each time one star eclipses the other. This type of binary star is called an eclipsing binary.
(tl)C
hris
Coo
k/P
hoto
Res
earc
hers
, (t
r)Jo
hn C
hum
ack/
Pho
to R
esea
rche
rs ,
(bl)N
AS
A/H
.E.
Bon
d/E
. N
elan
/M.
Bar
stow
/M.
Bur
leig
h/J.
B.
Hol
berg
837_846_C29_S2_874636.indd 838837_846_C29_S2_874636.indd 838 2/12/07 3:54:30 PM2/12/07 3:54:30 PM

Galaxy Not a true cluster, a galaxy is a very large star grouping that contains a variety of different clusters of stars. Globular clusters are made from densely
packed groups of stars that are the same age. Their gravities hold them into a rounded cluster. Many globular clusters are found in the haloes of galaxies.
Open clusters are loosely organized groups of stars that are not densely packed. These two open clusters in Perseus are young, and contain a mixture of stellar types from stars dimmer than the Sun to giants and supergiants.
Binaries are the smallest of all star groupings, consisting of only two stars orbiting around a single center of gravity.
Section 2 • Measuring the Stars 839
Visualizing Star Groupings
Figure 29.12 When you look into the night sky, the stars seem to be randomly spaced from horizon to horizon. Upon closer inspection, you begin to see groups of stars that seem to cluster in one area. Star clusters are gravitationally bound groups of stars, which means that their gravities interact to hold the stars in a group.
To explore more about star group-ings, visit glencoe.com.
(tl)Jason T. Ware/Photo Researchers , (tr)L. Dodd/Photo Researchers, (c)Stephen & Donna O’Meara/Photo Researchers, (bl)John Chumac/Photo Researchers , (br)SPL/Photo Researchers
837_846_C29_S2_874636.indd 839837_846_C29_S2_874636.indd 839 2/12/07 3:54:36 PM2/12/07 3:54:36 PM
840 Chapter 29 • Stars
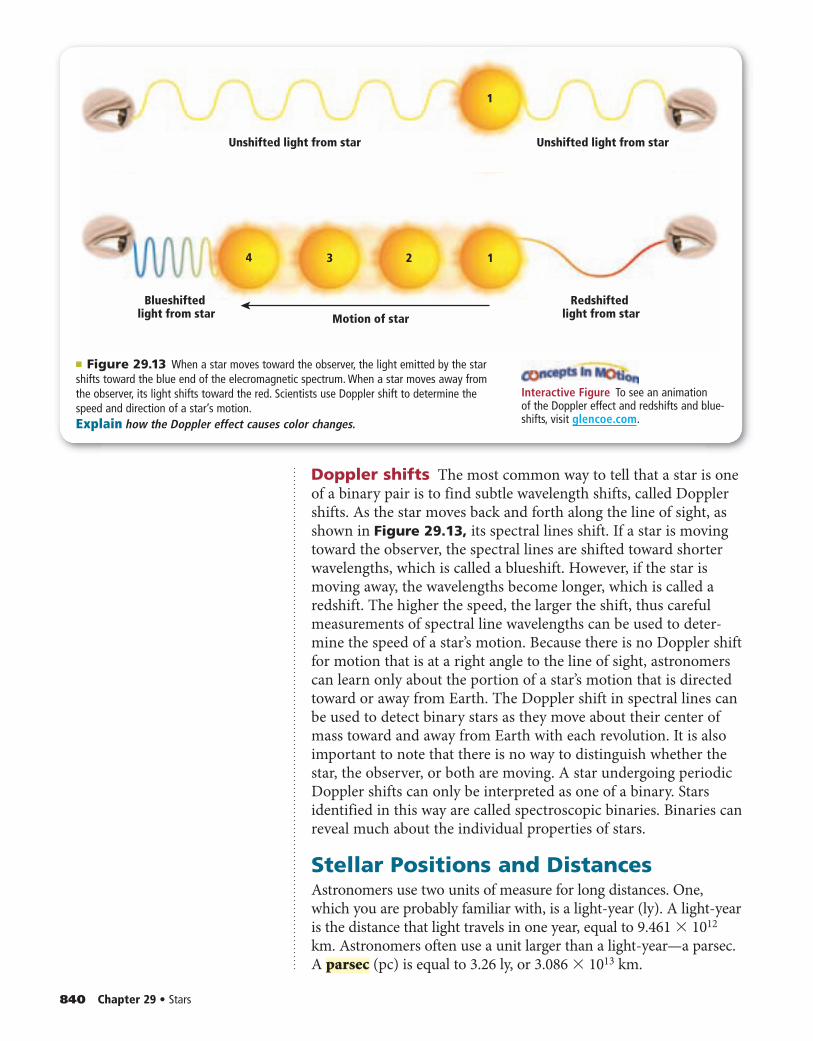
Doppler shifts The most common way to tell that a star is one of a binary pair is to find subtle wavelength shifts, called Doppler shifts. As the star moves back and forth along the line of sight, as shown in Figure 29.13, its spectral lines shift. If a star is moving toward the observer, the spectral lines are shifted toward shorter wavelengths, which is called a blueshift. However, if the star is moving away, the wavelengths become longer, which is called a redshift. The higher the speed, the larger the shift, thus careful measurements of spectral line wavelengths can be used to deter-mine the speed of a star’s motion. Because there is no Doppler shift for motion that is at a right angle to the line of sight, astronomers can learn only about the portion of a star’s motion that is directed toward or away from Earth. The Doppler shift in spectral lines can be used to detect binary stars as they move about their center of mass toward and away from Earth with each revolution. It is also important to note that there is no way to distinguish whether the star, the observer, or both are moving. A star undergoing periodic Doppler shifts can only be interpreted as one of a binary. Stars identified in this way are called spectroscopic binaries. Binaries can reveal much about the individual properties of stars.
Stellar Positions and DistancesAstronomers use two units of measure for long distances. One, which you are probably familiar with, is a light-year (ly). A light-year is the distance that light travels in one year, equal to 9.461 × 10¹² km. Astronomers often use a unit larger than a light-year—a parsec. A parsec (pc) is equal to 3.26 ly, or 3.086 × 10¹³ km.
Unshifted light from star Unshifted light from star
Blueshiftedlight from star
Redshiftedlight from star
1
1234
Motion of star
■ Figure 29.13 When a star moves toward the observer, the light emitted by the star shifts toward the blue end of the elecromagnetic spectrum. When a star moves away from the observer, its light shifts toward the red. Scientists use Doppler shift to determine the speed and direction of a star’s motion. Explain how the Doppler effect causes color changes.
Interactive Figure To see an animation of the Doppler effect and redshifts and blue-shifts, visit glencoe.com.
837_846_C29_S2_874636.indd 840837_846_C29_S2_874636.indd 840 2/12/07 3:54:45 PM2/12/07 3:54:45 PM

Section 2 • Measuring the Stars 841
Parallax Precise position measurements are important for deter-mining distances to stars. When estimating the distance of stars from Earth, astronomers must account for the fact that nearby stars shift in position as observed from Earth. This apparent shift in position caused by the motion of the observer is called parallax. In this case, the motion of the observer is the change in position of Earth as it orbits the Sun. As Earth moves from one side of its orbit to the opposite side, a nearby star appears to be shifting back and forth, as illustrated in Figure 29.14. The closer the star, the larger the shift. The distance to a star can be estimated from its parallax shift by measuring the angle of the change. A pc is defined as the distance at which an object has a parallax of 1 arcsecond. Using the parallax technique, astronomers could find accurate distances to stars up to only 100 pc, or approximately 300 ly, until recently. With advancements in technology, such as the Hipparcos satellite, astronomers can find accurate distances up to 500 pc by using parallax.
Reading Check Identify the motion of the observer in the diagram.
Basic Properties of StarsThe basic properties of a star are mass, diameter, and luminosity, which are all related to each other. Temperature is another prop-erty and is estimated by finding the spectral type of a star. Temperature controls the nuclear reaction rate and governs the lumi-nosity, or apparent magnitude. The absolute magnitude compared to the apparent magnitude is used to find the distance to a star.
■ Figure 29.14 As Earth orbits the Sun, nearby stars appear to change position in the sky com-pared to faraway stars. Earth reaches its maximum change in position at six months, so the angle measured to the star from these two positions is also at the maximum. This shift in observation position is called parallax and can be used to estimate the distance to the star being observed.Predict the position of the star in September.
VOCABULARYACADEMIC VOCABULARY
Preciseexactly or sharply defined or statedThe builder’s accurate measurements ensured that all of the boards were cut to the same, precise length.
July
July
Background stars
Nearbystar
Earth in July
Sun
Earth in January
January
Interactive Figure To see an animation of parallax, visit glencoe.com.
837_846_C29_S2_874636.indd 841837_846_C29_S2_874636.indd 841 2/12/07 3:54:46 PM2/12/07 3:54:46 PM

Apparent magnitudesPluto
Limit with binoculars
Naked-eye limit
UranusSirius
Venus Full moon Sun
Pluto
Dim+40 +35 +30 +25 +20 +15 +10 +5 0 –5 –10 –15 –20 –25 –30 –35 –40
Bright
VenusUranus
Full moon
Most luminous starsMost luminous galaxies
Absolute magnitudes
SiriusSun
842 Chapter 29 • Stars
Magnitude One of the most basic observable properties of a star is how bright it appears, or the apparent magnitude. The ancient Greeks established a classification system based on the brightness of stars. The brightest stars were given a ranking of +1, the next brightest +2, and so on. Today’s astronomers still use this system, but they have refined it. In this system, a difference of 5 magnitudes corresponds to a factor of 100 in brightness. Thus, a magnitude +1 star is 100 times brighter than a magnitude +6 star.
Absolute magnitude Apparent magnitude does not indicate the actual brightness of a star because it does not account for distance. A faint star can appear to be very bright because it is relatively close to Earth, while a bright star can appear to be faint because it is far away. To account for these phenomena, astronomers have developed another classification system for brightness. Absolute magnitude is how bright a star would appear if it were placed at a distance of 10 pc. The classification of stars by absolute magnitude allows comparisons that are based on how bright the stars would appear at equal distances from an observer. The disadvantage of absolute magnitude is that it can be calculated only when the actual distance to a star is known. The apparent and absolute magnitudes for several objects are shown in Figure 29.15.
Luminosity Apparent magnitudes do not give an actual measure of energy output. To measure the energy output from the surface of a star per second, called its power or luminosity, an astronomer must know both the star’s apparent magnitude and how far away it is. The brightness observed depends on both a star’s luminosity and distance from Earth, and because brightness diminishes with the square of the distance, a correction must be made for distance. Luminosity is measured in units of energy emitted per second, or watts. The Sun’s luminosity is about 3.85 × 1026 W. This is equiva-lent to 3.85 × 1024 100-W lightbulbs. The values for other stars vary widely, from about 0.0001 to more than 1 million times the Sun’s luminosity. No other stellar property varies as much.
■ Figure 29.15 Apparent magnitude is how bright the stars and planets appear in the sky from Earth. Absolute magnitude takes into account the distance to that star or planet and makes adjustments for distance.
VOCABULARYSCIENCE USAGE V. COMMON USAGE
MagnitudeScience usage: a number representing the apparent brightness of a celestial body
Common usage: the importance, quality, or caliber of something
837_846_C29_S2_874636.indd 842837_846_C29_S2_874636.indd 842 2/12/07 3:54:47 PM2/12/07 3:54:47 PM

Section 2 • Measuring the Stars 843
Classification of Stars You have learned that the Sun has dark absorption lines at specific wavelengths in its spectrum. Other stars also have dark absorption lines in their spectra and are classified according to their patterns of absorp-tion lines. Spectral lines provide information about a star’s composition and temperature.
Temperature Stars are assigned spectral types in the following order: O, B, A, F, G, K, and M. Each class is subdivided into more specific divisions with num-bers from 0 to 9. For example, a star can be classified as being a type A4 or A5. The classes were originally based only on the pattern of spectral lines, but astronomers later discovered that the classes also correspond to stellar temperatures, with the O stars being the hottest and the M stars being the coolest. Thus, by examination of a star’s spec-tra, it is possible to estimate its temperature.
The Sun is a type G2 star, which corresponds to a surface temperature of about 5800 K. Surface temperatures range from about 50,000 K for the hottest O stars to as low as 2000 K for the coolest M stars. Figure 29.16 shows how spectra from some different star classes appear.
Temperature is also related to luminosity and abso-lute magnitude. Hotter stars put out more light than stars with lower temperatures. In most normal stars, the temperature corresponds to the luminosity. Since the temperature is not affected by its distance, by mea-suring the temperature and luminosity, distance is known.
Model ParallaxHow does parallax angle change with distance? If a star is observed at six-month intervals in its orbit, it will appear to have moved because Earth is 300 million km away from the location of the first observation. The angle to the star is different and the apparent change in position of the star is called parallax.
Procedure 1. Read and complete the lab safety form.2. Place a meterstick at a fixed position and
attach a 4-m piece of string to each end.3. Stand away from the meterstick and hold
the two strings together to form a triangle. Be sure to hold the strings taut. Measure your distance from the meterstick. Record your measurement.
4. Measure the angle between the two pieces of string with a protractor. Record your measurement of the angle.
5. Repeat Steps 3 and 4 for different distances from the meterstick by shortening or lengthening the string.
6. Make a graph of the angles versus their distance from the meterstick.
Analysis1. Interpret what the length of the meter-
stick represents. What does the angle represent?
2. Analyze what the graph shows. How does parallax angle depend on distance?
3. Explain how the angles that you measured are similar to actual stellar parallax angles.■ Figure 29.16 These are typical absorption spectra of a class B5
star, class F5 star, class K5 star, and a class M5 star. The black stripes are absorption lines telling us each star’s element composition.
B5
F5
K5
M5
Mat
t M
eado
ws
837_846_C29_S2_874636.indd 843837_846_C29_S2_874636.indd 843 2/12/07 3:54:47 PM2/12/07 3:54:47 PM

844 Chapter 29 • Stars
Table 29.2 Relationships of Spectral Types of Stars
Color of Star Spectral Type H-R diagram
O5
B5
F5
G5
M5
Interactive Table To explore more about main-sequence stars, visit glencoe.com.
O5
+15
+10
+5
Sun
Abs
olut
e m
agni
tude
0
–5
B0 B5 A0 A5 F0 F5
Spectral type
G0 G5 K0 K5 M0 M5
40,000 10,000 7000 6000 5000 3000
Surface temperature (K)
Whitedwarfs
Giants
Supergiants
Main sequence
837_846_C29_S2_874636.indd 844837_846_C29_S2_874636.indd 844 2/12/07 3:54:51 PM2/12/07 3:54:51 PM

Section 2 • Measuring the Stars 845
Composition All stars, including the Sun, have nearly identical compositions, despite the differences in their spectra, shown in Table 29.2. The differences in the appearance of their spectra are almost entirely a result of temperature differences. Hotter stars have fairly simple visible spectra, while cooler stars have spectra with more lines. The coolest stars have bands in their spectra due to molecules such as titanium oxide in their atmospheres. Typically, about 73 percent of a star’s mass is hydrogen (H), about 25 percent is helium (He), and the remaining 2 percent is com-posed of all the other elements. While there are some variations in the composition of stars, particularly in the final 2 percent, all stars have this general composition.
H-R diagrams The properties of mass, luminosity, tempera-ture, and diameter are closely related. Each class of star has a specific mass, luminosity, magnitude, temperature, and diameter. These relationships can be demonstrated on a graph called the Hertzsprung-Russell diagram (H-R diagram) on which absolute magnitude is plotted on the vertical axis and temperature or spec-tral type is plotted on the horizontal axis, as shown in Table 29.2.Spectroscopists first plotted this graph in the early twentieth cen-tury. An H-R diagram with luminosity plotted on the vertical axis looks similar to the one in Table 29.2 and is used to calculate the evolution of stars.
Most stars occupy the region in the diagram called the main sequence, which runs diagonally from the upper-left corner, where hot, luminous stars are represented, to the lower-right cor-ner, where cool, dim stars are represented. Table 29.3 shows some properties of main-sequence stars.
Table 29.3Properties of Main- Sequence Stars
Spectral Type Mass*
Surface Temperature
(K)Luminosity* Radius*
O5 40.0 40,000 5 × 10⁵ 18.0
B5 6.5 15,500 800 3.8
A5 2.1 8500 20 1.7
F5 1.3 6580 2.5 1.2
G5 0.9 5520 0.8 0.9
K5 0.7 4130 0.2 0.7
M5 0.2 2800 0.008 0.3
Interactive Table To explore more about main-sequence star properties, visit glencoe.com.
Careers In Earth Science
Spectroscopist The main job of an astronomer is to select the stars and objects to observe, but there are other scientists who are affiliated with an observatory. Scientists who make and analyze the spectra from stars are called spectroscopists. To learn more about Earth science careers, visit glencoe.com.
* These properties are relative to the Sun.
837_846_C29_S2_874636.indd 845837_846_C29_S2_874636.indd 845 2/12/07 3:55:07 PM2/12/07 3:55:07 PM

Self-Check Quiz glencoe.com846 Chapter 29 • Stars
Section 2299..22 AssessmentSection Summary◗◗ Stars exist in clusters held together
by their gravity.
◗◗ The simplest cluster is a binary.
◗◗ Parallax is used to measure distances to stars.
◗◗ The brightness of stars is related to their temperature.
◗◗ Stars are classified by their spectra.
◗◗ The H-R diagram relates the basic properties of stars: class, tempera-ture, and luminosity.
Understand Main Ideas1. MAIN Idea Relate the stellar temperature to the classification of a star.
2. Explain the difference between apparent and absolute magnitudes.
3. Explain how parallax is used to measure the distance to stars.
4. Compare and contrast luminosity and magnitude.
5. Contrast the apparent magnitude and the absolute magnitude of a star.
6. Compare a light-year and a parsec.
Think Critically 7. Design a model to explain parallax.
8. Explain the relationship between radius and mass using Table 29.3.
Earth ScienceMATH in9. Compare Orion’s brightest stars, Rigel (O class) and Betelguise (M class), by mass,
temperature, luminosity, and radius, using Table 29.3 as a reference.
Main sequence About 90 percent of stars, including the Sun, fall along a broad strip of the H-R diagram called the main sequence. While stars are in the main sequence, they are fusing hydrogen in their cores. The interrelatedness of the properties of these stars indicates that all these stars have similar internal structures and functions. As stars evolve off the main sequence, they begin to fuse helium in their cores and burn hydrogen around the core edges.
The Sun lies near the center of the main sequence, being of aver-age temperature and luminosity. A star’s mass determines almost all its other properties, including its main-sequence lifetime. The more massive a star is, the higher its central temperature and the more rapidly it burns its hydrogen fuel. This is due primarily to the ratio of radiation pressure to gravitational pressure. Higher pressures cause the fuels to burn faster. As a consequence, the star runs out of hydro-gen faster than a lower-mass star.
Red giants and white dwarfs The stars plotted at the upper right of the H-R diagram in Table 29.2 are cool, yet luminous. Because cool surfaces emit much less radiation per square meter than hot surfaces do, these cool stars must have large surface areas to be so bright. For this reason, these larger, cool, luminous stars are called red giants. Red giants are so large — more than 100 times the size of the Sun in some cases — that Earth would be swallowed up if the Sun were to become a red giant! Conversely, the dim, hot stars plotted in the lower-left corner of the H-R diagram must be small, or they would be more luminous. These small, dim, hot stars are called white dwarfs. A white dwarf is about the size of Earth but has a mass about as large as the Sun’s. You will learn how all the different stars are formed in Section 29.3.
837_846_C29_S2_874636.indd 846837_846_C29_S2_874636.indd 846 2/12/07 3:55:10 PM2/12/07 3:55:10 PM

Pressure fromthe heat of
nuclear reactionsand compression
Gravity
■ Figure 29.17 When the pressure from radiation and fusion is balanced by gravity, a star is stable and will not expand or contract.
Section 3 • Stellar Evolution 847
Section 2299..33
Objectives
◗ Determine the effect of mass on a star’s evolution.
◗ Identify the features of massive and regular star life cycles.
◗ Explain how the universe is affected by the life cycles of stars.
Review Vocabularyevolution: a radical change in com-position over a star’s lifetime
New Vocabularynebulaprotostarneutron starpulsarsupernovablack hole
Stellar Evolution
MAIN Idea The Sun and other stars follow similar life cycles, leav-ing the galaxy enriched with heavy elements.
Real-World Reading Link A campfire glows brightly as long as it has fuel to burn. When the fuel is depleted, the light becomes dimmer, and the fire extin-guishes. Unlike a campfire, stars shine because of nuclear reactions in their inte-rior. Stars also die out when their nuclear fuel is gone.
Basic Structure of StarsMass governs a star’s temperature, luminosity, and diameter. In fact, astronomers have discovered that the mass and the composi-tion of a star determine nearly all its other properties.
Mass effects The more massive a star is, the greater the gravity pressing inward, and the hotter and more dense the star must be inside to balance its own gravity. The temperature inside a star governs the rate of nuclear reactions, which in turn determines the star’s energy output—its luminosity. The balance between gravity squeezing inward and outward pressure is maintained by heat due to nuclear reactions and compression. This balance is called hydro-static equilibrium and it must hold for any stable star, as illustrated in Figure 29.17, otherwise the star would expand or contract. This balance is governed by the mass of a star.
Fusion Inside a star, conditions vary in much the same way that they do inside the Sun. The density and temperature increase toward the center, where energy is generated by nuclear fusion. Stars on the main sequence produce energy by fusing hydrogen into helium, as the Sun does. Stars that are not on the main sequence either fuse elements other than hydrogen in their cores or do not undergo fusion at all.
Stellar EvolutionA star changes as it ages because its internal composition changes as nuclear-fusion reactions in the star’s core convert one element into another. With a change in the core composition, the star’s density increases, its temperature rises, and its luminosity increases. As long as the star is stable and converting hydrogen to helium, it is consid-ered a main-sequence star. Eventually, when the nuclear fuel runs out, the star’s internal structure and mechanism for producing pres-sure must change to counteract gravity. The changes a star under-goes during its evolution begin with its formation.
847_851_C29_S3_874636.indd 847847_851_C29_S3_874636.indd 847 2/12/07 3:58:30 PM2/12/07 3:58:30 PM

848 Chapter 29 • Stars
Star formation All stars form in much the same manner as the Sun did. The formation of a star begins with a cloud of inter-stellar gas and dust, called a nebula (plural, nebulae), which col-lapses on itself as a result of its own gravity. As the cloud contracts, its rotation forces it into a disk shape with a hot, condensed object at the center, called a protostar, as illustrated in Figure 29.18. Friction from gravity continues to increase the temperature of the protostar, until the condensed object reaches the ignition tempera-ture for nuclear reactions and becomes a new star. A protostar is brightest at infrared wavelengths.
Reading Check Infer what causes the disk shape to form.
Fusion begins When the temperature inside a protostar becomes hot enough, nuclear fusion reactions begin. The first reaction to ignite is always the conversion of hydrogen to helium. Once this reaction begins, the star becomes stable because it then has sufficient internal heat to produce the pressure needed to bal-ance gravity. The object is then truly a star and takes its place on the main sequence according to its mass. A new star often illumi-nates the gas and dust surrounding it, as shown in Figure 29.19.
Life Cycles of Stars Like the SunWhat happens next during a star’s life cycle depends on its mass. For example, as a star like the Sun converts hydrogen into helium in its core, it gradually becomes more luminous because the core density and temperature rise slowly and increase the reaction rate. It takes about 10 billion years for a star with the mass of the Sun to convert all of the hydrogen in its core into helium. Thus, such a star has a main-sequence lifetime of 10 billion years. From here, the next step in the life cycle of a small mass star is to become a red giant.
Infalling material
Rotating disk
Protostar
■ Figure 29.18 Temperatures will con-tinue to build as gravity pulls the infalling matter to the center of the rotating disk. The center region is a protostar until fusion initiates and a star ignites.Infer what happens to the remaining material in the disk.
■ Figure 29.19 Using the Spitzer telescope’s infrared wavelengths, proto-stars are imaged inside the Elephant Trunk nebula.
Interactive Figure To see an animation of star formation, visit glencoe.com.
NASA/Photo Researchers
847_851_C29_S3_874636.indd 848847_851_C29_S3_874636.indd 848 2/12/07 3:58:34 PM2/12/07 3:58:34 PM

Section 3 • Stellar Evolution 849
Red giant Only about the innermost 10 percent of a star’s mass can undergo nuclear reactions because temperatures out-side of this core never become hot enough for reactions to occur. Thus, when the hydrogen in its core is gone, a star has a helium center and outer layers made of hydrogen-dominated gas. Some hydrogen continues to react in a thin layer at the outer edge of the helium core, as illustrated in Figure 29.20. The energy pro-duced in this layer forces the outer layers of the star to expand and cool. The star then becomes a red giant because its luminos-ity increases while its surface temperature decreases due to the expansion.
While the star is a red giant, it loses gas from its outer layers. The star is so large that its surface gravity is low, and thus the outer layers can be released by small expansions and contrac-tions, or pulsations, of the star due to instability. Meanwhile, the core of the star becomes hot enough, at 100 million K, for helium to react and form carbon. The star contracts back to a more nor-mal size, where it again becomes stable for awhile. The helium-reaction phase lasts only about one-tenth as long as the earlier hydrogen-burning phase. Afterward, when the helium in the core is depleted, the star is left with a core made of carbon.
The final stages A star with the same mass as the Sun never becomes hot enough for carbon to fuse, so its energy pro-duction ends. The outer layers expand again and are expelled by pulsations that develop in the outer layers. This shell of gas is called a planetary nebula. In the center of a planetary nebula, shown in Figure 29.21, the core of the star becomes exposed as a small, hot object about the size of Earth. The star is then a white dwarf made of carbon.
Internal pressure in white dwarfs A white dwarf is stable despite its lack of nuclear reactions because it is supported by the resistance of electrons being squeezed together, and does not require a source of heat to be maintained. This pressure counteracts gravity and can support the core as long as the mass of the remaining core is less than about 1.4 times the mass of the Sun. The main-sequence lifetime of such a star is much longer, however, because low-mass stars are dim and do not deplete their nuclear fuel rapidly.
Life Cycles of Massive StarsFor stars more massive than the Sun, evolution is different. A more massive star begins its life in the same way, with hydrogen being converted to helium, but it is much higher on the main sequence. The star’s lifetime in this phase is short because the star is very luminous and uses up its fuel quickly. The electron pressure does not require ongoing reactions, so it can last indefi-nitely. The white dwarf gradually cools, eventually losing its luminosity and becoming an undetectable black dwarf.
Helium core
Hydrogenfusing in
a shell
■ Figure 29.20 In a red giant’s central region, helium is converted to carbon. In the spherical shell just outside, hydrogen continues to be converted to helium. The low temperature of the outer atmosphere due to expansion and cooling causes the red color.
■ Figure 29.21 The star at the center of the Eskimo nebula, now a white dwarf, was the source of the remnant gases sur-rounding it.
Interactive Figure To see an animation of the helium core, visit glencoe.com.
NASA/Andrew Fruchter/ERO Team/Sylvia Baggett (STScI)/Richard Hook (ST-ECF)/Zoltan Levay (STScI)
847_851_C29_S3_874636.indd 849847_851_C29_S3_874636.indd 849 2/12/07 3:58:36 PM2/12/07 3:58:36 PM

850 Chapter 29 • Stars
Supergiant A massive star undergoes many more reaction phases and thus produces a rich stew of many elements in its interior. The star becomes a red giant several times as it expands following the end of each reaction stage. As more shells are formed by the fusion of different elements, illustrated in Figure 29.22, the star expands to a larger size and becomes a supergiant, such as Betelgeuse in the Orion constellation.
Supernova formation A star that begins with a mass between about 8 and 20 times the Sun’s mass will end up with a core that is too massive to be supported by electron pressure. Such a star comes to a violent end. Once reactions in the core of the star have created iron, no further energy-producing reactions can occur, and the core of the star violently collapses in on itself, as illus-trated in Figure 29.23. Protons and electrons in the core merge to form neutrons. Like electrons, a neutron’s resis-tance to being squeezed close together creates a pressure that halts the collapse of the core, and the core becomes a collapsed star remnant—a neutron star. A neutron star has a mass of 1.5 to 3 times the Sun’s mass but a radius of only about 10 km. Its density is extremely high — about 100 trillion times the density of water — and is compara-ble to that of an atomic nucleus.
Pulsar Some neutron stars are unique in that they have a pulsating pattern of light. The magnetic fields of these stars focus the light they emit into cones. Then as these stars rotate on their axes, the light from each spinning neutron star is observed as a series of pulses of light, as each of the cones sweeps out a path in Earth’s direction. This pulsating star is known as a pulsar.
Fe/Ni
Si Fe, NiO Si, S Ne O, MgC Ne, MgHe C, O
H He
Core
■ Figure 29.22 A massive star can have many shells fusing different elements. These stars are the source of heavier elements in the universe.
Infalling material
Core(whitedwarf)
Infallingmaterialrebounds
Core(neutron
star)
Shockwaves
Material explodes outward
Core
■ Figure 29.23 When the outer layers of a star collapse into the neutron core, the central mass of neu-trons creates a pressure that causes this mass to explode outward as a supernova, leaving a neutron star. Compare the diameter of a supergiant with that of a neutron star.
847_851_C29_S3_874636.indd 850847_851_C29_S3_874636.indd 850 2/12/07 3:58:38 PM2/12/07 3:58:38 PM

Self-Check Quiz glencoe.com Section 3 • Stellar Evolution 851
Supernova A neutron star forms quickly while the outer layers of the star are still falling inward. This infalling gas rebounds when it strikes the hard surface of the neutron star and explodes outward. The entire outer portion of the star is blown off in a massive explosion called a supernova (plural, supernovae). This explosion creates elements that are heavier than iron and enriches the universe. Figure 29.24 shows photos of before and during a supernova explosion. A distant supernova explosion might be brighter than the galaxy in which it is found.
Black holes Some stars are too massive to form neutron stars. The pressure from the resis-tance of neutrons being squeezed together cannot support the core of a star if the star’s mass is greater than about three times the mass of the Sun. A star that begins with more than 20 times the Sun’s mass will end up above this mass limit, and it cannot form a neutron star. The resistance of neutrons to being squeezed is not great enough to stop the collapse and the core of the star con-tinues to collapse, compacting matter into a smaller volume. The small, extremely dense object that remains is called a black hole because its gravity is so immense that nothing, not even light, can escape it. Astronomers cannot observe what goes on inside a black hole, but they can observe the X-ray-emitting gas that spirals into it.
Before supernova
During supernova
■ Figure 29.24 The region of sky in the Large Magellanic Cloud seemed ordinary before one of its stars underwent a supernova explosion.
Section 2299..33 AssessmentSection Summary◗◗ The mass of a star determines its
internal structure and its other properties.
◗◗ Gravity and pressure balance each other in a star.
◗◗ If the temperature in the core of a star becomes high enough, elements heavier than hydrogen can fuse together.
◗◗ A supernova occurs when the outer layers of the star bounce off the neu-tron star core, and explode outward.
Understand Main Ideas1. MAIN Idea Explain how mass determines a star’s evolution.
2. Infer how the diameter of a star is determined by mass.
3. Determine how the lifetimes of stars depend on their masses.
4. Determine why only the most massive stars are important contributors in enrich-ing the galaxy with heavy elements.
Think Critically5. Explain how the universe would be different if massive stars did not explode at
the end of their lives.
6. Distinguish whether there is a balance between pressure and gravity in main-sequence stars, white dwarfs, neutron stars, and black holes.
Earth Science
7. Write a description of an observation of a supernova in another galaxy.
(t)D
avid
Mal
in/A
nglo
-Aus
tral
ian
Obs
erva
tory
, (b
)Dav
id M
alin
/Ang
lo-A
ustr
alia
n O
bser
vato
ry
847_851_C29_S3_874636.indd 851847_851_C29_S3_874636.indd 851 2/12/07 3:58:40 PM2/12/07 3:58:40 PM

852 Chapter 29 • Stars
Powerful hurricanes and tornadoes can cause millions of dollars worth of damage to homes and other structures. These types of strong storms can be responsible for loss of human life and the disruption of major electrical and communication sys-tems in an area. There are also weather conditions in space. What effects do solar storms have on Earth?
Space weather Solar flares and coronal mass ejections create powerful solar storms that release bil-lions of high-energy particles into space that travel at speeds of up to 2000 km/s. Some of these particles slam into Earth’s magnetosphere—over which particles from space normally flow—much like water flows around a large rock in the middle of a river. Earth’s magneto-sphere normally deflects particles from the Sun, but dur-ing intense solar storms, highly charged particles cause disruptions in many of Earth’s communication and elec-trical systems.
Monitoring space weather Two U.S. gov-ernment agencies, NASA and NOAA, monitor and pro-vide daily updates on space weather, including predictions about solar flare and solar storm occur-rences. Power companies, the Federal Aviation Administration, and the U.S. Department of Defense use the data to help minimize the damage to sensitive equipment caused by solar storms.
Communication Communication satellites, locat-ing systems, and military signals rely on radio waves that are bounced off Earth’s ionosphere. The ionosphere is a layer of highly charged particles which is especially vulnerable to highly energized particles from the Sun.
These high-energy particles can interfere with radio signals and disrupt transmissions.
Satellites Solar storms can cause satellites to fall out of orbit due to temperature and density changes in Earth’s upper atmosphere. They must be moved to higher orbits in response to this phenomenon. Communication satellites can also be knocked out by electric particle buildup as well.
Electricity Power companies routinely receive infor-mation about possible solar storms in order to avoid service disruption to customers. Solar storms can knock out power by inducing currents in electrical lines. In 1989, in Quebec, Canada, a solar storm caused a nine-hour blackout that affected 6 million people and cost the power company over 10 million dollars in repairs.
A widespread coronal mass ejection blasts more than a billion tons of matter into space at millions of kilometers per hour. Fortunately one this large is rare.
Earth SciencePamphlet Research more information about space weather and create a pamphlet that answers frequently asked questions about it. Include information about the causes and why it is important to monitor space weather. To learn more about space weather, visit glencoe.com.
SO
HO
(E
SA
& N
AS
A)
852_853_C29_Lab_874636.indd 852852_853_C29_Lab_874636.indd 852 2/12/07 3:59:33 PM2/12/07 3:59:33 PM

GeoLab 853 GeoLab 853
IDENTIFY STELLAR SPECTRAL LINES
Background: An astronomer studying a star or other type of celestial object often starts by identify-ing the lines in the object’s spectrum. The identity of the spectral lines gives information about the chemi-cal composition of the distant object, along with data on its temperature and other properties.
Question: How can you identify stellar spectral lines based on two previously identified lines?
Materialsruler
Procedure1. Read and complete the lab safety form.2. Find the difference between the two labeled spectral
line values on Star 1.3. Accurately measure the distance between the two
labeled spectral lines.4. Set up a conversion scale by dividing the spectral
difference by the measured distance.For example: 1 mm = 12 nm
5. Measure the distance from one of the labeled spec-tral lines to each of the unlabeled spectral lines.
6. Convert these distances to nm. Add or subtract your value to the original spectral line value. If the labeled line is to the right of the line measured, then sub-tract. Otherwise, add. This is the value of the wavelength.
7. Compare your wavelength measurements to the table of wavelengths emitted by elements, and identify the elements in the spectrum.
8. Repeat this procedure for Star 2.
Analyze and Conclude 1. Identify Can you see any clues in the star’s spectrum
about which elements are most common in the stars? Explain.
2. Explain Do both stars contain the same lines for all the elements in the table?
3. Evaluate How do the thicker absorption lines of some elements in a star’s spectrum affect the accu-racy of your measurements? Is there a way to improve your measurements? Explain.
Possible Elements and Wavelengths
Element/Ion Wavelength (nm)
H 383.5, 388.9, 397.0, 410.2, 434.1, 486.1, 656.3
He 402.6, 447.1, 492.2, 587.6, 686.7
He+ 420.0, 454.1, 468.6, 541.2, 656.0
Na 475.2, 498.3, 589.0, 589.6
Ca+ 393.4, 480.0, 530.7
397.0 nm
Star 1
656.3 nm
486.1 nm434.1 nm
Star 2
INQUIRY EXTENSIONDesign Your Own Obtain spectra from various sources, such as sunlight, fluorescent, and incandescent light. Compare their emission lines to those from this lab. What elements are common to each?
852_853_C29_Lab_874636.indd 853852_853_C29_Lab_874636.indd 853 2/12/07 3:59:41 PM2/12/07 3:59:41 PM

Vocabulary PuzzleMaker biologygmh.com854 Chapter X • Study Guide854 Chapter 29 • Study Guide
Vocabulary Key ConceptsSection 29.1 The Sun
• chromosphere (p. 831)• corona (p. 831)• fission (p. 834)• fusion (p. 834)• photosphere (p. 831)• prominence (p. 833)• solar flare (p. 833)• solar wind (p. 832)• sunspot (p. 832)
MAIN Idea The Sun contains most of the mass of the solar system and has many features typical of other stars.
• Most of the mass in the solar system is found in the Sun.• The Sun’s average density is approximately equal to that of the gas giant
planets.• The Sun has a layered atmosphere.• The Sun’s magnetic field causes sunspots and other solar activity.• The fusion of hydrogen into helium provides the Sun’s energy and
composition.• The different temperatures of the Sun’s outer layers produce different
spectra.
Section 29.2Section 29.2 Measuring the Stars
• absolute magnitude (p. 842)• apparent magnitude (p. 842)• binary star (p. 838)• constellation (p. 837)• Hertzsprung-Russell diagram (p. 845)• luminosity (p. 842)• main sequence (p. 845)• parallax (p. 841)• parsec (p. 840)
MAIN Idea Stellar classification is based on measurement of light spectra, temperature, and composition.
• Stars exist in clusters held together by their gravity.• The simplest cluster is a binary.• Parallax is used to measure distances to stars.• The brightness of stars is related to their temperature.• Stars are classified by their spectra.• The H-R diagram relates the basic properties of stars: class, temperature,
and luminosity.
Section 29.3Section 29.3 Stellar Evolution
• black hole (p. 851)• nebula (p. 848)• neutron star (p. 850)• protostar (p. 848)• pulsar (p. 850)• supernova (p. 851)
MAIN Idea The Sun and other stars follow similar life cycles, leaving the galaxy enriched with heavy elements.
• The mass of a star determines its internal structure and its other properties.
• Gravity and pressure balance each other in a star.• If the temperature in the core of a star becomes high enough, elements
heavier than hydrogen can fuse together.• A supernova occurs when the outer layers of the star bounce off the
neutron star core, and explode outward.
Download quizzes, key terms, and flash cards from glencoe.com.
Vocabulary PuzzleMaker glencoe.com
BIG Idea The life cycle of every star is determined by its mass, luminosity, magnitude, tem-perature, and composition.
854_857_C29_CA_874636.indd 854854_857_C29_CA_874636.indd 854 2/12/07 4:00:43 PM2/12/07 4:00:43 PM

Chapter 29 • Assessment 855Chapter Test glencoe.com
Vocabulary Review
Match the definitions below to the correct vocabulary term on the Study Guide.
1. the top layer of the Sun’s atmosphere, having a temperature of about 1 million K
2. combining of lightweight nuclei such as hydrogen into heavier nuclei
3. dark spots where the surface is cooler on the pho-tosphere of the Sun
4. the arrangement of electromagnetic energy accord-ing to wavelengths
5. the outward flow of charged particles from the Sun’s corona flowing throughout the solar system
6. two stars that are gravitationally bound and orbit a common center of mass
7. the power or energy output from the surface of a star in units per second
8. an explosion that blows away the outer portion of a star
Distinguish between the following pairs of terms.
9. eclipsing binary , spectroscopic binary
10. giant stars, main-sequence stars
11. apparent magnitude, absolute magnitude
12. black hole, neutron star
13. fission, fusion
Define these terms in your own words.
14. constellation
15. prominence
16. main sequence
17. nebula
18 supernova
19. black hole
20. protostar
Understand Key Concepts
Use the diagram below to answer Question 21.
21. Starting at the center, which is the correct order of solar layers?A. chromosphere, corona, photosphere, solar windB. photosphere, chromosphere, solar wind, coronaC. photosphere, chromosphere, corona, solar windD. solar wind, chromosphere, corona, photosphere
22. Why do sunspots appear dark?A. They are cooler than their surroundings.B. They are holes in the interior of the Sun.C. They do not have strong magnetic fields.D. They are hotter than their surroundings.
23. Why is the Sun’s composition similar to that of the gas giant planets?A. They all formed at the same time.B. They both lost heavy elements.C. They all formed from the same interstellar
cloud.D. They both gained heavy elements.
24. How is the Sun’s magnetic behavior associated with its activity cycle?A. The magnetic field turns off when the activity
cycle turns on.B. The activity cycle is coordinated with the peak
number of sunspots.C. The activity cycle is independent of the number
of solar flares.D. Solar flares are not coordinated with magnetic
storms on Earth.
854_857_C29_CA_874636.indd 855854_857_C29_CA_874636.indd 855 2/12/07 4:00:48 PM2/12/07 4:00:48 PM

856 Chapter 29 • Assessment Chapter Test glencoe.com
25. Which is NOT true about binary stars?A. They usually appear as one star.B. They move about a common center of mass.C. They are the most common stars in a galaxy.D. They are always of equal brightness.
Use the diagram below to answer Question 26.
26. Which is true about the spectral classification system of stars?A. An A star is cooler than an M star but hotter
than an F star.B. An O star is cooler than a B star yet hotter than
an F star.C. A K star is hotter than both a G star and an
M star.D. A G star is cooler than a B star and hotter than
a K star.
27. Which two key stellar properties determine all the other stellar properties?A. radius and diameterB. mass and radiusC. composition and massD. diameter and composition
28. Which are in the proper time order?A. main-sequence star, red giant, white dwarf,
planetary nebulaB. planetary nebula, red giant, white dwarf, main-
sequence starC. main-sequence star, white dwarf, planetary
nebula, red giantD. planetary nebula, main-sequence star, white
dwarf, red giant
Constructed Response
29. Careers in Earth Science Deduce what astronomers can tell about how stars of dif-ferent masses evolve, by observing stars in clusters.
30. Detail how, if Earth’s orbit were twice the diameter it is now, that would affect stellar parallax and our ability to measure distances.
31. Explain why we say the solar cycle lasts 22 years and not 11.
Use the image below to answer Questions 32 and 33.
32. Identify the visible layers of the Sun in this photo.
33. Identify the light and dark areas of the Sun’s sur-face in the photo.
34. Explain the relationship between the solar promi-nences and the Sun’s magnetic field.
O5
+15
+10
+5
Sun
Abs
olut
e m
agni
tude
0
–5
B0 B5 A0 A5 F0 F5Spectral type
G0G5 K0 K5 M0M5
40,000 10,000 7000 6000 5000 3000
Surface temperature (K)
Whitedwarfs
Giants
Supergiants
Main sequence
SOHO (ESA & NASA)
854_857_C29_CA_874636.indd 856854_857_C29_CA_874636.indd 856 2/12/07 4:00:49 PM2/12/07 4:00:49 PM
Additional Assessment
Chapter 29 • Assessment 857Chapter Test glencoe.com
Think Critically .
35. Deduce why it is hotter at the center of the Sun than on the surface.
36. Predict the layering and composition of stars other than the Sun.
37. Explain how the density of the Sun is so great and yet is still in the gaseous state.
Use the diagram below to answer Questions 38 and 39.
38. Draw the relative positions of Earth, the Sun, and the star in March and November, based upon the observation in the diagram.
39. Infer how parallax helps scientists determine magnitude and luminosity.
40. Infer why the parsec has become the standard unit for expressing distance to the stars rather than the AU or light-year.
41. Compare a B5 star to the Sun using the H-R diagram.
42. Compare a supernova, a neutron star, and a pulsar.
43. Explain the difference between a planetary neb-ula and a supernova.
Concept Mapping
44. Make a concept map linking the terms fusion, luminosity, protostar, and one other vocabulary term.
Challenge Question
45. Organize a procedure for discovering whether a star is binary.
Additional Assessment
JulyJanuary
46. Earth Science The person who developed the modern system of spectral classifi-cation was Annie J. Cannon. Research her work and write about her role in forging new pathways for women in science.
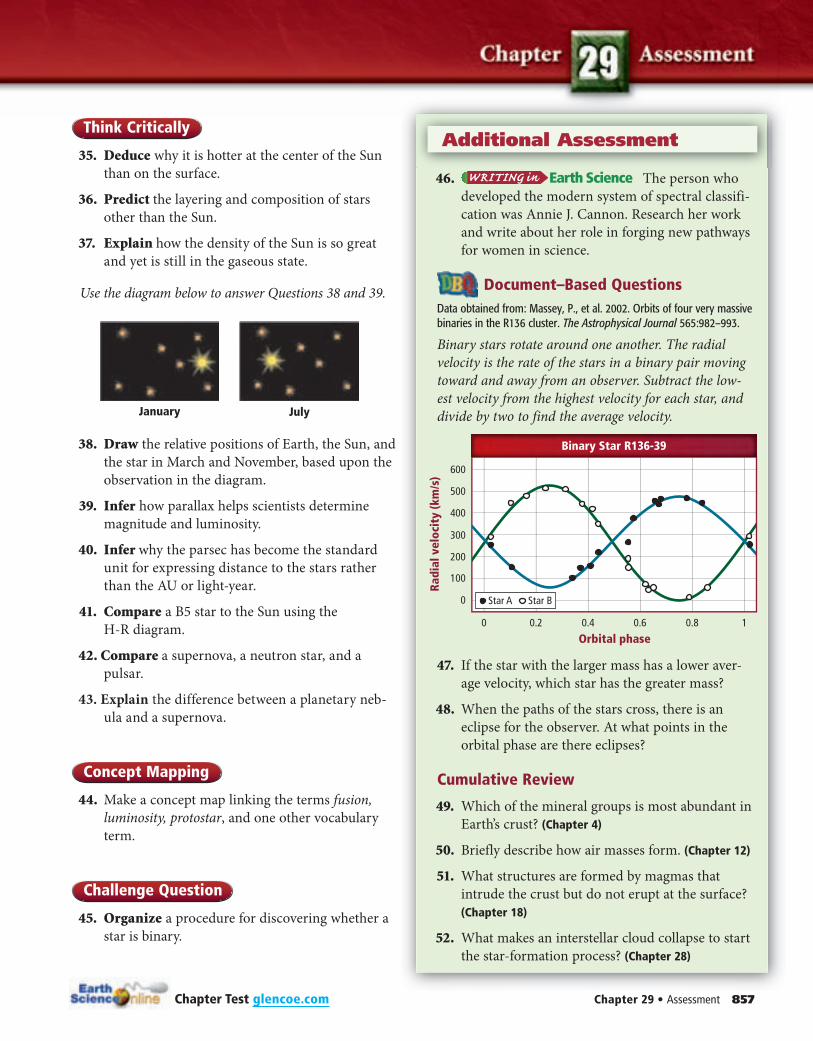
Document–Based QuestionsData obtained from: Massey, P., et al. 2002. Orbits of four very massive binaries in the R136 cluster. The Astrophysical Journal 565:982–993.
Binary stars rotate around one another. The radial velocity is the rate of the stars in a binary pair moving toward and away from an observer. Subtract the low-est velocity from the highest velocity for each star, and divide by two to find the average velocity.
47. If the star with the larger mass has a lower aver-age velocity, which star has the greater mass?
48. When the paths of the stars cross, there is an eclipse for the observer. At what points in the orbital phase are there eclipses?
Cumulative Review
49. Which of the mineral groups is most abundant in Earth’s crust? (Chapter 4)
50. Briefly describe how air masses form. (Chapter 12)
51. What structures are formed by magmas that intrude the crust but do not erupt at the surface? (Chapter 18)
52. What makes an interstellar cloud collapse to start the star-formation process? (Chapter 28)
0.20 0.4 0.6 10.8
Radi
al v
eloc
ity
(km
/s)
Orbital phase
Binary Star R136-39
0
100
200
300
400
500
600
Star A Star B
854_857_C29_CA_874636.indd 857854_857_C29_CA_874636.indd 857 2/12/07 4:00:52 PM2/12/07 4:00:52 PM

Multiple Choice
glencoe.com858 Chapter 29 • Assessment
1. In December, the south pole is tilted closer to the Sun than at any other time of the year, and the north pole is tilted its farthest from the Sun. What is the northern hemisphere experiencing at that time? A. the winter solsticeB. the summer solsticeC. the vernal equinoxD. the autumnal equinox
Use the diagram below to answer Questions 2 and 3.
2. Which planet is located at aphelion in its orbit? A. MercuryB. VenusC. EarthD. the Sun
3. Which orbit shown has an eccentricity that is closest to 0? A. MercuryB. VenusC. EarthD. the Moon
4. A bed of sedimentary rock is formed by sediments that were deposited at a rate of 1 cm/year. If the bed is 350 m thick, how long did it take for the whole bed to be deposited? A. 350 yearsB. 3500 yearsC. 35,000 yearsD. 350,000 years
5. Which gas giant is the largest? A. Jupiter C. UranusB. Saturn D. Neptune
6. Which energy source does not come from the Sun? A. wind C. geothermalB. water D. ocean
Use the graph below to answer Questions 7–9.
7. Which can you conclude from the graph? A. In 80 years, it will not be possible to feed the
population.B. World population increases at a rate of 1 billion
people every 10 years.C. There were approximately 2.5 billion people in
the world in 1940.D. At the present rate of growth, the population
will exceed 7 billion before 2020.
8. Based on this graph, what can be assumed about the carrying capacity of the world? A. The world is in a state of equilibrium.B. The world has not reached its carrying capacity.C. The world has reached its carrying capacity.D. The world has exceeded its carrying capacity.
9. On the graph, what is the year considered? A. the constantB. the dependent variableC. the independent variableD. the variable
10. What causes sunspots on the Sun? A. intense magnetic fields poking through the
photosphereB. charged particles flowing into the solar systemC. spots on the surface of the photosphere, which
are hotter than the surrounding areasD. areas of low density in gas of the Sun’s corona
Earth
Moon
Venus
MercurySun
Year
Popu
lati
on(b
illio
ns)
01940 1960 1980 2000 2020
2
4
6
8World Population, 1950–2000
Standardized Test Practice
Standardized Test Practice
858_859_C29_STP_874636.indd 858858_859_C29_STP_874636.indd 858 02/22/07 1:57:04 PM02/22/07 1:57:04 PM

Short Answer
glencoe.com Chapter 29 • Assessment 859
NEED EXTRA HELP?
If You Missed Question . . .
1 2 3 4 5 6 7 8 9 10 11 12 13 14 15 16
Review Section . . . 27.3 28.1 28.1 6.1 28.3 25.2 26.1 26.1 1.2 29.1 24.3 24.3 24.3 22.3 25.3 25.3
Use the illustration below to answer Questions 11–13.
11. Describe the process shown above.
12. Why is burning fossil fuels an important part of this process?
13. Why are there two arrows between carbon in the atmosphere and carbon in organisms?
14. Describe how Earth’s atmosphere would be differ-ent if there were no life on Earth.
15. Why would a minor temperature increase caused by global warming pose a threat to Earth?
16. Why is an express lane for cars with multiple pas-sengers a good form of energy conservation?
The Sun’s Impact on Climate
Sunspots alter the amount of energy Earth gets from the Sun, but not enough to impact global cli-mate change, a new study suggests. The Sun’s role in global warming has long been a matter of debate and is likely to remain a contentious topic.
Scientists have pondered the link between the Sun and Earth’s climate since the time of Galileo. There has been an intuitive perception that the Sun’s vari-able degree of brightness—the coming and going of sunspots for instance—might have an impact on climate. Most climate models already incorporate the effects of the Sun’s waxing and waning power on Earth’s weather. The number of spots cycles over time, reaching a peak every 11 years, but sunspot-driven changes to the Sun’s power are too small to account for the climatic changes observed in histor-ical data. The difference in brightness between the high point of a sunspot cycle and its low point is less than 0.1 percent of the Sun’s total output.Article obtained from: Handwerk, B. Don’t blame Sun for global warming, study says. National Geographic News. September 13, 2006.
17. What can be inferred from this passage? A. Sunspots on the Sun do not affect global cli-
mate change.B. Sunspots greatly alter the amount of energy
Earth gets from the Sun.C. It has long been thought that sunspots change
Earth’s climate.D. The amount of energy output from a sunspot
changes drastically during its cycle.
18. Approximately how much does a sunspot cycle change the energy output of the Sun? A. 11 percentB. 1.0 percentC. 0.1 percentD. 0.01 percent
19. While a sunspot does change the amount of energy Earth gets from the Sun, why does it not impact climate?
Carbon inoceans
Carbon in soil
Carbon in organisms
Carbon inorganisms
Carbon inatmosphere
Fossil fuelburning
Carbon in rock
Reading for Comprehension
Standardized Test Practice
858_859_C29_STP_874636.indd 859858_859_C29_STP_874636.indd 859 02/22/07 1:57:10 PM02/22/07 1:57:10 PM