83341 ch29 jacobsen
TRANSCRIPT
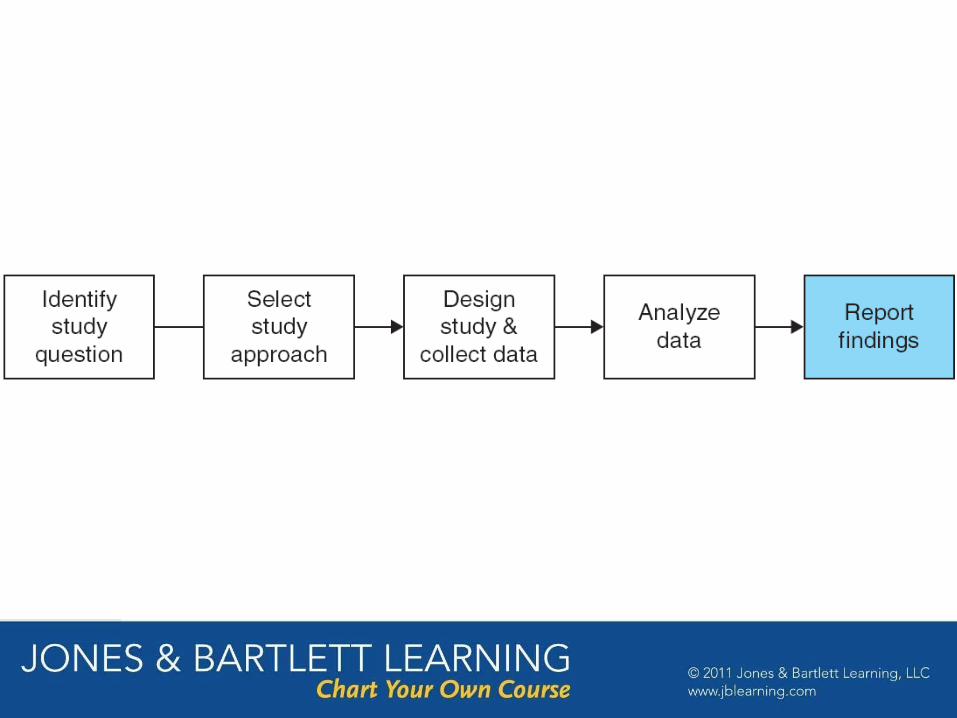
Step 5
Reporting Findings

Chapter 29
Article Structure
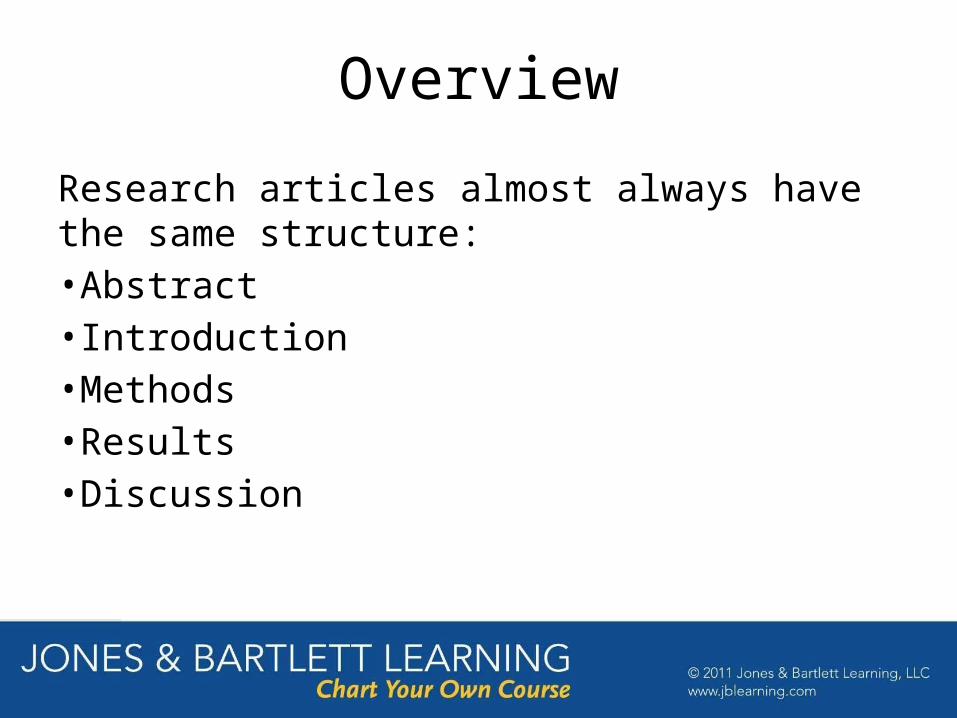
Overview
Research articles almost always have the same structure: •Abstract•Introduction•Methods•Results•Discussion

Abstract
• The abstract is a summary of the article. • Most journals limit abstracts to a maximum of 150 to
250 words.
• A structured abstract uses subheadings, like objective, methods, results, and conclusion, to highlight content.
• An unstructured abstract usually follows the same outline but does not list the section titles.

Introduction / Background
• The introduction provides the background information that a reader must know to understand the methods and results of the article.
• Most introduction sections conclude with a statement about the importance or significance of the study and the specific aims, objectives, or hypotheses that the paper will address.
Methods
• The methods section should begin by clearly identifying the study design used.
• Definitions should be provided for the key exposures, outcomes, and other variables.
• All data collection methods should be described.• Ethical considerations should be briefly described.• The section should end with a description of the
statistical methods used.
Results
• The results section should start with a description of the study population.
• Additional results of statistical analysis should then be provided.
• Tables and figures should be used to provide results when possible.
Discussion
• The discussion section usually begins with a summary of the key findings of the new study.
• The next paragraphs should compare the new study to previous studies.
• Every paper needs to include at least one paragraph on the limitations of the study.
• The final paragraph of the discussion should state the conclusions and implications of the study.
Endmatter
• Some journals list information between the conclusion and the reference list.
• The endmatter may include author affiliations and contributions, acknowledgments, information about some ethical aspects of research, a list of funding sources, and/or disclosure about possible conflicts of interest.
Tables & Figures
• Many health journals limit the number of tables and figures allowed for each article, often to a maximum total of four (tables and figures combined).
• This limit means that the content for tables and figures must be carefully selected to highlight the most important aspects of the study.
Tables & Figures
• Tables should be used to organize and present statistical results that cannot easily be listed in the text in a sentence or two.
• Graphs and other figures should be used when a visual presentation of the material is more effective than words at conveying a result.
• Any images used should be meaningful, not merely decorative.
• There is no need to repeat information in the text that is provided in a table or figure.
Tables
• A table should provide enough information so that it can be independently interpreted and understood even in the absence of the text.
• The rows and columns should each have a descriptive label.
• For each statistic, provide a confidence interval, p-value, and/or other measure of uncertainty.
• Consistent fonts, spacing, and number of decimal points should be used for all tables in the manuscript.

FIGURE 29- 1 Example Frequency Table for a Case Series
Figures
• A graph should provide enough information in the title, figure, and/or legend or key for a reader to be able to interpret the graph even without reading the related portion of the text.
• High-resolution photographs, maps, flowcharts, and other images made by the authors can also be figures.
• Photographs of study participants are usually not allowed without the written permission of the subjects.
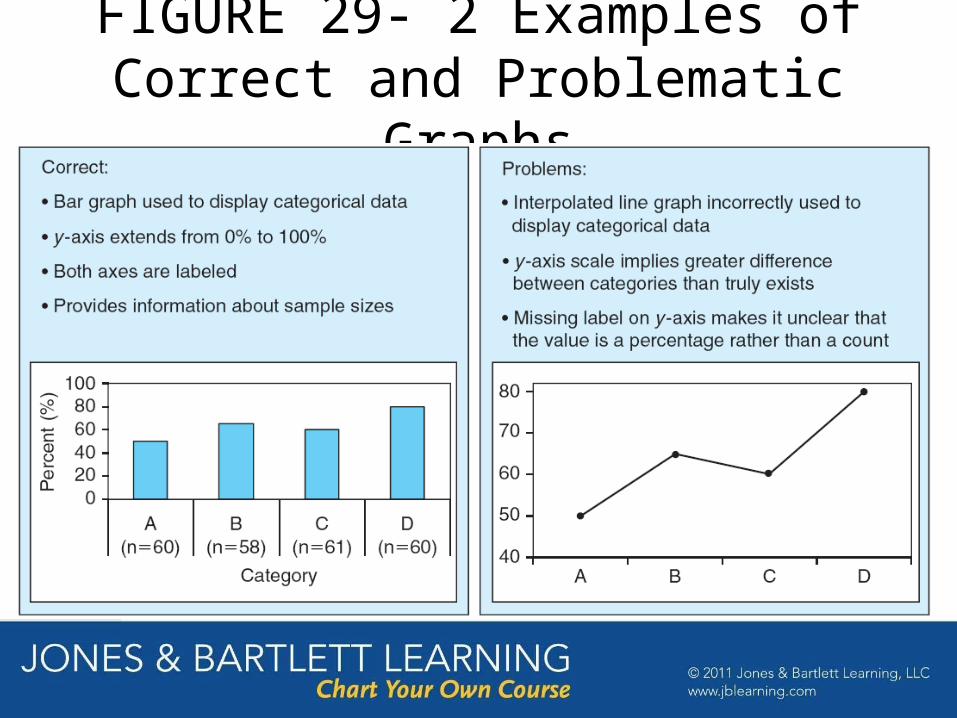
FIGURE 29- 2 Examples of Correct and Problematic Graphs
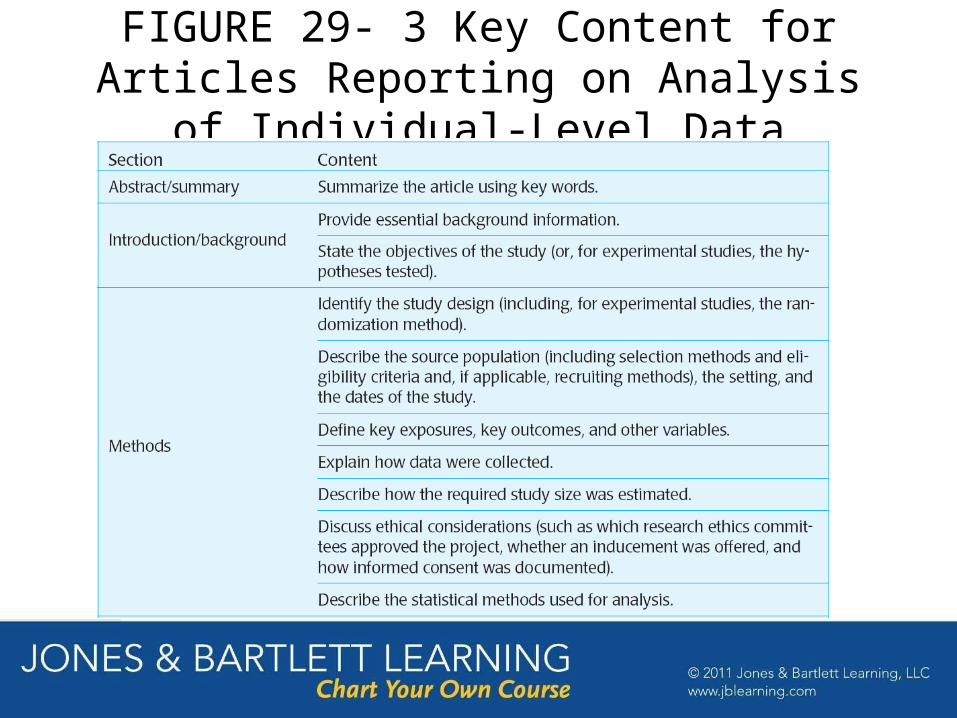
FIGURE 29- 3 Key Content for Articles Reporting on Analysis of Individual-Level Data

FIGURE 29- 3 Key Content for Articles Reporting on Analysis of Individual-Level Data
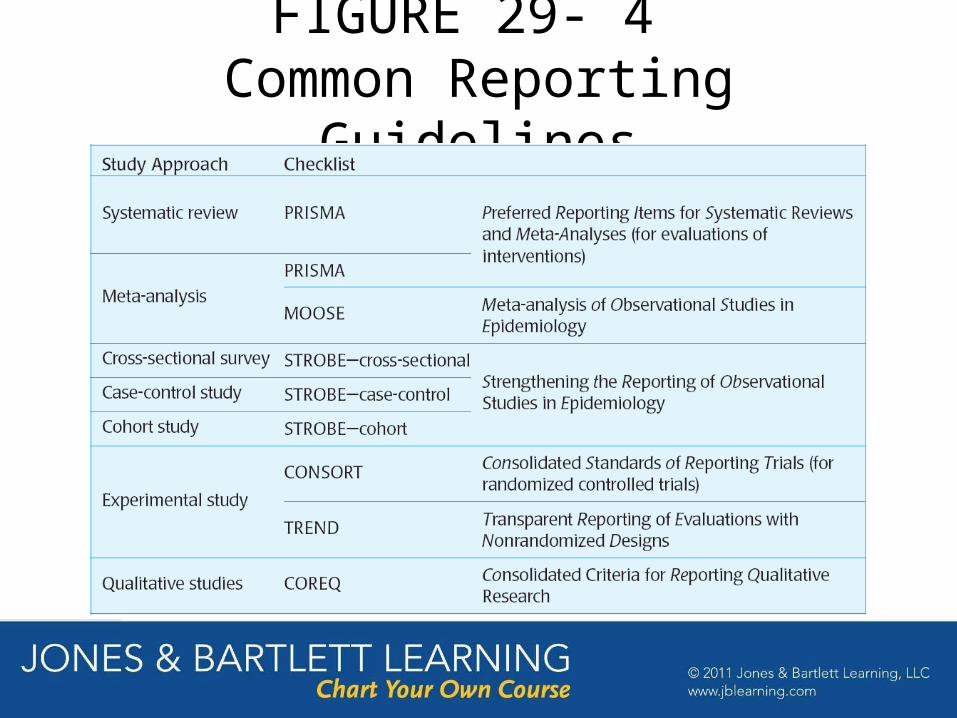
FIGURE 29- 4 Common Reporting Guidelines