8.agri&food mgmt
DESCRIPTION
ftTRANSCRIPT
Chapter 8
Agriculture and Food Management
With the shadow of the El Niño looming over the Indian monsoon, there are legitimate concernsabout its likely impact on agricultural production and consequently prices of food products. Whatis significant is that over the last decade Indian agriculture has become more robust with recordproduction of foodgrains and oilseeds. Increased procurement, consequently, has added huge stocks offoodgrains in the granaries. India is one of the world’s top producers of rice, wheat, milk, fruits,and vegetables. However, given that India is still home to a quarter of all undernourished people in theworld and since on an average almost half the total expenditure of about half the households is onfood, increasing the efficiency of the farm-to-fork value chain is crucial for eliminating poverty andmalnutrition.
OVERVIEW OF THE AGRI SECTOR
8.2 As a concomitant of growth, the share of agriculture andallied (hereinafter referred as agri) sector in gross domestic product(GDP) declined to 15.2 per cent during the Eleventh Plan andfurther to 13.9 per cent in 2013-14 (provisional estimates—PE). Whileit still accounts for about 54.6 per cent of total employment (Census2011), there has been a decline in the absolute number of cultivators,which is unprecedented, from 127.3 million (Census 2001) to118.7 million (Census 2011). This is indicative of a shift from farmto non-farm employment, causing real farm wages to rise by over7 per cent annually in recent years.
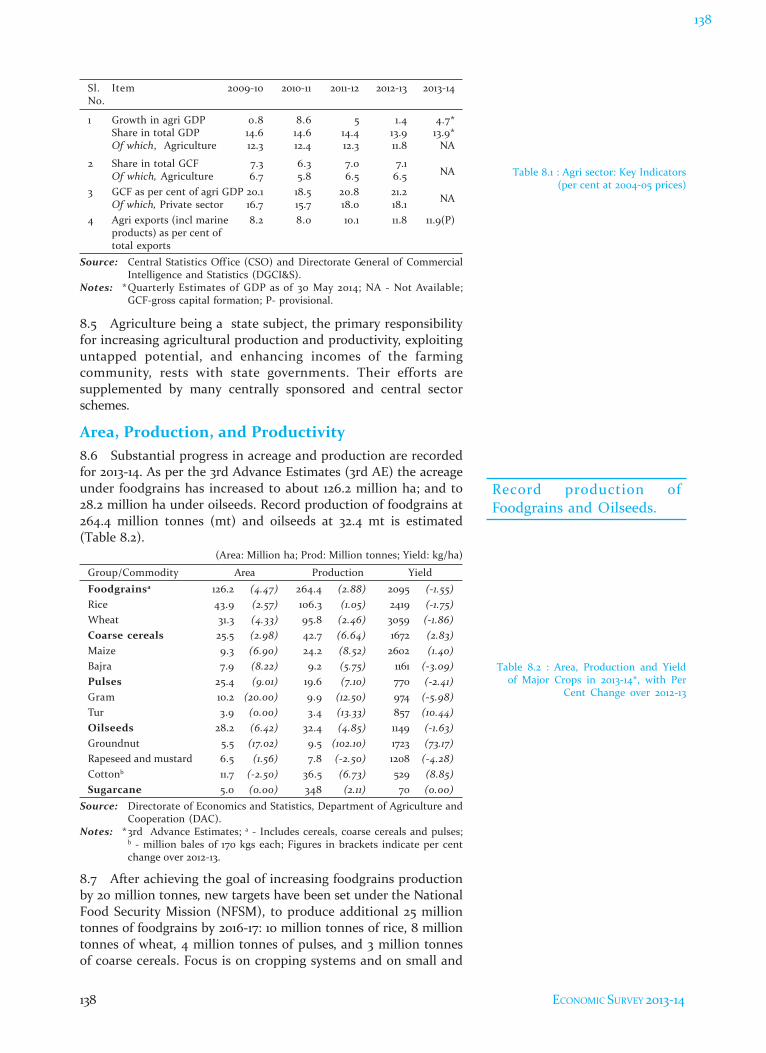
8.3 The resilience of Indian agriculture is evident in that thissector last posted negative growth in 2002-03 and has registered aremarkable average growth rate of 4.1 per cent during the EleventhFive Year Plan (2007-08 to 2011-12). As per the PE for 2013-14,growth rate of agri GDP was 1.4 per cent and 4.7 per centrespectively during the f irst two years of the Twelfth Plan period(Table 8.1).
8.4 In addition, a structural change in the composition ofagriculture, showing diversif ication into horticulture, livestock,and f isheries, is noticeable. The horticulture sector contributed30.4 per cent of agri GDP, while the livestock sector contributedover 4.1 per cent of the total GDP in 2012-13.
A resilient agriculture withincreasing contribution fromhorticulture and livestock isevident.
138 ECONOMIC SURVEY 2013-14
138
8.5 Agriculture being a state subject, the primary responsibilityfor increasing agricultural production and productivity, exploitinguntapped potential, and enhancing incomes of the farmingcommunity, rests with state governments. Their efforts aresupplemented by many centrally sponsored and central sectorschemes.
Area, Production, and Productivity8.6 Substantial progress in acreage and production are recordedfor 2013-14. As per the 3rd Advance Estimates (3rd AE) the acreageunder foodgrains has increased to about 126.2 million ha; and to28.2 million ha under oilseeds. Record production of foodgrains at264.4 million tonnes (mt) and oilseeds at 32.4 mt is estimated(Table 8.2).
Sl. Item 2009-10 2010-11 2011-12 2012-13 2013-14No.
1 Growth in agri GDP 0.8 8.6 5 1.4 4.7*Share in total GDP 14.6 14.6 14.4 13.9 13.9*Of which, Agriculture 12.3 12.4 12.3 11.8 NA
2 Share in total GCF 7.3 6.3 7.0 7.1NAOf which, Agriculture 6.7 5.8 6.5 6.5
3 GCF as per cent of agri GDP 20.1 18.5 20.8 21.2 NAOf which, Private sector 16.7 15.7 18.0 18.14 Agri exports (incl marine 8.2 8.0 10.1 11.8 11.9(P)
products) as per cent oftotal exports
Source: Central Statistics Off ice (CSO) and Directorate General of CommercialIntelligence and Statistics (DGCI&S).
Notes: *Quarterly Estimates of GDP as of 30 May 2014; NA - Not Available;GCF-gross capital formation; P- provisional.
Table 8.1 : Agri sector: Key Indicators(per cent at 2004-05 prices)
Table 8.2 : Area, Production and Yieldof Major Crops in 2013-14*, with Per
Cent Change over 2012-13
(Area: Million ha; Prod: Million tonnes; Yield: kg/ha)
Group/Commodity Area Production YieldFoodgrainsa 126.2 (4.47) 264.4 (2.88) 2095 (-1.55)Rice 43.9 (2.57) 106.3 (1.05) 2419 (-1.75)Wheat 31.3 (4.33) 95.8 (2.46) 3059 (-1.86)Coarse cereals 25.5 (2.98) 42.7 (6.64) 1672 (2.83)Maize 9.3 (6.90) 24.2 (8.52) 2602 (1.40)Bajra 7.9 (8.22) 9.2 (5.75) 1161 (-3.09)Pulses 25.4 (9.01) 19.6 (7.10) 770 (-2.41)Gram 10.2 (20.00) 9.9 (12.50) 974 (-5.98)Tur 3.9 (0.00) 3.4 (13.33) 857 (10.44)Oilseeds 28.2 (6.42) 32.4 (4.85) 1149 (-1.63)Groundnut 5.5 (17.02) 9.5 (102.10) 1723 (73.17)Rapeseed and mustard 6.5 (1.56) 7.8 (-2.50) 1208 (-4.28)Cottonb 11.7 (-2.50) 36.5 (6.73) 529 (8.85)Sugarcane 5.0 (0.00) 348 (2.11) 70 (0.00)
Source: Directorate of Economics and Statistics, Department of Agriculture andCooperation (DAC).
Notes: *3rd Advance Estimates; a - Includes cereals, coarse cereals and pulses;b - million bales of 170 kgs each; Figures in brackets indicate per centchange over 2012-13.
Record production ofFoodgrains and Oilseeds.
8.7 After achieving the goal of increasing foodgrains productionby 20 million tonnes, new targets have been set under the NationalFood Security Mission (NFSM), to produce additional 25 milliontonnes of foodgrains by 2016-17: 10 million tonnes of rice, 8 milliontonnes of wheat, 4 million tonnes of pulses, and 3 million tonnesof coarse cereals. Focus is on cropping systems and on small and
AGRICULTURE AND FOOD MANAGEMENT 139
139
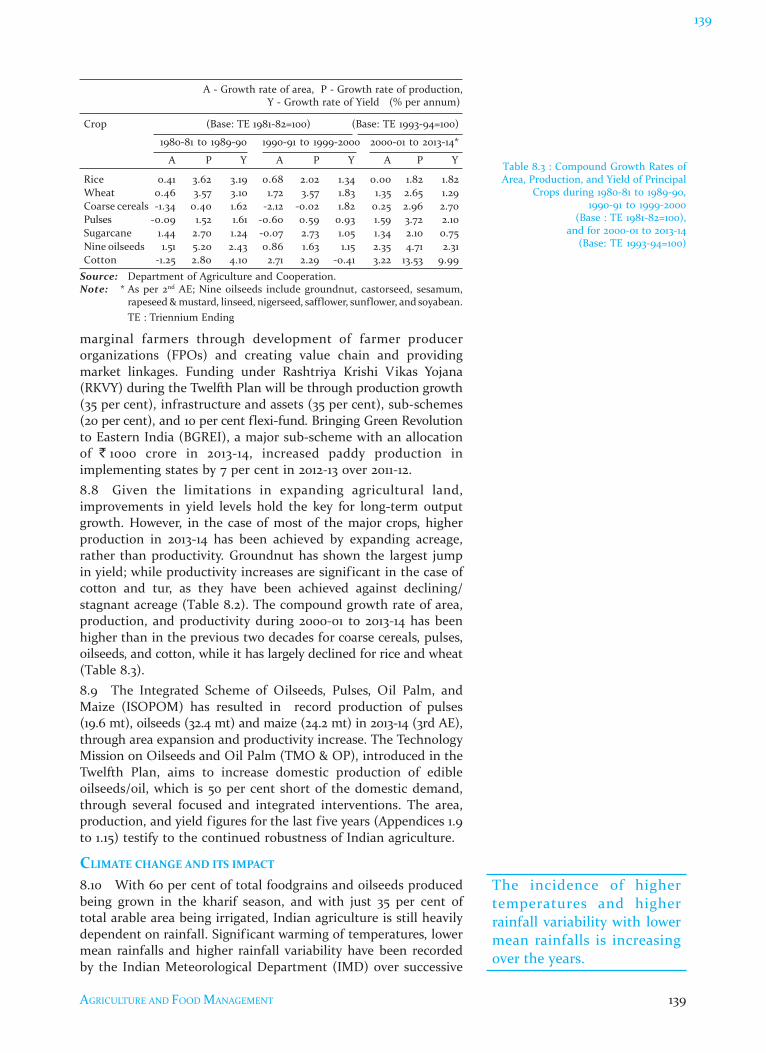
marginal farmers through development of farmer producerorganizations (FPOs) and creating value chain and providingmarket linkages. Funding under Rashtriya Krishi Vikas Yojana(RKVY) during the Twelfth Plan will be through production growth(35 per cent), infrastructure and assets (35 per cent), sub-schemes(20 per cent), and 10 per cent flexi-fund. Bringing Green Revolutionto Eastern India (BGREI), a major sub-scheme with an allocationof ` 1000 crore in 2013-14, increased paddy production inimplementing states by 7 per cent in 2012-13 over 2011-12.8.8 Given the limitations in expanding agricultural land,improvements in yield levels hold the key for long-term outputgrowth. However, in the case of most of the major crops, higherproduction in 2013-14 has been achieved by expanding acreage,rather than productivity. Groundnut has shown the largest jumpin yield; while productivity increases are signif icant in the case ofcotton and tur, as they have been achieved against declining/stagnant acreage (Table 8.2). The compound growth rate of area,production, and productivity during 2000-01 to 2013-14 has beenhigher than in the previous two decades for coarse cereals, pulses,oilseeds, and cotton, while it has largely declined for rice and wheat(Table 8.3).8.9 The Integrated Scheme of Oilseeds, Pulses, Oil Palm, andMaize (ISOPOM) has resulted in record production of pulses(19.6 mt), oilseeds (32.4 mt) and maize (24.2 mt) in 2013-14 (3rd AE),through area expansion and productivity increase. The TechnologyMission on Oilseeds and Oil Palm (TMO & OP), introduced in theTwelfth Plan, aims to increase domestic production of edibleoilseeds/oil, which is 50 per cent short of the domestic demand,through several focused and integrated interventions. The area,production, and yield f igures for the last f ive years (Appendices 1.9to 1.15) testify to the continued robustness of Indian agriculture.
CLIMATE CHANGE AND ITS IMPACT
8.10 With 60 per cent of total foodgrains and oilseeds producedbeing grown in the kharif season, and with just 35 per cent oftotal arable area being irrigated, Indian agriculture is still heavilydependent on rainfall. Signif icant warming of temperatures, lowermean rainfalls and higher rainfall variability have been recordedby the Indian Meteorological Department (IMD) over successive
A - Growth rate of area, P - Growth rate of production,Y - Growth rate of Yield (% per annum)
Crop (Base: TE 1981-82=100) (Base: TE 1993-94=100)
1980-81 to 1989-90 1990-91 to 1999-2000 2000-01 to 2013-14*
A P Y A P Y A P Y
Rice 0.41 3.62 3.19 0.68 2.02 1.34 0.00 1.82 1.82Wheat 0.46 3.57 3.10 1.72 3.57 1.83 1.35 2.65 1.29Coarse cereals -1.34 0.40 1.62 -2.12 -0.02 1.82 0.25 2.96 2.70Pulses -0.09 1.52 1.61 -0.60 0.59 0.93 1.59 3.72 2.10Sugarcane 1.44 2.70 1.24 -0.07 2.73 1.05 1.34 2.10 0.75Nine oilseeds 1.51 5.20 2.43 0.86 1.63 1.15 2.35 4.71 2.31Cotton -1.25 2.80 4.10 2.71 2.29 -0.41 3.22 13.53 9.99
Source: Department of Agriculture and Cooperation.Note: * As per 2nd AE; Nine oilseeds include groundnut, castorseed, sesamum,
rapeseed & mustard, linseed, nigerseed, safflower, sunflower, and soyabean.TE : Triennium Ending
Table 8.3 : Compound Growth Rates ofArea, Production, and Yield of Principal
Crops during 1980-81 to 1989-90,1990-91 to 1999-2000
(Base : TE 1981-82=100),and for 2000-01 to 2013-14
(Base: TE 1993-94=100)
The incidence of highertemperatures and higherrainfall variability with lowermean rainfalls is increasingover the years.
140 ECONOMIC SURVEY 2013-14
140
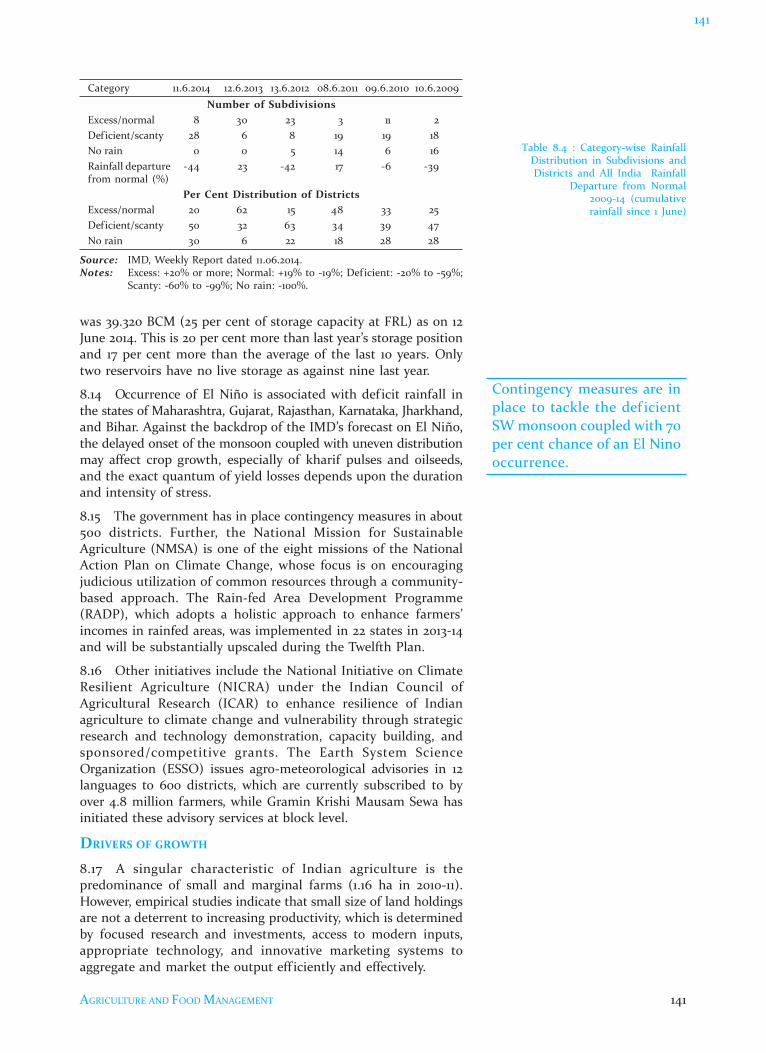
plan periods. Three of the 5 years of the Eleventh Plan period hadannual rainfall less than 95 per cent of the long period average(LPA), as compared to 5 in the previous 15 years (Twelfth Five YearPlan, Vol. II: 2-3). The LPA of the season rainfall over the countryas a whole for the period 1951-2000 is 89 cm.8.11 The south-west (SW) monsoon (from June to September)accounts for nearly 75 per cent of total annual rainfall in Indiaand thus substantially affects agricultural performance. In 2013, theactual season rainfall over the country was 106 per cent of LPA.The second long-range forecast for the SW monsoon seasonreleased by the IMD on 9 June, indicates that the monsoon rainfallis likely to be 93 per cent of the LPA (model error ± 4 per cent),with 71 per cent probability of sub-normal /def icient rainfall and70 per cent occurrence of El Niño. Box 8.1 outlines the relationshipbetween El Niño and the Indian monsoon.8.12 Rainfall distribution data can aid in gauging the likelihoodof an El Niño occurrence. Signif icantly, the number of divisionsreporting def icient/scanty rainfall cumulative from 1 June is higherthis year than in the previous f ive years with (-) 44 per cent rainfalldeparture. Further, 80 per cent of districts had def icient rainfall/no rain in this period (Table 8.4).8.13 Reservoir capacities monitored by the Central Water Commission(CWC) reflect a better status of water availability. The total livestorage in 85 important reservoirs across the country, with capacityat full reservoir level (FRL) of 154.88 billion cubic meters (BCM)and accounting for about 73 per cent of total reservoir capacity,
Box 8.1 : Enigma of El Niño ( ‘the little boy’) and the Indian Monsoon
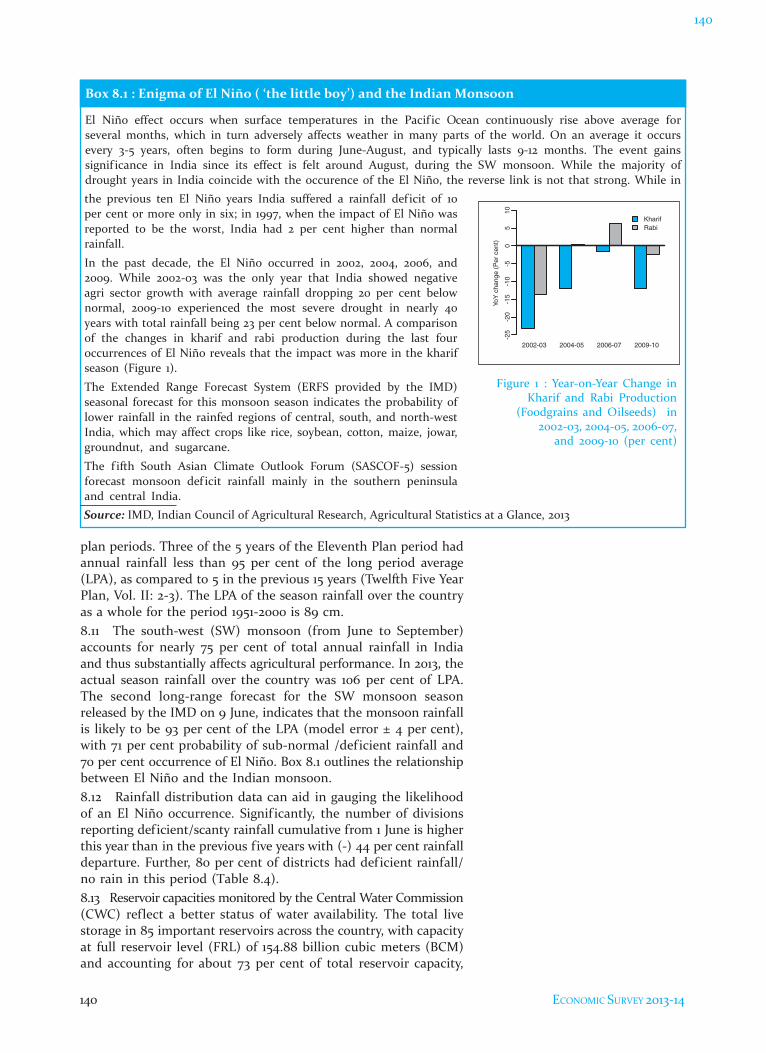
El Niño effect occurs when surface temperatures in the Pacif ic Ocean continuously rise above average forseveral months, which in turn adversely affects weather in many parts of the world. On an average it occursevery 3-5 years, often begins to form during June-August, and typically lasts 9-12 months. The event gainssignif icance in India since its effect is felt around August, during the SW monsoon. While the majority ofdrought years in India coincide with the occurence of the El Niño, the reverse link is not that strong. While inthe previous ten El Niño years India suffered a rainfall def icit of 10per cent or more only in six; in 1997, when the impact of El Niño wasreported to be the worst, India had 2 per cent higher than normalrainfall.In the past decade, the El Niño occurred in 2002, 2004, 2006, and2009. While 2002-03 was the only year that India showed negativeagri sector growth with average rainfall dropping 20 per cent belownormal, 2009-10 experienced the most severe drought in nearly 40years with total rainfall being 23 per cent below normal. A comparisonof the changes in kharif and rabi production during the last fouroccurrences of El Niño reveals that the impact was more in the kharifseason (Figure 1).The Extended Range Forecast System (ERFS provided by the IMD)seasonal forecast for this monsoon season indicates the probability oflower rainfall in the rainfed regions of central, south, and north-westIndia, which may affect crops like rice, soybean, cotton, maize, jowar,groundnut, and sugarcane.The f ifth South Asian Climate Outlook Forum (SASCOF-5) sessionforecast monsoon def icit rainfall mainly in the southern peninsulaand central India.
Figure 1 : Year-on-Year Change inKharif and Rabi Production
(Foodgrains and Oilseeds) in2002-03, 2004-05, 2006-07,
and 2009-10 (per cent)
Source: IMD, Indian Council of Agricultural Research, Agricultural Statistics at a Glance, 2013
AGRICULTURE AND FOOD MANAGEMENT 141
141
was 39.320 BCM (25 per cent of storage capacity at FRL) as on 12June 2014. This is 20 per cent more than last year’s storage positionand 17 per cent more than the average of the last 10 years. Onlytwo reservoirs have no live storage as against nine last year.
8.14 Occurrence of El Niño is associated with def icit rainfall inthe states of Maharashtra, Gujarat, Rajasthan, Karnataka, Jharkhand,and Bihar. Against the backdrop of the IMD’s forecast on El Niño,the delayed onset of the monsoon coupled with uneven distributionmay affect crop growth, especially of kharif pulses and oilseeds,and the exact quantum of yield losses depends upon the durationand intensity of stress.
8.15 The government has in place contingency measures in about500 districts. Further, the National Mission for SustainableAgriculture (NMSA) is one of the eight missions of the NationalAction Plan on Climate Change, whose focus is on encouragingjudicious utilization of common resources through a community-based approach. The Rain-fed Area Development Programme(RADP), which adopts a holistic approach to enhance farmers’incomes in rainfed areas, was implemented in 22 states in 2013-14and will be substantially upscaled during the Twelfth Plan.
8.16 Other initiatives include the National Initiative on ClimateResilient Agriculture (NICRA) under the Indian Council ofAgricultural Research (ICAR) to enhance resilience of Indianagriculture to climate change and vulnerability through strategicresearch and technology demonstration, capacity building, andsponsored/competitive grants. The Earth System ScienceOrganization (ESSO) issues agro-meteorological advisories in 12languages to 600 districts, which are currently subscribed to byover 4.8 million farmers, while Gramin Krishi Mausam Sewa hasinitiated these advisory services at block level.
DRIVERS OF GROWTH
8.17 A singular characteristic of Indian agriculture is thepredominance of small and marginal farms (1.16 ha in 2010-11).However, empirical studies indicate that small size of land holdingsare not a deterrent to increasing productivity, which is determinedby focused research and investments, access to modern inputs,appropriate technology, and innovative marketing systems toaggregate and market the output eff iciently and effectively.
Category 11.6.2014 12.6.2013 13.6.2012 08.6.2011 09.6.2010 10.6.2009Number of Subdivisions
Excess/normal 8 30 23 3 11 2Def icient/scanty 28 6 8 19 19 18No rain 0 0 5 14 6 16Rainfall departure -44 23 -42 17 -6 -39from normal (%)
Per Cent Distribution of DistrictsExcess/normal 20 62 15 48 33 25Def icient/scanty 50 32 63 34 39 47No rain 30 6 22 18 28 28
Source: IMD, Weekly Report dated 11.06.2014.Notes: Excess: +20% or more; Normal: +19% to -19%; Def icient: -20% to -59%;
Scanty: -60% to -99%; No rain: -100%.
Table 8.4 : Category-wise RainfallDistribution in Subdivisions andDistricts and All India Rainfall
Departure from Normal2009-14 (cumulativerainfall since 1 June)
Contingency measures are inplace to tackle the def icientSW monsoon coupled with 70per cent chance of an El Ninooccurrence.
142 ECONOMIC SURVEY 2013-14
142
Gross Capital Formation8.18 Robustness of the agri sector can be attributed to the steadyincrease in GCF (both public and private) from 16.1 per cent of itsGDP in 2007-08 to 21.2 per cent in 2012-13 (2004-05 prices).However, public expenditure (comprising public investments andinput subsidies) has been ceding its share in total GCF of the agrisector to the private sector and was 14.7 per cent in 2012-13. As apercentage of agri GDP also private investment has been risingand was 18.1 per cent in 2012-13 (Table 8.1). The quality of publicGCF, which is largely directed towards subsidies, is also of concern.The largest increase in private GCF was in labour-saving machinessuch as irrigation and water-saving equipment (Twelfth Five YearPlan, Vol. II: 8), evidently a result of the declining rural workforceand rising real wages.
Agricultural Research and Education8.19 Maintaining sustainable growth in agriculture requirescontinual research in developing innovative technologies forconservation and management of limited natural resources. TheICAR has developed new crop varieties with specif ic traits thatimprove yield and nutritional quality along with tolerance/resistance to various biotic and abiotic stresses besides matchingcrop production and protection technologies for target agro-ecologies. For different agro-ecological niches, 104 varieties of variouscrops were released. To make quality seeds available to farmers,11,835 tonnes of breeder seeds of recommended varieties of differentf ield crops was produced. Adoption of improved varieties and cropmanagement techniques has resulted in record production of cereals,pulses, and other crops in recent years.
Seeds8.20 Seed quality accounts for 20-25 per cent of crop productivity.As hybrid seeds in cross-pollinated crops give higher yields, greateremphasis was placed on their production; thus, their availabilityhas been higher than the requirement. Certif ied/quality seedsaccount for about 30 per cent of total seeds used, though there aresignif icant variations across crops and states. Under the central-sector Development and Strengthening of Infrastructure Facilitiesfor Production and Distribution of Quality Seeds (DPQS) Schemethe availability of certif ied seeds has increased to 328.58 lakhquintals while requirement was 315.18 lakh quintals in 2012-13.8.21 Important policy initiatives under the amended New Policy onSeed Development (NPSD) include permitting 100 per cent foreigndirect investment (FDI) under the automatic route and simplifyingthe procedure for inclusion of new varieties in the Organisationfor Economic Cooperation and Development (OECD) Seeds Scheme.The thrust is also on creating a seed bank. A Seed Rolling Planfor the period up to 2016-17 is in place for all the states since2013-14 for identif ication of good varieties for the seed chain, andagencies responsible for production of seeds at every level.
Fertilizers8.22 Increased fertilizer usage has played a signif icant role inimproving agricultural productivity. Urea, which is the main source
More than 85 per cent ofinvestment in the agri sectoris by the private sector.
Agricultural research hasreleased new varieties ofbreeder seeds. Policy focus ison creating a seed bank.
AGRICULTURE AND FOOD MANAGEMENT 143
143
of nitrogen (N), constitutes around 50 per cent of total fertilizerconsumption. India meets 80 per cent of urea requirement throughindigenous production, but is largely import dependent for itspotassic (K) and phosphatic (P) fertilizer requirements.
8.23 A modif ied New Pricing Scheme (NPS)-III for existing ureaunits, notif ied to address under-recoveries of existing urea unitsdue to freezing of f ixed cost at 2002-03 rates will be implementedfor one year from 2 April 2014. It provides for the grant of minimumfixed cost of ` 2300 per metric tonne (MT) or actual f ixed costprevailing during 2012-13, whichever is lower. Further, there isprovision for grant of special compensation of ` 150 per MT toprotect eff icient units that have converted to gas and are morethan 30 years old.
8.24 Given the constraints in availability of gas, which is thepreferred feedstock for production of nitrogenous fertilizers, andthe dependence on imports for P and K fertilizers, Indian companiesare being encouraged to establish joint ventures (JVs) abroad forproduction facilities with buyback arrangements and to enter intolong- term agreement for supply of fertilizers and fertilizer inputsto India. Six JVs have been set up by Indian private/cooperative-sector entities.
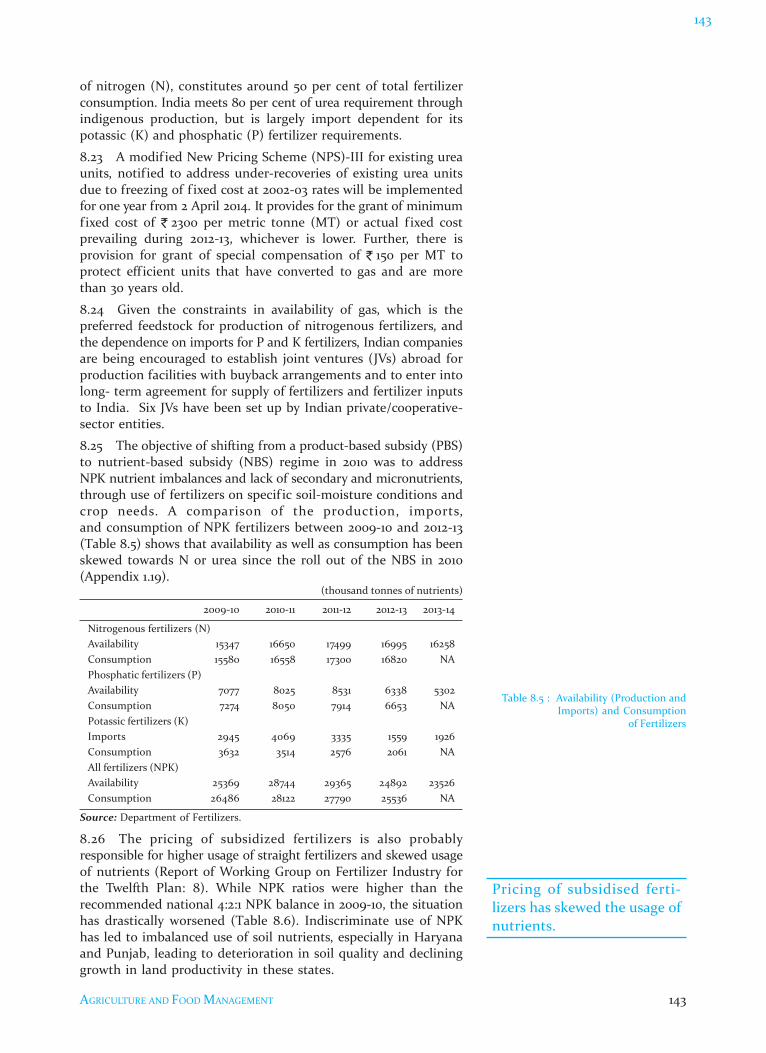
8.25 The objective of shifting from a product-based subsidy (PBS)to nutrient-based subsidy (NBS) regime in 2010 was to addressNPK nutrient imbalances and lack of secondary and micronutrients,through use of fertilizers on specif ic soil-moisture conditions andcrop needs. A comparison of the production, imports,and consumption of NPK fertilizers between 2009-10 and 2012-13(Table 8.5) shows that availability as well as consumption has beenskewed towards N or urea since the roll out of the NBS in 2010(Appendix 1.19).
(thousand tonnes of nutrients)
2009-10 2010-11 2011-12 2012-13 2013-14
Nitrogenous fertilizers (N) Availability 15347 16650 17499 16995 16258Consumption 15580 16558 17300 16820 NAPhosphatic fertilizers (P) Availability 7077 8025 8531 6338 5302Consumption 7274 8050 7914 6653 NAPotassic fertilizers (K) Imports 2945 4069 3335 1559 1926Consumption 3632 3514 2576 2061 NAAll fertilizers (NPK) Availability 25369 28744 29365 24892 23526Consumption 26486 28122 27790 25536 NA
Source: Department of Fertilizers.
Table 8.5 : Availability (Production andImports) and Consumption
of Fertilizers
8.26 The pricing of subsidized fertilizers is also probablyresponsible for higher usage of straight fertilizers and skewed usageof nutrients (Report of Working Group on Fertilizer Industry forthe Twelfth Plan: 8). While NPK ratios were higher than therecommended national 4:2:1 NPK balance in 2009-10, the situationhas drastically worsened (Table 8.6). Indiscriminate use of NPKhas led to imbalanced use of soil nutrients, especially in Haryanaand Punjab, leading to deterioration in soil quality and declininggrowth in land productivity in these states.
Pricing of subsidised ferti-lizers has skewed the usage ofnutrients.
144 ECONOMIC SURVEY 2013-14
144
8.27 The NBS roll out was flawed since urea was kept out of itsambit (Twelfth Five Year Plan, Vol. II: 14), which has defeated theobjective of balanced use of nutrients. While urea consumptionhas increased from 59 per cent to 66 per cent of total consumptionin 2012-13 over 2010-11, per hectare consumption of fertilizer hasdeclined from 140 kg to 128 kg over the same period. Current trendsin agricultural output reveal that the marginal productivity of soilin relation to the application of fertilizers is declining.
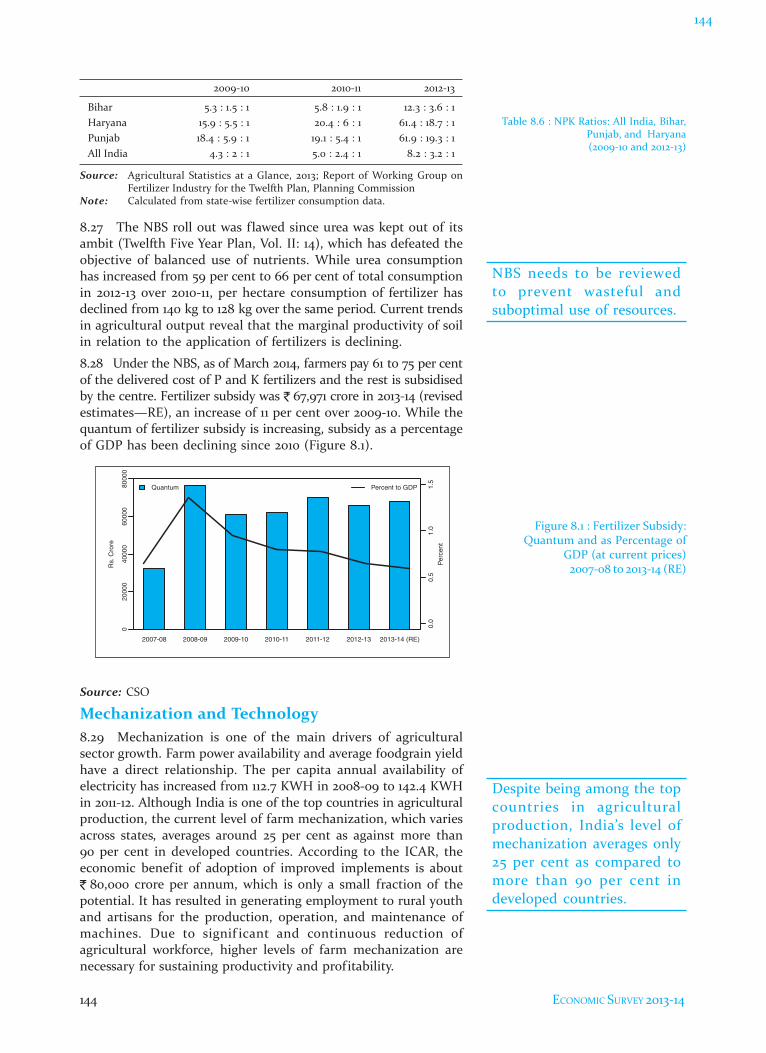
8.28 Under the NBS, as of March 2014, farmers pay 61 to 75 per centof the delivered cost of P and K fertilizers and the rest is subsidisedby the centre. Fertilizer subsidy was ` 67,971 crore in 2013-14 (revisedestimates—RE), an increase of 11 per cent over 2009-10. While thequantum of fertilizer subsidy is increasing, subsidy as a percentageof GDP has been declining since 2010 (Figure 8.1).
Mechanization and Technology8.29 Mechanization is one of the main drivers of agriculturalsector growth. Farm power availability and average foodgrain yieldhave a direct relationship. The per capita annual availability ofelectricity has increased from 112.7 KWH in 2008-09 to 142.4 KWHin 2011-12. Although India is one of the top countries in agriculturalproduction, the current level of farm mechanization, which variesacross states, averages around 25 per cent as against more than90 per cent in developed countries. According to the ICAR, theeconomic benef it of adoption of improved implements is about` 80,000 crore per annum, which is only a small fraction of thepotential. It has resulted in generating employment to rural youthand artisans for the production, operation, and maintenance ofmachines. Due to signif icant and continuous reduction ofagricultural workforce, higher levels of farm mechanization arenecessary for sustaining productivity and prof itability.
Figure 8.1 : Fertilizer Subsidy:Quantum and as Percentage of
GDP (at current prices)2007-08 to 2013-14 (RE)
2009-10 2010-11 2012-13
Bihar 5.3 : 1.5 : 1 5.8 : 1.9 : 1 12.3 : 3.6 : 1Haryana 15.9 : 5.5 : 1 20.4 : 6 : 1 61.4 : 18.7 : 1Punjab 18.4 : 5.9 : 1 19.1 : 5.4 : 1 61.9 : 19.3 : 1All India 4.3 : 2 : 1 5.0 : 2.4 : 1 8.2 : 3.2 : 1
Source: Agricultural Statistics at a Glance, 2013; Report of Working Group onFertilizer Industry for the Twelfth Plan, Planning Commission
Note: Calculated from state-wise fertilizer consumption data.
Table 8.6 : NPK Ratios: All India, Bihar,Punjab, and Haryana(2009-10 and 2012-13)
NBS needs to be reviewedto prevent wasteful andsuboptimal use of resources.
Source: CSO
Despite being among the topcountries in agriculturalproduction, India’s level ofmechanization averages only25 per cent as compared tomore than 90 per cent indeveloped countries.
AGRICULTURE AND FOOD MANAGEMENT 145
145
8.30 The main challenges for farm mechanization are, f irst, a highlydiverse agriculture with different soil and climatic zones, requiringcustomized farm machinery and equipment and, second, largelysmall land holdings with limited resources. A dedicated Sub-Missionon Agricultural Mechanization has been initiated in the TwelfthPlan, with focus on spreading farm mechanization to small andmarginal farmers and regions that have low farm power availability.
Irrigation8.31 Water is the most critical input for agriculture. Currently63 million ha, or 45 per cent of net cropped area, is irrigated.Under the Accelerated Irrigation Benef it Programme (AIBP),` 64,228 crore of central loan assistance (CLA)/grant had beenreleased up to 31 December 2013. An irrigation potential of 8054.61thousand ha is estimated to have been created by states from major/medium/minor irrigation projects under the AIBP till March 2012.
8.32 The cropping pattern adopted in the Punjab - Haryana region,considered the ‘rice bowl of India’, has resulted in alarmingreduction in the water table, which is not sustainable in the longrun. Therefore, a Crop Diversif ication programme, targeted atpromoting technological innovation and encouraging farmers tochoose crop alternatives in the states of Punjab and Haryana andin western UP to counter the problems of stagnating yields andoverexploitation of water resources, was budgeted with ` 500 crorein 2013-14.
Credit8.33 Agricultural credit is an important input for improvingagricultural production and productivity and mitigating farmerdistress. For improving agricultural credit flow and bringing downthe rate of interest on farm loans, (i) Agricultural credit flow targetfor 2013-14 was f ixed at ` 7,00,000 crore and achievement was` 7,30,765 crore, as against ` 6,07,375 crore in 2012-13; (ii) Farmerscould avail of crop loans up to a principal amount of ` 3,00,000 at7 per cent rate of interest. The effective rate of interest for farmerswho promptly repay their loans was 4 per cent per annum during2013-14; (iii) Farmers were granted post-harvest loans againstnegotiable warehouse receipts (NWRs) at commercial rates. Toencourage storage of produce in warehouses against NWRs, thebenef it of interest subvention was extended to small and marginalfarmers with kisan credit cards (KCC) for a further period of up tosix months post-harvest on the same rate as crop loan.
Insurance8.34 Various crop insurance schemes are implemented as part ofrisk management and risk mitigation in agriculture. The central-sector National Crop Insurance Programme (NCIP) that replacedthe National Agricultural Insurance Scheme (NAIS) f rom1 November 2013 has three components: Pilot Modif ied NationalAgricultural Insurance Scheme (MNAIS), Pilot Weather Based CropInsurance Scheme (WBCIS), and Pilot Coconut Palm InsuranceScheme (CPIS). The NCIP is approved for full-f ledgedimplementation from Rabi 2013-14, with modif ications like makingthe insurance unit for major crops the village panchayat or
Enhanced agricultural creditf lows are exceeding thetargets.
Overexploitation of waterresources is leading to alar-ming reduction in the watertable in the ‘rice bowl of India’.
Modif ied insurance scheme isexpected to have greatercoverage.
146 ECONOMIC SURVEY 2013-14
146
equivalent unit and undertaking individual farm-level assessmentof losses in case of localized calamities like hailstorm and landslideto benef it the farmer.
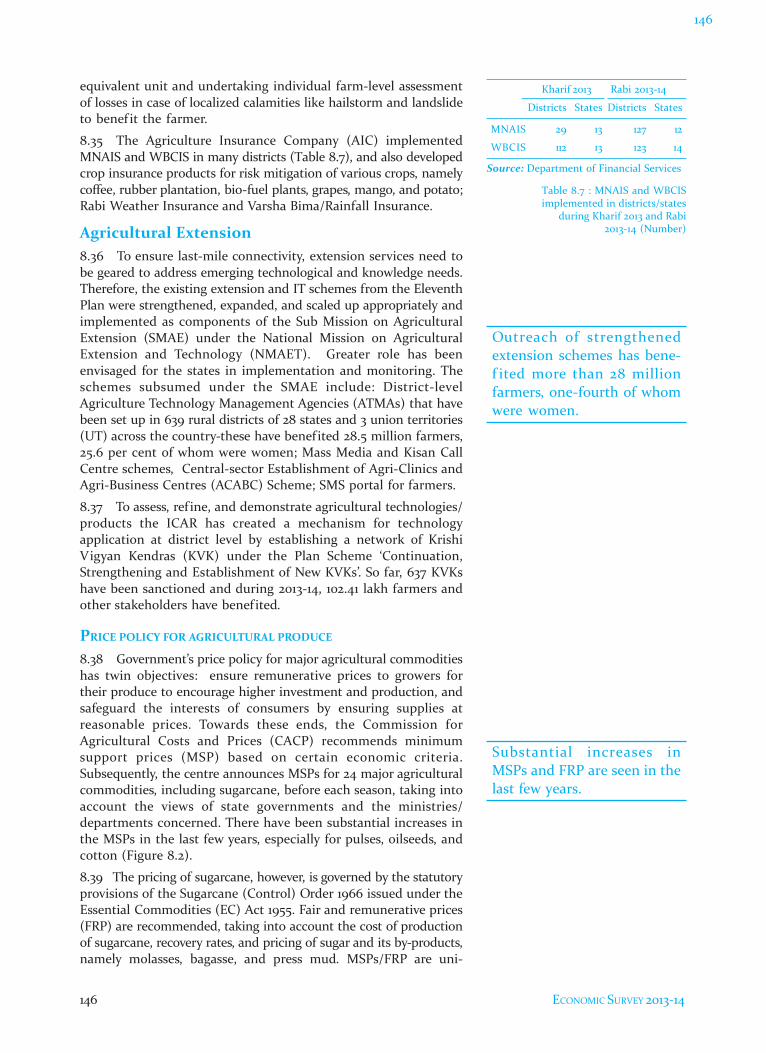
8.35 The Agriculture Insurance Company (AIC) implementedMNAIS and WBCIS in many districts (Table 8.7), and also developedcrop insurance products for risk mitigation of various crops, namelycoffee, rubber plantation, bio-fuel plants, grapes, mango, and potato;Rabi Weather Insurance and Varsha Bima/Rainfall Insurance.
Agricultural Extension8.36 To ensure last-mile connectivity, extension services need tobe geared to address emerging technological and knowledge needs.Therefore, the existing extension and IT schemes from the EleventhPlan were strengthened, expanded, and scaled up appropriately andimplemented as components of the Sub Mission on AgriculturalExtension (SMAE) under the National Mission on AgriculturalExtension and Technology (NMAET). Greater role has beenenvisaged for the states in implementation and monitoring. Theschemes subsumed under the SMAE include: District-levelAgriculture Technology Management Agencies (ATMAs) that havebeen set up in 639 rural districts of 28 states and 3 union territories(UT) across the country-these have benef ited 28.5 million farmers,25.6 per cent of whom were women; Mass Media and Kisan CallCentre schemes, Central-sector Establishment of Agri-Clinics andAgri-Business Centres (ACABC) Scheme; SMS portal for farmers.
8.37 To assess, ref ine, and demonstrate agricultural technologies/products the ICAR has created a mechanism for technologyapplication at district level by establishing a network of KrishiVigyan Kendras (KVK) under the Plan Scheme ‘Continuation,Strengthening and Establishment of New KVKs’. So far, 637 KVKshave been sanctioned and during 2013-14, 102.41 lakh farmers andother stakeholders have benef ited.
PRICE POLICY FOR AGRICULTURAL PRODUCE
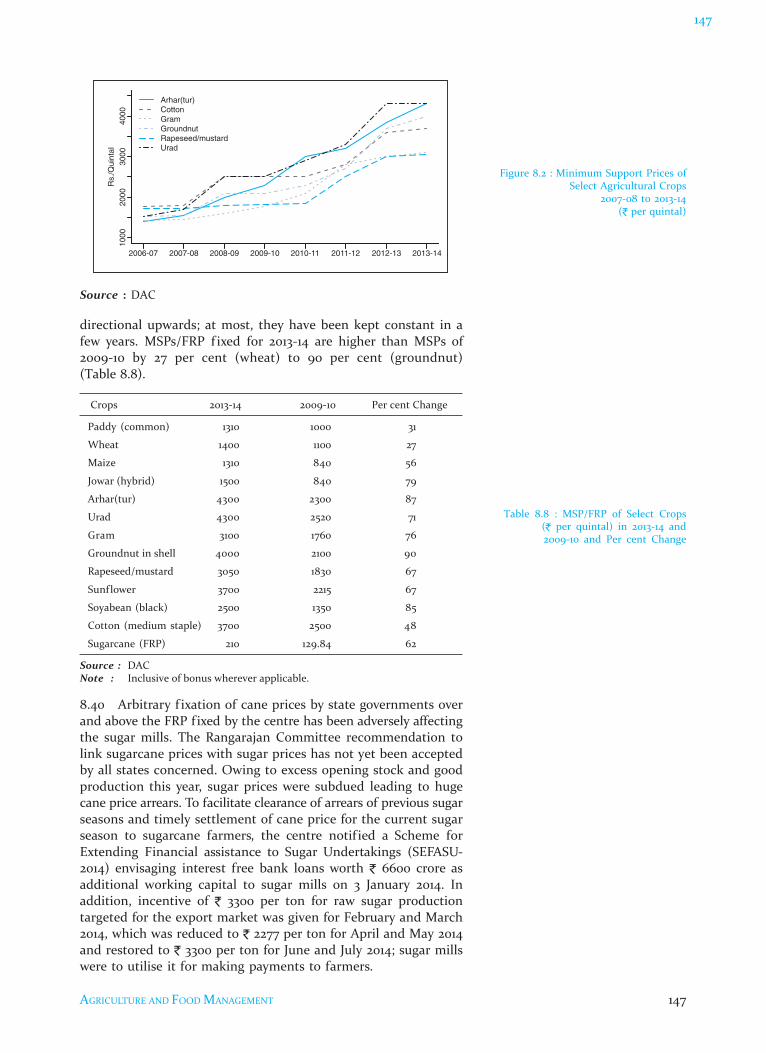
8.38 Government’s price policy for major agricultural commoditieshas twin objectives: ensure remunerative prices to growers fortheir produce to encourage higher investment and production, andsafeguard the interests of consumers by ensuring supplies atreasonable prices. Towards these ends, the Commission forAgricultural Costs and Prices (CACP) recommends minimumsupport prices (MSP) based on certain economic criteria.Subsequently, the centre announces MSPs for 24 major agriculturalcommodities, including sugarcane, before each season, taking intoaccount the views of state governments and the ministries/departments concerned. There have been substantial increases inthe MSPs in the last few years, especially for pulses, oilseeds, andcotton (Figure 8.2).
8.39 The pricing of sugarcane, however, is governed by the statutoryprovisions of the Sugarcane (Control) Order 1966 issued under theEssential Commodities (EC) Act 1955. Fair and remunerative prices(FRP) are recommended, taking into account the cost of productionof sugarcane, recovery rates, and pricing of sugar and its by-products,namely molasses, bagasse, and press mud. MSPs/FRP are uni-
Source: Department of Financial Services
Table 8.7 : MNAIS and WBCISimplemented in districts/states
during Kharif 2013 and Rabi2013-14 (Number)
Kharif 2013 Rabi 2013-14
Districts States Districts States
MNAIS 29 13 127 12
WBCIS 112 13 123 14
Outreach of strengthenedextension schemes has bene-f ited more than 28 millionfarmers, one-fourth of whomwere women.
Substantial increases inMSPs and FRP are seen in thelast few years.
AGRICULTURE AND FOOD MANAGEMENT 147
147
Figure 8.2 : Minimum Support Prices ofSelect Agricultural Crops
2007-08 to 2013-14(` per quintal)
Source : DAC
directional upwards; at most, they have been kept constant in afew years. MSPs/FRP f ixed for 2013-14 are higher than MSPs of2009-10 by 27 per cent (wheat) to 90 per cent (groundnut)(Table 8.8).
Crops 2013-14 2009-10 Per cent Change
Paddy (common) 1310 1000 31
Wheat 1400 1100 27
Maize 1310 840 56
Jowar (hybrid) 1500 840 79
Arhar(tur) 4300 2300 87
Urad 4300 2520 71
Gram 3100 1760 76
Groundnut in shell 4000 2100 90
Rapeseed/mustard 3050 1830 67
Sunflower 3700 2215 67
Soyabean (black) 2500 1350 85
Cotton (medium staple) 3700 2500 48
Sugarcane (FRP) 210 129.84 62
Source : DACNote : Inclusive of bonus wherever applicable.
Table 8.8 : MSP/FRP of Select Crops(` per quintal) in 2013-14 and2009-10 and Per cent Change
8.40 Arbitrary f ixation of cane prices by state governments overand above the FRP f ixed by the centre has been adversely affectingthe sugar mills. The Rangarajan Committee recommendation tolink sugarcane prices with sugar prices has not yet been acceptedby all states concerned. Owing to excess opening stock and goodproduction this year, sugar prices were subdued leading to hugecane price arrears. To facilitate clearance of arrears of previous sugarseasons and timely settlement of cane price for the current sugarseason to sugarcane farmers, the centre notif ied a Scheme forExtending Financial assistance to Sugar Undertakings (SEFASU-2014) envisaging interest free bank loans worth ` 6600 crore asadditional working capital to sugar mills on 3 January 2014. Inaddition, incentive of ` 3300 per ton for raw sugar productiontargeted for the export market was given for February and March2014, which was reduced to ` 2277 per ton for April and May 2014and restored to ` 3300 per ton for June and July 2014; sugar millswere to utilise it for making payments to farmers.
148 ECONOMIC SURVEY 2013-14
148
HORTICULTURE
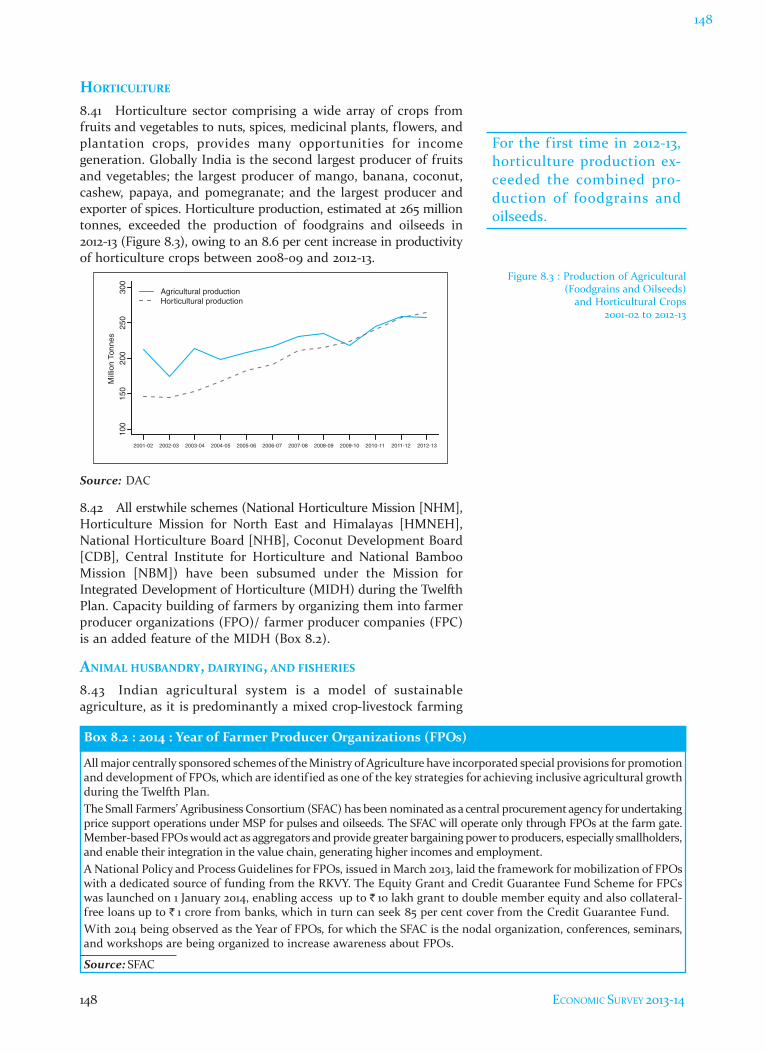
8.41 Horticulture sector comprising a wide array of crops fromfruits and vegetables to nuts, spices, medicinal plants, flowers, andplantation crops, provides many opportunities for incomegeneration. Globally India is the second largest producer of fruitsand vegetables; the largest producer of mango, banana, coconut,cashew, papaya, and pomegranate; and the largest producer andexporter of spices. Horticulture production, estimated at 265 milliontonnes, exceeded the production of foodgrains and oilseeds in2012-13 (Figure 8.3), owing to an 8.6 per cent increase in productivityof horticulture crops between 2008-09 and 2012-13.
Figure 8.3 : Production of Agricultural(Foodgrains and Oilseeds)
and Horticultural Crops2001-02 to 2012-13
8.42 All erstwhile schemes (National Horticulture Mission [NHM],Horticulture Mission for North East and Himalayas [HMNEH],National Horticulture Board [NHB], Coconut Development Board[CDB], Central Institute for Horticulture and National BambooMission [NBM]) have been subsumed under the Mission forIntegrated Development of Horticulture (MIDH) during the TwelfthPlan. Capacity building of farmers by organizing them into farmerproducer organizations (FPO)/ farmer producer companies (FPC)is an added feature of the MIDH (Box 8.2).
ANIMAL HUSBANDRY, DAIRYING, AND FISHERIES
8.43 Indian agricultural system is a model of sustainableagriculture, as it is predominantly a mixed crop-livestock farming
Source: DAC
For the f irst time in 2012-13,horticulture production ex-ceeded the combined pro-duction of foodgrains andoilseeds.
Box 8.2 : 2014 : Year of Farmer Producer Organizations (FPOs)
All major centrally sponsored schemes of the Ministry of Agriculture have incorporated special provisions for promotionand development of FPOs, which are identif ied as one of the key strategies for achieving inclusive agricultural growthduring the Twelfth Plan.The Small Farmers’ Agribusiness Consortium (SFAC) has been nominated as a central procurement agency for undertakingprice support operations under MSP for pulses and oilseeds. The SFAC will operate only through FPOs at the farm gate.Member-based FPOs would act as aggregators and provide greater bargaining power to producers, especially smallholders,and enable their integration in the value chain, generating higher incomes and employment.A National Policy and Process Guidelines for FPOs, issued in March 2013, laid the framework for mobilization of FPOswith a dedicated source of funding from the RKVY. The Equity Grant and Credit Guarantee Fund Scheme for FPCswas launched on 1 January 2014, enabling access up to ` 10 lakh grant to double member equity and also collateral-free loans up to ` 1 crore from banks, which in turn can seek 85 per cent cover from the Credit Guarantee Fund.With 2014 being observed as the Year of FPOs, for which the SFAC is the nodal organization, conferences, seminars,and workshops are being organized to increase awareness about FPOs.
Source: SFAC
AGRICULTURE AND FOOD MANAGEMENT 149
149
system, with the livestock segment supplementing farm incomesby providing employment, draught animals, and manure.
Dairy and Poultry8.44 India ranks f irst in milk production, accounting for 17 percent of world production. During 2012-13, milk production peakedat 132.43 mt, thus becoming an important secondary source ofincome for 70 million rural households engaged in dairying and for70 per cent of the workforce that comprised women. The averageyear-on-year growth rate of milk at 4.04 per cent vis-à-vis the worldaverage of 2.2 per cent shows sustained growth in availability ofmilk and milk products for the growing population.
8.45 A comprehensive new scheme National Programme onBovine Breeding and Dairy Development was launched with theobjective of enhancing milk production and productivity in asustainable manner. The National Dairy Plan Phase-I, launched inMarch 2012 with the objectives of improving productivity of milchanimals, strengthening and expanding village-level infrastructurefor milk procurement, and providing producers greater access tothe market in the dairy sector continues. The number of milchanimals increased from 62 million in 2000 to 83.15 million in 2012,thus adding to the improved milch herd of the country.
8.46 Government’s focus, besides framing conducive policies forcommercial poultry production, is on strengthening the familypoultry system, which addresses livelihood issues. Egg productionwas around 69.73 billion in 2013, while poultry meat production isestimated at 2.68 mt (Appendix 1.20).
Fisheries8.47 Fisheries is an important source of livelihood and f ish, arean important source of protein. There are 14.4 million f ishermenin the country. India ranks second in world f ish production,contributing about 5.4 per cent of global f ish production. It is alsoa major producer of f ish through aquaculture. Total f ish productionduring 2013-14 is estimated at 9.45 mt with 6.10 mt coming fromthe inland sector and 3.35 mt from the marine sector. The sectorcontributes about 1 per cent to overall GDP and represents4.6 per cent of agri GDP.
Livestock Health8.48 To effectively tackle the issue of livestock health andstrengthen efforts to manage animal diseases of a trans-boundarynature in a comprehensive manner, the centrally sponsored LivestockHealth and Disease Control (LH&DC) Scheme was launched in theTwelfth Plan with modification of existing components and inclusionof new ones. The implementation of various animal disease controlprogrammes has seen overall reduction in incidence of animal diseasesin the country, which augurs well for public health. The NationalLivestock Mission (NLM) has been formulated encompassing sevencentrally sponsored and seven central-sector schemes, with theobjective of sustainable development of the livestock sector. TheMission is designed to cover all the activities required to ensurequantitative and qualitative improvements in livestock productionsystems and capacity building of all stakeholders.
Fisheries and the livestocksector are important secon-dary sources of income forrural households, contri-buting over 1 per cent and4.1 per cent respectively tototal GDP.
Globally, India ranks f irst inmilk production with anaverage y-o-y growth rate ofover 4 per cent.
150 ECONOMIC SURVEY 2013-14
150
Box 8.3 : Need for Reforms in Agricultural Marketing
There has been limited success in establishing eff icient agricultural marketing practices in India. The monopoly ofgovernment-regulated wholesale markets has prevented development of a competitive marketing system in thecountry. In the context of liberalization of trade in agricultural commodities and for the domestic farming communityto reap the benef its of new global market access opportunities, there is a need to integrate and strengthen theinternal agricultural marketing system.Various committees and task forces of the government recommended that control over agricultural markets by thestate be eased to facilitate greater participation of the private sector, particularly to stimulate massive investmentsrequired for the development of agricultural marketing. The model Agricultural Produce Marketing (Developmentand Regulation) [APM(DR)] Act of 2003 was circulated to all states for adoption. The reforms have largely focusedon addressing some of the concerns within the existing framework of state Agricultural Produce Marketing Committees(APMC). They have however failed to address monopolistic and uncompetitive practices in inter-state trading ofagricultural products. The Committee on Agricultural Reforms (2013) noted that, ‘By and large, the APMCs haveemerged as some sort of Government sponsored monopolies in supply of marketing services/ facilities, with alldrawbacks and ineff iciency associated with a monopoly’.Thus, the APMC Act has not achieved the basic objective of setting up a network of physical markets. There are somesuccessful initiatives in direct marketing, such as Apni Mandi in Punjab, Uzhavar Sandhai in Tamil Nadu, ShetkariBazaar in Maharashtra, Hadaspur Vegetable Market in Pune, Rythu Bazar in Andhra Pradesh, Krushak Bazaar inOdisha, and Kisan Mandi in Rajasthan.Some measures that would facilitate the creation of a barrier-free national market are:
(i) Permit sale and purchase of all perishable commodities such as fruits and vegetables, milk and f ish in anymarket. This could later be extended to all agricultural produce.
(ii) Exempt market fee on fruits and vegetables and reduce the high incidence of commission charges on agricultural/horticultural produce.
(iii) Taking a cue from the success of direct marketing efforts of states, the APMC/other market infrastructure maybe used to organize farmers markets. FPOs/self-help groups (SHGs) can be encouraged to organize farmersmarkets near urban centres, malls, etc. that have large open spaces. These could be organized every day or onweekends, depending on the concentration of footfalls.
(iv) Include ‘facilitating organization of farmers markets’ under the permitted list of corporate social responsibility(CSR) activities under Companies Act 2013, to encourage companies engaged in agri-allied activities, foodprocessing etc to take up this activity under CSR and also help in setting up supply chain infrastructure. Thiswould be similar to the e-Choupal initiative of ITC Ltd., but under CSR.
(v) All the above facilitators can also tie-up a link to the commodity exchanges’ platform to disseminate spot andfutures prices of agricultural commodities.
DOMESTIC AGRICULTURAL MARKETING
8.49 Organized marketing of agricultural commodities has beenpromoted through a network of regulated markets, whose basicobjective is to ensure reasonable prices to both farmers andconsumers by creating a conducive market environment for fairplay of supply and demand. The number of regulated markets hasgrown from 286 in 1950 to 7114 as on 31 March 2014; besides whichthere are 22,759 rural periodical markets.The average area served bya market is 114.45 sq. km while the average area served by a regulatedmarket is 462.08 sq. km, varying from 118.78 sq. km in Punjab to11,214 sq. km in Meghalaya. The National Commission onAgriculture (2004) recommended a norm of one market within aradius of 5 km (or 80 sq. km). The low market spread createsproblems of market access.
8.50 The problem of intermittent surges in food prices has persistedin India despite various reform measures undertaken. The high costsof intermediation have a cascading effect on prices. The Committeeon Agricultural Reforms (2013) recommended, inter alia, a barrier-free national market for the benef it of farmers and consumers.Box 8.3 underlines the urgency of agricultural marketing reforms.
Need for holistic reform of the‘farm-to-fork’ supply chain tosolve the persistent foodinflation.
AGRICULTURE AND FOOD MANAGEMENT 151
151
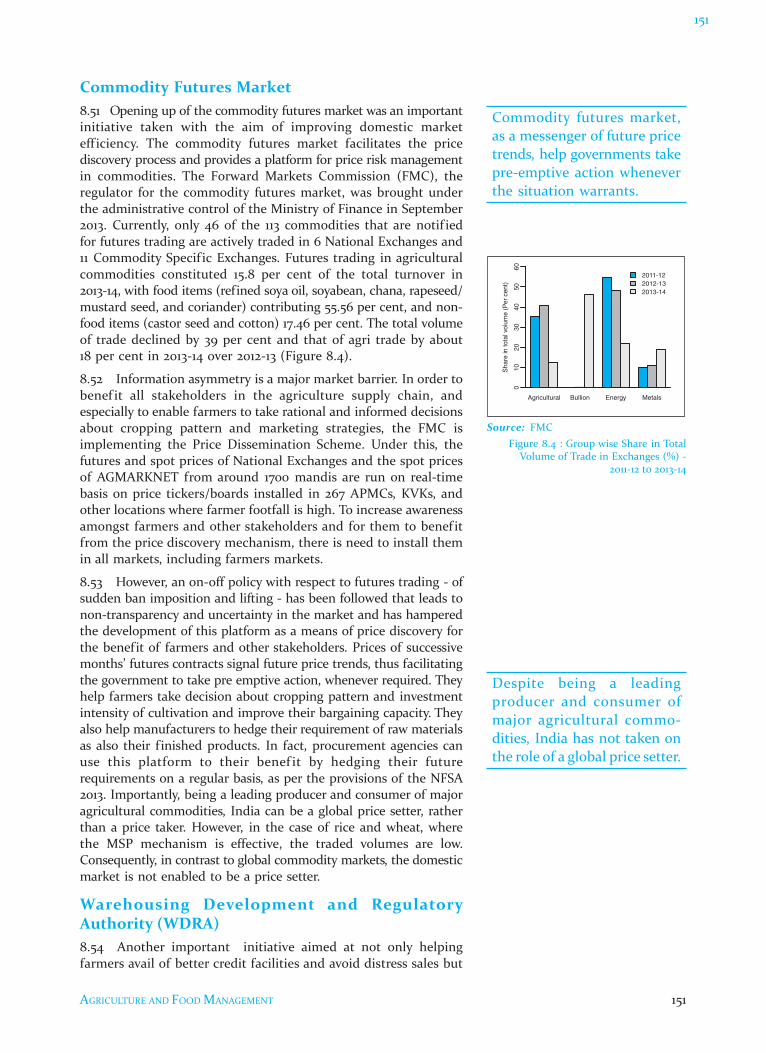
Commodity Futures Market8.51 Opening up of the commodity futures market was an importantinitiative taken with the aim of improving domestic marketeff iciency. The commodity futures market facilitates the pricediscovery process and provides a platform for price risk managementin commodities. The Forward Markets Commission (FMC), theregulator for the commodity futures market, was brought underthe administrative control of the Ministry of Finance in September2013. Currently, only 46 of the 113 commodities that are notif iedfor futures trading are actively traded in 6 National Exchanges and11 Commodity Specif ic Exchanges. Futures trading in agriculturalcommodities constituted 15.8 per cent of the total turnover in2013-14, with food items (refined soya oil, soyabean, chana, rapeseed/mustard seed, and coriander) contributing 55.56 per cent, and non-food items (castor seed and cotton) 17.46 per cent. The total volumeof trade declined by 39 per cent and that of agri trade by about18 per cent in 2013-14 over 2012-13 (Figure 8.4).
8.52 Information asymmetry is a major market barrier. In order tobenef it all stakeholders in the agriculture supply chain, andespecially to enable farmers to take rational and informed decisionsabout cropping pattern and marketing strategies, the FMC isimplementing the Price Dissemination Scheme. Under this, thefutures and spot prices of National Exchanges and the spot pricesof AGMARKNET from around 1700 mandis are run on real-timebasis on price tickers/boards installed in 267 APMCs, KVKs, andother locations where farmer footfall is high. To increase awarenessamongst farmers and other stakeholders and for them to benef itfrom the price discovery mechanism, there is need to install themin all markets, including farmers markets.
8.53 However, an on-off policy with respect to futures trading - ofsudden ban imposition and lifting - has been followed that leads tonon-transparency and uncertainty in the market and has hamperedthe development of this platform as a means of price discovery forthe benefit of farmers and other stakeholders. Prices of successivemonths’ futures contracts signal future price trends, thus facilitatingthe government to take pre emptive action, whenever required. Theyhelp farmers take decision about cropping pattern and investmentintensity of cultivation and improve their bargaining capacity. Theyalso help manufacturers to hedge their requirement of raw materialsas also their f inished products. In fact, procurement agencies canuse this platform to their benef it by hedging their futurerequirements on a regular basis, as per the provisions of the NFSA2013. Importantly, being a leading producer and consumer of majoragricultural commodities, India can be a global price setter, ratherthan a price taker. However, in the case of rice and wheat, wherethe MSP mechanism is effective, the traded volumes are low.Consequently, in contrast to global commodity markets, the domesticmarket is not enabled to be a price setter.
Warehousing Development and RegulatoryAuthority (WDRA)8.54 Another important initiative aimed at not only helpingfarmers avail of better credit facilities and avoid distress sales but
Figure 8.4 : Group wise Share in TotalVolume of Trade in Exchanges (%) -
2011-12 to 2013-14
Source: FMC
Despite being a leadingproducer and consumer ofmajor agricultural commo-dities, India has not taken onthe role of a global price setter.
Commodity futures market,as a messenger of future pricetrends, help governments takepre-emptive action wheneverthe situation warrants.
152 ECONOMIC SURVEY 2013-14
152
also at safeguarding f inancial institutions by mitigating risksinherent in credit extension to farmers, is the introduction ofNWRs as a tradable receipt. The WDRA, as the authority forregistering and accrediting warehouses intending to issue NWRs,has approved 40 agricultural commodities including cereals, pulses,oilseeds, and spices for issuing NWRs. So far, 302 warehouses havebeen accredited, of which 271 warehouses of the CentralWarehousing Corporation, State Warehousing Corporations, andprivate organizations with 10.55 lakh MT storage capacity havebeen registered.
8.55 In order to improve the quality of warehousing and deliveryaspects, the FMC directed all commodity exchanges to register withthe WDRA. However, in the case of rice and wheat, farmers arereportedly not using NWRs as they f ind it more prof itable andconvenient to sell their produce at MSP to the guarantor, that isthe procurement agencies. In addition, even in areas whereprocurement agencies have fewer operations, the NWRs are notgaining ground. An open competitive market is an essentialcondition for both these initiatives to operate successfully.
Food Processing8.56 With the decline in farm employment, additionalemployment opportunities have to be created in the non-farm andmanufacturing sectors, especially in agro-based rural industries.Incentivizing and developing downstream market linkages, in theform of agro industries, is crucial for growth of agriculture. Duringthe last f ive years ending 2012-13, the sector has been growing fasterthan the agriculture sector, at an average annual growth rate ofaround 8.4 per cent. The role of the private sector is crucial as itslarge investments can bring in economies of scale in operations.
8.57 Even though India is the largest producer of severalagricultural commodities, there are high levels of losses in the supplychain. A study conducted by the Central Institute of Post-HarvestEngineering and Technology (CIPHET) in 2010 put the losses inthe range of 0.8 per cent to 18 per cent and attributed them toseveral factors including non-availability of facilities foraggregation, packaging, storage, transportation, and cold chain andlow level of processing of agricultural produce. In an emergingcountry like India, where growth with equity is a primary policythrust, the development of the food-processing sector will addressseveral concerns such as disguised unemployment in agriculture,rural poverty, food security, food inflation, improved nutrition, andprevention of wastage of food. Towards this end, the governmentis supporting creation of modern enabling infrastructure andeff icient processing facilities. These initiatives include setting upof (i) mega food parks, (ii) cold chain, value addition andpreservation infrastructure, (iii) new and modernization of existingabattoirs.
Trade Policy8.58 India, with a large and diverse agriculture, is among theworld’s leading producers of rice, wheat, milk, sugarcane, fruits,and vegetables. Therefore, changes in its balance sheets for keycommodities will have a potentially large impact on world markets.
Both futures trading andNWRs would be successfulonly under competitivemarket conditions.
Large-scale private invest-ments are essential fordeveloping the agro-process-ing sector, which is the nextgrowth vehicle.
Long-term stable trade policyis necessary for improvingagricultural productivity.
AGRICULTURE AND FOOD MANAGEMENT 153
153
However, India has largely been an autarkic nation and a hesitantparticipant in global trade.
8.59 The basic customs duty (BCD) in some agri products wasreduced/removed to encourage domestic manufacture of value addedproducts, to generate employment, and to make exports competitive.To combat undervaluation and protect the interests of domesticfarmers and industry, the BCD of some agri products was raised(Box 8.4).
8.60 Generally an ad hoc trade policy has been followed foragricultural commodities, more often as a knee-jerk reaction to thedomestic price situation, which puts the domestic as well asinternational market under great uncertainty, and the farmer, beingat the bottom of the pyramid, is severely impacted. It also leads toerosion of conf idence in India being a trustworthy supplier in theinternational market. A stable and long-term trade policy withrespect to agricultural products is essential for increasingproductivity. Signif icantly, some policy changes were made in recentyears: exports of rice and wheat were permitted since 2011; andsince February 2013 processed and/or value added agriculturalproducts were exempted from export restrictions/bans even if theirbase produce is subject to an export ban. These will benefit farmers,incentivize the development of the agro-processing sector, andenhance farm productivity.
MEASURABLE OUTCOMES
8.61 All efforts at promoting agriculture through various schemes,subsidies, and programmes have resulted in record production offoodgrains this year. However, the levels of productivity, availability,and exports of agri products are more signif icant for the economy.
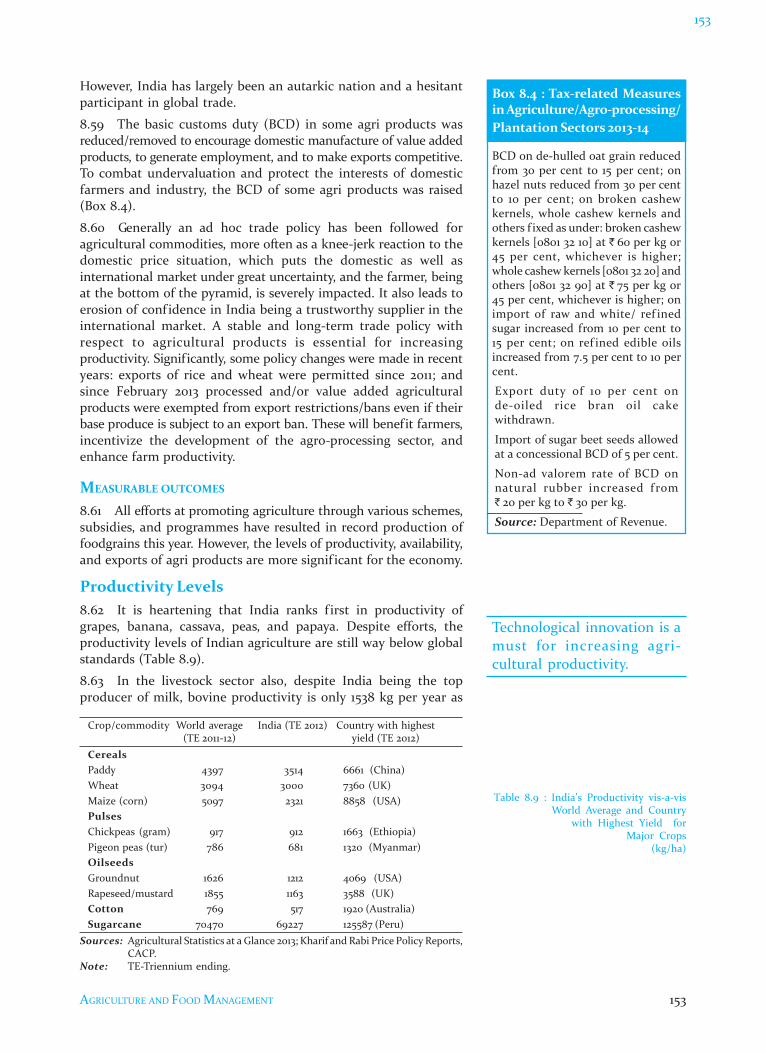
Productivity Levels8.62 It is heartening that India ranks f irst in productivity ofgrapes, banana, cassava, peas, and papaya. Despite efforts, theproductivity levels of Indian agriculture are still way below globalstandards (Table 8.9).
8.63 In the livestock sector also, despite India being the topproducer of milk, bovine productivity is only 1538 kg per year as
Box 8.4 : Tax-related Measuresin Agriculture/Agro-processing/Plantation Sectors 2013-14
BCD on de-hulled oat grain reducedfrom 30 per cent to 15 per cent; onhazel nuts reduced from 30 per centto 10 per cent; on broken cashewkernels, whole cashew kernels andothers f ixed as under: broken cashewkernels [0801 32 10] at ` 60 per kg or45 per cent, whichever is higher;whole cashew kernels [0801 32 20] andothers [0801 32 90] at ` 75 per kg or45 per cent, whichever is higher; onimport of raw and white/ ref inedsugar increased from 10 per cent to15 per cent; on ref ined edible oilsincreased from 7.5 per cent to 10 percent.
Export duty of 10 per cent onde-oiled rice bran oil cakewithdrawn.
Import of sugar beet seeds allowedat a concessional BCD of 5 per cent.
Non-ad valorem rate of BCD onnatural rubber increased f rom` 20 per kg to ` 30 per kg.
Source: Department of Revenue.
Crop/commodity World average India (TE 2012) Country with highest(TE 2011-12) yield (TE 2012)
Cereals Paddy 4397 3514 6661 (China)Wheat 3094 3000 7360 (UK)Maize (corn) 5097 2321 8858 (USA)Pulses Chickpeas (gram) 917 912 1663 (Ethiopia)Pigeon peas (tur) 786 681 1320 (Myanmar)Oilseeds Groundnut 1626 1212 4069 (USA)Rapeseed/mustard 1855 1163 3588 (UK)Cotton 769 517 1920 (Australia)Sugarcane 70470 69227 125587 (Peru)
Sources: Agricultural Statistics at a Glance 2013; Kharif and Rabi Price Policy Reports,CACP.
Note: TE-Triennium ending.
Table 8.9 : India’s Productivity vis-a-visWorld Average and Country
with Highest Yield forMajor Crops
(kg/ha)
Technological innovation is amust for increasing agri-cultural productivity.
154 ECONOMIC SURVEY 2013-14
154
compared to the world average of 2238 kg per year. This is mainlydue to low genetic potential for milk production of nondescriptbovines and poor levels of nutrition. Without new technology andquality inputs, growth acceleration will be diff icult to achieve atthese productivity levels.
Net availability and per capita availability8.63 The net availability of foodgrains has increased in 2013 at229.1 million tonnes showing a 15 per cent increase over last year.The per capita net availability of foodgrains spurted to 186.4 kg peryear from 164.3 kg per year, and the net availability of edible oilsalso increased from 12.7 kg per year to 15.8 kg per year over thesame period (Appendices 1.16 to 1.18). The per capita availability ofmilk at 295 g per day is higher than the world average, while thatof eggs is around 55 eggs per year. The per capita availability offruits rose from 114 grams per day in 2001-02 to 172 grams per dayin 2011-12; while that of vegetables increased from 236 grams perday to 350 gram per day over the same period.
8.64 These performances gain signif icance as the agri sector isthe source of livelihood and food security for a vast majority oflow-income and vulnerable sections of the population. To improvenutritional status a pilot programme on nutri-farms for introducingnew crop varieties rich in micro-nutrients such as iron-rich bajra,protein-rich maize, and zinc-rich wheat was implemented as a sub-scheme of the RKVY in 2013-14 in the 100 districts of nine statesmost affected by malnutrition, with an outlay of Rs 200 crore.
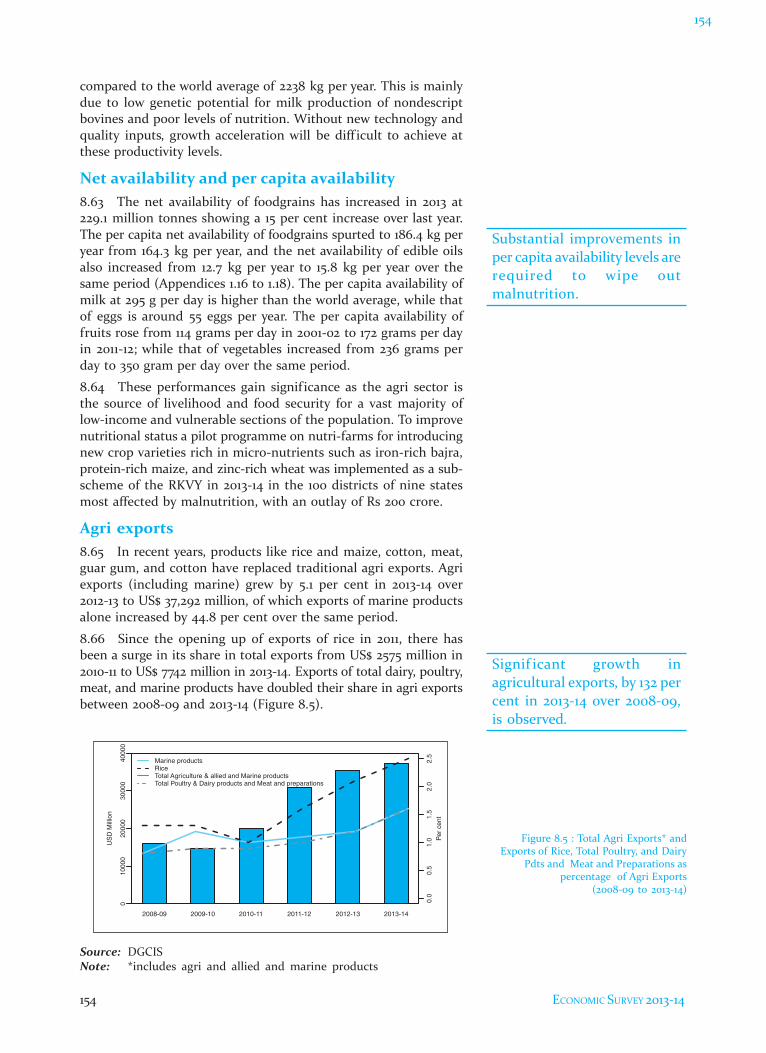
Agri exports8.65 In recent years, products like rice and maize, cotton, meat,guar gum, and cotton have replaced traditional agri exports. Agriexports (including marine) grew by 5.1 per cent in 2013-14 over2012-13 to US$ 37,292 million, of which exports of marine productsalone increased by 44.8 per cent over the same period.
8.66 Since the opening up of exports of rice in 2011, there hasbeen a surge in its share in total exports from US$ 2575 million in2010-11 to US$ 7742 million in 2013-14. Exports of total dairy, poultry,meat, and marine products have doubled their share in agri exportsbetween 2008-09 and 2013-14 (Figure 8.5).
Figure 8.5 : Total Agri Exports* andExports of Rice, Total Poultry, and Dairy
Pdts and Meat and Preparations aspercentage of Agri Exports
(2008-09 to 2013-14)
Source: DGCISNote: *includes agri and allied and marine products
Substantial improvements inper capita availability levels arerequired to wipe outmalnutrition.
Signif icant growth inagricultural exports, by 132 percent in 2013-14 over 2008-09,is observed.
AGRICULTURE AND FOOD MANAGEMENT 155
155
FOOD MANAGEMENT
8.67 The principal policy objective of food management is toensure food security, particularly for the vulnerable, through timelyand eff icient procurement and distribution of foodgrains. Thisinvolves procurement of foodgrains from farmers at remunerativeprices, building up and maintenance of buffer stocks, storage,movement, and distribution of foodgrains to consumers ataffordable prices, and stability of foodgrains’ prices. The priceinstruments used are MSP and central issue price (CIP).
Procurement8.68 The nodal agency that undertakes open-ended procurement,distribution, and storage of foodgrains is the Food Corporation ofIndia (FCI) with other central and state agencies. Coarse grains areprocured by state governments and their agencies. The NationalAgricultural Cooperative Marketing Federation of India Limited(NAFED), National Cooperative Consumers’ Federation of IndiaLimited (NCCF), CWC, and SFAC are the central nodal agenciesthat undertake procurement of oilseeds and pulses under the PriceSupport Scheme (PSS) when the market rates of these commoditiesfall below MSP. However, procurement operations are found to besuccessful largely for rice and wheat and that too only in a fewstates like Punjab, Haryana, Andhra Pradesh, and Madhya Pradesh.
8.69 To enhance eff iciency in procurement and public distributionand to extend the benef its of MSP to local farmers, theDecentralized Procurement Scheme (DCP) is adopted by some stategovernments. For paddy it has been adopted by West Bengal,Madhya Pradesh, Chhattisgarh, Uttarakhand, Andaman and NicobarIslands, Odisha, Tamil Nadu, Gujarat, Karnataka, Kerala, and Bihar;and by Andhra Pradesh in KMS 2013-14 in 10 districts. Gujarat,Madhya Pradesh, Uttarakhand and Bihar have DCP for wheat, andRajasthan has adopted it only in Alwar district since RMS 2013-14.
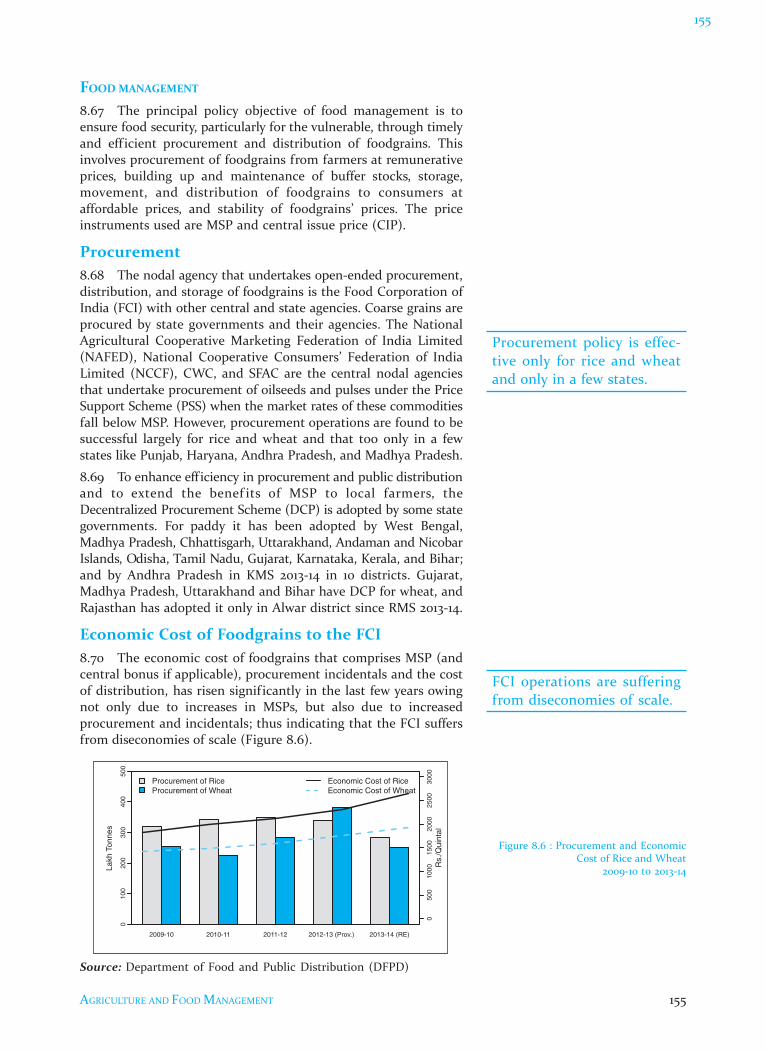
Economic Cost of Foodgrains to the FCI8.70 The economic cost of foodgrains that comprises MSP (andcentral bonus if applicable), procurement incidentals and the costof distribution, has risen signif icantly in the last few years owingnot only due to increases in MSPs, but also due to increasedprocurement and incidentals; thus indicating that the FCI suffersfrom diseconomies of scale (Figure 8.6).
Procurement policy is effec-tive only for rice and wheatand only in a few states.
Figure 8.6 : Procurement and EconomicCost of Rice and Wheat
2009-10 to 2013-14
Source: Department of Food and Public Distribution (DFPD)
FCI operations are sufferingfrom diseconomies of scale.
156 ECONOMIC SURVEY 2013-14
156
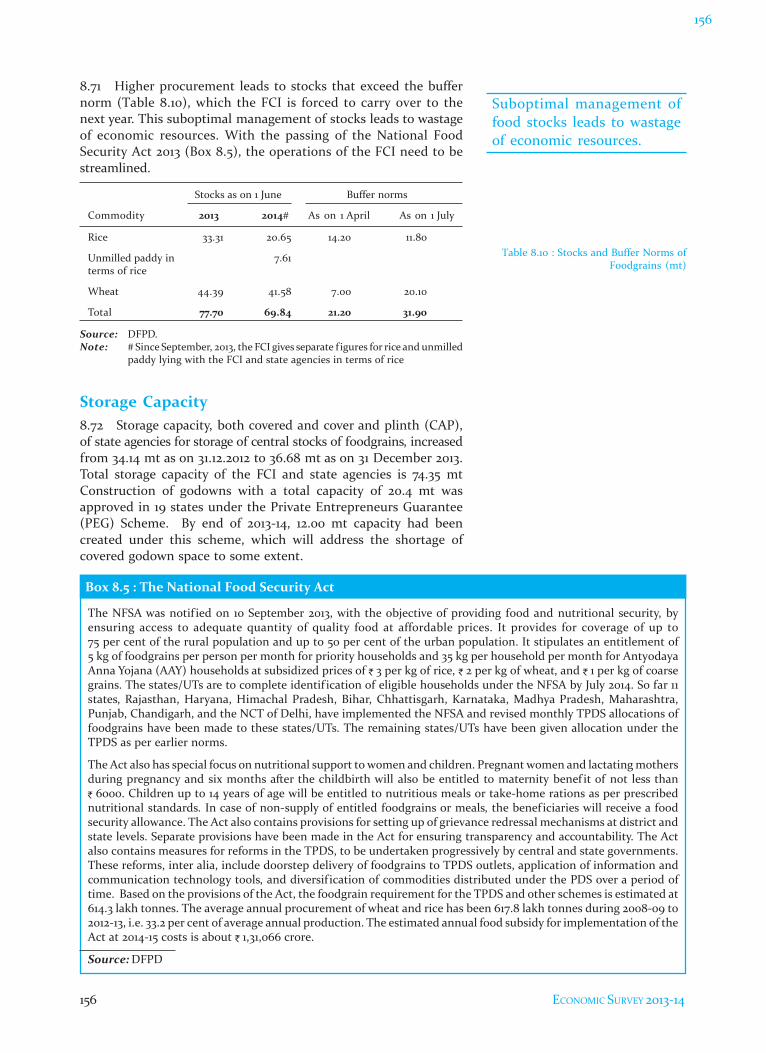
8.71 Higher procurement leads to stocks that exceed the buffernorm (Table 8.10), which the FCI is forced to carry over to thenext year. This suboptimal management of stocks leads to wastageof economic resources. With the passing of the National FoodSecurity Act 2013 (Box 8.5), the operations of the FCI need to bestreamlined.
Storage Capacity8.72 Storage capacity, both covered and cover and plinth (CAP),of state agencies for storage of central stocks of foodgrains, increasedfrom 34.14 mt as on 31.12.2012 to 36.68 mt as on 31 December 2013.Total storage capacity of the FCI and state agencies is 74.35 mtConstruction of godowns with a total capacity of 20.4 mt wasapproved in 19 states under the Private Entrepreneurs Guarantee(PEG) Scheme. By end of 2013-14, 12.00 mt capacity had beencreated under this scheme, which will address the shortage ofcovered godown space to some extent.
Suboptimal management offood stocks leads to wastageof economic resources.
Box 8.5 : The National Food Security Act
The NFSA was notif ied on 10 September 2013, with the objective of providing food and nutritional security, byensuring access to adequate quantity of quality food at affordable prices. It provides for coverage of up to75 per cent of the rural population and up to 50 per cent of the urban population. It stipulates an entitlement of5 kg of foodgrains per person per month for priority households and 35 kg per household per month for AntyodayaAnna Yojana (AAY) households at subsidized prices of ` 3 per kg of rice, ` 2 per kg of wheat, and ` 1 per kg of coarsegrains. The states/UTs are to complete identif ication of eligible households under the NFSA by July 2014. So far 11states, Rajasthan, Haryana, Himachal Pradesh, Bihar, Chhattisgarh, Karnataka, Madhya Pradesh, Maharashtra,Punjab, Chandigarh, and the NCT of Delhi, have implemented the NFSA and revised monthly TPDS allocations offoodgrains have been made to these states/UTs. The remaining states/UTs have been given allocation under theTPDS as per earlier norms.
The Act also has special focus on nutritional support to women and children. Pregnant women and lactating mothersduring pregnancy and six months after the childbirth will also be entitled to maternity benef it of not less than` 6000. Children up to 14 years of age will be entitled to nutritious meals or take-home rations as per prescribednutritional standards. In case of non-supply of entitled foodgrains or meals, the benef iciaries will receive a foodsecurity allowance. The Act also contains provisions for setting up of grievance redressal mechanisms at district andstate levels. Separate provisions have been made in the Act for ensuring transparency and accountability. The Actalso contains measures for reforms in the TPDS, to be undertaken progressively by central and state governments.These reforms, inter alia, include doorstep delivery of foodgrains to TPDS outlets, application of information andcommunication technology tools, and diversif ication of commodities distributed under the PDS over a period oftime. Based on the provisions of the Act, the foodgrain requirement for the TPDS and other schemes is estimated at614.3 lakh tonnes. The average annual procurement of wheat and rice has been 617.8 lakh tonnes during 2008-09 to2012-13, i.e. 33.2 per cent of average annual production. The estimated annual food subsidy for implementation of theAct at 2014-15 costs is about ` 1,31,066 crore.
Source: DFPD
Table 8.10 : Stocks and Buffer Norms ofFoodgrains (mt)
Stocks as on 1 June Buffer norms
Commodity 2013 2014# As on 1 April As on 1 July
Rice 33.31 20.65 14.20 11.80
Unmilled paddy in 7.61terms of rice
Wheat 44.39 41.58 7.00 20.10
Total 77.70 69.84 21.20 31.90
Source: DFPD.Note: # Since September, 2013, the FCI gives separate f igures for rice and unmilled
paddy lying with the FCI and state agencies in terms of rice
AGRICULTURE AND FOOD MANAGEMENT 157
157
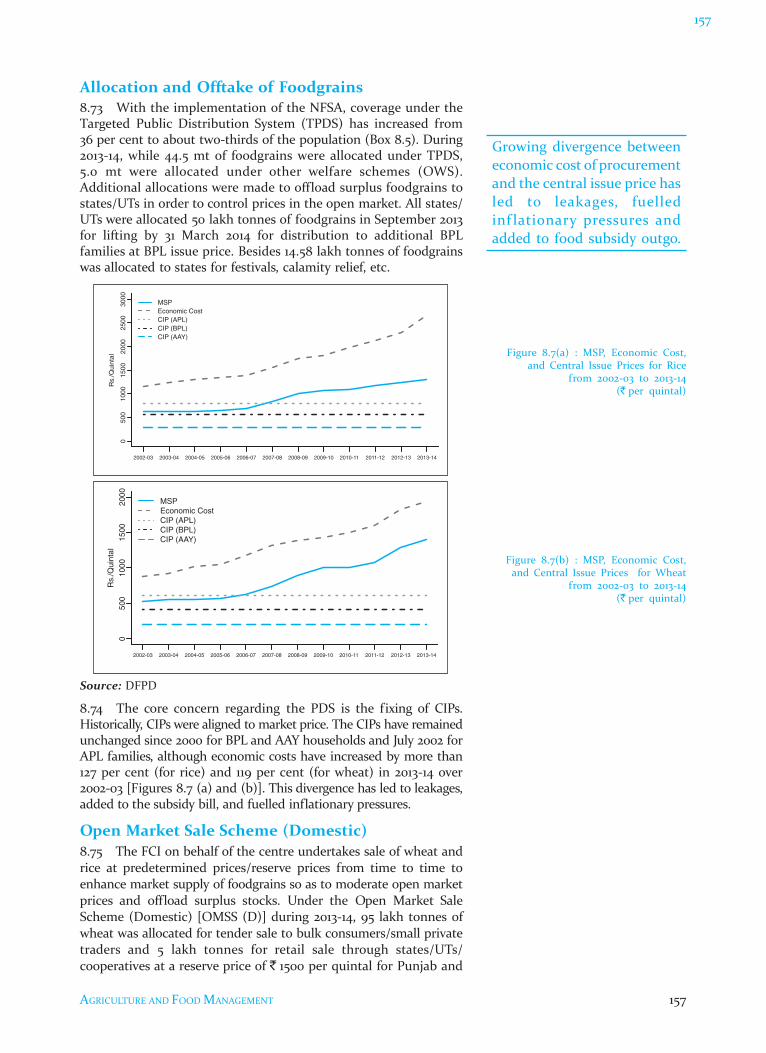
Source: DFPD
Figure 8.7(a) : MSP, Economic Cost,and Central Issue Prices for Rice
from 2002-03 to 2013-14(` per quintal)
Figure 8.7(b) : MSP, Economic Cost,and Central Issue Prices for Wheat
from 2002-03 to 2013-14(` per quintal)
8.74 The core concern regarding the PDS is the f ixing of CIPs.Historically, CIPs were aligned to market price. The CIPs have remainedunchanged since 2000 for BPL and AAY households and July 2002 forAPL families, although economic costs have increased by more than127 per cent (for rice) and 119 per cent (for wheat) in 2013-14 over2002-03 [Figures 8.7 (a) and (b)]. This divergence has led to leakages,added to the subsidy bill, and fuelled inflationary pressures.
Open Market Sale Scheme (Domestic)8.75 The FCI on behalf of the centre undertakes sale of wheat andrice at predetermined prices/reserve prices from time to time toenhance market supply of foodgrains so as to moderate open marketprices and offload surplus stocks. Under the Open Market SaleScheme (Domestic) [OMSS (D)] during 2013-14, 95 lakh tonnes ofwheat was allocated for tender sale to bulk consumers/small privatetraders and 5 lakh tonnes for retail sale through states/UTs/cooperatives at a reserve price of ` 1500 per quintal for Punjab and
Growing divergence betweeneconomic cost of procurementand the central issue price hasled to leakages, fuelledinf lationary pressures andadded to food subsidy outgo.
Allocation and Offtake of Foodgrains8.73 With the implementation of the NFSA, coverage under theTargeted Public Distribution System (TPDS) has increased from36 per cent to about two-thirds of the population (Box 8.5). During2013-14, while 44.5 mt of foodgrains were allocated under TPDS,5.0 mt were allocated under other welfare schemes (OWS).Additional allocations were made to offload surplus foodgrains tostates/UTs in order to control prices in the open market. All states/UTs were allocated 50 lakh tonnes of foodgrains in September 2013for lifting by 31 March 2014 for distribution to additional BPLfamilies at BPL issue price. Besides 14.58 lakh tonnes of foodgrainswas allocated to states for festivals, calamity relief, etc.
158 ECONOMIC SURVEY 2013-14
158
Haryana; and at reserve price plus freight from Ludhiana to otherstate capitals. Five lakh tonnes of rice was also allocated for retailsale through states/UTs. Against these allocations, 57.97 lakh tonnesof wheat was sold to bulk consumers/traders through tenders. Therehas generally been a muted response to the OMSS, because theprices are set higher than the MSP, which seems incongruent duringperiods of high food inflation.
FOOD SUBSIDY
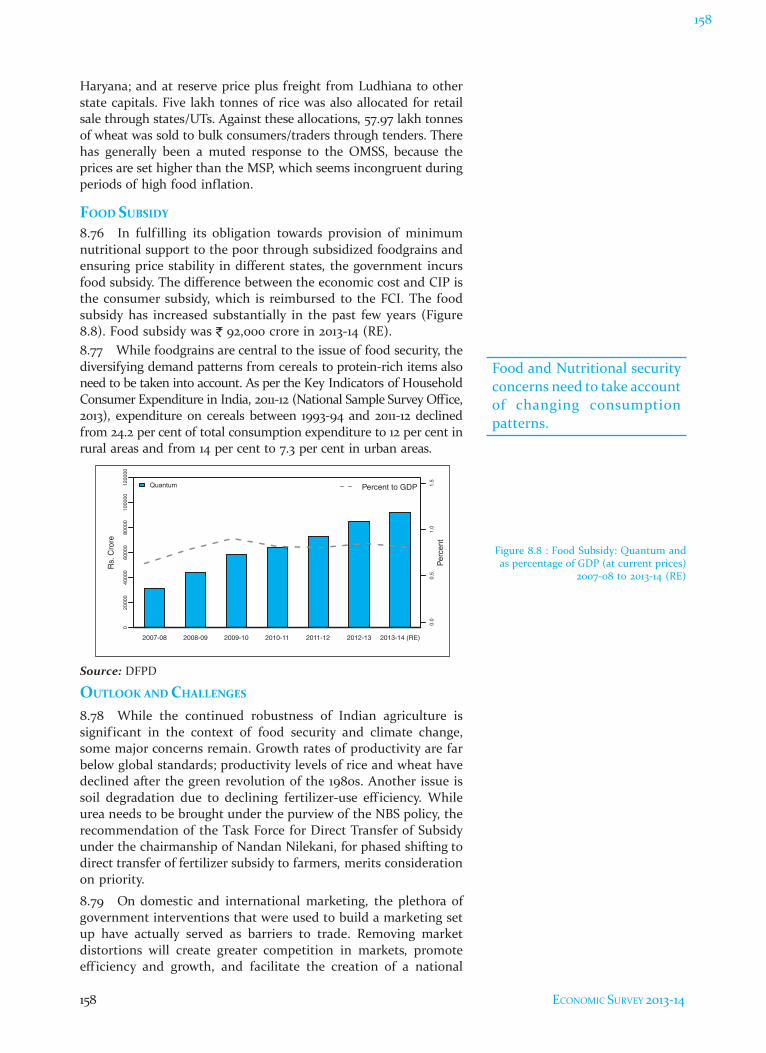
8.76 In fulf illing its obligation towards provision of minimumnutritional support to the poor through subsidized foodgrains andensuring price stability in different states, the government incursfood subsidy. The difference between the economic cost and CIP isthe consumer subsidy, which is reimbursed to the FCI. The foodsubsidy has increased substantially in the past few years (Figure8.8). Food subsidy was ` 92,000 crore in 2013-14 (RE).8.77 While foodgrains are central to the issue of food security, thediversifying demand patterns from cereals to protein-rich items alsoneed to be taken into account. As per the Key Indicators of HouseholdConsumer Expenditure in India, 2011-12 (National Sample Survey Office,2013), expenditure on cereals between 1993-94 and 2011-12 declinedfrom 24.2 per cent of total consumption expenditure to 12 per cent inrural areas and from 14 per cent to 7.3 per cent in urban areas.
Figure 8.8 : Food Subsidy: Quantum andas percentage of GDP (at current prices)
2007-08 to 2013-14 (RE)
Source: DFPD
Food and Nutritional securityconcerns need to take accountof changing consumptionpatterns.
OUTLOOK AND CHALLENGES
8.78 While the continued robustness of Indian agriculture issignif icant in the context of food security and climate change,some major concerns remain. Growth rates of productivity are farbelow global standards; productivity levels of rice and wheat havedeclined after the green revolution of the 1980s. Another issue issoil degradation due to declining fertilizer-use eff iciency. Whileurea needs to be brought under the purview of the NBS policy, therecommendation of the Task Force for Direct Transfer of Subsidyunder the chairmanship of Nandan Nilekani, for phased shifting todirect transfer of fertilizer subsidy to farmers, merits considerationon priority.
8.79 On domestic and international marketing, the plethora ofgovernment interventions that were used to build a marketing setup have actually served as barriers to trade. Removing marketdistortions will create greater competition in markets, promoteeff iciency and growth, and facilitate the creation of a national
AGRICULTURE AND FOOD MANAGEMENT 159
159
agriculture market. Thus, while the agricultural market is by itselfnot fully malleable to becoming a perfectly competitive structure,it can asymptotically approach it. Since agriculture provides thebackward linkage to agro-based industries and services, it has to beviewed holistically as a seamless farm-to-fork value chain,comprising farming, wholesaling, warehousing, logistics, processing,and retailing including exports. For establishing a nationalcommon market, some reforms are needed:
(i) Examine the APMC Act, EC Act, Land Tenancy Act, andany such legally created structures whose provisions arerestrictive and create barriers to free trade.
(ii) Rigorously pursue alternate marketing initiatives, like directmarketing and contract farming.
(iii) Examine inclusion of agri related taxes under the GeneralGoods and Services Tax (GST).
(iv) Establish stable trade policy based on tariff interventionsinstead of non-tariff trade barriers.
(v) Develop and initiate competition in the agro-processingsector. Incentivize the private sector to scale up investments.
8.80 Strengthening the agri sector is crucial for poverty alleviation,ensuring food security, increasing employment opportunities, andenhancing rural incomes. Further, with 10.4 per cent of totalhouseholds in rural areas being headed by a woman (Census 2011),it is essential to formulate policies, and package technologies andservices keeping in view the productive role played by women inall facets of the agri sector. Experience from BRICS (Brazil, Russia,India, China, and South Africa) countries indicates that a1 per cent growth in agriculture is at least two to three timesmore effective in reducing poverty than the same growth emanatingfrom non-agriculture sectors.8.81 Currently, India is in an anomalous situation of being largelyself-suff icient with large stocks of foodgrains on the one handand registering high food inflation on the other, which is largelydue to the government becoming the single largest buyer. In thisscenario of bumper production and stocks, a paradigm shift in therole of the government in all aspects of foodgrain production anddistribution is necessary.8.82 With the FCI suffering from diseconomies of scale, adoptionof the DCP needs to be expanded to all states. This would savetransport costs, transit losses, and other leakages and simultaneouslyincrease food availability, reduce food prices in the open market,and ultimately reduce the food subsidy. The continued emphasison procurement and distribution of rice and wheat is contrary tothe ground reality that shows changing preference functions ofconsumers. A shift to a direct cash transfer system or food stampswould anchor our food policy to the requirements of the peopleand would additionally reduce the f iscal def icit.8.83 On a positive note, there appears to be no cause for alarmon the El Niño front as India is well placed on foodgrainsavailability, with record domestic production and huge stocks inthe central pool. The Food and Agriculture Organisation (FAO) inits ‘Cereal Supply and Demand Brief’ of June 2014, has also forecasta comfortable global scenario for 2014-15 with high stocks-to-useratios of cereals and stable prices.
Major challenges include: lowproductivity levels; soildegradation due to decliningfertilizer - use eff iciency;market distortions thatprevent the creation of anational common market;changing role of governmentin production and distri-bution in the current scenarioof bumper production andstocks; phased shifting todirect transfer of fertilizer andfood subsidies.
There appears to be no causefor alarm on the El Niñoimpact as India is well placedon foodgrains availability,with record domestic pro-duction and huge stocks inthe central pool.