8d advanced object editing -...
TRANSCRIPT
8D
Advanced Object EditingIn this session:
The Status BarDrawingSettingsToolsAutomated Object CreationSQL StatementsCombine, Erase and SplitCombine Using Column DataZero-Distance Buffers
The Status Bar
1. The Status Bar
The Status Bar is located along the bottom of your MapInfo Professional window, and can provide a lot of information at a quick glance.
You can also change two important settings just by clicking in the Status Bar.
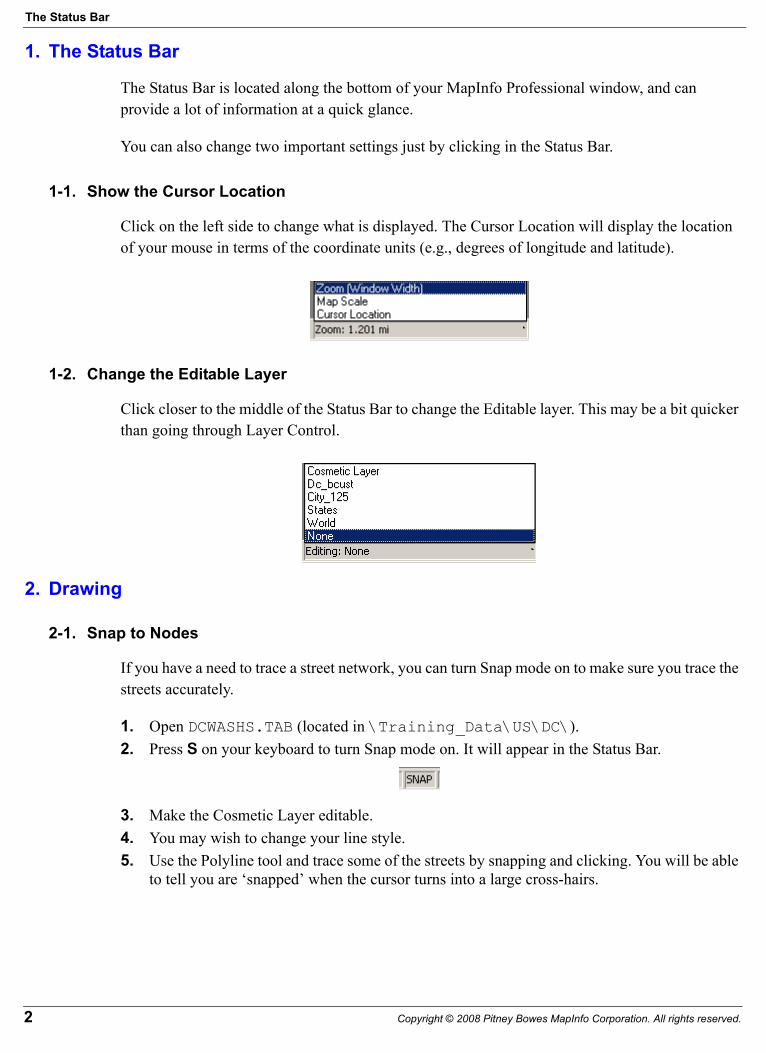
1-1. Show the Cursor Location
Click on the left side to change what is displayed. The Cursor Location will display the location of your mouse in terms of the coordinate units (e.g., degrees of longitude and latitude).
1-2. Change the Editable Layer
Click closer to the middle of the Status Bar to change the Editable layer. This may be a bit quicker than going through Layer Control.
2. Drawing
2-1. Snap to Nodes
If you have a need to trace a street network, you can turn Snap mode on to make sure you trace the streets accurately.
1. Open DCWASHS.TAB (located in \Training_Data\US\DC\).2. Press S on your keyboard to turn Snap mode on. It will appear in the Status Bar.
3. Make the Cosmetic Layer editable.4. You may wish to change your line style.5. Use the Polyline tool and trace some of the streets by snapping and clicking. You will be able
to tell you are ‘snapped’ when the cursor turns into a large cross-hairs.
2 Copyright © 2008 Pitney Bowes MapInfo Corporation. All rights reserved.

Session 8D: Advanced Object Editing
6. Double-click to stop drawing.
2-2. Auto Node
If the object you are drawing requires more of a ‘freehand’ look, you can use the Auto Node feature. Essentially Auto Trace clicks the mouse for you at a set distance interval.
1. Press S on the keyboard to turn Snap off.Snap and Auto Node don’t get along well with each other.
2. Press N on the keyboard to turn on Auto Node.
3. Use either the Polygon or Polyline tool.4. Click once to start drawing and just move your mouse around where you’d like to draw. You
don’t have to click again until you want to stop drawing.5. Double-click to stop drawing.
2-3. Auto Trace
You can use Auto Trace to trace around existing shapes with several nodes. It is still used in conjunction with Snap mode, but you don’t have to click on every single node. For example, tracing Florida.
1. Close All. Click Discard if prompted to save anything.2. Open STATES.TAB (located in \Training_Datat\US\).3. Press N to turn off Auto Node.4. Press T to turn on Auto Trace and S to turn on Snap.5. Make the Cosmetic Layer editable.6. Zoom into Florida.
Copyright © 2008 Pitney Bowes MapInfo Corporation. All rights reserved. 3

Drawing
7. Use either the polygon or polyline tool and snap to any node along the Florida coast.8. Move your mouse, and snap to any other node, without clicking.
You will notice that the border is traced. However, that will not actually become permanent until you click. YOU MUST BE SNAPPED TO ANOTHER NODE.
9. Snap to a node and click again.10. Continue tracing in this manner until you have completely traced the coast.
Note: Auto Trace always takes the path of least resistance. That means that when you are tracing a region object, Auto Trace will always go in the direction of the least number of nodes. That can be changed by holding down the CTRL key.
4 Copyright © 2008 Pitney Bowes MapInfo Corporation. All rights reserved.
Session 8D: Advanced Object Editing
3. Settings
There are some settings you can affect some of your object editing.
3-1. Move Duplicate Nodes
First you’ll see how one particular setting works before you change it.
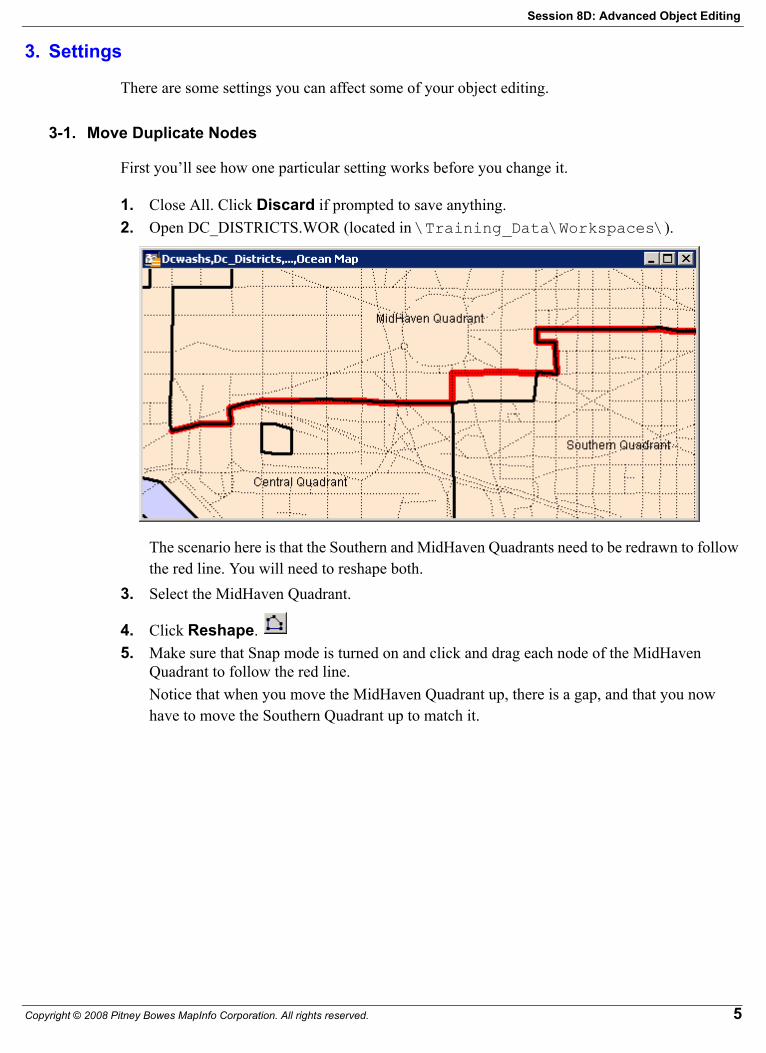
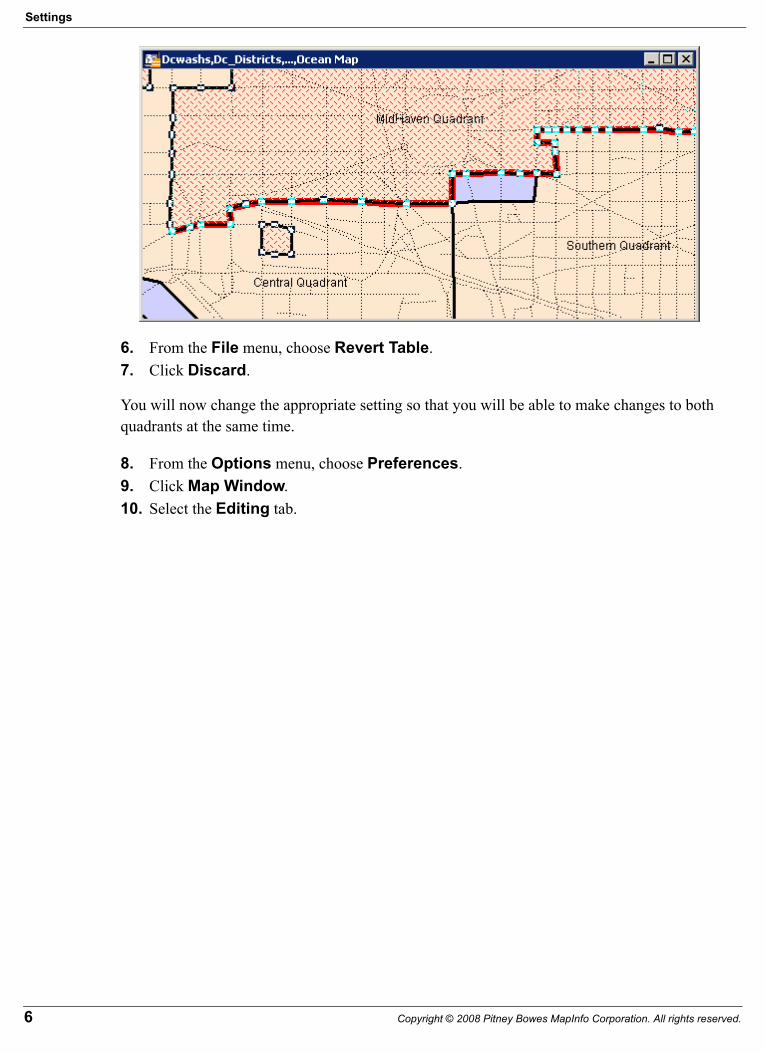
1. Close All. Click Discard if prompted to save anything.2. Open DC_DISTRICTS.WOR (located in \Training_Data\Workspaces\).
The scenario here is that the Southern and MidHaven Quadrants need to be redrawn to follow the red line. You will need to reshape both.
3. Select the MidHaven Quadrant.
4. Click Reshape. 5. Make sure that Snap mode is turned on and click and drag each node of the MidHaven
Quadrant to follow the red line.Notice that when you move the MidHaven Quadrant up, there is a gap, and that you now have to move the Southern Quadrant up to match it.
Copyright © 2008 Pitney Bowes MapInfo Corporation. All rights reserved. 5
Settings
6. From the File menu, choose Revert Table.7. Click Discard.
You will now change the appropriate setting so that you will be able to make changes to both quadrants at the same time.
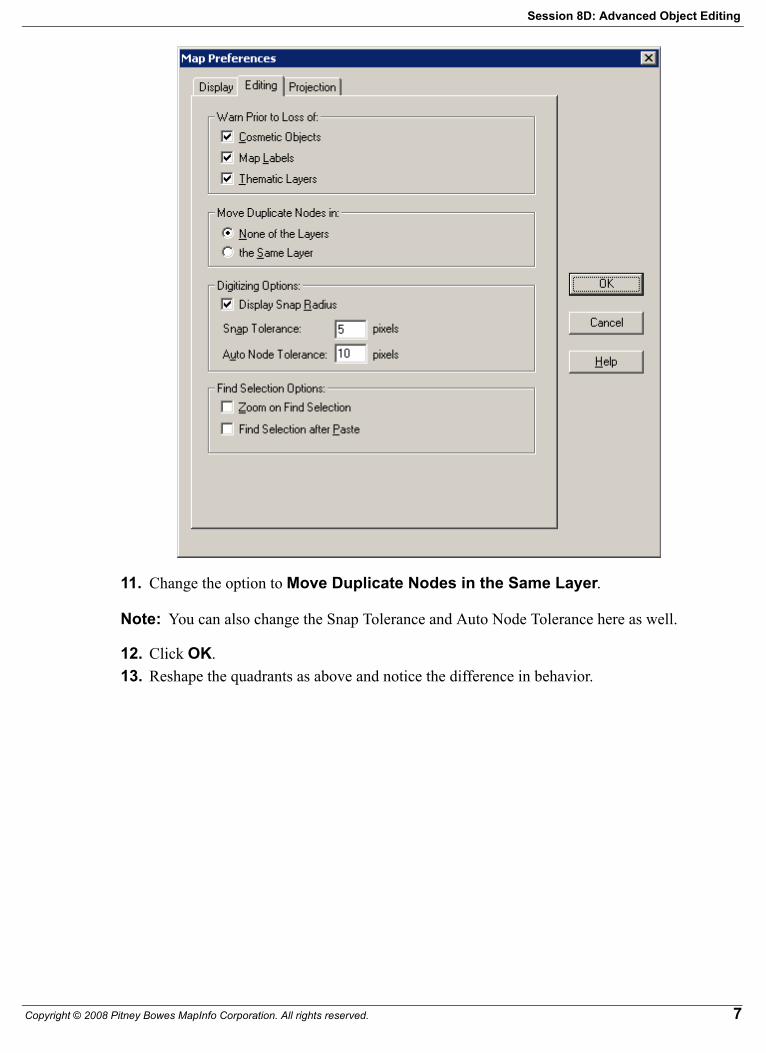
8. From the Options menu, choose Preferences.9. Click Map Window.10. Select the Editing tab.
6 Copyright © 2008 Pitney Bowes MapInfo Corporation. All rights reserved.
Session 8D: Advanced Object Editing
11. Change the option to Move Duplicate Nodes in the Same Layer.
Note: You can also change the Snap Tolerance and Auto Node Tolerance here as well.
12. Click OK.13. Reshape the quadrants as above and notice the difference in behavior.
Copyright © 2008 Pitney Bowes MapInfo Corporation. All rights reserved. 7
Settings
3-2. Object Styles
Another trick that may make your object editing a bit easier is the capability to change the default object styles. You can set it globally, choosing a style that will be the default every time you start up the program, and you can also choose a style on a layer-by-layer basis.
To choose a global default object style:
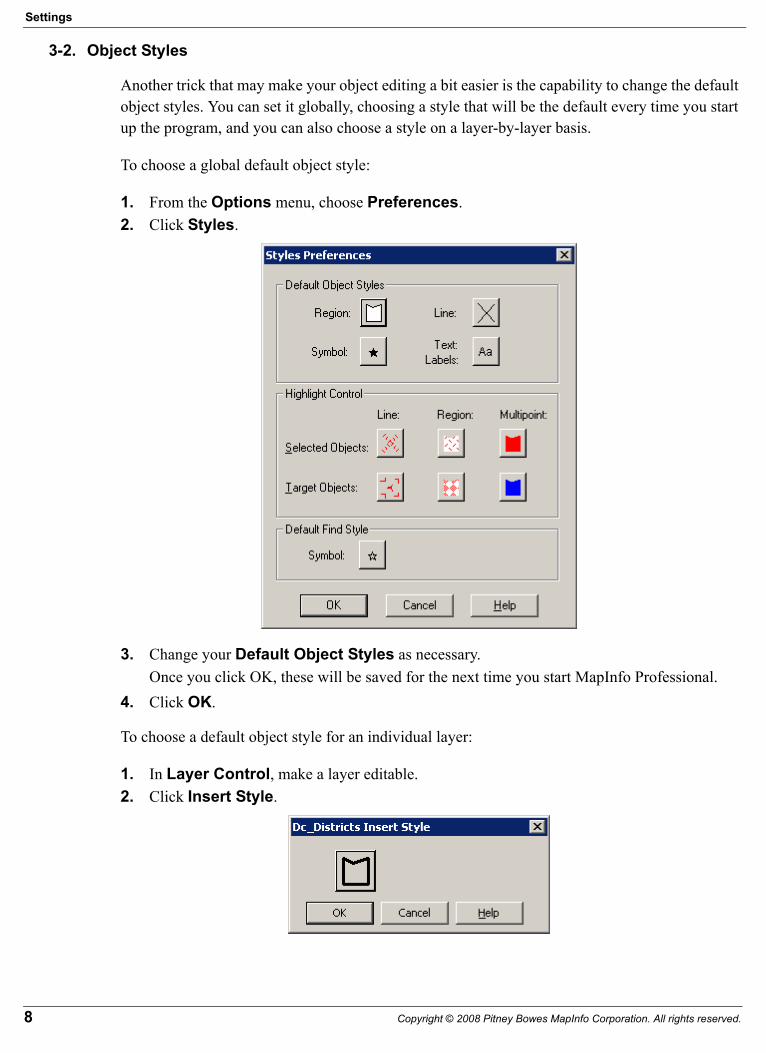
1. From the Options menu, choose Preferences.2. Click Styles.
3. Change your Default Object Styles as necessary. Once you click OK, these will be saved for the next time you start MapInfo Professional.
4. Click OK.
To choose a default object style for an individual layer:
1. In Layer Control, make a layer editable.2. Click Insert Style.
8 Copyright © 2008 Pitney Bowes MapInfo Corporation. All rights reserved.
Session 8D: Advanced Object Editing
These style settings will be set specifically for this layer and are actually saved in the .TAB file. That means that the next time you open this particular file, these settings will be remembered.
Note: The layer used for the above screenshot only has region objects. If your layer has line or point objects, those buttons would also appear.
3. Make your style changes and click OK.4. Click OK to close layer control.
4. Tools
Among MapInfo’s wide selection of tools are a few that might come in handy for creating and editing objects. Two of them that you will look here are Create Line by Length and Grid Maker.
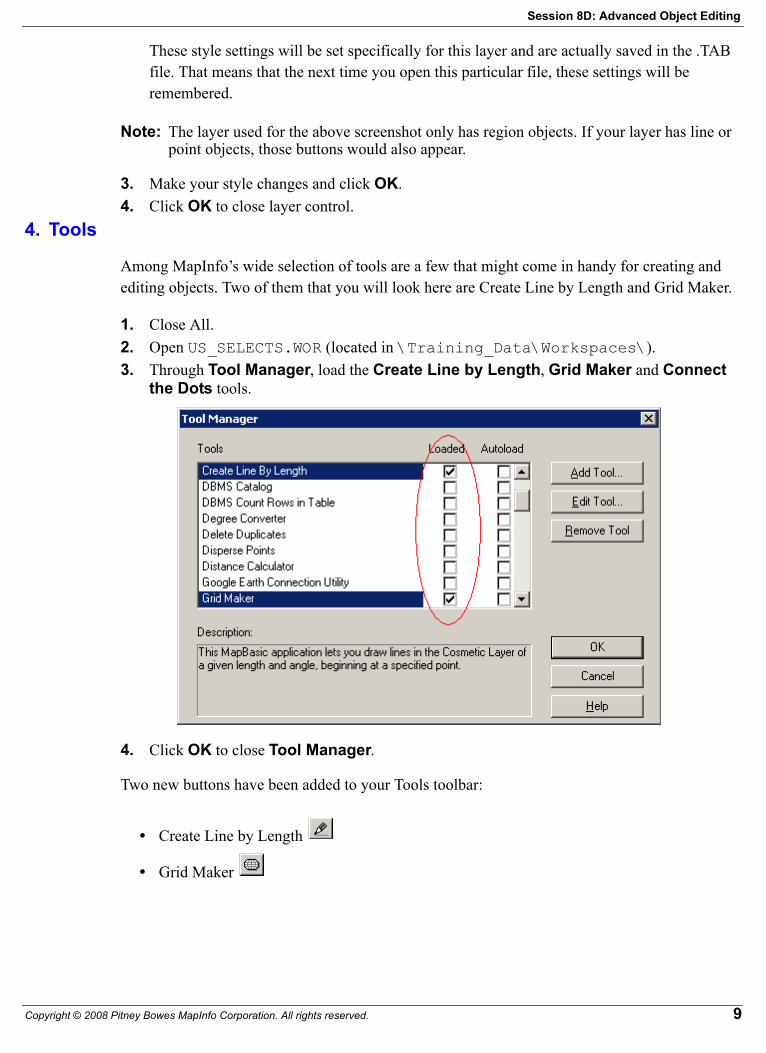
1. Close All.2. Open US_SELECTS.WOR (located in \Training_Data\Workspaces\).3. Through Tool Manager, load the Create Line by Length, Grid Maker and Connect
the Dots tools.
4. Click OK to close Tool Manager.
Two new buttons have been added to your Tools toolbar:
• Create Line by Length
• Grid Maker
Copyright © 2008 Pitney Bowes MapInfo Corporation. All rights reserved. 9
Tools
4-1. Create Line by Length
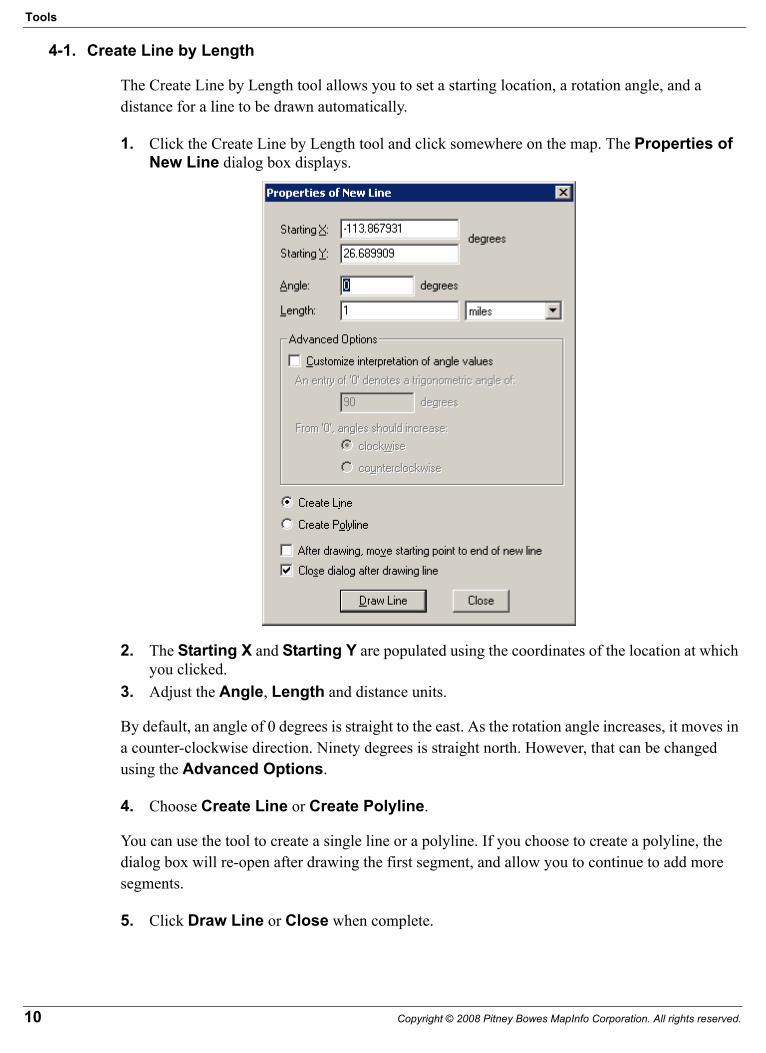
The Create Line by Length tool allows you to set a starting location, a rotation angle, and a distance for a line to be drawn automatically.
1. Click the Create Line by Length tool and click somewhere on the map. The Properties of New Line dialog box displays.
2. The Starting X and Starting Y are populated using the coordinates of the location at which you clicked.
3. Adjust the Angle, Length and distance units.
By default, an angle of 0 degrees is straight to the east. As the rotation angle increases, it moves in a counter-clockwise direction. Ninety degrees is straight north. However, that can be changed using the Advanced Options.
4. Choose Create Line or Create Polyline.
You can use the tool to create a single line or a polyline. If you choose to create a polyline, the dialog box will re-open after drawing the first segment, and allow you to continue to add more segments.
5. Click Draw Line or Close when complete.
10 Copyright © 2008 Pitney Bowes MapInfo Corporation. All rights reserved.
Session 8D: Advanced Object Editing
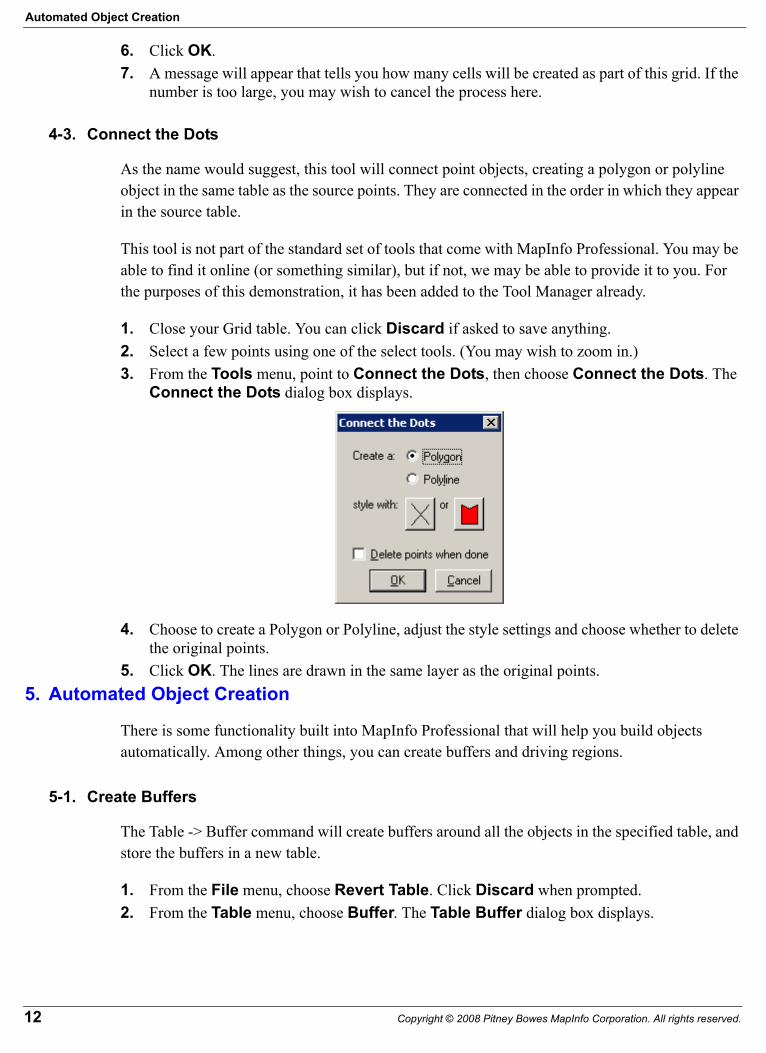
4-2. Grid Maker
You can use the Grid Maker to automate the process of creating a grid of square cells.
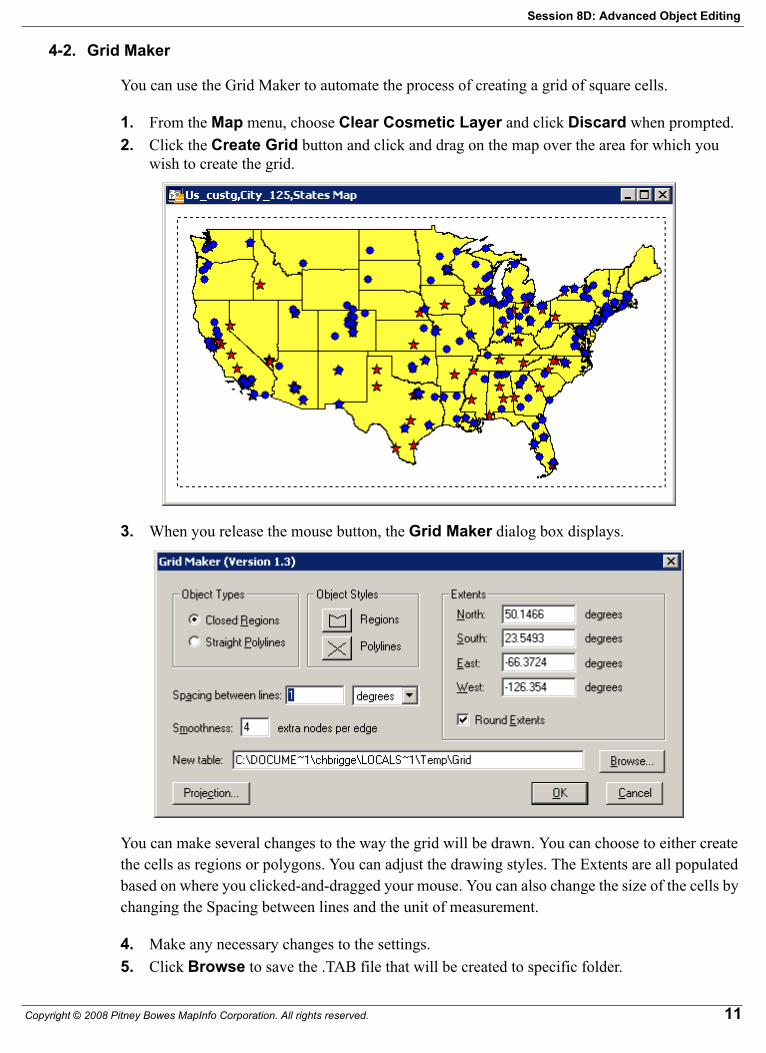
1. From the Map menu, choose Clear Cosmetic Layer and click Discard when prompted.2. Click the Create Grid button and click and drag on the map over the area for which you
wish to create the grid.
3. When you release the mouse button, the Grid Maker dialog box displays.
You can make several changes to the way the grid will be drawn. You can choose to either create the cells as regions or polygons. You can adjust the drawing styles. The Extents are all populated based on where you clicked-and-dragged your mouse. You can also change the size of the cells by changing the Spacing between lines and the unit of measurement.
4. Make any necessary changes to the settings.5. Click Browse to save the .TAB file that will be created to specific folder.
Copyright © 2008 Pitney Bowes MapInfo Corporation. All rights reserved. 11
Automated Object Creation
6. Click OK.7. A message will appear that tells you how many cells will be created as part of this grid. If the
number is too large, you may wish to cancel the process here.
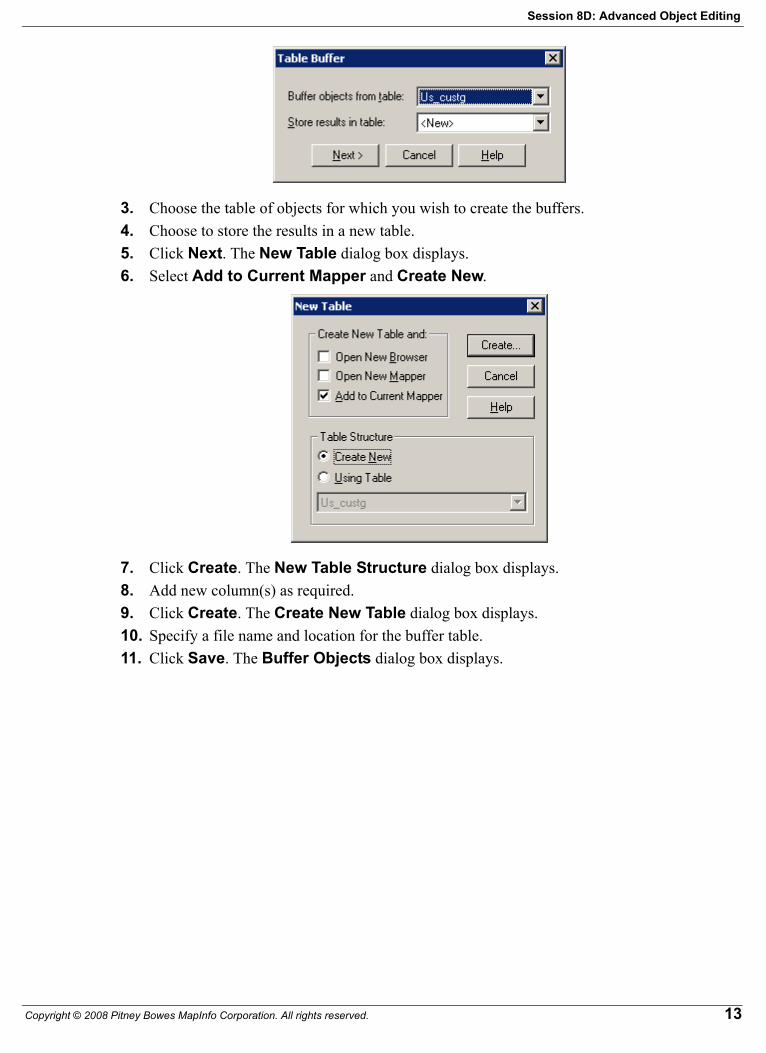
4-3. Connect the Dots
As the name would suggest, this tool will connect point objects, creating a polygon or polyline object in the same table as the source points. They are connected in the order in which they appear in the source table.
This tool is not part of the standard set of tools that come with MapInfo Professional. You may be able to find it online (or something similar), but if not, we may be able to provide it to you. For the purposes of this demonstration, it has been added to the Tool Manager already.
1. Close your Grid table. You can click Discard if asked to save anything.2. Select a few points using one of the select tools. (You may wish to zoom in.)3. From the Tools menu, point to Connect the Dots, then choose Connect the Dots. The
Connect the Dots dialog box displays.
4. Choose to create a Polygon or Polyline, adjust the style settings and choose whether to delete the original points.
5. Click OK. The lines are drawn in the same layer as the original points.5. Automated Object Creation
There is some functionality built into MapInfo Professional that will help you build objects automatically. Among other things, you can create buffers and driving regions.
5-1. Create Buffers
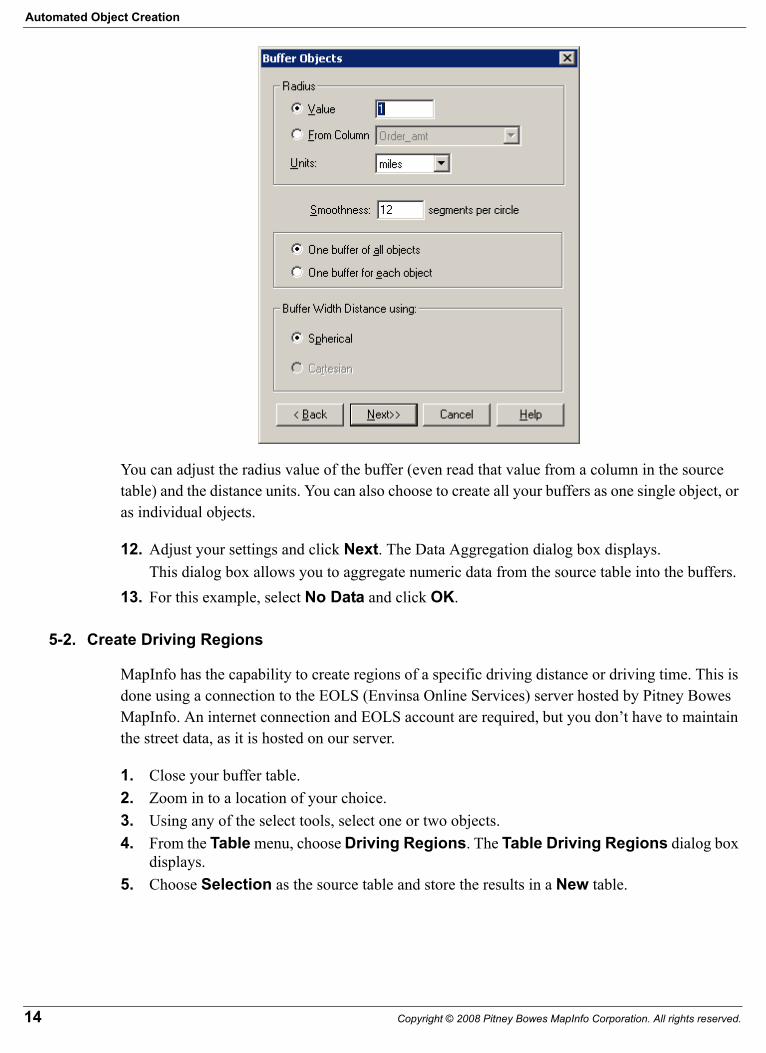
The Table -> Buffer command will create buffers around all the objects in the specified table, and store the buffers in a new table.
1. From the File menu, choose Revert Table. Click Discard when prompted.2. From the Table menu, choose Buffer. The Table Buffer dialog box displays.
12 Copyright © 2008 Pitney Bowes MapInfo Corporation. All rights reserved.
Session 8D: Advanced Object Editing
3. Choose the table of objects for which you wish to create the buffers.4. Choose to store the results in a new table.5. Click Next. The New Table dialog box displays.6. Select Add to Current Mapper and Create New.
7. Click Create. The New Table Structure dialog box displays.8. Add new column(s) as required.9. Click Create. The Create New Table dialog box displays.10. Specify a file name and location for the buffer table.11. Click Save. The Buffer Objects dialog box displays.
Copyright © 2008 Pitney Bowes MapInfo Corporation. All rights reserved. 13
Automated Object Creation
You can adjust the radius value of the buffer (even read that value from a column in the source table) and the distance units. You can also choose to create all your buffers as one single object, or as individual objects.
12. Adjust your settings and click Next. The Data Aggregation dialog box displays.This dialog box allows you to aggregate numeric data from the source table into the buffers.
13. For this example, select No Data and click OK.
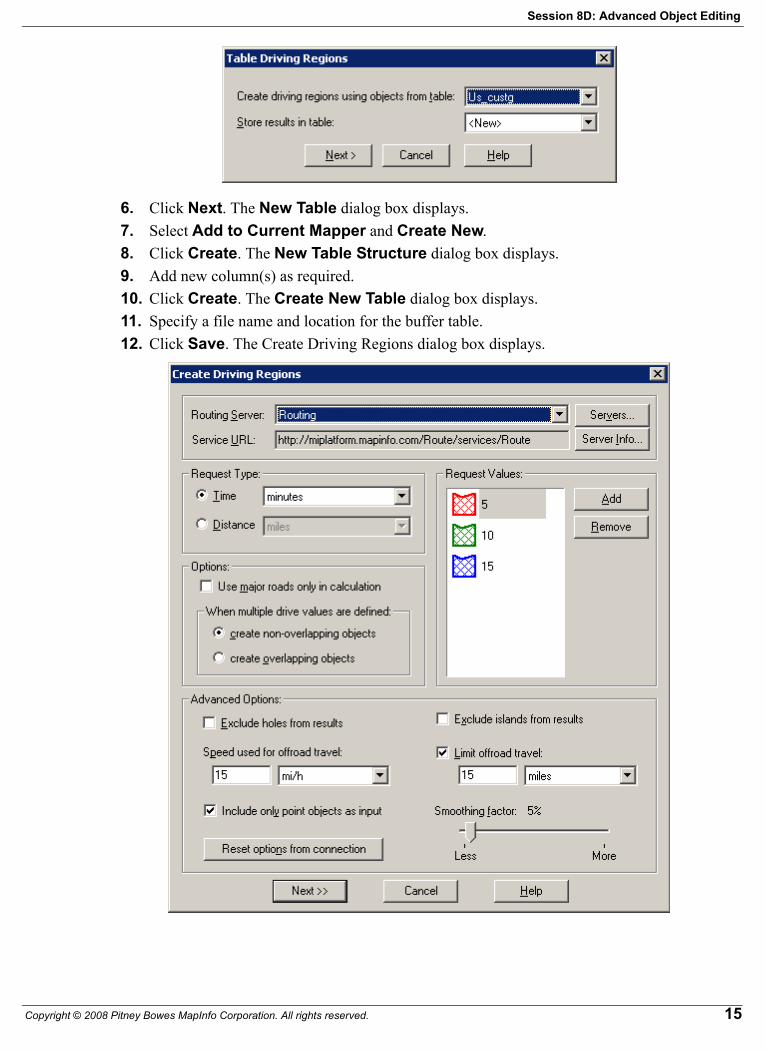
5-2. Create Driving Regions
MapInfo has the capability to create regions of a specific driving distance or driving time. This is done using a connection to the EOLS (Envinsa Online Services) server hosted by Pitney Bowes MapInfo. An internet connection and EOLS account are required, but you don’t have to maintain the street data, as it is hosted on our server.
1. Close your buffer table.2. Zoom in to a location of your choice.3. Using any of the select tools, select one or two objects.4. From the Table menu, choose Driving Regions. The Table Driving Regions dialog box
displays.5. Choose Selection as the source table and store the results in a New table.
14 Copyright © 2008 Pitney Bowes MapInfo Corporation. All rights reserved.
Session 8D: Advanced Object Editing
6. Click Next. The New Table dialog box displays.7. Select Add to Current Mapper and Create New.8. Click Create. The New Table Structure dialog box displays.9. Add new column(s) as required.10. Click Create. The Create New Table dialog box displays.11. Specify a file name and location for the buffer table.12. Click Save. The Create Driving Regions dialog box displays.
Copyright © 2008 Pitney Bowes MapInfo Corporation. All rights reserved. 15
SQL Statements
There are a number of settings that you can change, but the ones you will likely want to focus on are choosing either time or distance (on the left, under Request Type), and the corresponding values and colors (on the right, under Request Values).
13. Adjust the settings and click Next. The Data Aggregation dialog box displays.14. Select No Data and click OK.
6. SQL Statements
You can also use some SQL select statements to help assist in object editing.
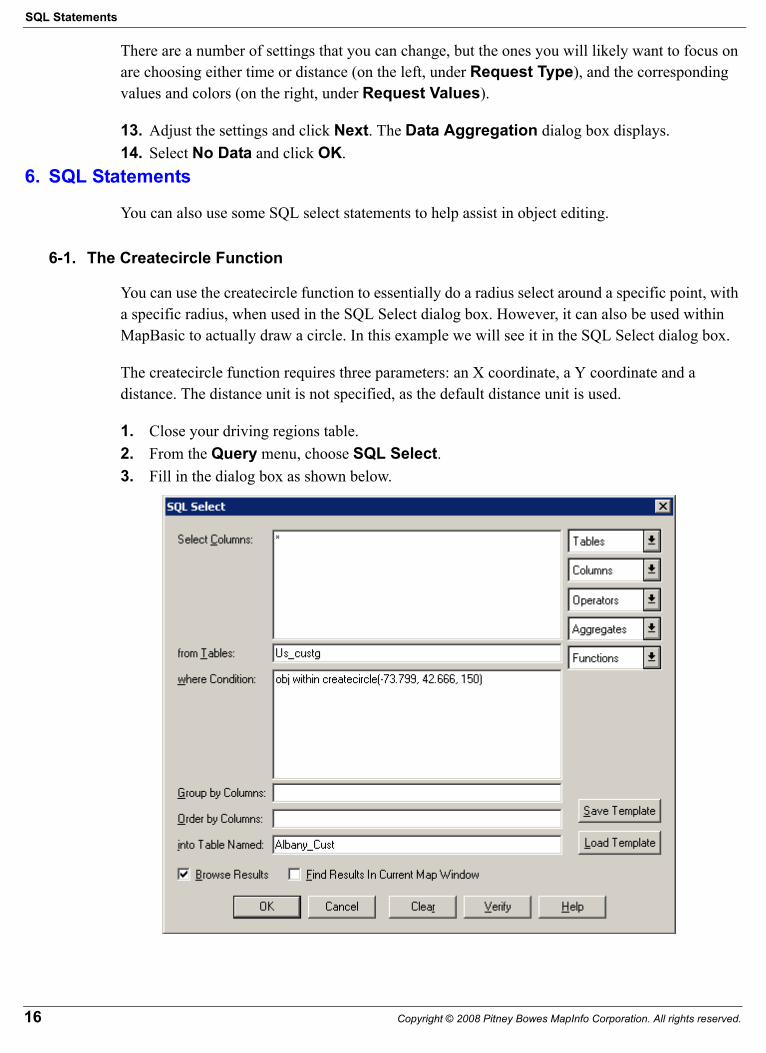
6-1. The Createcircle Function
You can use the createcircle function to essentially do a radius select around a specific point, with a specific radius, when used in the SQL Select dialog box. However, it can also be used within MapBasic to actually draw a circle. In this example we will see it in the SQL Select dialog box.
The createcircle function requires three parameters: an X coordinate, a Y coordinate and a distance. The distance unit is not specified, as the default distance unit is used.
1. Close your driving regions table.2. From the Query menu, choose SQL Select.3. Fill in the dialog box as shown below.
16 Copyright © 2008 Pitney Bowes MapInfo Corporation. All rights reserved.
Session 8D: Advanced Object Editing
This query will select all the objects from the US_CUSTG table that are within 150 miles of the specified coordinates (Albany, NY).
4. Click OK.
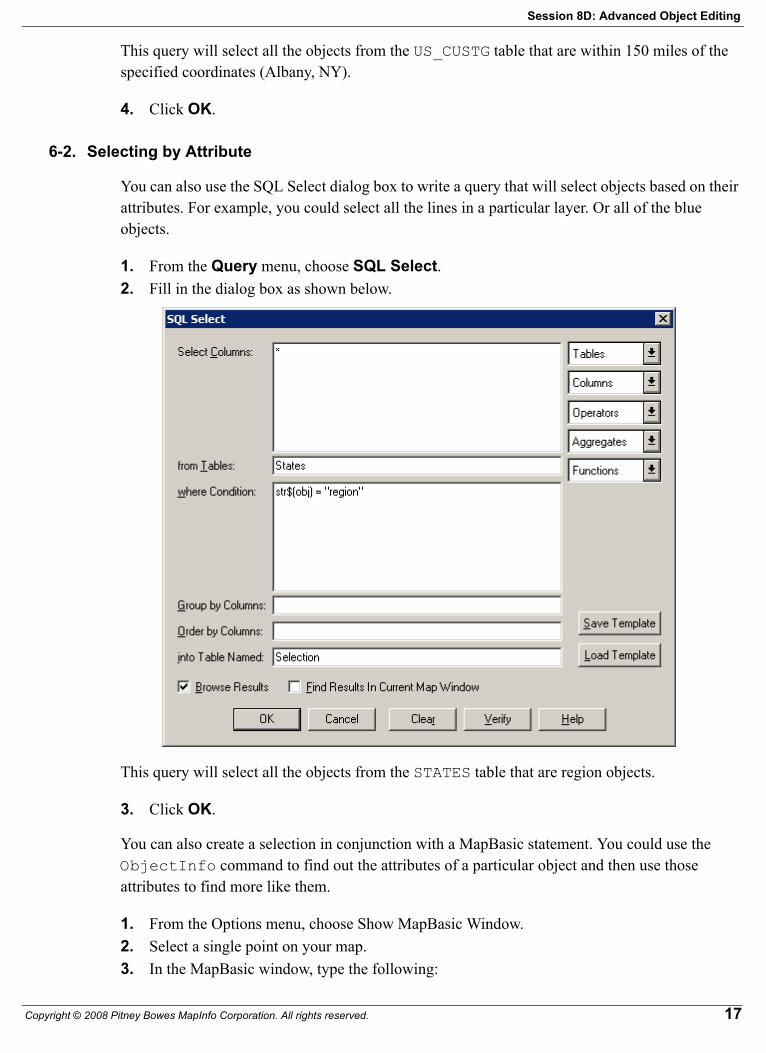
6-2. Selecting by Attribute
You can also use the SQL Select dialog box to write a query that will select objects based on their attributes. For example, you could select all the lines in a particular layer. Or all of the blue objects.
1. From the Query menu, choose SQL Select.2. Fill in the dialog box as shown below.
This query will select all the objects from the STATES table that are region objects.
3. Click OK.
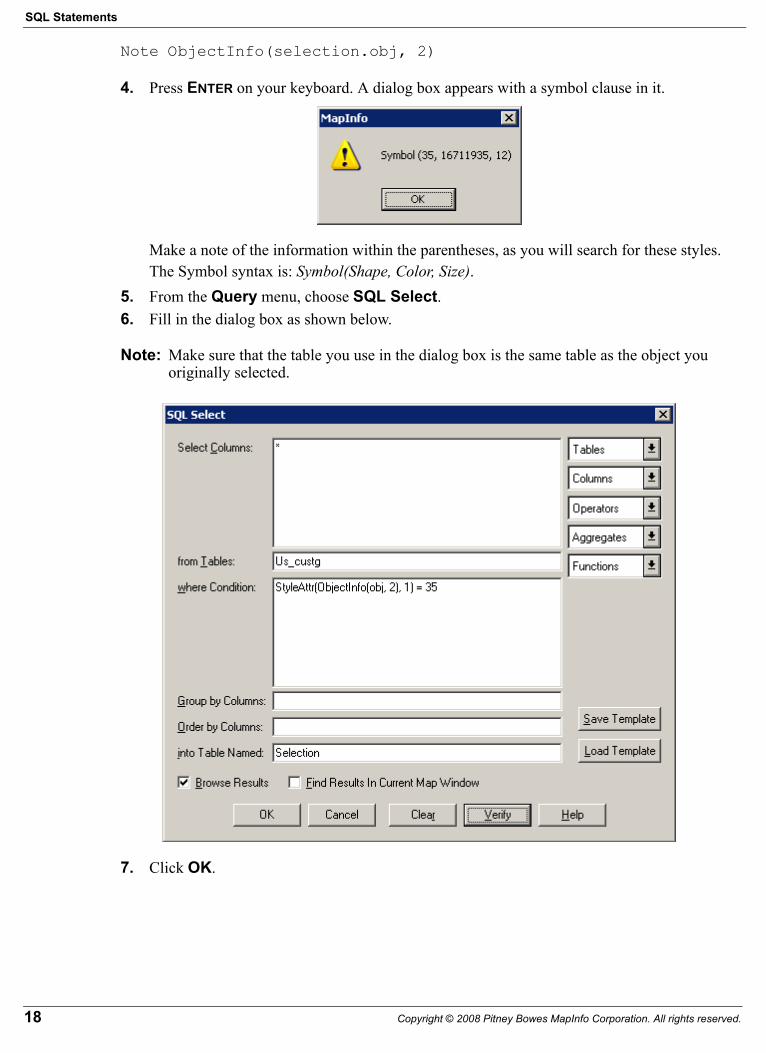
You can also create a selection in conjunction with a MapBasic statement. You could use the ObjectInfo command to find out the attributes of a particular object and then use those attributes to find more like them.
1. From the Options menu, choose Show MapBasic Window.2. Select a single point on your map.3. In the MapBasic window, type the following:
Copyright © 2008 Pitney Bowes MapInfo Corporation. All rights reserved. 17
SQL Statements
Note ObjectInfo(selection.obj, 2)
4. Press ENTER on your keyboard. A dialog box appears with a symbol clause in it.
Make a note of the information within the parentheses, as you will search for these styles. The Symbol syntax is: Symbol(Shape, Color, Size).
5. From the Query menu, choose SQL Select.6. Fill in the dialog box as shown below.
Note: Make sure that the table you use in the dialog box is the same table as the object you originally selected.
7. Click OK.
18 Copyright © 2008 Pitney Bowes MapInfo Corporation. All rights reserved.
Session 8D: Advanced Object Editing
7. Combine, Erase and Split
MapInfo Professional offers object-editing commands to easily modify the shape of surface geography (polygons, ellipses, rectangles, rounded rectangles) and linear objects (polylines, lines, arcs). These commands can be found under the Objects menu and the Combine, Erase, Erase Outside, and Split options. This exercise takes a close look at using the Combine, Erase, and Split commands. A brief description of each follows:
Combine: The process of geographically combining selected objects. The new object represents the geographic union of the original objects.
Erase: The process of erasing a portion of one object where it overlaps another.
Split: The process of splitting a map object where intersects another.
7-1. Combine
At times you may wish to take several polygons and combine them. For example, you may want to create a service territory out of several counties.
To demonstrate how to do this, you will take a series of ZIP Code boundaries and combine them so they become a single map object.
1. From the File menu, choose Close All.2. From the File menu, choose Open.3. From the Files of Type list choose Workspace (*.wor).4. Select the workspace ILLINOIS_COUNTIES.WOR. (It is located in the
\Training_Data\Workspaces folder.)5. Click Open.
To combine objects, you first have to ensure that the table they reside in must be editable.6. From the Status Bar, verify the ILLINOIS_ZIPS layer is editable.
The next step is to select what you wish to combine.
7. From the Main toolbar, choose the Select tool.
Copyright © 2008 Pitney Bowes MapInfo Corporation. All rights reserved. 19
Combine, Erase and Split
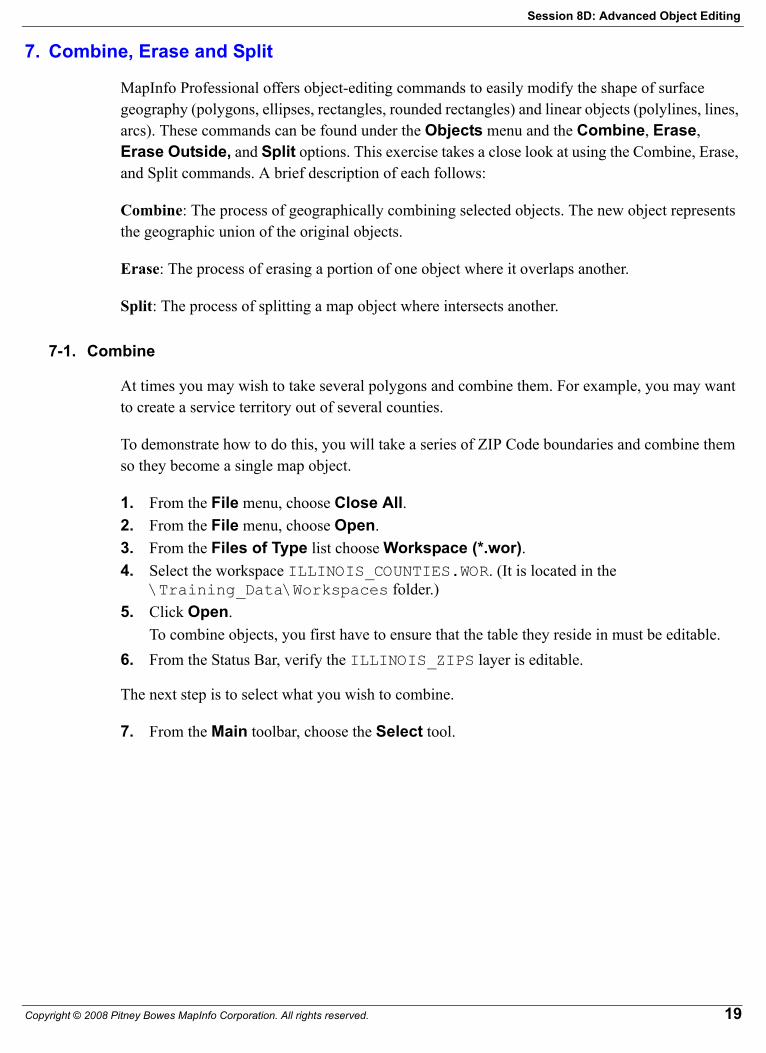
8. Hold the SHIFT key down and select two or more adjacent ZIP Code boundaries.
Now that the ILLINOIS_ZIPS table is editable and the ZIP Code boundaries are selected, you can combine them.
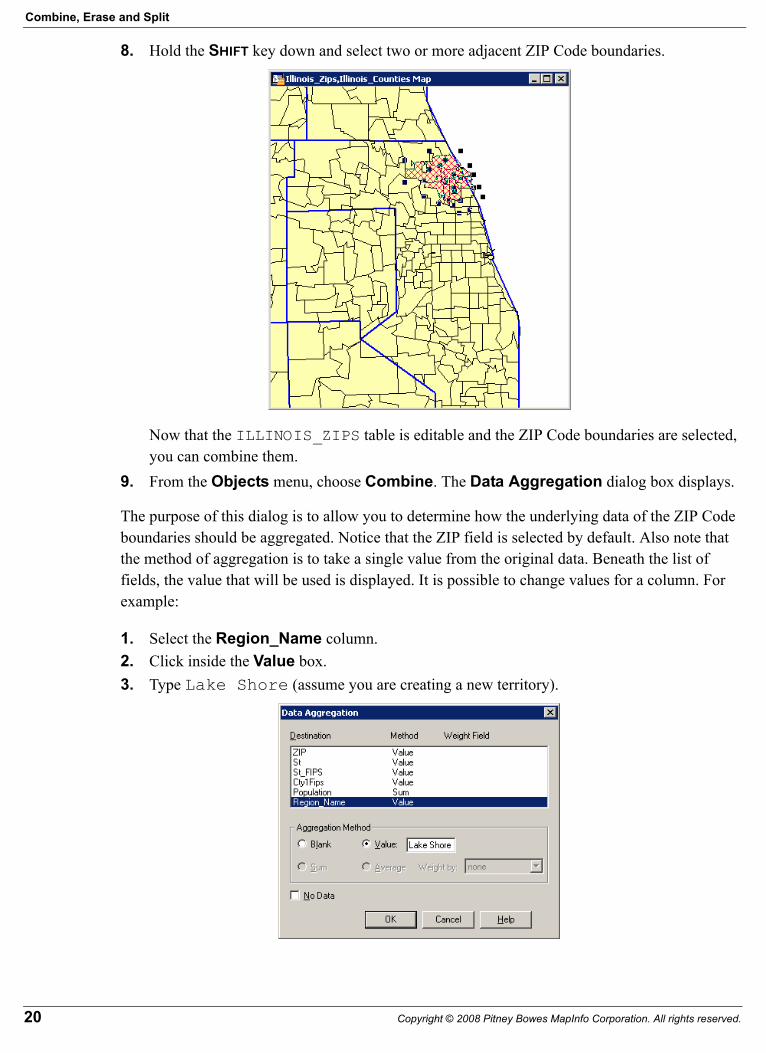
9. From the Objects menu, choose Combine. The Data Aggregation dialog box displays.
The purpose of this dialog is to allow you to determine how the underlying data of the ZIP Code boundaries should be aggregated. Notice that the ZIP field is selected by default. Also note that the method of aggregation is to take a single value from the original data. Beneath the list of fields, the value that will be used is displayed. It is possible to change values for a column. For example:
1. Select the Region_Name column.2. Click inside the Value box.3. Type Lake Shore (assume you are creating a new territory).
20 Copyright © 2008 Pitney Bowes MapInfo Corporation. All rights reserved.
Session 8D: Advanced Object Editing
That takes care of the Region_Name field. However, notice that the table also contains other information about each ZIP Code boundary. There is also a field containing population values.The default aggregation method for a numeric data field is summation. You will use the sum function on the population field.
4. Select the Population column.5. Verify Sum is the chosen aggregation method.6. Click OK.
There is only one set of edit handles around what were once multiple boundaries. The boundaries are now part of a single region object.
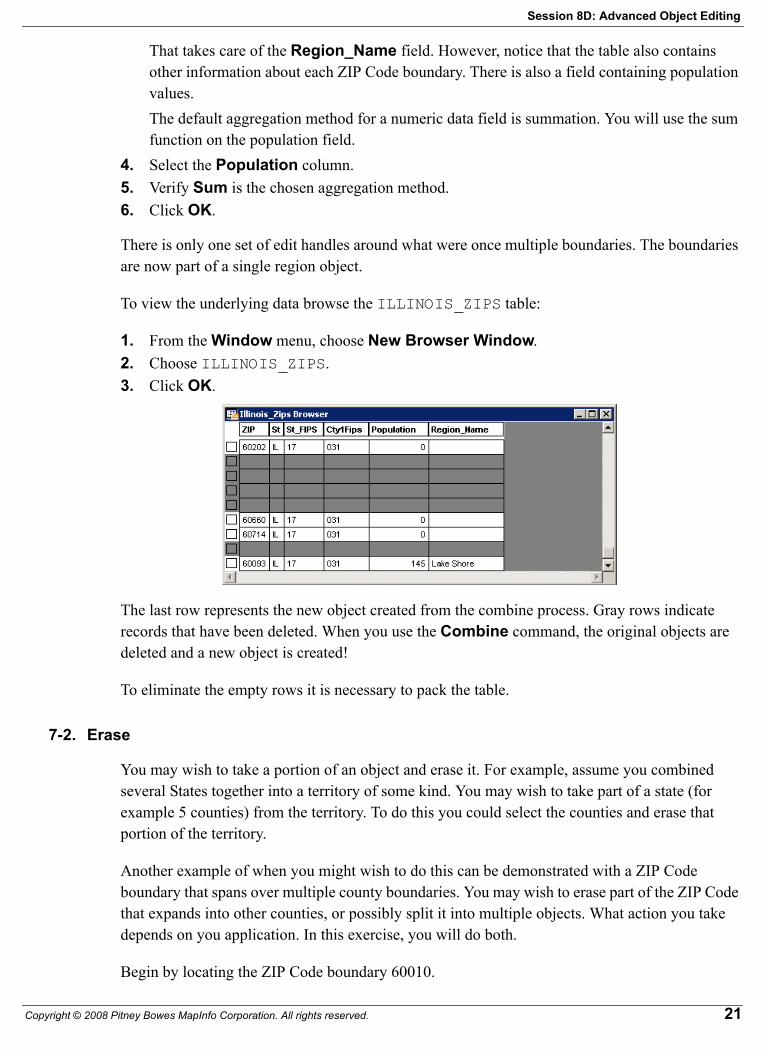
To view the underlying data browse the ILLINOIS_ZIPS table:
1. From the Window menu, choose New Browser Window.2. Choose ILLINOIS_ZIPS.3. Click OK.
The last row represents the new object created from the combine process. Gray rows indicate records that have been deleted. When you use the Combine command, the original objects are deleted and a new object is created!
To eliminate the empty rows it is necessary to pack the table.
7-2. Erase
You may wish to take a portion of an object and erase it. For example, assume you combined several States together into a territory of some kind. You may wish to take part of a state (for example 5 counties) from the territory. To do this you could select the counties and erase that portion of the territory.
Another example of when you might wish to do this can be demonstrated with a ZIP Code boundary that spans over multiple county boundaries. You may wish to erase part of the ZIP Code that expands into other counties, or possibly split it into multiple objects. What action you take depends on you application. In this exercise, you will do both.
Begin by locating the ZIP Code boundary 60010.
Copyright © 2008 Pitney Bowes MapInfo Corporation. All rights reserved. 21
Combine, Erase and Split
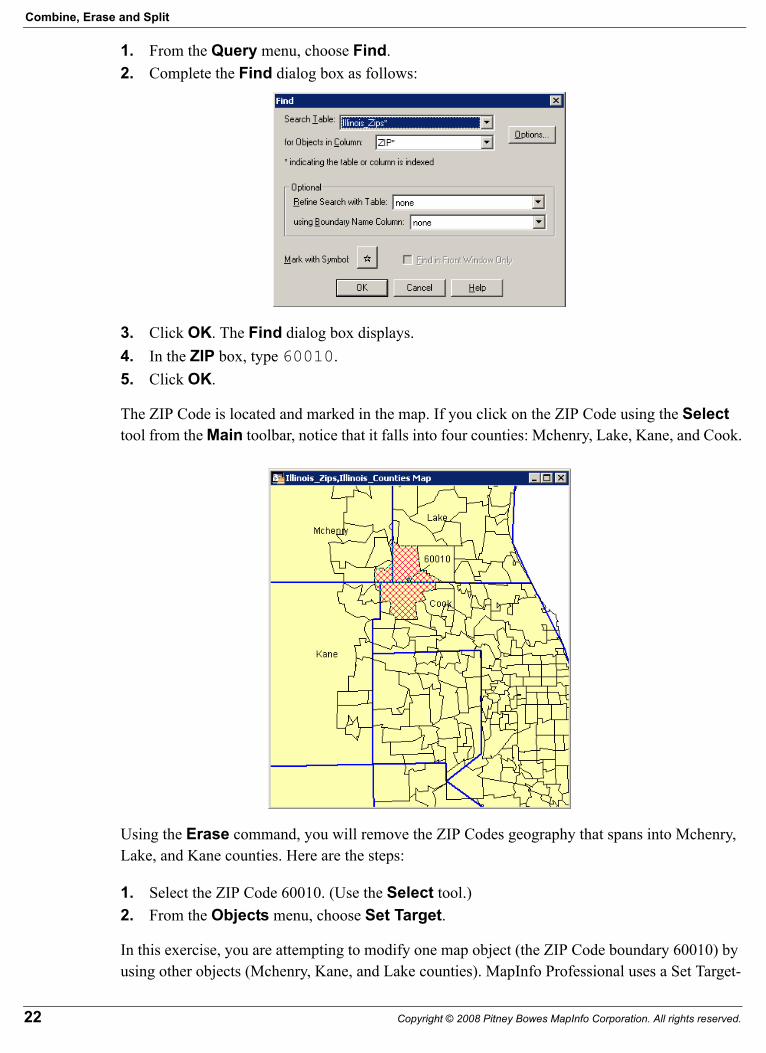
1. From the Query menu, choose Find.2. Complete the Find dialog box as follows:
3. Click OK. The Find dialog box displays.4. In the ZIP box, type 60010.5. Click OK.
The ZIP Code is located and marked in the map. If you click on the ZIP Code using the Select tool from the Main toolbar, notice that it falls into four counties: Mchenry, Lake, Kane, and Cook.
Using the Erase command, you will remove the ZIP Codes geography that spans into Mchenry, Lake, and Kane counties. Here are the steps:
1. Select the ZIP Code 60010. (Use the Select tool.)2. From the Objects menu, choose Set Target.
In this exercise, you are attempting to modify one map object (the ZIP Code boundary 60010) by using other objects (Mchenry, Kane, and Lake counties). MapInfo Professional uses a Set Target-
22 Copyright © 2008 Pitney Bowes MapInfo Corporation. All rights reserved.
Session 8D: Advanced Object Editing
Apply Action model of editing. With this model of editing, the object or objects that you wish to change are called the Target. Once you set a target you can select other objects to act as the “cookie cutter.”
In your example, the ZIP Code boundary will act as the target and the counties will act as the cookie cutter.
The ZIP Code 60010 polygon is highlighted with a diamond pattern.
3. Select the three counties (Mchenry, Lake, and Kane) using the Select tool.
You will have to use CTRL click on the first county since it is underneath the ZIP Code layer and SHIFT click on the other two counties.
4. From the Objects menu, choose Erase. The Data Disaggregation dialog box displays.5. Click OK.
The end result of the map does not look too much different than before. However, if you look closely, you can see that the highlight pattern does not include the ZIP Code boundaries that span into the other three counties.
Use the Info tool and notice the 60010 ZIP Code does not appear in the Info Tool window in the three other counties.
7-3. Split
When you erase an object, you eliminate area from it. There may be situations where you wish to break an object into two pieces, instead of eliminating area from it. For example, you will split the ZIP Code 60010 instead of erasing it.
To start, you need to revert the ZIP Code table to discard the changes from the previous exercise.
1. From the File menu, choose Revert Table.2. Click Discard.
The steps are similar to the previous exercises:
3. Select the ZIP Code 60010.Keeping with the Set Target-Apply Action editing model, the ZIP Code will be the target.
4. From the Objects menu, choose Set Target.5. Select the county to split the ZIP Code with. In this case, select Cook County using the CTRL
key.6. From the Objects menu, choose Split. The Data Disaggregation dialog box displays.
It is very important to understand that at most times, when you split or erase part of an object, there is no reliable way to divide the underlying data. For example, you wish to split a State, such as New York into two separate territories. You then draw a square that encloses part of New York. If you split New York into two pieces, one being what is inside the square, the other being what is
Copyright © 2008 Pitney Bowes MapInfo Corporation. All rights reserved. 23
Combine Using Column Data
not contained inside the square, how much population do you place in each? The fact of the matter is that there is no determining factor using New York alone. Some other data is necessary. Generally speaking, it is easier to build new objects out of existing objects (combine objects) than it is to create new objects by breaking apart existing objects (splitting or erasing).
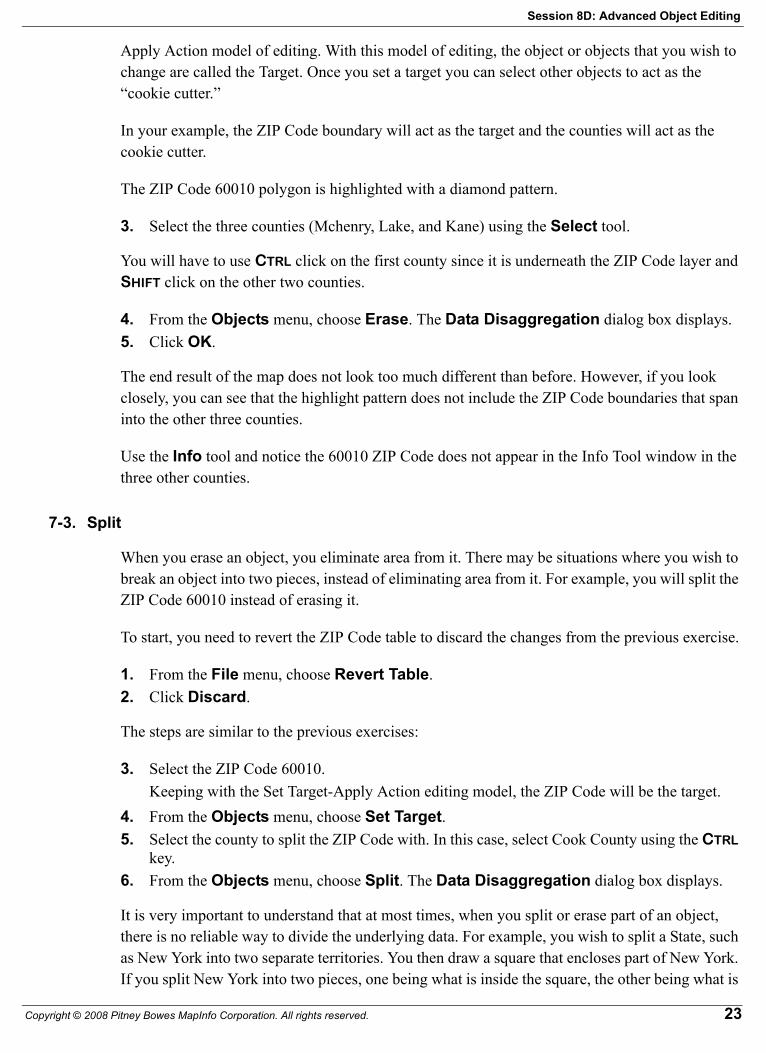
For demonstration purposes, change the Population field so that it will be disaggregated by the Area Proportion method.
7. Choose the Population field.8. In the Disaggregation Method group box, choose Area Proportion.
9. Click OK.
If you browse the table, you can see how the data was divided into two ZIP Codes.
1. From the Window menu, choose New Browser Window.2. Choose Illinois_ZIPS.3. Click OK.
If you wish, you can change the name of one or both of the ZIPs, by simply typing the new name into the Browser window.
After editing any table in MapInfo Professional, be sure to save your efforts:
1. From the File menu, choose Save Table.2. Choose Illinois_ZIPS.3. Click Save.
8. Combine Using Column Data
You may wish to combine all of the Metro DC ZIP codes into distinct districts. To do this, you need to create a new table in which to store the aggregated data (new districts). You will also have to open the table that you wish to pull the data from. In this case, you will use a table called DC_DSTRC.
1. From the File menu, choose Close All.
24 Copyright © 2008 Pitney Bowes MapInfo Corporation. All rights reserved.
Session 8D: Advanced Object Editing
2. Open the table called DC_DSTRC. (It is located in the \Training_Data\US\DC folder.)
You will now select the table that has the objects you wish to combine, the column from that table you wish to use to group the objects, and the table in which to store your results. You do not currently have a new table but you can specify that here.
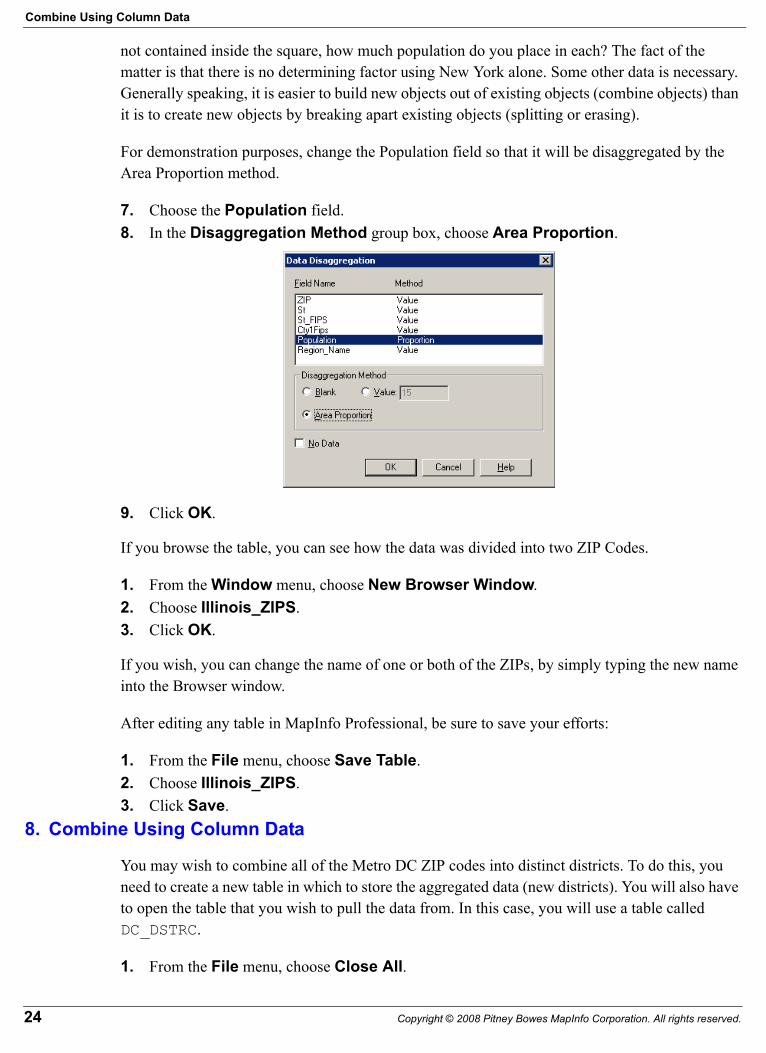
3. From the Table menu, choose Combine Objects Using Columns.4. Set the dialog box to look like the one below:
5. Click Next. The New Table dialog box displays.
This is the first step in creating a new table.
6. In the Create New Table and group, choose Open New Mapper.7. In the Table Structure group, choose Create New.8. Click Create. The New Table Structure dialog box displays.
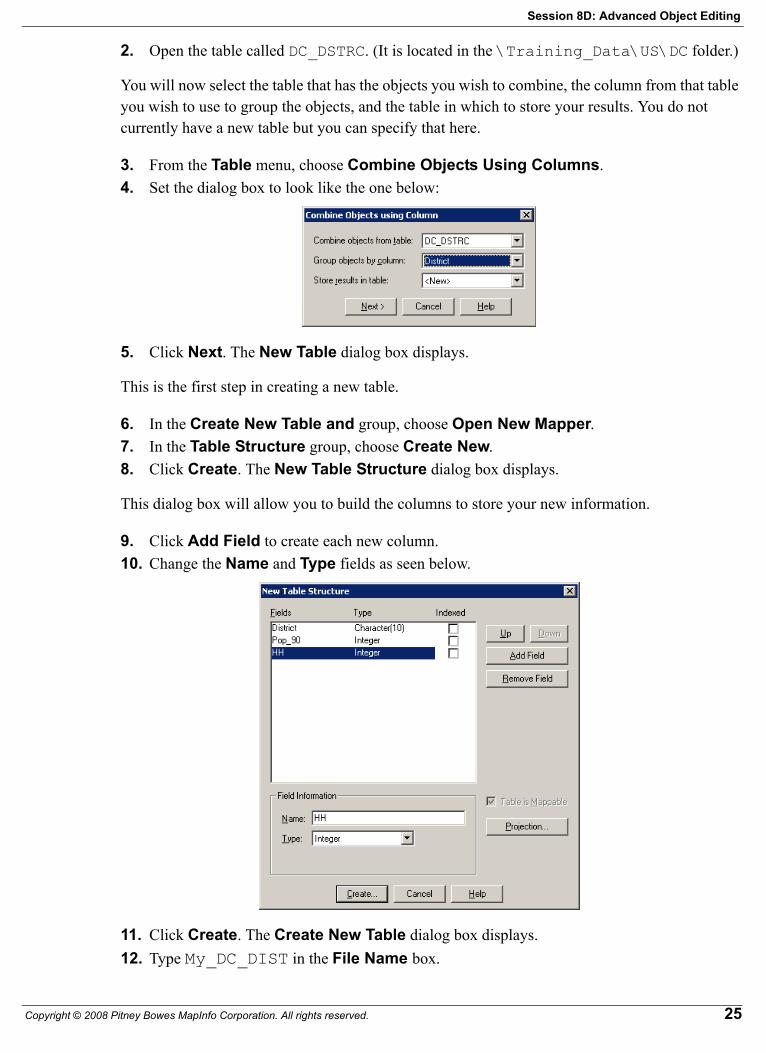
This dialog box will allow you to build the columns to store your new information.
9. Click Add Field to create each new column.10. Change the Name and Type fields as seen below.
11. Click Create. The Create New Table dialog box displays.12. Type My_DC_DIST in the File Name box.
Copyright © 2008 Pitney Bowes MapInfo Corporation. All rights reserved. 25
Combine Using Column Data
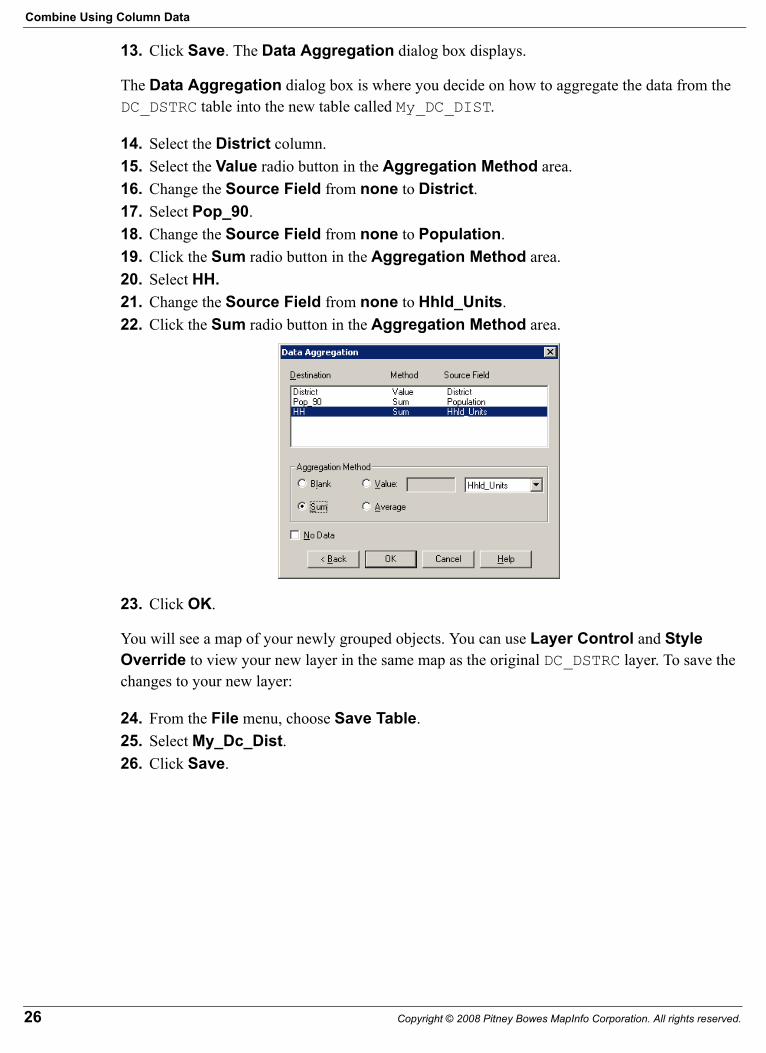
13. Click Save. The Data Aggregation dialog box displays.
The Data Aggregation dialog box is where you decide on how to aggregate the data from the DC_DSTRC table into the new table called My_DC_DIST.
14. Select the District column.15. Select the Value radio button in the Aggregation Method area.16. Change the Source Field from none to District.17. Select Pop_90.18. Change the Source Field from none to Population.19. Click the Sum radio button in the Aggregation Method area.20. Select HH.21. Change the Source Field from none to Hhld_Units.22. Click the Sum radio button in the Aggregation Method area.
23. Click OK.
You will see a map of your newly grouped objects. You can use Layer Control and Style Override to view your new layer in the same map as the original DC_DSTRC layer. To save the changes to your new layer:
24. From the File menu, choose Save Table.25. Select My_Dc_Dist.26. Click Save.
26 Copyright © 2008 Pitney Bowes MapInfo Corporation. All rights reserved.
Session 8D: Advanced Object Editing
9. Zero-Distance Buffers
A Zero-Distance Buffer allows you to use multiple objects with a clip region. Since the Set Clip Region command only works on a single region, you can overcome this limitation by combining several regions together in order to clip more than one region at a time.
To do this you will use the buffer command.
1. Close All.2. Open four tables: STATES, US_HIWAY, CITY_125 and STATECAP (located in the
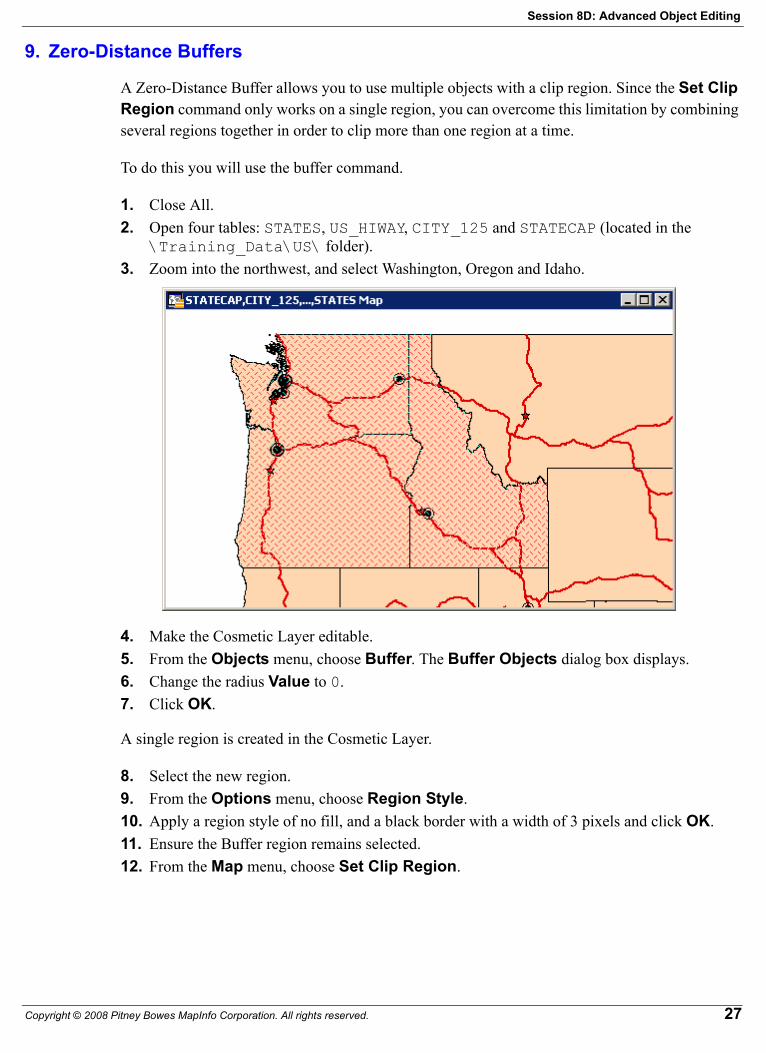
\Training_Data\US\ folder).3. Zoom into the northwest, and select Washington, Oregon and Idaho.
4. Make the Cosmetic Layer editable.5. From the Objects menu, choose Buffer. The Buffer Objects dialog box displays.6. Change the radius Value to 0.7. Click OK.
A single region is created in the Cosmetic Layer.
8. Select the new region.9. From the Options menu, choose Region Style.10. Apply a region style of no fill, and a black border with a width of 3 pixels and click OK.11. Ensure the Buffer region remains selected.12. From the Map menu, choose Set Clip Region.
Copyright © 2008 Pitney Bowes MapInfo Corporation. All rights reserved. 27
Zero-Distance Buffers
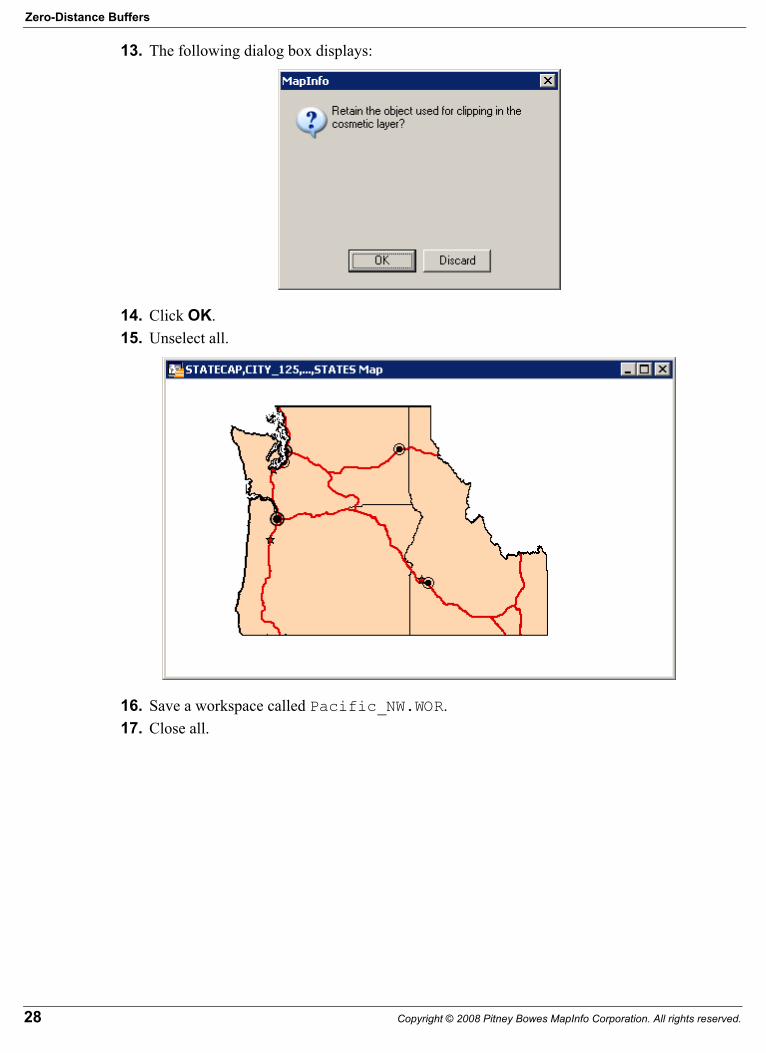
13. The following dialog box displays:
14. Click OK.15. Unselect all.
16. Save a workspace called Pacific_NW.WOR.17. Close all.
28 Copyright © 2008 Pitney Bowes MapInfo Corporation. All rights reserved.