8f11.wikispaces.com8f11+geog... · web viewshow students a map on the overhead of canada’s...
TRANSCRIPT

EDUC 8F11 Unit
Grade: 9 Academic
Subject: Canadian Geography
Unit: Human Systems
Katrina Persa and Jen Hogervorst
EDUC 8F11
Debra McLauchlan
February 2, 2011
1

Table of Contents
Curriculum Expectations....................................................................................................................................Page 3
Day 1: Introduction to Population Patterns..............................................................................................Pages 4 to 5
Map of Canada Activity Handout.......................................................................................................................Page 6
Canadian Population 2011 Census Handout.............................................................................................Pages 7 to 8
Exit Card Activity................................................................................................................................................Page 9
Day 2 & 3: Population Pyramids............................................................................................................Pages 10 to 11
What is a Population Pyramid Note.................................................................................................................Page 12
Population Pyramids Assignment.....................................................................................................................Page 13
Teacher Checklist: Population Pyramids Assignment...................................................................................Page 14
Day 4 & 5: Canada’s Immigration History...........................................................................................Pages 15 to 16
Canada’s Immigration History Note................................................................................................................Page 17
Web Diagram Template.....................................................................................................................................Page 18
Interpreting Graphs Activity............................................................................................................................Page 19
Graphing Checklist and Rating Scale..............................................................................................................Page 20
Day 6 & 7: Settlement Patterns..............................................................................................................Pages 21 to 22
Slideshow of Canada’s Cultural Enclaves.......................................................................................................Page 23
Cultural, Social and Physical Imprints PowerPoint.......................................................................................Page 24
Immigration Cases...................................................................................................................................Pages 25 to 26
Cultural Group Assignment Sheet and Rubric....................................................................................Pages 27 to 28
Peer and Self-Assessment Form.............................................................................................................Pages 29 to 30
Day 8 & 9: Canada’s Point System........................................................................................................Pages 31 to 32
Point System Qualification Test.............................................................................................................Pages 33 to 34
Immigration Activity Handout.........................................................................................................................Page 35
Immigration Profile Exemplar..........................................................................................................................Page 36
Checklist for Culminating Task........................................................................................................................Page 37
Summative Quiz.......................................................................................................................................Pages 38 to 41
Final Overview.........................................................................................................................................Pages 41 to 43
2
Ontario Ministry of Education Curriculum Expectations
Overall Expectations- SSV.01B: Demonstrate an understanding of spatial organization components (e.g., place,
location, region, pattern)- SSV.03B: Identify and analyze patterns of spatial organization, including population
distribution- SSV.05B: Analyze factors that affect natural and human systems in Canada using local
and regional examples- UMV.01B: Demonstrate an understanding of how natural and human systems change
over time and from place to place- UMV.02B: Demonstrate an understanding of how global economic and environmental
factors affect individual career and lifestyle opportunities - GCV.02B: Analyze connections between different parts of Canada, and between Canada
and other countries (e.g., migration patterns, cultural activities)- MIV.01B: Demonstrate an ability to collect, organize, and synthesize information from a
variety of sources to identify the characteristics of Canada’s geography- MIV.02B: Select and use appropriate methods and organizers to analyze the economic,
social, and natural factors that contribute to the characteristics of selected regions and systems in Canada
- MIV.03D: Select and use appropriate methods and technology to communicate the results of geographic inquiries, and present a variety of viewpoints on issues affecting Canadians
Specific Expectations- SS2.02D: Analyze statistical data on population density to identify trends and variations- SS2.03D: Identify patterns of migration within Canada, and between Canada and other
countries- UMI.01B: Demonstrate an understanding of similarities among cultures and the need to
respect cultural differences- UMI.03D: Demonstrate an understanding of the factors influencing demographics and
migration in Canada - UM3.01D: Produce and evaluate a set of criteria (e.g., in terms of religious and political
pluralism, bilingualism, contributions of ethnocultural groups) to describe Canadian identity
- MI1.02B: Demonstrate an understanding of the methods used to collect, organize, manipulate, and interpret geographic data
- MI2.04B: Use geographic organizers effectively to visualize, clarify, and interpret geographic information
- MI2.11D: Create and use effectively photographs, charts, graphs, models, and diagrams
3

Day One: Introduction to Population Patterns
Materials Required
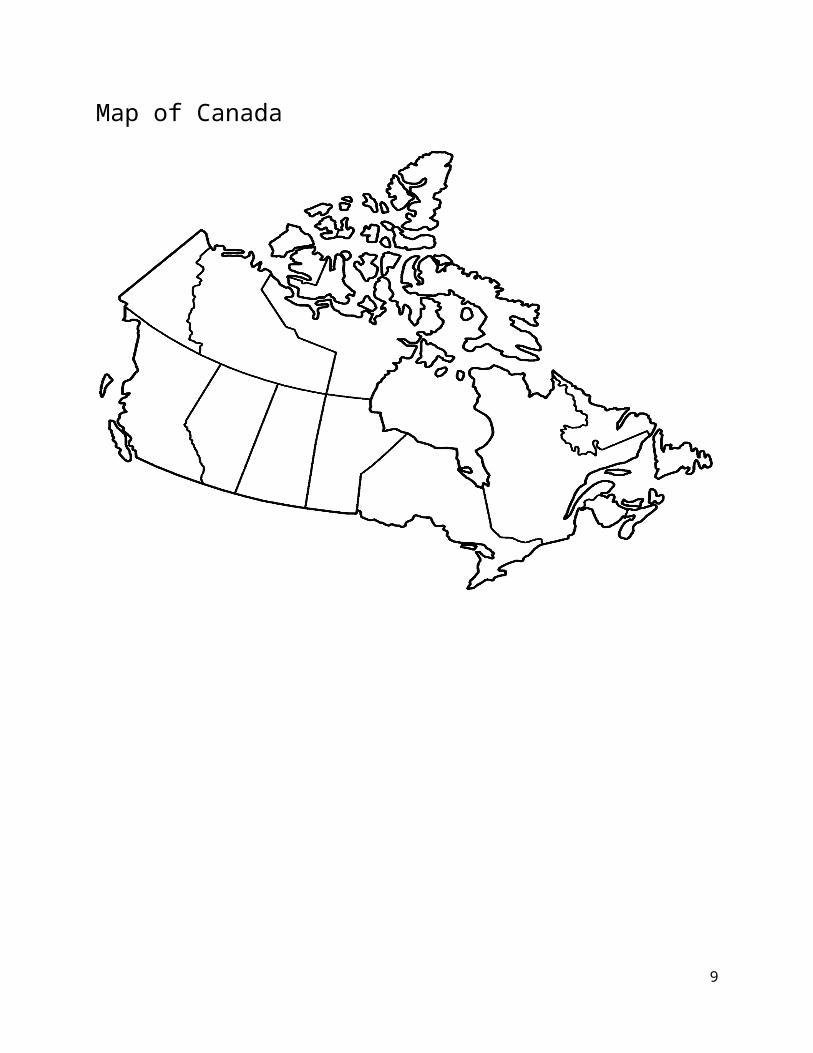
Blank maps of Canada (1 per student) Coloured pencils Overhead Overhead notes: Population Density Chart, Map of Canada’s Population Distribution Questions for students to determine population density Exit cards (1 per student)
Instructional Procedures
Setting the Stage: Conducting a Mini Population Census (15 minutes)o On a sheet of paper, have each student answer the following questions:
How many people live in your household? What is the age of each person? How many people in your household were born outside of Canada?
o Have volunteers find the class averages of each statistic on the board.o Think/Pair/Share: In what ways is your class “typically Canadian”?
Activity: Estimating Canada’s Population (20-25 minutes)o Distribute blank maps of Canada to each student.o Using a coloured marker, ask students to colour in the top 10 most populated
areas of Canada and in a few sentences describe why.o Show students a map on the overhead of Canada’s population distribution by
province and discuss patterns.
Activity: Understanding Population Density: Canada verses the World (30 minutes)o Ask students what they think population density means. Share definition and write
in note. o Show students population density chart and ask them what they notice about it
(i.e. where does Canada stand? Why does Canada have such a low population density, etc) Have students copy list of top 10 countries and their population densities in a note.
o Using the black board, show students the formula to determine population density (total population divided by kilometres squared). In pairs, have students work out two problems provided.
Wrap- Up: Exit Card (5-10 minutes)
4
o Distribute one exit card per student which they will fill out and hand in before the end of the class.
o Students will comment on one thing they learned today, one thing they would like to learn this unit and anything they may want clarification about.
Student Activities
Conduct a mini-census of your family’s population patterns Discuss class medians and patterns found in census Estimate Canada’s population patterns on a blank map Take note on Population Density and examples from around the world Work in pairs to determine two different countries’ population densities Complete an exit card for the day’s lesson
5

Map of Canada
6
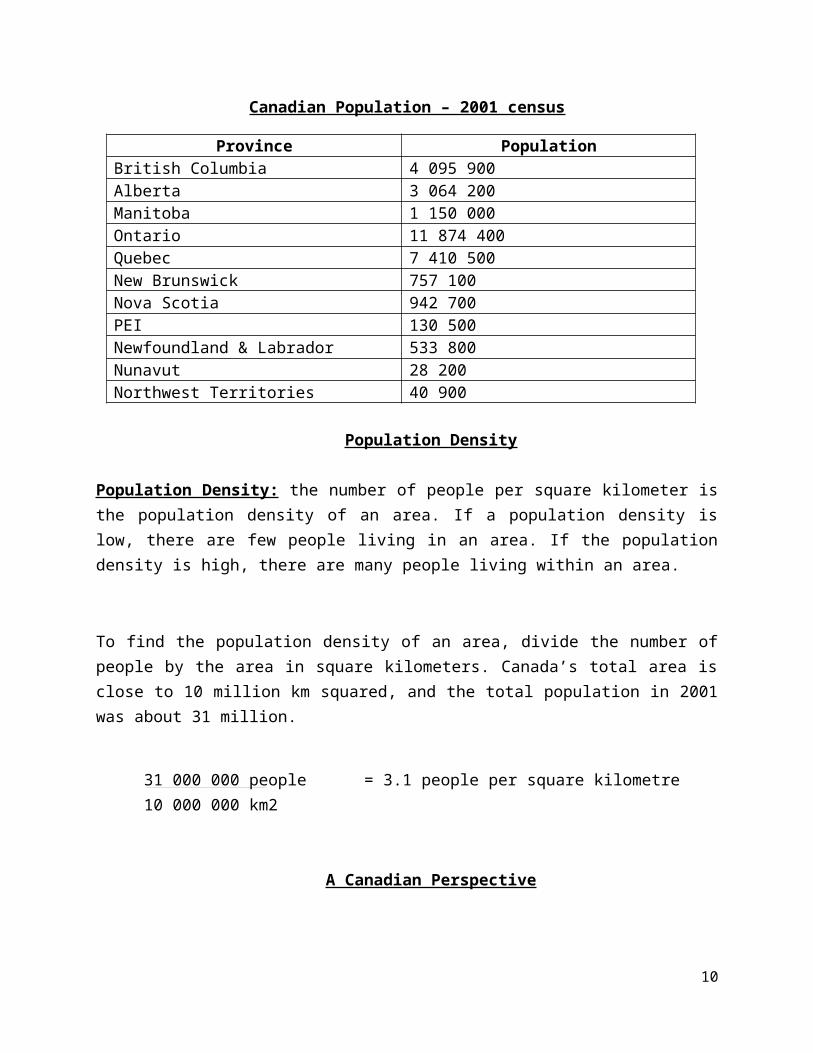
Canadian Population – 2001 census
Province PopulationBritish Columbia 4 095 900Alberta 3 064 200Manitoba 1 150 000Ontario 11 874 400Quebec 7 410 500New Brunswick 757 100Nova Scotia 942 700PEI 130 500Newfoundland & Labrador 533 800Nunavut 28 200Northwest Territories 40 900
Population Density
Population Density: the number of people per square kilometer is the population density of an area. If a population density is low, there are few people living in an area. If the population density is high, there are many people living within an area.
To find the population density of an area, divide the number of people by the area in square kilometers. Canada’s total area is close to 10 million km squared, and the total population in 2001 was about 31 million.
31 000 000 people = 3.1 people per square kilometre10 000 000 km2
A Canadian Perspective
Although Canada is the second-largest country in the world, it has a relatively small population. That means its population density is low compared to many other countries. In fact, even if the entire population lived in the province of Ontario, our population density would be about the same as that of the United States. If we all decided to move to Newfoundland and Labrador, we’d only be as crowded as Greece or Spain!
Population Density Chart: Nation Comparison (2001)
7

Country Area (km2) Population Population DensityAustralia 7 686 900 19 358 000 2.5Canada 9 976 100 31 082 000 3.1China 9 597 000 1 273 111 000 132.6Greece 131 900 10 624 000 80.5Iceland 103 000 278 000 2.7Japan 377 800 126 772 000 333.5Netherlands 41 500 15 981 000 385.0Russia 17 075 200 145 470 000 8.5Saudi Arabia 1 960 600 22 757 000 11.6Spain 504 800 40 038 000 79.3Sri Lanka 65 600 19 409 000 295.9Sweden 449 900 8 875 000 19.7
Practice Questions
1) a) The population of India is 1 000 000 0000 (1 billion) and the total area is 3 287 590 km squared. What is the population density of India?
b) What problems might a high population density like India’s cause?
c) What problems might a low population density like Canada’s cause?
2) The population of the United Kingdom is 59 648 000 and the area per square kilometre is 244 800. What is the population density of the United Kingdom? How does it compare to Canada’s?
3) The population of Zimbabwe is 11 365 000 and the area squared is 390 600. What is the population density of Zimbabwe? What implications does this have for the nation as a non-industrialized society?
8
EXIT CARD
Tell me 2 things you have learned today…
Tell me 2 things you want to learn in the unit…
Tell me anything from today’s lesson that you are confused about
9
Day Two and Three: Population Pyramids
Materials Required
Overhead projector Overhead Note: What is a Population Pyramid? Computer Lab with Microsoft Excel Population Pyramid Worksheets (1 per pair) Population Pyramid Teacher Checklist
Instructional Procedures
Setting the Stage: Think/Pair/Shareo In pairs, students will discuss: a) what they think a population pyramid is, b) what
they think the male-female composition of Canada is and c) what they think the age distribution of Canada is d) why is this important?
Activity: What is a Population Pyramid? (30 minutes)o Have students take down a note from the overhead giving the definition of a
population pyramid and an example.o Discuss what dependency load means and how it applies specifically to Canadao Distribute worksheet on population pyramids and have students complete it
individually. Take up answers as a class immediately following.
Activity: Creating your own Population Pyramid (75 minutes)o In assigned pairs, students will create their own population pyramids and analysis
for assessment in the computer lab. o This assignment will be assessed out of 30 as part of their application &
communication marks. Student pairs will receive the same grade.
Wrap-Up: Why Do These Trends Matter?o Lead a group discussion of what pairs foundo Have students answer the questions:
Why is it important to consider issues in population like dependency load? What impact does this dependency load have on your future? What future trends can you predict based on your data?
Student Activities
10

Take a note on Population Pyramids Interpret and analyze the difference between three population pyramids In pairs, create your own Population Pyramids based on the data and analyze Communicate the importance of population trends such as dependency load and future
population pyramids orally and in writing
11

Student Note: What is a Population Pyramid?
Population Pyramid: A special type of histogram that shows the percentage of males and females in a population by age groups (also called age distribution). A country that has more
young people is likely to experience higher population growth. A nation with more people in older age groups is likely to have a slower population growth.
Dependency Load: The category of a population that depends on others for support. This category includes people under the age of 15 and over the age of 65 who do not form part of the
work force.
If a country’s dependency load is high, it places more of a burden on the working population. For example, working citizens may have to pay more taxes to meet the health care needs of the
elderly and the schooling needs of the young.
12

Population Pyramids Assignment
Exploring Changes in Canada’s Population
Name(s):________________________________ Date:____________________________
A: Using Data to Create Population Pyramids /20 (Application)
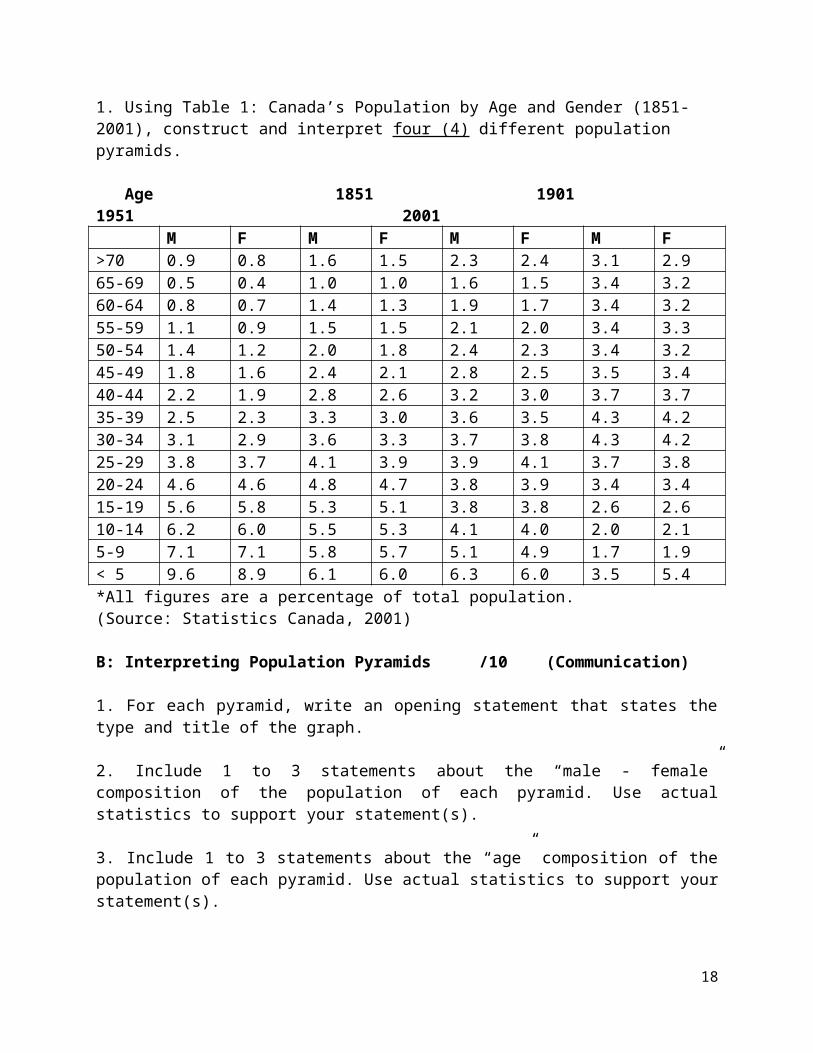
1. Using Table 1: Canada’s Population by Age and Gender (1851- 2001), construct and interpret four (4) different population pyramids.
Age 1851 1901 1951 2001M F M F M F M F
>70 0.9 0.8 1.6 1.5 2.3 2.4 3.1 2.965-69 0.5 0.4 1.0 1.0 1.6 1.5 3.4 3.260-64 0.8 0.7 1.4 1.3 1.9 1.7 3.4 3.255-59 1.1 0.9 1.5 1.5 2.1 2.0 3.4 3.350-54 1.4 1.2 2.0 1.8 2.4 2.3 3.4 3.245-49 1.8 1.6 2.4 2.1 2.8 2.5 3.5 3.440-44 2.2 1.9 2.8 2.6 3.2 3.0 3.7 3.735-39 2.5 2.3 3.3 3.0 3.6 3.5 4.3 4.230-34 3.1 2.9 3.6 3.3 3.7 3.8 4.3 4.225-29 3.8 3.7 4.1 3.9 3.9 4.1 3.7 3.820-24 4.6 4.6 4.8 4.7 3.8 3.9 3.4 3.415-19 5.6 5.8 5.3 5.1 3.8 3.8 2.6 2.610-14 6.2 6.0 5.5 5.3 4.1 4.0 2.0 2.15-9 7.1 7.1 5.8 5.7 5.1 4.9 1.7 1.9< 5 9.6 8.9 6.1 6.0 6.3 6.0 3.5 5.4*All figures are a percentage of total population.(Source: Statistics Canada, 2001)
B: Interpreting Population Pyramids /10 (Communication)
1. For each pyramid, write an opening statement that states the type and title of the graph.
2. Include 1 to 3 statements about the “male - female” composition of the population of each pyramid. Use actual statistics to support your statement(s).
3. Include 1 to 3 statements about the “age” composition of the population of each pyramid. Use actual statistics to support your statement(s).
13

4. Closing statements should focus on the concerns that the population may have about any of the points mentioned in your earlier statements about the structure of the population of the country.
Teacher Checklist: Population Pyramids Assignment
Part A: Creating Population Pyramids /20 Application (5 marks per pyramid)
Pyramid includes a title at the top center.
Both axis are labelled.
Data used in Pyramid are accurate and complete.
Pyramid is well organized and presented in a neat fashion.
Pyramid is completed on excel or other computer software.
Part B: Interpretation /10 Communication (2.5 marks/ summary)
Opening statement is complete, stating title and type of graph.
Comments on the male-female composition using actual facts
Comments on the age distribution using actual facts.
Closing statements focus on concerns regarding the population distribution
Grammar, punctuation, spelling and sentence structure is used effectively.
Grade: ________________
Comments:______________________________________________________________________________________________________________________________________________________________________________________________________________________________________________________________________________________________________________
14
____________________________________________________________________________________________________________________________________________________________
Day 4 and 5: Canada’s Immigration History
Materials Required Canada’s Immigration History note Web Diagram Template (1 per student) Statistical information on immigration rates and patterns Graph paper (2 sheets per student) Graphing Checklist Rating Scale Assessment Tool
Instructional Procedures Setting the Stage: “Sit Down If...” Introductory Game (10 Minutes)
o The game will begin with the teacher asking the students to stand and to sit down if they answer yes to the first, second, third or fourth question (and to remain seated during the remainder of the game).
o The teacher will say “Sit down if...” followed by the four key questions: 1. If your great-grandparents immigrated to Canada2. If your grandparents immigrated to Canada3. If your parents immigrated to Canada 4. If you immigrated to Canada
o By the end of the four questions, it is likely that only a small number of students are left standing, therefore opening the class to a discussion of family backgrounds and personal experiences. This game is beneficial in showing the students that Canada is a relatively young country made up of many immigrants, as well as showing the significance of immigration to Canada’s growth and development.
Activity: Analyzing the Significance of Immigration and Multiculturalism (20 Minutes)o To begin the section on immigration, the students will discuss what immigration
is and push and pull factors that influence migration patterns. o Think/Pair/Share: Students will brainstorm what the benefits of immigration are
to the social, cultural, and economic makeup of Canada using a web diagram to record their answers, and add in their partners answers.
15

o Think/Pair/Share Part Two: The second part to this activity will be to discuss multiculturalism, specifically how immigration has contributed to Canada’s identity as a multicultural nation.
Activity: Learning About Canada’s Immigration History (45 Minutes)o Remind the students of the introductory game “Sit Down If...” to inform the
students that immigration to Canada has occurred on an ongoing basis over the past century.
o Students will copy a note outlining Canada’s immigration history (periods of boom and bust, where these immigrants migrated from, why these people migrated.
o Students will create a visual representation of Canada’s immigration history in the form of a timeline. Students will be given the rest of the period to complete their timeline.
Activity: Interpreting Graphs – Immigration Over the Years (50 Minutes)o Teacher will provide the students with two sets of statistical information:
immigration rates over the past 15 years (males and female totals), and percentages of immigrants who have settled in specific provinces and territories.
o Students will use this information to create three sets of graphs. The first two graphs will be the immigration totals from 1990 to 2009 for male and female permanent residents. The third set of information the students will graph will be on the total number of immigrants who settled in each province and territory in 2009.
o The teacher will review how to create a graph, and what must be included on their graph. The teacher will provide the students with a checklist of criteria they must include on their graphs.
Activity: Analyzing Push and Pull Factors to Immigration (25 Minutes)o Students will be asked to write a one page paper on the push and pull factors to
immigration considering the question: Outline and discuss the push and pull factors that would be involved in an individual’s decision to move to Canada. Why would Canada as a destination appeal to potential immigrants?
o Students are to hand in their response paper the following class and marked using a rating scale.
Student Activities
16

Brainstorm immigration and multiculturalism using a web diagram Take a note on Canada`s immigration history Create a timeline of Canada`s immigration history Interpret statistical information to create graphs to show patterns and interpret the results Write a response paper analyzing push and pull factors to immigration
Canada’s Immigration History Note
When? What Happened? Why?1840s Arrival of thousands of Irish
SettlersIrish potato crop fails; facing starvation, many Irish move to Canada and other countries
1905 – 1914 Massive immigration to Canadian West from Eastern Europe
Canadian government, wanting to settle the Prairies, offers free land and other incentives to immigrants
1915 – 1919 Little immigration WW1 and worldwide influenza epidemic limit immigration
1930 – 1945 Little immigration Worldwide economic depression and WW2 limit immigration
1947 – 1960 Many Italians come to Canada Italians flee the devastation caused by war and the political and economic uncertainty that followed it
1956 Many Hungarians come to Canada
Hungarian revolt against the Russians fails; refugees come to Canada to avoid punishment
1980s – 1997 Arrival of thousands of Hong Kong Chinese
Immigrants seek political stability before China retakes control of Hong Kong in 1997
1980 – 2003 Many people from Afghanistan come to Canada
Immigrants seek a safe haven from conflicts that engulfed their country
Why People Become Immigrants Push Factor: Factors, such as war, absence of human rights, poor economic and
educational opportunities, religious persecution, terrorism, and natural disasters that encourage people to emigrate from their country.
Pull Factor: Factors that draw immigrants to a country, such as job opportunities, freedom of speech and religion, and lower tax rates.
In most migration cases, a combination of both push and pull factors causes people to become immigrants
Intervening Obstacles, such as distance from one country to Canada, qualifications of the Canadian government, the cost of immigrating may discourage (or even stop) people from following through on their decision to immigrate.
How Someone Becomes an Immigrant to Canada Canada accepts three types of immigrants: economic, family and refugees
17
Economic Immigrants: Includes (a) skilled workers and (b) individuals with the ability to make a significant financial contribution through the establishment or purchase of a business or the making of an investment that creates jobs
Family Immigrants: Family members and close relatives of Canadian citizens or landed immigrants can be brought to Canada
Refugees: A person who migrates to another country out of fear of cruel or inhumane treatment (or even death) in his or her own country
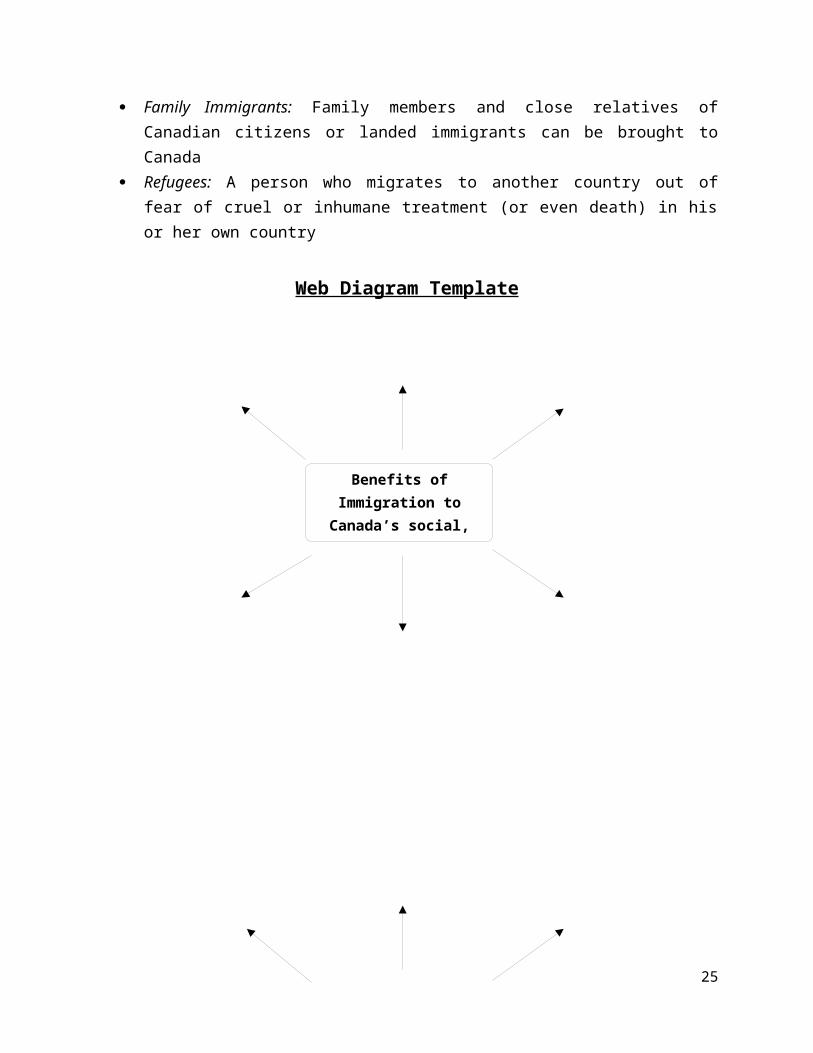
Web Diagram Template
18
Benefits of Immigration to Canada’s social, cultural and
economic makeup
How has Immigration contributed to Canada’s
identity as a multicultural nation?

Interpreting Graphs Activity: Immigration Over the Years
Use the information on the following charts to create three graphs (male and female permanent residents from 1990 to 2009, and immigration totals to Canada’s provinces and territories in 2009).
YEAR TOTAL MALE PERMANENT IMMIGRANTS
YEAR TOTAL FEMALE PERMANENT IMMIGRANTS
1990 109,363 1990 107,0481991 117,237 1991 115,5351992 126,019 1992 128,7801993 119,697 1993 136,9721994 105,574 1994 118,8121995 101,895 1995 110,9681996 110,385 1996 115,6431997 106,298 1997 109,6921998 84,984 1998 89,1851999 93,034 1999 96,9002000 112,349 2000 115,0972001 123,611 2001 127,0172002 112,754 2002 116,2912003 106,500 2003 114,8462004 114,162 2004 121,6582005 127,769 2005 134,4712006 122,130 2006 129,5102007 113,972 2007 122,7812008 118,611 2008 128,6352009 121,976 2009 130,203
*Remember to refer to the checklist of criteria to include on your graphs*
PROVINCE/TERRITORY NUMBER OF IMMIGRANTSNewfoundland & Labrador 603
Prince Edward Island 1,723Nova Scotia 2,424
New Brunswick 1,913Quebec 49,493Ontario 106,867
Manitoba 13,520Saskatchewan 6,890
19
Alberta 27,017British Columbia 41,438
Yukon 174Northwest Territories 107
Nunavut 10
Information obtained from: Citizenship and Immigration Canada (www.cic.gc.ca)
Have you included a TITLE for your graph?
Have you included titles for the HORIZONTAL and VERTICAL axis?
Did you UNDERLINE the titles using a RULER?
Did you use a RULER to create your bar graph?
Rating Scale Assessment Tool
Identifies a range of pull factors to immigration 0 1 23
Identifies a range of push factors to immigration 0 1 2 3
Describes reasons why Canada is a suitable destination 0 1 23
Clear connections are made between push and pull factors 0 1 23
Intervening obstacles are considered in the analysis 0 1 2 3
Follows page-length guideline 0 1 2 3
Total: /18
Feedback: ___________________________________________________________
20
Before handing in your Graphing Assignment, make sure you have met all requirements by checking
off the boxes below!

_________________________________________________________________________________________________________________________________________________________________________________________________________
Day 6 and 7: Settlement Patterns
Materials Required Slideshow presentation of Canada’s cultural enclaves PowerPoint Presentation on cultural, social and physical imprints Two Case Studies: Mohammed Mirza and Michelle Rapponi (1 each per student) Computer lab access to utilize the Glogster program Cultural Group assignment sheet and rubric Peer and self-assessment forms
Instructional Procedures Setting the Stage: Identifying Features of Canada’s Cultural Enclaves (10 minutes)
o To introduce settlement patterns the students will view a slideshow presentation depicting some of the features of various ethnic communities located across Canada – throughout the slideshow students will be asked to write down some of the distinguishing features of the cultural enclaves shown.
Activity: Understanding Canada as a ``Mosaic of Peoples`` (20 minutes)o The lesson will begin with defining cultural (how cultures vary within Canadian
society), social (behaviour, language, religion, customs), and physical (impact on surroundings) imprints in the form of a PowerPoint presentation
o From the textbook, two case studies will be analyzed by the students (Mohammed Mirza and Michelle Rapponi). Using these cases, the students will identify as a class the social and physical imprints evident in the two cases.
o Students will analyze examples of cultural imprints evident in their own communities (within their school, neighbourhood). Students will compare these imprints to other cultural features they may have noticed in locations other than their own hometowns.
Activity: Analyzing Cultural Groups within Canada (45 minutes + 75 minutes)o Students will be divided into groups of 4-5 to research and represent a Canadian
cultural group. The groups will identify the social, physical and cultural imprints this cultural group has on Canadian society.
o Students will create a visual representation of their research findings using the Glogster program online. Found at: http://www.glogster.com/
21

o Students will be given the remainder of day 8, and day 9 to work on their cultural group. The assignment will be marked using a rubric. Students will also be required to complete peer and self-assessment forms to evaluate their group members and their own contribution to the final assignment.
Student Activities Analyze and take note of the distinguishing features of Canada’s cultural enclaves Take a note on cultural, social and physical imprints Analyze two case studies of individuals living within Canadian cultural communities Assess cultural imprints within the local community Research a specific cultural group located in Canada Create a visual representation of the social, cultural and physical imprints of this enclave
22

23

24
CASE STUDY: MOHAMMED MIRZAIn 1971, Mohammed Mirza left Pakistan to study mathematics at the University of Winnipeg. He
was awarded a scholarship which helped him to complete a postgraduate degree. Mohammed considered studying abroad a great opportunity to learn about a country that was quite different from his own. He had been raised on a farm outside the city of Quetta in western Pakistan. Living in a Western city like Winnipeg was a unique and exciting experience.
Following his studies, Mohammed was offered a job with a Vancouver-based engineering company. He accepted the position and applied to become a permanent resident of Canada. In 1978, Mohammed returned to Pakistan to marry Sabira. The marriage had been arranged by their families – a tradition in Pakistan. Today the couple have two children. Their son Ebad is eighteen. He’ll be enrolling at Simon Fraser University in Burnaby, BC, where he eventually plans to study medicine. Their daughter Anjum is sixteen. She attends grade 10 at the local high school. Like many young students, she has not yet decided which career she will pursue.
At home, Mohammed and Sabira speak in their native language of Urdu. At work and in the community at large, however, they speak English. Ebad and Anjum speak both Urdu and English fluently. Although they are proud of their ability to speak Urdu, they prefer to speak English.
The Mirza home is filled with mementoes of their culture. Mohammed and Sabira value their culture, which is deeply rooted in the region of Islam. Islamic law governs the lives of the Mirza family. There is evidence of this throughout their home. On the dining room wall is a photograph of the Kaaba in Mecca, the shrine that is the centre of Islam. Above the fireplace in the family room is a copy of the Islamic holy book, the Koran. The Mirza family joins in all Islamic holy observances, including the month-long Ramadan in which strict fasting is observed from sunrise to sunset each day, and the Eid, a week-long festival that celebrates the end of the fast.
The Mirzas enjoy traditional Pakistani foods and spices, and they are able to buy these at speciality stores. They east a variety of foods, however, including steak, chicken and pasta. While Mohammed and Sabira’s favourite place to eat out is an Indonesian restaurant in downtown Vancouver, the children prefer pizza and hamburgers from the local fast-food outlets.
On special occasions, the family wears traditional Pakistani clothing. These are hand-embroidered Shalwar and Qameez – silk pants and tunic. Most of the time, however, both parents and children enjoy relaxing in casual clothes.
Mohammed subscribes to a Pakistani newspaper to learn about events in Pakistan. He is also able to keep up with his favourite spots, cricket and field hockey, which are popular in Pakistan. Mohammed’s son Ebad has never played cricket, even though his father has tried to teach him the game. Like many young Canadians, Ebad likes playing baseball and basketball. His sister Anjum also enjoys basketball, but she especially likes field hockey and is a member of her school’s team.
Mohammed Mirza enjoys living in Canada. He is proud that he has maintained his cultural heritage and that this contributes to the richness of Canada’s multicultural society. He believes that the
25

blending of ethnic cultures offers the best of both worlds and makes Canada a wonderful country in which to live.
Taken from: Birchall, G., Cartwright, F., & Pierce, Gerry. (1999). Contact Canada. New York: Oxford University Press, pages 267-268.
CASE STUDY: MICHELLE RAPPONIMichelle Rappini lived in Roassano in southern Italy, where she was a school teacher at the local
elementary school. She first came to Canada in 1982 to visit her uncle, who lives in Woodbridge, Ontario. There she met her future husband, Tony. Tony was born in Canada, although his family had emigrated from Milan, Italy, many years earlier. In 1983, Tony visited Michelle in Rossano. They decided to marry and live in Canada.
With her family’s blessing, Michelle became a permanent resident of Canada in 1984. She and Tony were married in a huge family reunion and celebration. Today Michelle teaches grade 6 in Woodbridge. She and Tony have one son, Mario. He is in grade 5 at the same school. He is not looking forward to being in his mother’s class next year!
At home, the Rappnis speak mostly Italian, but Mario prefers to speak English with his friends. He also speaks only English at school. He enjoys taking French and hopes to be able to speak it fluently one day.
The Rapponi home is full of Italian cultural influences. On the front veranda Michelle creates miniature gardens in an array of planters. Italian paintings and needlepoints adorn the walls. A crucifix is a prominent feature in the family room. Photographs of family members living in Canada and in Italy are displayed throughout the house.
The Rapponis enjoy a wide variety of foods. Michelle and Tony’s favourite dishes are traditional Italian pastas; pizza is Mario’s favourite. Michelle particularly enjoys small Italian cakes, which she buys at a local bakery. On Friday evenings, the Rapponis frequently drive to downtown Toronto to have dinner in one of their favourite restaurants. They enjoy all kinds of foods, from Thai to Swiss!
Tony has a passion for soccer and helps coach Mario’s team in the local soccer league. They both enjoy watching soccer matches from the Italian professional league every Sunday morning on the Toronto-based Italian-language television station. During the winter, their interest turns to hockey. Both Tony and Mario play in local leagues and are avid fans of the Toronto Maple Leafs. Mario sometimes goes to the local bocce courts to watch his father play his traditional Italian game that is similar to lawn bowling.
The family attends the local Catholic church at least once a week. During the major religious holidays of Christmas and Easter, they attend services more frequently. For these occasions, the family wears formal clothing. But like many people, Michelle, Tony, and Mario are most comfortable in casual clothes.
The Rapponis’ religion extends to their son’s education. Mario’s school is a Catholic separate school. Michelle and Tony support this system as a means of ensuring their religious values play a role in their son’s life.
As an Italian-Canadian, Michelle Rapponi is pleased that she has been able to enjoy the advantages of life in Canada while maintaining her cultural values and traditions.
26

Taken from: Birchall, G., Cartwright, F., & Pierce, Gerry. (1999). Contact Canada. New York: Oxford University Press, pages 268-269.
Researching Canada’s Cultural Groups Assignment Handout
Understanding that Canada is a “mosaic of people” requires us to understand the various cultural enclaves that are represented around Canada. Your task will be to research and represent a Canadian cultural group, working in groups of 4-5.
For this assignment, your group will research and identify the social, physical and cultural imprints your cultural group has on Canadian society. In addition to analyzing the impact of your cultural group on Canadian society, your research must include what impact the cultural group has on the region in which the cultural enclave exists.
After completing their research, students will present their cultural group in a visual poster format using the Glogster program (an interactive poster). Found at: http://www.glogster.com/
The list of cultural groups you can choose from include the following: - Chinese- South Asian- Portuguese- East and West Indian- Italian- Caribbean- Greek- Eastern European- German- Jewish
Students will be given two days in class to complete their research and put together their visual representation. The visual representation must incorporate graphics and information regarding the social, cultural and physical imprints of the cultural group.
27

All group members will be required to contribute to the final project. To ensure the accountability of all group members, each person will complete a peer and self-assessment form, which will be handed in on the due date.
The assignment will be marked using a rubric which will assess knowledge and understanding of the content represented, creative and critical thinking, communication (sense of purpose and audience) and application of concepts and key terms.
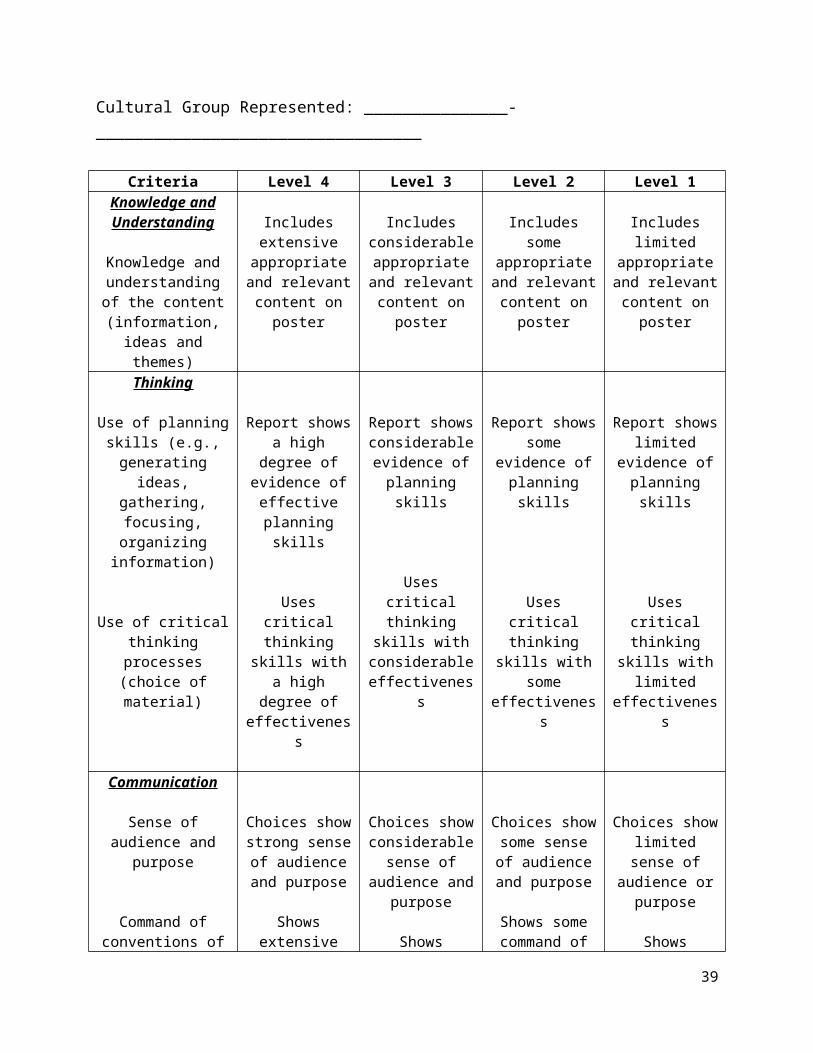
Analyzing Canada’s Cultural Groups Poster– Assignment Rubric
Name(s): ____________________________________________________________________ Cultural Group Represented: _______________-__________________________________
Criteria Level 4 Level 3 Level 2 Level 1Knowledge and Understanding
Knowledge and understanding of the content (information,
ideas and themes)
Includes extensive
appropriate and relevant content
on poster
Includes considerable
appropriate and relevant content
on poster
Includes some appropriate and relevant content
on poster
Includes limited appropriate and relevant content
on poster
Thinking
Use of planning skills (e.g., generating ideas,
gathering, focusing, organizing
information)
Use of critical thinking processes (choice of material)
Report shows a high degree of
evidence of effective planning
skills
Uses critical thinking skills
with a high degree of
effectiveness
Report shows considerable evidence of
planning skills
Uses critical thinking skills
with considerable effectiveness
Report shows some evidence of
planning skills
Uses critical thinking skills
with some effectiveness
Report shows limited evidence of planning skills
Uses critical thinking skills with limited effectiveness
Communication
Sense of audience and Choices show Choices show Choices show Choices show
28
purpose
Command of conventions of form (use of images and text; principles of
design and presentation)
strong sense of audience and
purpose
Shows extensive command of
media conventions
considerable sense of audience
and purpose
Shows considerable command of
media conventions
some sense of audience and
purpose
Shows some command of
media conventions
limited sense of audience or
purpose
Shows limited command of
media conventions
Application
Application and transfer of knowledge
and skills
Shows extensive application and
transfer of knowledge and
skills
Shows considerable
application and transfer of
knowledge/skills
Shows some application and
transfer of knowledge and
skills
Shows limited application or
transfer of knowledge and
skills
Record of Individual Participation in Cultural Group Assignment
Name: _______________________________________________________________________________
Cultural Group Represented: _____________________________________________________________
Names of Group Members: ______________________________________________________________
Contributions to the Project
A. How I helped in the planning stages (thinking of ideas, gathering information, drawing ideas together, and so on). Please be specific. Use the back of the page if necessary.
B. How I helped the group work co-operatively as a team (encouraging others, setting goals, listening, compromising with others, finding solutions to problems, offering leadership when needed, and so on). Please be specific. Use back of page if necessary.
C. Tasks I did for the group project (writing, organizing materials and ideas, researching, writing report, and so on). Please be specific. Use the back of the page if necessary.
29
Confirmation: We, the undersigned, have read what _______________________ (name) has written and agree with what we have read.
1. _____________________________ 2. _____________________________
3. _____________________________ 4. _____________________________
Note: In cases where there is disagreement, ask the teacher to facilitate further discussion.
Adapted from Canada: The Story of a Developing Nation – Teacher’s Resource Binder (Toronto: McGraw-Hill Ryerson Limited, 2000), p.43.
Group Performance Observation Form for Cultural Group Assignment
Name: ______________________________________ Date: ___________________________________
Cultural Group Represented: ____________________________________________________________
Use this form to asses the performance of your group. Circle the appropriate number after each statement. Then discuss your ratings with other group members. This observation form will be taken into consideration in the marking process for your final group mark.
Members of Your Group:_________________________________________________________________
_____________________________________________________________________________________
Rating Scale
1 = Limited 2 = Adequate 3 = Proficient 4 = Outstanding
1. All members participated in the group activities. 1 2 3 4
2. Members listened to others in the group. 1 2 3 4
3. Members helped and encouraged others in the group. 1 2 3 4
4. Group members stayed on the task assigned. 1 2 3 4
5. Group members worked well together. 1 2 3 4
30

6. No one dominated the group discussion. 1 2 3 4
Fill in A and B below:
A. What I really liked about our group: _____________________________________________________
_____________________________________________________________________________________
B. Ideas for Improvement: _______________________________________________________________
_____________________________________________________________________________________
Adapted from Canada: The Story of a Developing Nation – Teacher’s Resource Binder (Toronto: McGraw-Hill Ryerson Limited, 2000), p.49.
Day 8 and 9: Canada’s Point System
Materials Required Overhead of the qualification factors and points Copy of the Point System Qualification Test “Passages to Canada” Guest Speaker Human Systems Summative Quiz Immigration Activity Handout Case Study exemplar Checklist for final activity
Instructional Procedures
Setting the Stage: Understanding the Factors Assessed in the Point System (15 minutes)o To begin, the teacher will ask the students what factors they think are taken into
consideration by the government when determining who is eligible to immigrate to Canada. The students will generate a list on the board with reasons to support their choices. Students will rank the factors in order of importance.
o The seven factors will be compared to the list generated by the students, as well as how many points are given for each factor. Factors visible on Qualification Test.
Activity: Analyzing the Point System Qualification Test (60 minutes)o In groups students will write a profile of an immigration candidate that includes
information about the following: name, age, origin, education, education level attained, job training, occupational experience, job prospects in Canada, language background, family situation, location plans. An exemplar of Laxmi Daji will be provided.
31

o Students will alternate profiles between groups and complete the qualification test for each case study using the Point System to determine each applicants eligibility
Activity: “Passages to Canada” Guest Speaker (45 minutes)o The “Passages to Canada” program “enables successful immigrants to share their
own story of coming to Canada with the citizens of tomorrow.” The teacher will arrange to have a guest speaker to come into the classroom to share their personal story about their immigration to Canada. Information about “Passages to Canada” can be found by following the link: http://www.passagestocanada.com/en/
o Students will write a short letter addressed to the guest speaker to emphasize why they believe it is beneficial to learn about the experience of recently-arrived immigrants. This letter will be checked for completion and marked out of 10.
Activity: Summative Unit Quiz (30 minutes)o Distribute quizzes to students and have students complete individually in class.
Homework Assignment: Reflecting on the Point System o Students will interview a family member or friend who immigrated to Canada
(recently or many years ago). Students will write an immigration profile for this person. A copy of the notes taken during the interview process must be handed-in with the final assignment.
o Using the immigrant profile, students will complete the qualification test for the person he/she interviewed to determine whether the person would be accepted into Canada using the current Point System Qualification Test.
o Students will write a reflection based on the case study and test analysis. In the reflection students must comment on the Point System – identify the elements they view to be unfair, propose changes to make the point system more equitable, determine whether one section of the system should be worth more than others.
o The final activity will be assessed using a checklist.
Student Activities Brainstorm the factors used in the Point System analysis Rank factors in order of importance Write an immigrant profile case study to be examined by the class Complete the Qualification Test using the immigrant profiles created by classmates Listen to a guest speaker from the “Passages to Canada” program Write Human Systems Summative Quiz Write a letter to the guest speaker emphasizing the significance of the presentation Conduct an interview and write an immigrant profile for someone who immigrated to
Canada. Write a reflection based on an analysis of the current Point System
32

Canadian Immigration Qualification Test
The Canadian government uses a point system to assess all Skilled Worker applicants. To be eligible for permanent residence in Canada, an applicant must obtain at least 67 points on the qualification test based
on the six factors (education, language, work experience, age, arranged employment and adaptability).Factor 1 – Education (Maximum 25 points)
Completed high school (5)Obtained a one-year diploma and at least 12 years of full-time studies (12)Obtained a one-year diploma and at least 13 years of full-time studies (15)Obtained a one-year university degree and at least 14 years of full-time studies (20)Obtained a university degree of two years or more at the bachelor’s level and completed at least 14 years of full-time studies (20) Obtained a three-year diploma and at least 15 years of full-time studies (22)Obtained two or more university degree and completed at least 15 years of full-time studies (22)Obtained a master’s or Ph.D. and completed at least 17 years of full-time studies (25)TOTAL POINTS
33

34
Factor 2 – English or French Language Proficiency (Maximum 24 points)Second Canadian Official Language (either English or French)
Read Write Speak ListenHigh Proficiency (4) (4) (4) (4)Moderate Proficiency (2) (2) (2) (2)Basic Proficiency (1) (1) (1) (1)No Proficiency (0) (0) (0) (0)
Second Canadian Official Language (either English or French)Read Write Speak Listen
High Proficiency (2) (2) (2) (2)Moderate Proficiency (2) (2) (2) (2)Basic Proficiency (1) (1) (1) (1)No Proficiency (0) (0) (0) (0)TOTAL POINTS
Factor 3 – Work Experience (Maximum 21 points)Years of Experience: Less than one year (15)More than 2 years but less than 3 years (17)More than 3 years but less than 4 years (19)4 or more years (21)TOTAL POINTS
Factor 4 – Arranged Employment (Maximum 10 points)No arranged employment (0)Arranged employment (10)TOTAL POINTS Factor 5- Age (Maximum 10 points)
Less than 17 (0) 17 (2)18 (4)19 (6)20 (8)21- 49 (10)50 (8)51 (6)52 (4)53 (2)54 and older (0) TOTAL POINTS
Factor 6 – Adaptability (Maximum 10 points)1. Accompanying Spouse/Partner’s Education:Not applicable (0)Secondary school diploma or less (1)A one-year diploma and at least 13 years of full-time studies (3)A two-year diploma and at least 14 years of full-time studies (4)Two or more university degrees and at least 15 years of full-time studies (4)A master’s or Ph.D. and at least 17 years of full-time studies (5)2. Principal Applicant or Spouse has studied in Canada: No, or has less than two years post-secondary education in Canada (0)Completed at least two years of post-secondary education in Canada since the age of 17 (5)3. Principal Applicant or Spouse has worked in Canada:No, or has worked full-time in Canada for less than one year (0)Worked full-time in Canada for at least one year (5)4. Principal Applicant or Spouse has family in Canada: No family in Canada (0)Family in Canada (must be a Canadian citizen or permanent resident living in Canada) (5)5. Principal Applicant or Spouse has arranged employment in CanadaYes has arranged employment in Canada (5)No does not have arranged employment in Canada (0)TOTAL POINTS

TOTAL SCORE: _______________________
Name: _______________________________ Date: ____________________________
CGC1D: An Analysis of Canada’s Point System – Immigration Assignment
You will assume the role of a Canadian immigration officer. Your task will be to interview someone, a family member or friend and write up an immigrant profile for this person. The profile paragraph must include information regarding the individual’s education, work experience, language ability, age, possible arranged employment and your judgment of their ability to adapt to become successfully established in Canada (adaptability). In addition, your profile write-up must include why you chose to interview the person you did.
Use the example discussed in class as your template for creating the immigrant profile (i.e. Laxmi Daji).
As an immigration officer you will be required to determine whether or not the individual would be admitted into Canada and the reasons for your decision based on the six factors. Questions to consider include: whether this individual would adapt well to Canadian culture, what skills and experience does this individual bring to the Canadian economy, and would this individual benefit from being integrated into Canada? The immigration officer’s decision must include reasoned judgment and an analysis of the applicant’s specific situation.
Your explanation must include:
An analysis of the individual’s eligibility using the six factors
The total mark the applicant would receive on the qualification test
Push and pull factors for immigration – why Canada?
Which category of immigrant the applicant is categorized as
Why the individual would benefit from being admitted into Canada
In addition, include an analysis of the Point System:
Are there any elements you view to be unfair?
Propose changes to make the Point System more equitable
Determine whether one section of the system should be worth more than others
The expected length for the immigration assignment is 2-3 pages typed, 12-point font.
A copy of the interview questions & answers must be attached to the assignment.
35

Immigrant Profile: Laxmi Daji
Laxmi Daji was born in Delhi, India. Laxmi has always lived in India with her family,
and completed high school and university while living at home. She earned a four-year Bachelor
of Science degree to become a registered nurse at the University of Delhi. Laxmi loves working
as a nurse and began her career in a local hospital, where she worked for just over three years.
However, because of cutbacks Laxmi lost her job at the age of 25. Feeling adventurous and ready
for a change Laxmi decided to advance her career in a new country. Canada was Laxmi’s top
choice as she speaks English fluently, although she does not speak any French. Laxmi is not
worried about immigrating to Canada alone because she has family already living in the country
as permanent residents. Laxmi’s Aunt Sumitha and her husband Chetan immigrated to Canada in
the 1980’s. Laxmi has kept in touch with her aunt and uncle, and is excited to meet her three
cousins who were each born in Canada. Laxmi’s Uncle Chetan is a doctor in Toronto and she
hopes he may be able to help her find a job, although it is not guaranteed. Laxmi is hopeful she
will have the opportunity to move to Canada to begin a new chapter in her life.
36
Reflecting on the point system – final Assignment
Name:____________________________________ Date: _____________________________________
Interviewee (Applicant) Name: _______________________________________
4 2 0
1. Student conducts a complete interview process...........
2. Student attaches a copy of interview questions...........
3. Student writes immigration profile using information...
4. Profile includes qualification factors.............................
5. Paragraph explains reason for interview selection.......
6. Description of individual’s applicability..........................
7. Description of individual’s gifts and experiences..........
8. Categorization of immigration for the applicant...........
9. Description of benefits of being accepted to Canada.....
10. Proposal of changes to the current Point System..........
11. Evaluating the equitability of points per factor.............
12. Grammar and presentation skills..................................
Overall Mark /48
Comments:
37

Human Systems Summative Quiz
Total: /30
Part A: Multiple Choice /10
Choose the answer that is most correct. Answer every question.
1) The formula to find the population density of a given area is:
a) The total population divided by km
b) The km divided by the population
c) The total population divided by the km squared
d) The km squared divided by the population
2) Dependency load refers to:
a) The number of people in a country that can support themselves
b) The elderly population who cannot support themselves
c) The number of people in a country that cannot support themselves
d) The number of people on welfare
3) A country that has more young people is likely to experience ________ in population.
a) Growth
b) Revolution
c) No change
d) Decline
4) Population Pyramids show the distribution of what two factors?
a) Sex and colour
b) Age and income
c) Sex and income
38
d) Age and sex
5) Compared to the majority of other countries in the world, Canada’s population density is:
a) High
b) Low
c) Average
d) Not relevant because Canada is a developed country
6) The most populated province in Canada is:
a) British Columbia
b) Quebec
c) Alberta
d) Ontario
7) Refugee class immigrants require ____ number of points on the Point System test:
a) 67
b) 35
c) No points necessary
d) At least 25
8) Physical imprints include:
a) Architecture
b) Language
c) Restaurants
d) Both A and C
9) The Point System takes into consideration all but one of the following factors:
a) Education
b) Physical Appearance
c) Work Experience
39

d) Family relations in Canada
10) Immigration to Canada increased during (or after) the time period of:
a) Great Depression
b) The Irish Potato Famine
c) Worldwide influenza
d) During WW1 and WW2
Part B: True or False /5
1) Today immigrants are more likely to locate in large cities rather than rural areas. ___T__
2) The policy of multicultural promotes assimilation. __F___
3) Cultural enclaves exist in a variety of regions across Canada. __T__
4) Populations increase when the number of deaths is greater than the number of births in a country. __F___
5) Intervening Obstacles support a person’s decision to immigrate. __F__
Part C: Short Answer /15
Answer three (3) of the following four (4) questions. Each question is worth 5 marks.
1. The total population of the Netherlands is 15 981 000 and the area is 41 000 km squared. Calculate the population density of the Netherlands. How would you compare this number to the population density of Canada? What problems might the Netherlands foresee due to this population density?
2. The population pyramid below represents Germany during the war in 1946. What do you notice in particular? How can the influence of the war help to explain the data shown?
40

3. Where do the majority of immigrants settle in Canada? What important factors influence an immigrant’s decision to live in a certain area? Provide specific examples.
4. What are cultural imprints? Provide specific examples of the imprints of various cultural groups that exist across Canada.
FINAL OVERVIEW
Literacy Strategies
Global Literacy: Students will understand and compare Canada’s population patterns, history of settlement, and cultural diversity to those of other countries across the world and consider the implications of these patterns to their own lives.
Technological Literacy: Students will be capable of using Excel programs to generate tables and population pyramids as well as the Glogster program to represent various cultural enclaves. Students will use calculators to input calculations, and various internet databases to conduct research.
Cultural Literacy: Students will analyze the cultural enclaves that exist around Canada, as well as settlement patterns as they pertain to these cultural groups. Students will examine the cultural imprints of various enclaves including their social and physical influences on surrounding communities and the larger multicultural identity of Canada.
Historical Literacy: Students will examine Canada’s immigration history, and how this history corresponds to the establishment of Canada’s identity as an independent, thriving and multicultural nation. Students will interview family members or friends to highlight the history of their immigration to and settlement in Canada.
Examples of Differentiated Instruction
Writing Notes
Small group and class discussions
Think/Pair Share
Creating visual diagrams (e.g., timeline)
Computer Activities
Mapping
41

Creating Charts and Graphs
Personal Reflections
Slideshow Presentations
Introductory Games (“Sit Down If...”)
Conducting interviews
Researching and gathering information
Incorporating the use of Exemplars
Examples of Individual Learning Activities
Silent Reading
Completing worksheets
Personal reflections
Mapping
Researching and gathering information
Conducting interviews
Analyzing the current Point System
Drawing conclusions based on a range of data
Plotting statistical information
Creating visual diagrams (charts, timeline)
Analyze case studies
Conducting a mini-census
Exit cards
Examples of Cooperative Learning Activities
Think/Pair/Share discussions
Small group and class discussions
Analyzing case studies
42

Writing and examining case profiles
Examining the Point System Qualification Test
Population Pyramid Activity
Analyzing population pyramids
Researching cultural enclaves
Cultural Group Assignment
In-class Immigration Activity
43