8th croatian-hungarian and 19th hungarian geomathematical...
TRANSCRIPT
8th HR-HU and 19th HU geomathematical congress 26th-28th May,2016
8th Croatian-Hungarian and 19th Hungarian geomathematical
congress
Geomathematics - present and future of geological modelling
Editors:
Marko Cvetkovic, Kristina Novak Zelenika, Janina Horváth andIstván Gábor Hatvani
ISBN 978-953-59036-1-1
Trakoscan, 26-28 May, 2016
T r a k o s c a n , C r o a t i a , 2 6 - 2 8 M a y , 2 0 1 61
8th HR-HU and 19th HU geomathematical congress 26th-28th May,2016
Impressum
Publisher: Croatian Geological Society, 2016
For publisher: Lilit Cota, president of the Croatian Geological Society
Editors: Marko Cvetkovic, Kristina Novak Zelenika, Janina Horváth and István
Gábor Hatvani
Circulation: 50 copies
Copy and distribution: Denona d.o.o., Zagreb
ISBN 978-953-59036-1-1
Note
The content of proceedings has not been passed English proof reading by native speaker, and
that is why solely the authors are responsible for the quality of language usage.
T r a k o s c a n , C r o a t i a , 2 6 - 2 8 M a y , 2 0 1 62
8th HR-HU and 19th HU geomathematical congress 26th-28th May,2016
Organizers
Croatian Geological Society (Hrvatsko geolosko drustvo)http://www.geologija.hr
Geomathematical Section (Geomatematicki odsjek)http://www.geologija.hr/geomat.php
Hungarian Geological Society (Magyarhoni Földtani Társulat)http://www.foldtan.hu/
Geomathematical Section (Geomatematikai Szakosztály)https: //www.smartportal. hu/
Faculty of Mining, Geology and Petroleum Engineering (Rudarsko-geolosko-naftni fakultet)
http://www.rgn.hr
RGNF
SPONSORS
T r a k o s c a n , C r o a t i a , 2 6 - 2 8 M a y , 2 0 1 63

8th HR-HU and 19th HU geomathematical congress 26th-28th May,2016
Committees
Organizing Committee
Ph.D. Marko Cvetkovic, Assistant Professor (chairman, University of Zagreb, HR)
PhD. Janina Horváth (Univ. Szeged, HU)
PhD. Kristina Novak Zelenika (INA, HR)
Scientific Committee
Ph.D. Janos Geiger (chairman, Univ. Szeged, HU)
Ph.D. Marko Cvetkovic, Assistant Professor (chairman, University of Zagreb, HR)
Ph.D. Janina Horváth (Univ. Szeged, HU)
Ph.D. Kristina Novak Zelenika (INA, HR)
Ph.D. István Gábor Hatvani (MTA Research Centre for Astronomy and
Earth Sciences, HU)
T r a k o s c a n , C r o a t i a , 2 6 - 2 8 M a y , 2 0 1 65
8th HR-HU and 19th HU geomathematical congress 26th-28th May,2016
CONTENTS
1. Mihály Apró: 3D modelling of a Lower-Pannonian hydrocarbon reservoir
sandstone group.....................................................................................11
2. Szabolcs Borka, Janina Horváth and János Geiger: Geometrical parametrization of
structural elements of deep-water clastic depositional systems: a case study
from Pannonian-basin............................................................................19
3. Marko Cvetkovic: Application of Standard Deviation Trends on Well Log Data in
Miocene, Pliocene and Pleistocene Sediments for Definition of Well Log Markers
in Sava Depression, Pannonian Basin..................................................... 27
4. István Gábor Hatvani, Adrienne Clement, János Korponai and József Kovács: The effect
of climatic parameters on the nutrient cycle in the Kis-Balaton Water Protection
System on a daily scale determined by wavelet coherence analysis.......35
5. András Gulácsi: Setting up a cost-effective agricultural drought monitoring system
using spectral indices derived from MODIS satellite images in Hungary . 43
6. Janina Horváth, Szabolcs Borka, János Geiger: Optimisation of cluster facies - why,
how and how much cluster?................................................................... 51
7. Maja Hren, Marko Gacina and Domagoj Vulin: Coupling reservoir permeability with
granulometric heterogeneity using programming language R ................ 59
8. Noémi Jakab: Connectivity metrics and density-based clustering for uncertainty
assessment ........................................................................................... 67
9. Piroska Kassai and István Sisák: Spatial structure analysis of a geological map for
digital soil mapping purposes.................................................................75
10. Péter János Koroncz, Ferenc Fedor: Experimental investigation of stress-dependent
petrophysical behaviour of reservoir rocks............................................. 83
11. Zorán Kovac, Kresimir Pavlic and Zorán Nakic: Influence of dissolved oxygen on
nitrates concentration in Zagreb aquifer................................................ 89
12. Ana Majstorovic Busic. Mohamad Alzenab and Kristina Novak Zelenika: Applications of
different mapping methods for sandstone distribution in south-eastern part of
Sava Depression ....................................................................................97
13. Kristina Novak Zelenika, Renata Vidacek, Tomislav Ilijas and Petar Pa vie: Petrophysical
modelling of the Upper Pannonian reservoirs in Sava Depression.......... 105
14. Kresimir Pavlic and Zorán Kovac: Trend analysis of mean and high river flows from
stations in karstic Kupa catchment......................................................... 113
15. Luka Prsa and Mirela Ferencak: New approach in depositional environment
reconstruction - Environmental Coefficient (Ce).................................... 121
T r a k o s c a n , C r o a t i a , 2 6 - 2 8 M a y , 2 0 1 67

26th-28th May,2016
16. David Rukavina, Bojan Matos, Bruno Tomljenovic and Bruno Saftic: Neotectonic active
faults in the Eastern part of Sava Depression: Implications to tectonic evolution
based on 2D seismic data and 3D subsurface structural modelling......... 129
17. Viktor Volford: Siliciclastic coasts - Problems and possible solutions related to
modeling of these extreme heterogenic environments........................... 137
8th HR-HU and 19th HU geomathematical congress
T r a k o s c a n , C r o a t i a , 2 6 - 2 8 M a y , 2 0 1 68
26th-28th May2016
Optimisation of cluster facies - why, how and how much cluster?
Janina Horváth1, Szabolcs Borka1, János Geiger1 University of Szeged, Department of Geology and Paleontology, Egyetem u. 2-6, 6722 Szeged,Hungary, [email protected] studies classify or cluster clastic depositional datasets into lithofacies using graphical, multivariate statistical or neural network techniques. Each has able to handle large data set or great number of parameters therefore these multivariate statistical approaches are widely used in clastic sedimentology, and within that facies analysis. Furthermore, most of the techniques which try to separate more or less homogeneous subset can be subjective. This subjectivity raises several questions about the significance and confidence of clustering.The goal of this study is to optimize clustering. This technique is able to describe sedimentary or lithological facies through common characteristics. Data transformation like Box-Cox transformation and principal component analysis (PCA) are able to improve clustering combined with artificial neural network (ANN). Using PCA helped us to reduce the redundancy of information coming from certain variables. This was corroborated by the correlation coefficients of the applied properties (porosity, permeability, sand content and shale content). Evaluation of the optimal number of clusters was also important. In this study, certain statistical tests were able to explain the variance of the dataset. F'test and "leave-one-out" classification were applied to determine stable clusters and optimal numbers of clusters. This approach was applied the clastic depositional data from a Miocene hydrocarbon reservoir (Algyő field, Hungary) to demonstrate the fidelity of the clustering method yielding five optimum cluster facies. These clusters are supported by both statistical tests and geological observations as well. These clusters represent lithological characteristics within a (delta fed) submarine fan system in the Pannonian-basin.Key words: cluster analysis, data transformation, optimal number of cluster, submarine fan systemINTRODUCTION
The case study is located in a deep subbasin of the Pannonian-basin in the Great
Hungarian Plain. According to Grund and Geiger (2011) and Borka (2016) the
T r a k o s c a n , C r o a t i a , 2 6 - 2 8 M a y , 2 0 1 643

26th-28th May, 2016
study area was characterized as sequences of prodelta submarine fan. The
analysis focused on the determination of lithology based on four variables
coming from interpreted logs (porosity, permeability, sand content and shale
content).
The analysis focused on the determination of lithology using separation of data
space technique. There are many multivariate techniques (graphical, statistical,
neural network methods) to separate data set and define subsets. These are
based on genetically similar units that are very close in the multidimensional
property space. In this case a neural network clustering was applied which
method was presented in several papers (e.g. Horváth, 2015).
Core samples was also available from one well which included about continuous
35m. The core analysis was presented by Borka (2016). According to the core
analysis a part of a typical mixed sand-mud submarine fan complex with quasi-
inactive parts (zone of thin sand sheets and overbank), channelized lobes
(persistent sandstones in them may denote distributary channels) and a main
depositional channel was revealed. However, due to the low number of core
samples it is difficult to extend the lithology information to the whole area which
contains 141 wells. The core samples were kind of finger-posts in the
interpretation of cluster results to define lithofacies. Nonetheless, it was
complicated to determine the adequate number of clusters since the most
essential parameters of clustering algorithms is to determine the number of
clusters and the validity of clustering. Clustering is an unsupervised technique
so the researcher has only little or no information about cluster number. At the
same time, the number of cluster is a required parameter so this is a general
problem and old as cluster analysis itself. Of course, geological knowledge about
the field and information about the core samples can give a rough number of
types as clusters. In addition, questions may arise: has the method ability to
segregate all types in the property space or not, is the created subset adequately
homogeneous or not? The most common problem if we separate too many -
however homogeneous - groups, is it is not possible to label all of them
geologically. As a contrary, if we have small number of clusters, it can be
8th HR-HU and 19th HU geomathematical congress
T r a k o s c a n , C r o a t i a , 2 6 - 2 8 M a y , 2 0 1 644
26th-28th May, 2016
relatively too heterogeneous and in this case it is hard to define them
geologically, as well.
A number of authors have suggested various indexes to solve these problems
but it means that usually the researcher is confronted with crucial decisions such
as choosing the appropriate clustering method and selecting the number of
clusters in the final solution. Numerous strategies have been proposed to find
the right number of clusters and such measures (indexes) have a long history in
the literature. The study focused on to determine the right number of clusters
and to analyse some suggested sum of squares indexes (called WB indexes).
The "leave-one out" (LOO) classification method was used in the discriminant
function analysis (DFA) as cross validation (Asante and Kreamer, 2015).
8th HR-HU and 19th HU geomathematical congress
METHODS
Neural network technique was used to determine the cluster facies based on the
four mentioned variables. The applied dataset omitted the impermeable units
and variables.
Usually clustering does not require normal transformation but most clustering
algorithms are sensitive to the input parameters and to the structure of data
sets. If good structure exists for a variable a transformed data which can
approximate the symmetric distribution could be more efficient. It should be
close to symmetry prior to entering cluster analysis (Tempi et al. 2006).
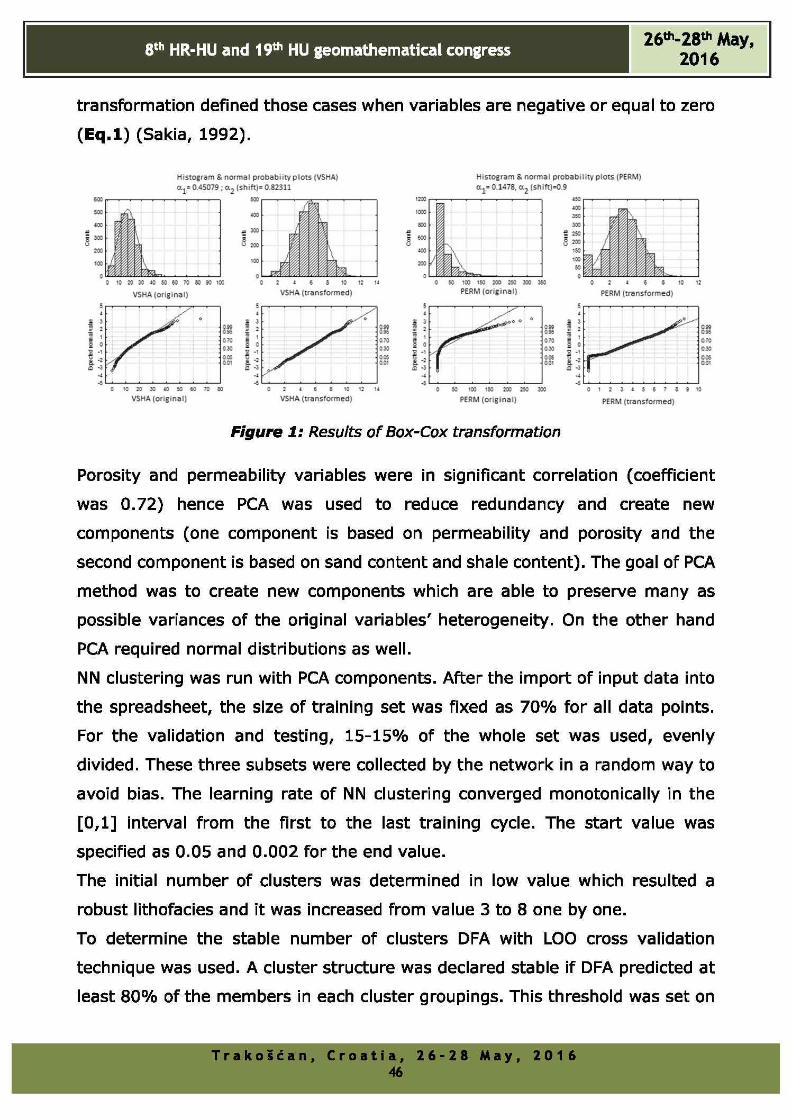
Significant skewness can be measured in the distribution of variables especially
shale content and permeability (Figure 1 base on Eq.l.) On the other hand
principal component analysis (PCA) was applied as pre-process of clustering
which also requires normal distribution.
y = x a(ïislîlzl a „ 0
alog(x + cc2) a = 0
Eq.l
Box-Cox transformations (Box and Cox, 1964) of all single variables do not
guarantee symmetry distribution, but more closeness to them (Asante and
Kreamer, 2015; Tempi et al., 2006). The applied transformation is modified the
family of power transformation by Box and Cox (1964). This modified power
T r a k o s c a n , C r o a t i a , 2 6 - 2 8 M a y , 2 0 1 645
26th-28th May, 2016
transformation defined those cases when variables are negative or equal to zero
(Eq .l) (Sakia, 1992).
8th HR-HU and 19th HU geomathematical congress
Histogram & normal probabiity plots (VSHA) o.j= 0.45079; 0-2 (shift)» 0.82311
VSHA (original) VSHA (transformed)
Histogram & normal probability plots (PERM) Ctj= 0.1478, o.j (sh ift)=0.9
0 SO 1M 150 ÎCO ISO 303 550PERM (original) PERM (transformed)
PERM (transformed)
Figure 1: Results of Box-Cox transformation
Porosity and permeability variables were in significant correlation (coefficient
was 0.72) hence PCA was used to reduce redundancy and create new
components (one component is based on permeability and porosity and the
second component is based on sand content and shale content). The goal of PCA
method was to create new components which are able to preserve many as
possible variances of the original variables' heterogeneity. On the other hand
PCA required normal distributions as well.
NN clustering was run with PCA components. After the import of input data into
the spreadsheet, the size of training set was fixed as 70% for all data points.
For the validation and testing, 15-15% of the whole set was used, evenly
divided. These three subsets were collected by the network in a random way to
avoid bias. The learning rate of NN clustering converged monotonically in the
[0,1] interval from the first to the last training cycle. The start value was
specified as 0.05 and 0.002 for the end value.
The initial number of clusters was determined in low value which resulted a
robust lithofacies and it was increased from value 3 to 8 one by one.
To determine the stable number of clusters DFA with LOO cross validation
technique was used. A cluster structure was declared stable if DFA predicted at
least 80% of the members in each cluster groupings. This threshold was set on
T r a k o s c a n , C r o a t i a , 2 6 - 2 8 M a y , 2 0 1 646
26th-28th May, 2016
practical observations. Overall cross-validated results for each clustering results
of stable clusters range from 88.0-91.9%.
To select the optimal number of clusters in the final solution, statistics test based
on sum of squares was applied. Since a single statistics test method cannot be
depended upon, more methods were used (Gordon, 1999 in Asante and Kreamer
2015). There are several suggested indexes depending on the sum of squares
(Eq.2-5):
Hartigan (1975): Ht= l o g f ^ Eq.2
Explained variance: ETA2 = sj m Eq.3sst
Proportional reduction of error: PRE% = Eq.4
F-Max statistics: F -M ax = Eq.5SSw(K )/(n -K ) ^
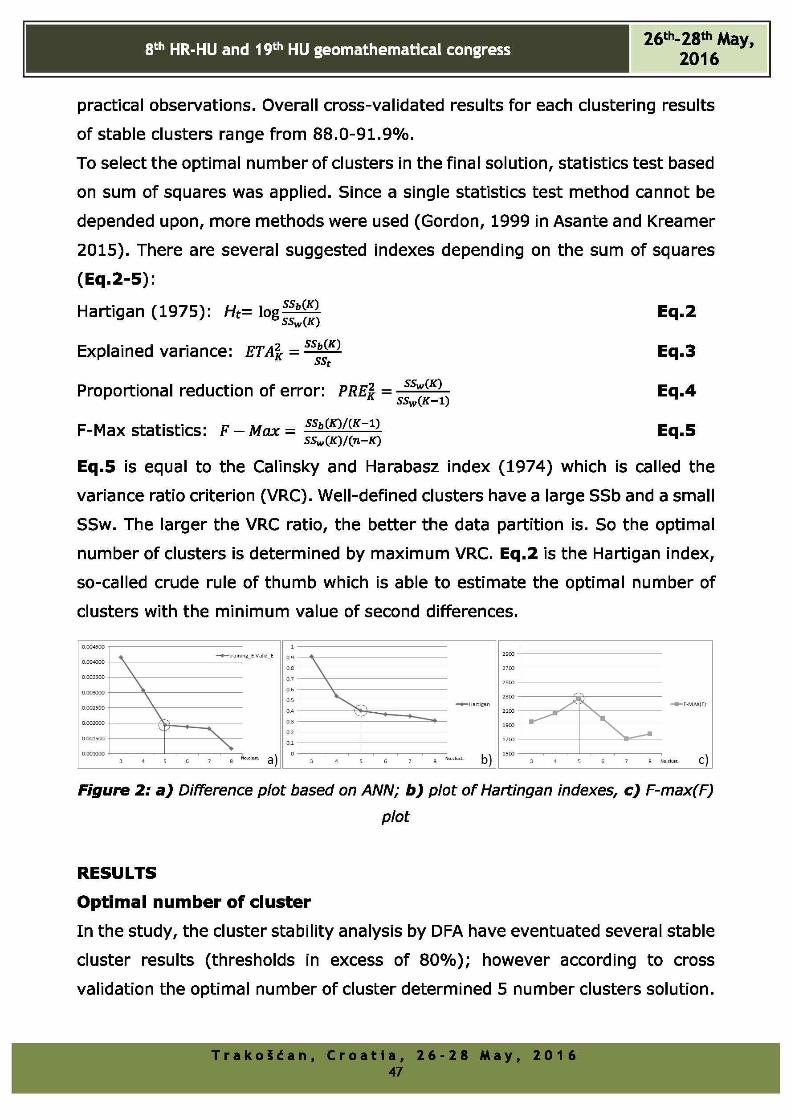
Eq.5 is equal to the Calinsky and Harabasz index (1974) which is called the
variance ratio criterion (VRC). Well-defined clusters have a large SSb and a small
SSw. The larger the VRC ratio, the better the data partition is. So the optimal
number of clusters is determined by maximum VRC. Eq.2 is the Hartigan index,
so-called crude rule of thumb which is able to estimate the optimal number of
clusters with the minimum value of second differences.
8th HR-HU and 19th HU geomathematical congress
Figure 2: a) Difference plot based on ANN; b) plot of Hartingan indexes, c) F-max(F)
plot
RESULTS
Optimal number of cluster
In the study, the cluster stability analysis by DFA have eventuated several stable
cluster results (thresholds in excess of 80%); however according to cross
validation the optimal number of cluster determined 5 number clusters solution.
T r a k o S é a n , C r o a t i a , 2 6 - 2 8 M a y , 2 0 1 647
26th-28th May, 2016
Based on LOO 91.9% of cross-validated grouped cases are correctly classified.
The analyses of differences reduction between training error (Terror) and
validation error (Verror) showed the same optimum as well. The difference-plot
(Figure 2-a) reached the elbow point at/in case of five cluster solutions. In the
practice the error rate was acceptable if it was relatively low and the training-
test-validation error rate approximated to each other. In addition, the plot of
Hartigan values (Figure 2-b) or F-max(F) values (Figure 2-c) determined
similar 'best fit' in case of five cluser solutions.
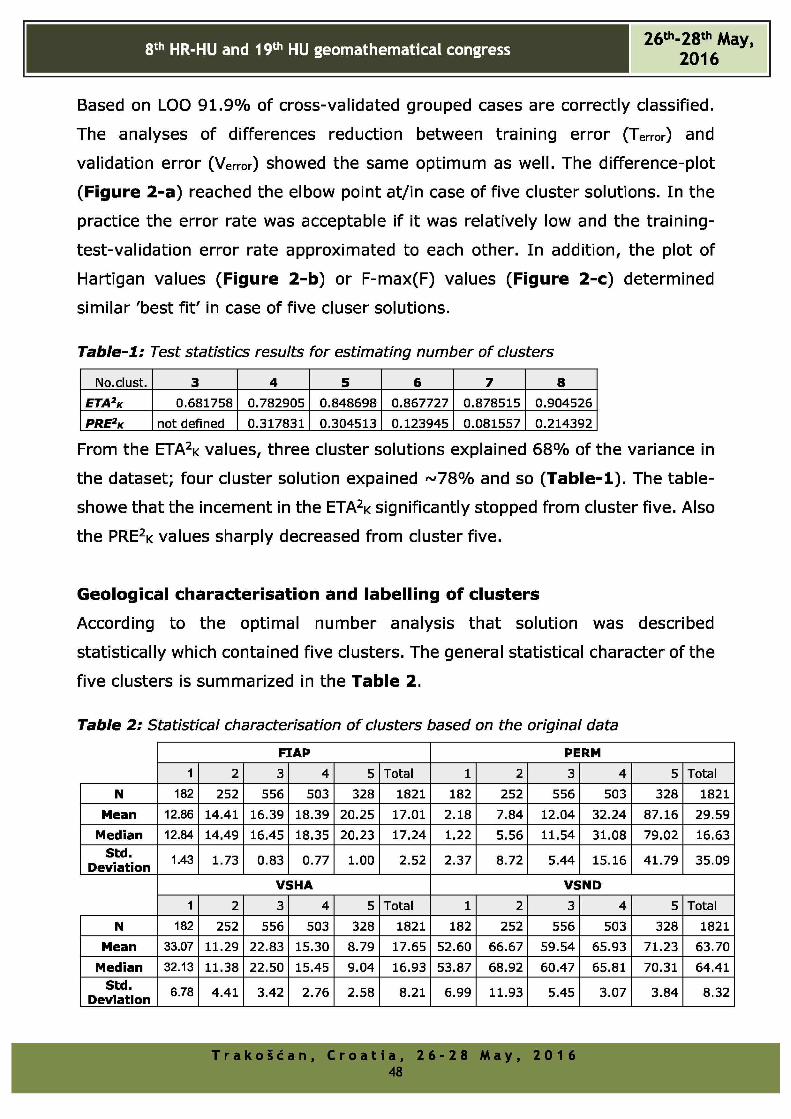
Table-1: Test statistics results for estimating number of clusters
No.dust. 3 4 5 6 7 8ETA2k 0.681758 0.782905 0.848698 0.867727 0.878515 0.904526
PRE2k not defined 0.317831 0.304513 0.123945 0.081557 0.214392
From the ETA2k values, three cluster solutions explained 68% of the variance in
the dataset; four cluster solution expained ~78% and so (Table-1). The table-
showe that the incement in the ETA2« significantly stopped from cluster five. Also
the PRE2« values sharply decreased from cluster five.
8th HR-HU and 19th HU geomathematical congress
Geological characterisation and labelling of clusters
According to the optimal number analysis that solution was described
statistically which contained five clusters. The general statistical character of the
five clusters is summarized in the Table 2.
Table 2: Statistical characterisation of clusters based on the original data
FIAP PERM
1 2 3 4 5 Total 1 2 3 4 5 Total
N 182 252 556 503 328 1821 182 252 556 503 328 1821
Mean 12.86 14.41 16.39 18.39 20.25 17.01 2.18 7.84 12.04 32.24 87.16 29.59
Median 12.84 14.49 16.45 18.35 20.23 17.24 1.22 5.56 11.54 31.08 79.02 16.63Std.
Deviation1.43 1.73 0.83 0.77 1.00 2.52 2.37 8.72 5.44 15.16 41.79 35.09
VSHA VSND
1 2 3 4 5 Total 1 2 3 4 5 Total
N 182 252 556 503 328 1821 182 252 556 503 328 1821
Mean 33.07 11.29 22.83 15.30 8.79 17.65 52.60 66.67 59.54 65.93 71.23 63.70
Median 32.13 11.38 22.50 15.45 9.04 16.93 53.87 68.92 60.47 65.81 70.31 64.41Std.
Deviation6.78 4.41 3.42 2.76 2.58 8.21 6.99 11.93 5.45 3.07 3.84 8.32
T r a k o s c a n , C r o a t i a , 2 6 - 2 8 M a y , 2 0 1 648
8th HR-HU and 19th HU geomathematical congress 26th-28 th May,2016
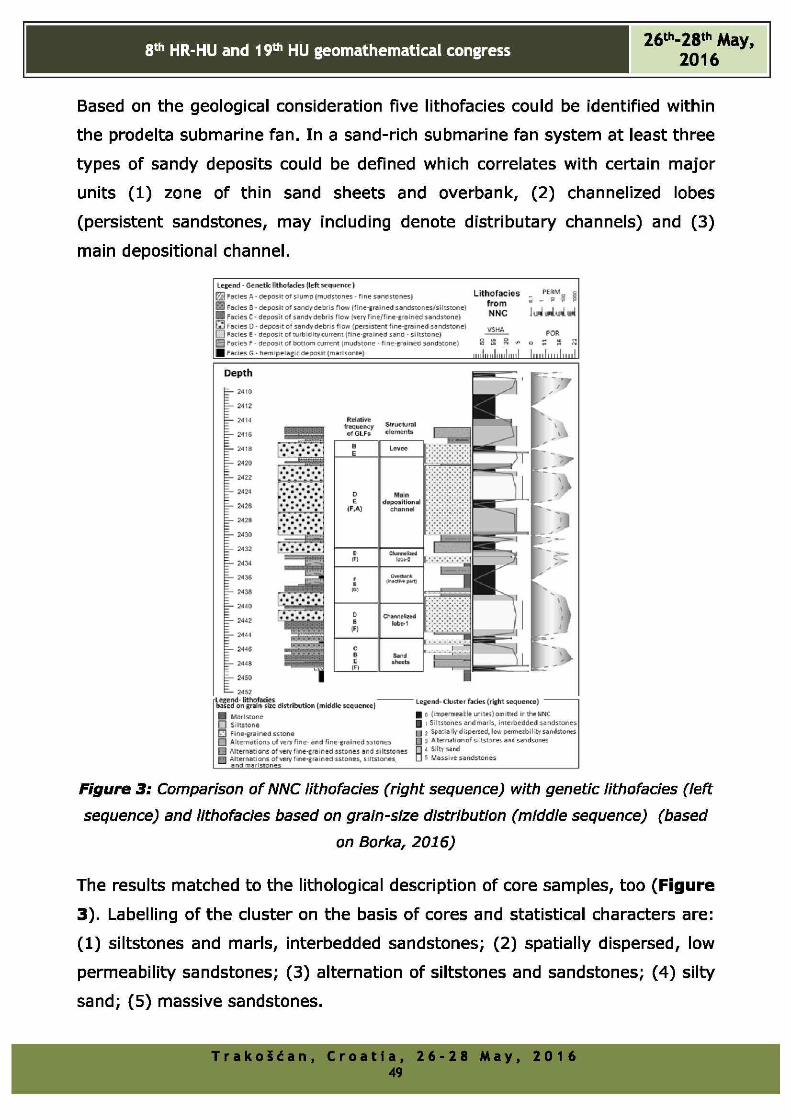
Based on the geological consideration five lithofacies could be identified within
the prodelta submarine fan. In a sand-rich submarine fan system at least three
types of sandy deposits could be defined which correlates with certain major
units (1) zone of thin sand sheets and overbank, (2) channelized lobes
(persistent sandstones, may including denote distributary channels) and (3)
main depositional channel.
Legend - Genetic lithofacies (left sequence)m Facies fi - deposit of slump (mudstones - fine sandstones)E*C Facies B - deposit of sandydebris flow (fine-grained sandstones/siltstone) ■ Facies C- deposit of sandy debris flow (very fine/fine-grained sandstone)□ Facies D - deposit of sandydebris flow (persistent fine-grained sandstone)□ Facies E- deposit of turbidity current (fine-grained sand -siltstone)Q Facies F - deposit of bottom current (mudstone • fine-grained sandstone) H Facies G - bemipelagic deposit (marlsonte)
LithofaciesfromNNC
VS HA
6 - S S SM ufM J
■ . ‘ i i c ' i
Relativefrequency Structural of GLFs éléments
Depth
2410
2412
2414
241$
2418
2420
2422
2424
2426
2428
2430
2432
2434
2436
2438
2440
2442
2444
244$
2448
2450
2462legend- lithofacies --------------based on grain-size distribution (middle sequence)■ Maristone□ Siltstonen Fine-grained sstone□ Alternations of very fine-and fine-grained sstones□ Alternations of very fine-grained sstones and SiltstonesFI Alternations of very fine-grained sstones. siltstones ___ and marlstones_______________________________
BE
Levee
O MainE
<F.A) charnel
D(F| lslw-3 |
£ (hiatflv«* pan)(O)
D Channelized
(FJ
C8€(F)
Vk
>
I
l
Legend-Cluster fades (right sequence)
| a (impermeable urltes) omitted ir the NNC P Siltstones and marls, interbedded sandstones □ i Spa:iallydi;pirsed.lowc<rmetbiliersandstonts p 3 Aternationof si tstures and caidsones
B 4 Silty sand5 Massive sandstones
Figure 3: Comparison of NNC lithofacies (right sequence) with genetic lithofacies (left
sequence) and lithofacies based on grain-size distribution (middle sequence) (based
on Borka, 2016)
The results matched to the lithological description of core samples, too (Figure
3). Labelling of the cluster on the basis of cores and statistical characters are:
(1) siltstones and marls, interbedded sandstones; (2) spatially dispersed, low
permeability sandstones; (3) alternation of siltstones and sandstones; (4) silty
sand; (5) massive sandstones.
T r a k o s c a n , C r o a t i a , 2 6 - 2 8 M a y , 2 0 1 649
26th-28th May, 2016
SUMMARY
The transformed variables by Box-Cox and PCA process reduced impact of
skewness and the redundancy in variables to avoid misclassification. The NN
clustering with the final settings was validated using DFA LOO method. Members
in each cluster groupings were validated by over 80% prediction. Evaluation of
optimal cluster solution relied on more WB indexes. All of them determined the
"best fit clustering" with "five number of clusters" solution. The separated
clusters were suitable to identify the lithofacies within the study area which
presents a sand-rich, delta fed submarine fan system. These facies are relating
to the lithological units described by Borka (2016). These selected groups will
be the basis of the 3D facies model and to analyse the spatial continuity of
petrophysical properties within the single facies.
REFERENCES
ASANTE, J. KREAMER, D. (2015): A New Approach to Identify Recharge Areas in the
Lower Virgin River Basin and Surrounding Basins by Multivariate Statistics.
Mathematical Geosciences, 47/7, 819-842.
BORKA, SZ. (2016): Markov chains and entropy tests in genetic-based lithofacies
analysis of deep-water clastic depositional systems. Open Geosci., 8, 45-51.
BOX, G.E.P. and COX, D.R. (1964): An analysis of transformations. Journal of the Royal
Statistical Society, Series B, 26, 211-252.
CALINSKI, T., and HARABASZ, J. (1974): A dendrite method for cluster analysis.
Communications in Statistics, 3/1, 1-27.
GRUND, SZ., and GEIGER, J. (2011): Sedimentologic modelling of the Ap-13
hydrocarbon reservoir. Central European Geology, 54/4, 327-344.
HARTIGAN, J. A. (1975): Clustering Algorithms. J. Wiley and Sons, New York, p 351.
HORVÁTH, J. (2015): Depositional facies analysis in clastic sedimentary environments
based on neural network clustering and probabilistic extension (Phd dissertation),
University of Szeged, 118 p.
TEMPL, M., FILZMOSER P., REIMANN C. (2006): Cluster analysis applied to regional
geochemical Data: problems and possibilities, Research report, CS-2006-5.
SAKIA, R. M. (1992): The Box-Cox transformation technique: a review. The Statistician
41, 169-178.
8th HR-HU and 19th HU geomathematical congress
T r a k o s c a n , C r o a t i a , 2 6 - 2 8 M a y , 2 0 1 650