8x8 solutions - vcc analytics datasheet
TRANSCRIPT
DATASHEETVirtual Contact Centre Analytics
Get Answers to Critical Questions
• Do you have queues that are
experiencing spikes in call volume?
• Where are the overflow calls going?
• How have handle times changed during
the course of the day?
• Do you have an increase in short calls
and you want to find the score?
• At what call volume threshold do callers
start hanging up?
8x8 Virtual Contact Centre Analytics
How can you increase the value of every customer interaction? Is your contact centre meeting critical performance metrics? Now you can tell.
8x8 Virtual Contact Centre Analytics provides industry-leading insights about the
performance of your contact centre. More than just data, 8x8 Analytics brings powerful
graphical tools that reveal actionable business insights.
See how your customers are being served across all channels and in different areas of
the business, and learn how your agents are performing against critical performance
metrics.
Go Beyond Data. Get the Insights That Matter.
DATASHEET
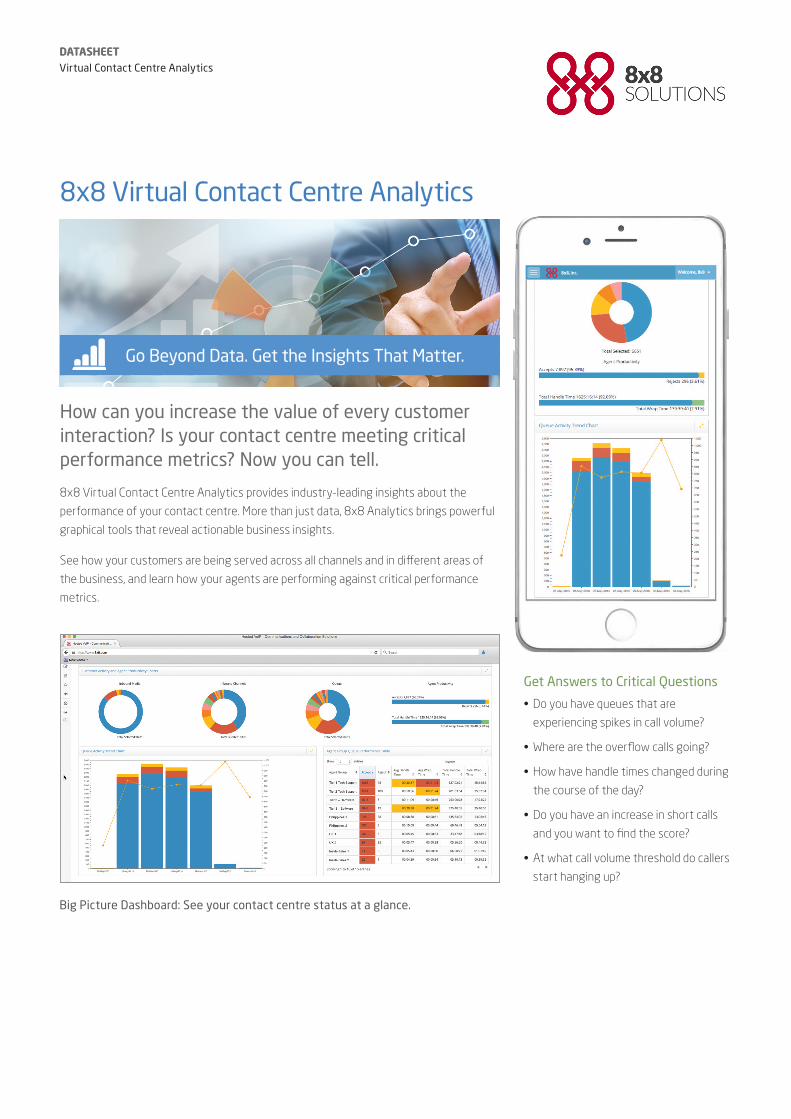
Big Picture Dashboard: See your contact centre status at a glance.
DATASHEETVirtual Contact Centre Analytics
Transform Contact Centre PerformanceVirtual Contact Centre Analytics helps you:
• Quickly identify significant trends in how you are serving your customers with “at a glance” visualisations.
• Filter out the noise and focus on the things that are impacting your customers’ experiences.
• Identify high performing agents and those who need coaching or assistance.
• Detect performance anomalies to catch issues before they become widespread.
• Stay on top of your team’s performance, no matter where they are.
• Create custom reports that help you see what is important to your business.
Dashboards for Instant InsightsOur highly visual and intuitive dashboards give you instant understanding of call centre performance. Powerful tools show you what is
going well and where you need to focus resources to improve your customer experience.
• Big Picture Dashboard: See how customer contacts are interacting across all media and queues. Instantly understand how many
calls are being handled and how many are being abandoned.
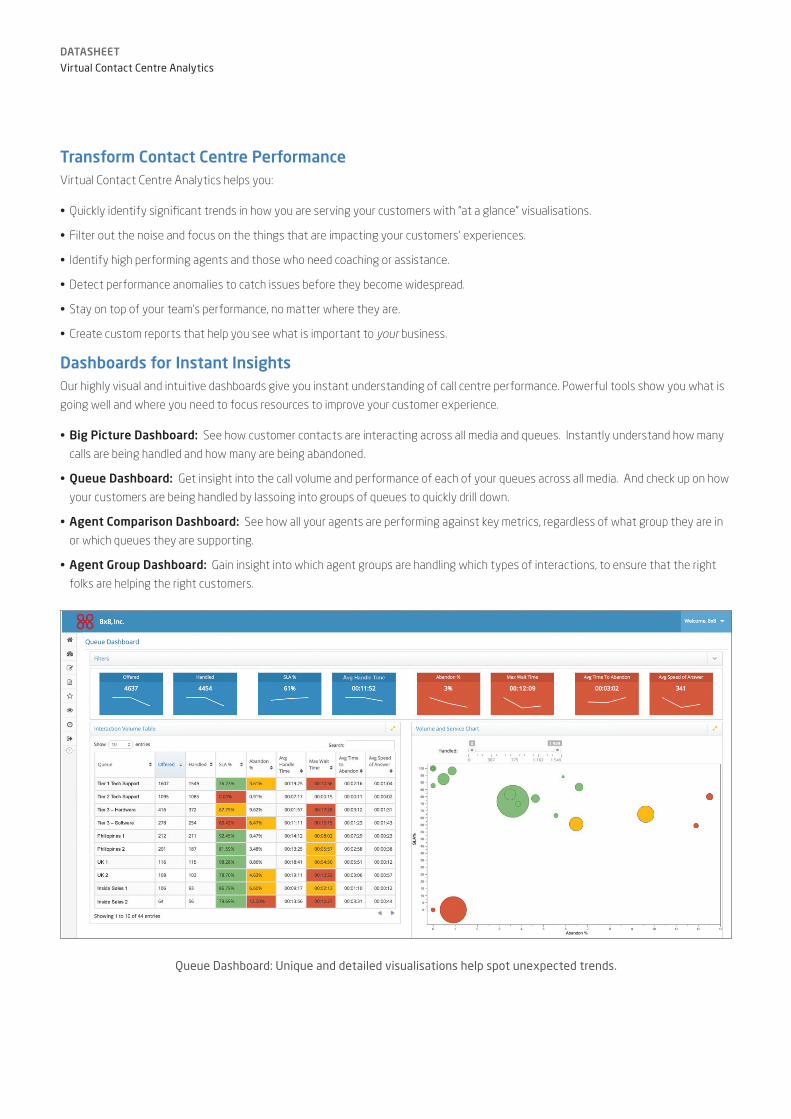
• Queue Dashboard: Get insight into the call volume and performance of each of your queues across all media. And check up on how
your customers are being handled by lassoing into groups of queues to quickly drill down.
• Agent Comparison Dashboard: See how all your agents are performing against key metrics, regardless of what group they are in
or which queues they are supporting.
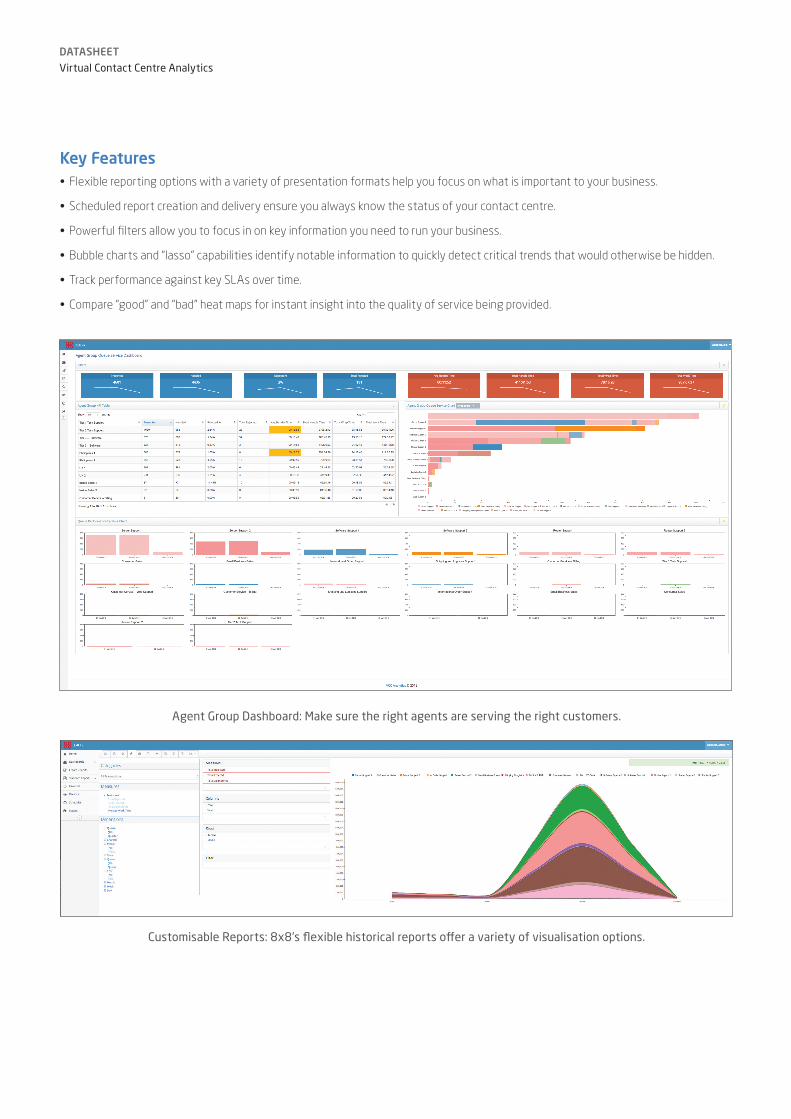
• Agent Group Dashboard: Gain insight into which agent groups are handling which types of interactions, to ensure that the right
folks are helping the right customers.
Queue Dashboard: Unique and detailed visualisations help spot unexpected trends.
DATASHEETVirtual Contact Centre Analytics
Key Features• Flexible reporting options with a variety of presentation formats help you focus on what is important to your business.
• Scheduled report creation and delivery ensure you always know the status of your contact centre.
• Powerful filters allow you to focus in on key information you need to run your business.
• Bubble charts and “lasso” capabilities identify notable information to quickly detect critical trends that would otherwise be hidden.
• Track performance against key SLAs over time.
• Compare “good” and “bad” heat maps for instant insight into the quality of service being provided.
Agent Group Dashboard: Make sure the right agents are serving the right customers.
Customisable Reports: 8x8’s flexible historical reports offer a variety of visualisation options.
DATASHEETVirtual Contact Centre Analytics
NASDAQ: EGHTwww.8x8.com
© 2015. The 8x8 Solutions logo is a registered trademark of 8x8, Inc. 8x8, Inc. is a publicly traded company.
Reports for Managing on the GoSchedule reports to be delivered to you when you want them, with the information you need, in the format you want. Reports let
you check in and know how things are running instantly. Get alerts when key metrics are out of bounds. Take your reports with you.
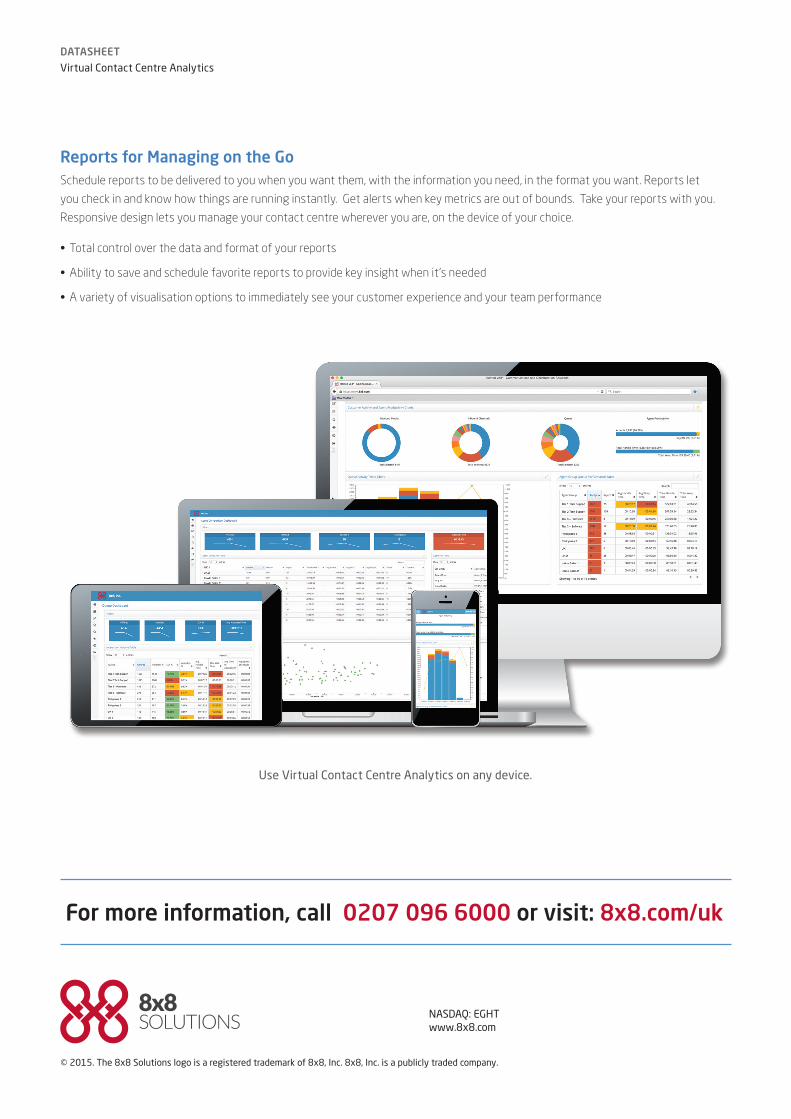
Responsive design lets you manage your contact centre wherever you are, on the device of your choice.
• Total control over the data and format of your reports
• Ability to save and schedule favorite reports to provide key insight when it’s needed
• A variety of visualisation options to immediately see your customer experience and your team performance
For more information, call 0207 096 6000 or visit: 8x8.com/uk
Use Virtual Contact Centre Analytics on any device.