9 earthquakes hazard analysis for new york city hazard ... · 9) earthquakes hazard analysis for...
TRANSCRIPT

New York City Natural Hazard Mitigation Plan March 2009
Section III: Natural Hazard Risk Assessment Page 102 of 179
9) Earthquakes Hazard Analysis for New York City
a) Hazard Profile
i) Hazard Description An earthquake is a sudden, rapid shaking of the earth caused by the breaking and shifting of rock beneath the earth’s surface. Most earthquakes originate from faults, or a break in the rocks that make up the earth’s crust, along which rocks on either side that have moved past each other. As the rocks move past each other, they occasionally stick, causing a gradual buildup of energy or strain. Eventually, this accumulated energy becomes so great that it is abruptly released in the form of seismic waves, which travel away from the earthquake’s source (or focus) deep underground, causing the shaking (ground acceleration) at the earth’s surface is known as an earthquake. The point on the earth’s surface that is directly above the focus is the epicenter. Ground acceleration caused by earthquakes has the potential to destroy buildings and infrastructure and cause loss of life. Aftershocks are typically smaller than the main shock, and can continue over a period of weeks, months, or years after the initial earthquake is felt. In addition to the effects of ground acceleration, earthquakes can also cause landslides and liquefaction under certain conditions. Liquefaction occurs when unconsolidated, saturated soils exhibit fluid-like properties due to intense shaking and vibrations experienced during an earthquake. Together, ground shaking, landslides, and liquefaction can damage or destroy buildings, disrupt utilities (i.e., gas, electric, phone, water), and trigger fires. According to the USGS Earthquake Hazards Program, most earthquakes (roughly 90%) occur at the boundaries where the earth’s tectonic plates meet, although it is possible for earthquakes to occur entirely within plates. New York City is located well within the North American plate, far from the plate boundary located approximately 2,000 miles east in the Atlantic Ocean. Seismic research is ongoing with regard to causes of earthquakes in regions far from plate margins. Regardless of where they are centered, earthquakes can affect locations beyond their point of origin.
ii) Severity The terms magnitude and intensity are used to describe the overall severity of an earthquake. The severity of an earthquake depends on the amount of energy released at the epicenter, the distance from the epicenter, and the underlying soil type. All these factors affect how much the ground shakes, known as Peak Ground Acceleration (PGA) and what a building experiences, known as Spectral Acceleration (SA) during an earthquake. An earthquake’s magnitude is a measurement of the total amount of energy and is expressed in terms of the Richter scale. Intensity measures the effects of an earthquake at a particular place and is expressed in terms of the Modified Mercalli scale. Table 21 shows the approximate comparison between Richter scale magnitude and Modified Mercalli Intensity (MMI).

New York City Natural Hazard Mitigation Plan March 2009
Section III: Natural Hazard Risk Assessment Page 103 of 179
Table 21: Magnitude and Intensity Comparison Table 22 describes the effects of the various intensity ratings. According to the National Climatic Data Center, the strongest earthquake near New York City, which occurred on August 10, 1884 with a magnitude of 5.2 on the Richter scale, would have an intensity of VI to VII on the MMI scale.
MMI Scale Rating MMI Damage/Perception
I • Not felt except by a very few under especially favorable conditions
II • Felt only by a few people at rest, especially on upper floors of buildings
III
• Felt quite noticeably by people indoors, especially on upper floors of buildings
• Many people do not recognize it as an earthquake • Standing motor cars may rock slightly • Vibrations similar to the passing of a truck
IV
• Felt indoors by many, outdoors by few during the day • At night, some awakened • Dishes, windows, doors, disturbed; walls make cracking sound • Sensation like heavy truck striking building • Standing motor cars rocked noticeably
V
• Felt by nearly everyone; many awakened • Some dishes, windows broken • Unstable objects overturned • Pendulum clocks may stop
VI
• Felt by all; many frightened • Some heavy furniture moved • Few instances of fallen plaster • Damage slight
VII
• Damage negligible in buildings of good design and construction • Slight to moderate damage in well-built ordinary structures • Considerable damage in poorly built or badly designed structures • Some chimneys broken
VIII
• Damage slight in specially designed structures • Considerable damage in ordinary substantial buildings with partial
collapse • Damage great in poorly built structures • Fall of chimneys, factory stacks, columns, monuments, walls
Magnitude and Intensity Comparison Richter
Magnitude Scale
Typical Maximum MMI
1.0 to 3.0 I3.0 to 3.9 II to III4.0 to 4.9 IV to V5.0 to 5.9 VI to VII6.0 to 6.9 VII to IX
7.0 and Higher VIII or Higher
New York City Natural Hazard Mitigation Plan March 2009
Section III: Natural Hazard Risk Assessment Page 104 of 179
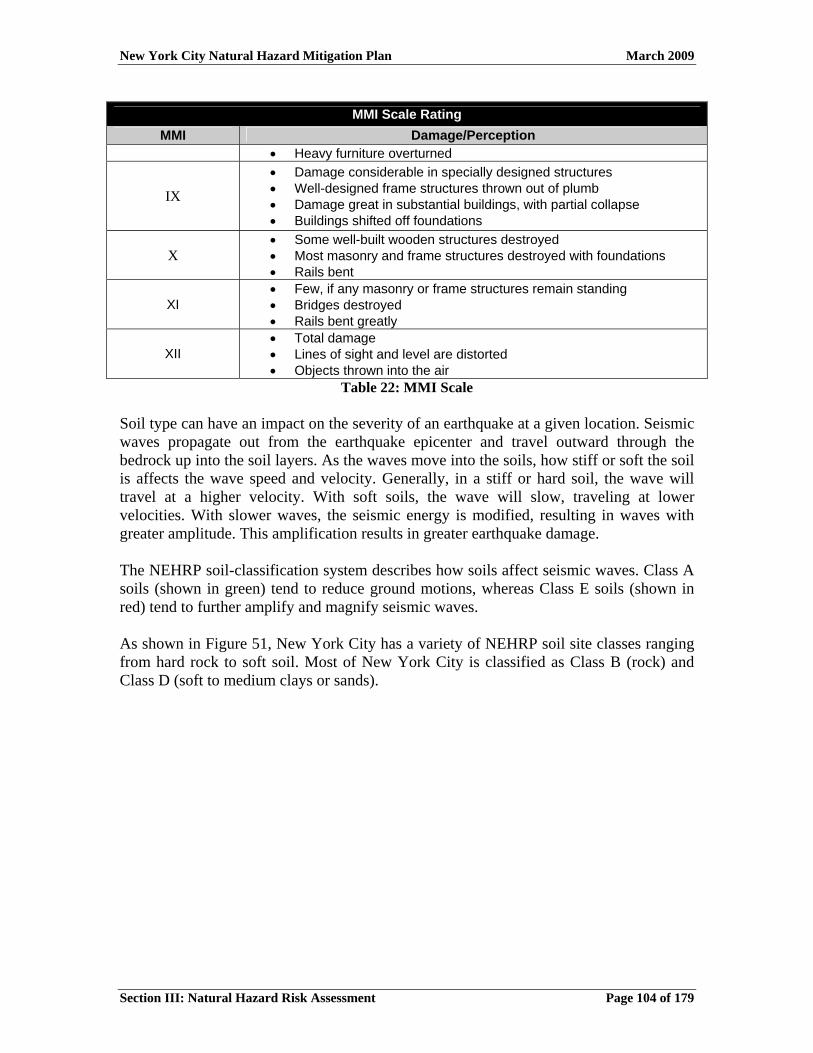
MMI Scale Rating MMI Damage/Perception
• Heavy furniture overturned
IX
• Damage considerable in specially designed structures • Well-designed frame structures thrown out of plumb • Damage great in substantial buildings, with partial collapse • Buildings shifted off foundations
X • Some well-built wooden structures destroyed • Most masonry and frame structures destroyed with foundations • Rails bent
XI • Few, if any masonry or frame structures remain standing • Bridges destroyed • Rails bent greatly
XII • Total damage • Lines of sight and level are distorted • Objects thrown into the air
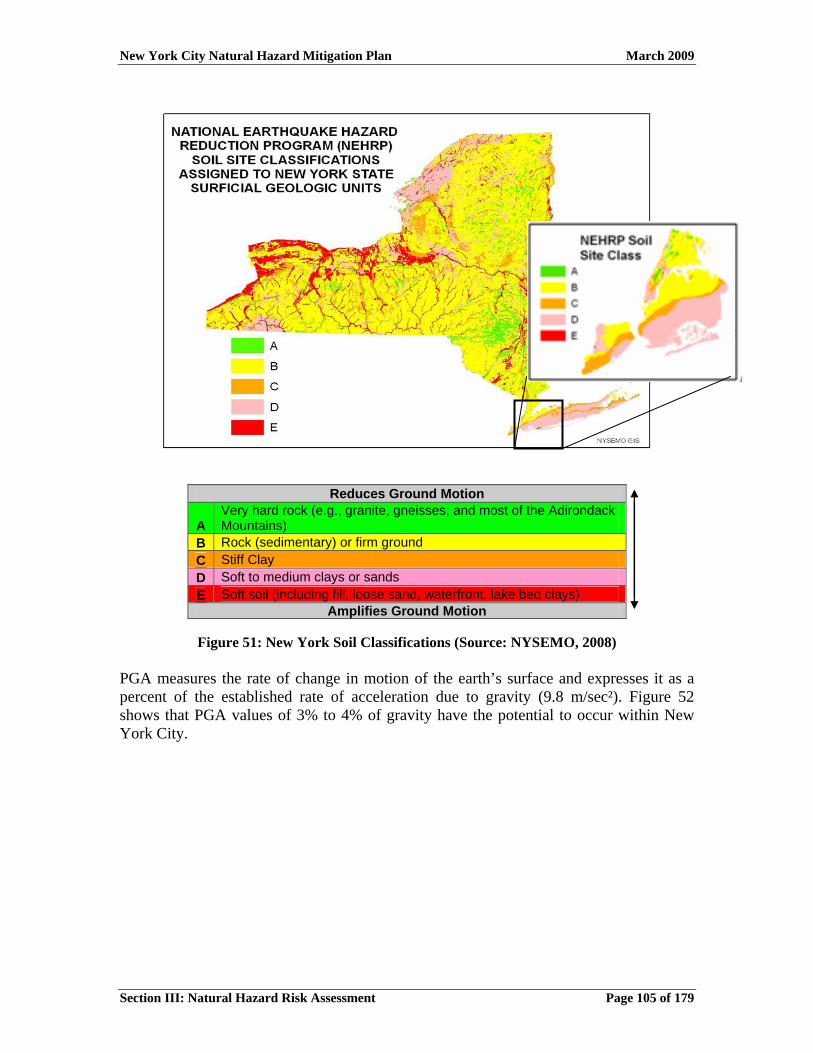
Table 22: MMI Scale Soil type can have an impact on the severity of an earthquake at a given location. Seismic waves propagate out from the earthquake epicenter and travel outward through the bedrock up into the soil layers. As the waves move into the soils, how stiff or soft the soil is affects the wave speed and velocity. Generally, in a stiff or hard soil, the wave will travel at a higher velocity. With soft soils, the wave will slow, traveling at lower velocities. With slower waves, the seismic energy is modified, resulting in waves with greater amplitude. This amplification results in greater earthquake damage. The NEHRP soil-classification system describes how soils affect seismic waves. Class A soils (shown in green) tend to reduce ground motions, whereas Class E soils (shown in red) tend to further amplify and magnify seismic waves. As shown in Figure 51, New York City has a variety of NEHRP soil site classes ranging from hard rock to soft soil. Most of New York City is classified as Class B (rock) and Class D (soft to medium clays or sands).
New York City Natural Hazard Mitigation Plan March 2009
Reduces Ground Motion
A Very hard rock (e.g., granite, gneisses; and most of the Adirondack Mountains)
B Rock (sedimentary) or firm ground C Stiff Clay D Soft to medium clays or sands E Soft soil (including fill, loose sand, waterfront, lake bed clays)
Amplifies Ground Motion
Figure 51: New York Soil Classifications (Source: NYSEMO, 2008) PGA measures the rate of change in motion of the earth’s surface and expresses it as a percent of the established rate of acceleration due to gravity (9.8 m/sec²). Figure 52 shows that PGA values of 3% to 4% of gravity have the potential to occur within New York City.
Section III: Natural Hazard Risk Assessment Page 105 of 179

New York City Natural Hazard Mitigation Plan March 2009
% g
Figure 52: PGA in New York City (Source: National Seismic Hazards Maps, 2008) An approximated relationship between MMI and PGA is shown in Table 23. The 3% to 4% PGA predicted above would result in an MMI intensity of IV (light perceived shaking and no damage).
Section III: Natural Hazard Risk Assessment Page 106 of 179

New York City Natural Hazard Mitigation Plan March 2009
Table 23: Approximate Relationship between MMI and PGA
Approximate Relationship between MMI and PGA
MMI Acceleration (%g) (PGA) Perceived Shaking Potential Damage
I < .17 Not Felt NoneII .17–1.4 Weak NoneIII .17–1.4 Weak NoneIV 1.4–3.9 Light NoneV 3.9–9.2 Moderate Very LightVI 9.2-18 Strong LightVII 18–34 Very Strong ModerateVIII 34–65 Severe Moderate to HeavyIX 65–124 Violent HeavyX > 124 Extreme Very HeavyXI > 124 Extreme Very HeavyXII > 124 Extreme Very Heavy
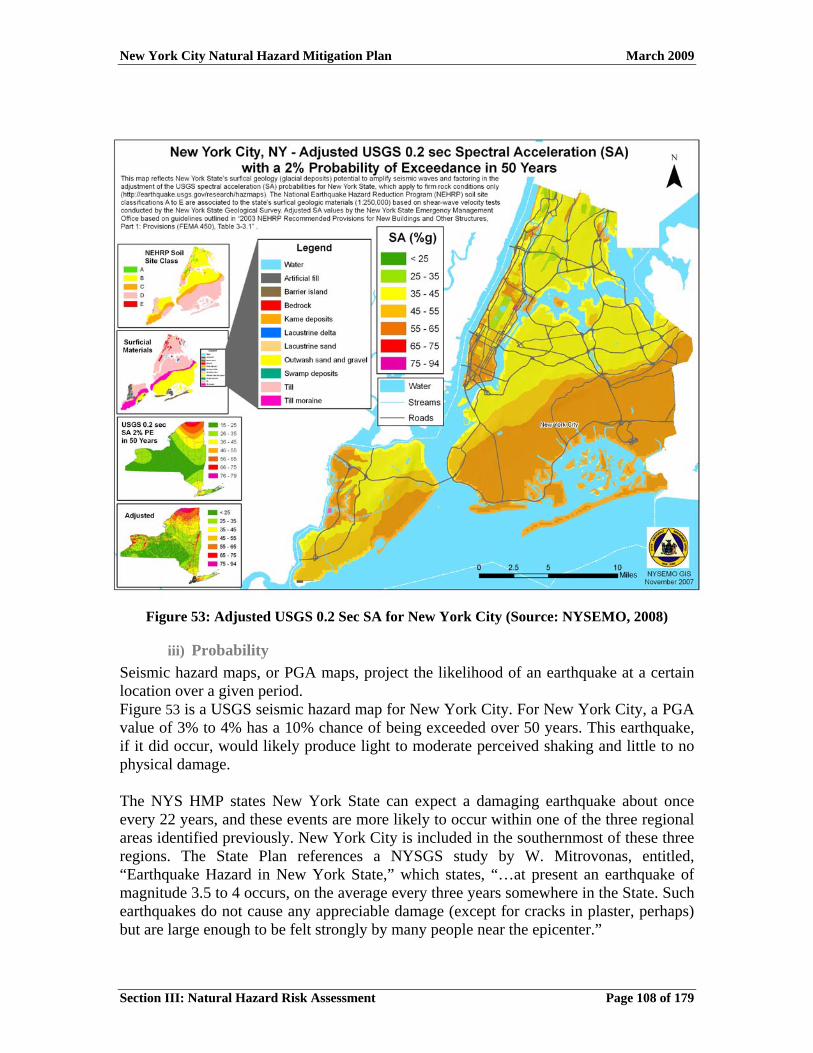
SA is approximately what is experienced by a building during an earthquake, as modeled by a particle mass on a mass-less vertical rod having the same natural period of vibration as the building. SA can be used as a better indicator of damage to specific buildings types and heights The New York State Emergency Management Office (NYSEMO) created county-specific seismic hazard maps that reflect the soil’s ability to affect seismic waves and the resulting SA experienced by a building. The maps are based on NYSGS shear-wave tests of the surficial soils. These maps facilitate a better understanding of local, seismic hazards by identifying areas of higher vulnerability within the City. This figure shows SA values of 25% to 75% of gravity have the potential to occur within New York City. Figure 53 presents the adjusted USGS 0.2 sec SA with a 2% probability of exceedance within 50 years.
Section III: Natural Hazard Risk Assessment Page 107 of 179
New York City Natural Hazard Mitigation Plan March 2009
Section III: Natural Hazard Risk Assessment Page 108 of 179
Figure 53: Adjusted USGS 0.2 Sec SA for New York City (Source: NYSEMO, 2008)
iii) Probability Seismic hazard maps, or PGA maps, project the likelihood of an earthquake at a certain location over a given period. Figure 53 is a USGS seismic hazard map for New York City. For New York City, a PGA value of 3% to 4% has a 10% chance of being exceeded over 50 years. This earthquake, if it did occur, would likely produce light to moderate perceived shaking and little to no physical damage. The NYS HMP states New York State can expect a damaging earthquake about once every 22 years, and these events are more likely to occur within one of the three regional areas identified previously. New York City is included in the southernmost of these three regions. The State Plan references a NYSGS study by W. Mitrovonas, entitled, “Earthquake Hazard in New York State,” which states, “…at present an earthquake of magnitude 3.5 to 4 occurs, on the average every three years somewhere in the State. Such earthquakes do not cause any appreciable damage (except for cracks in plaster, perhaps) but are large enough to be felt strongly by many people near the epicenter.”
New York City Natural Hazard Mitigation Plan March 2009
Section III: Natural Hazard Risk Assessment Page 109 of 179
Although New York City is a region with low seismic hazard (infrequent damaging earthquakes), seismic risk is higher because of its tremendous assets, concentration of buildings, and the fragility of its structures, most of which have not been seismically designed.
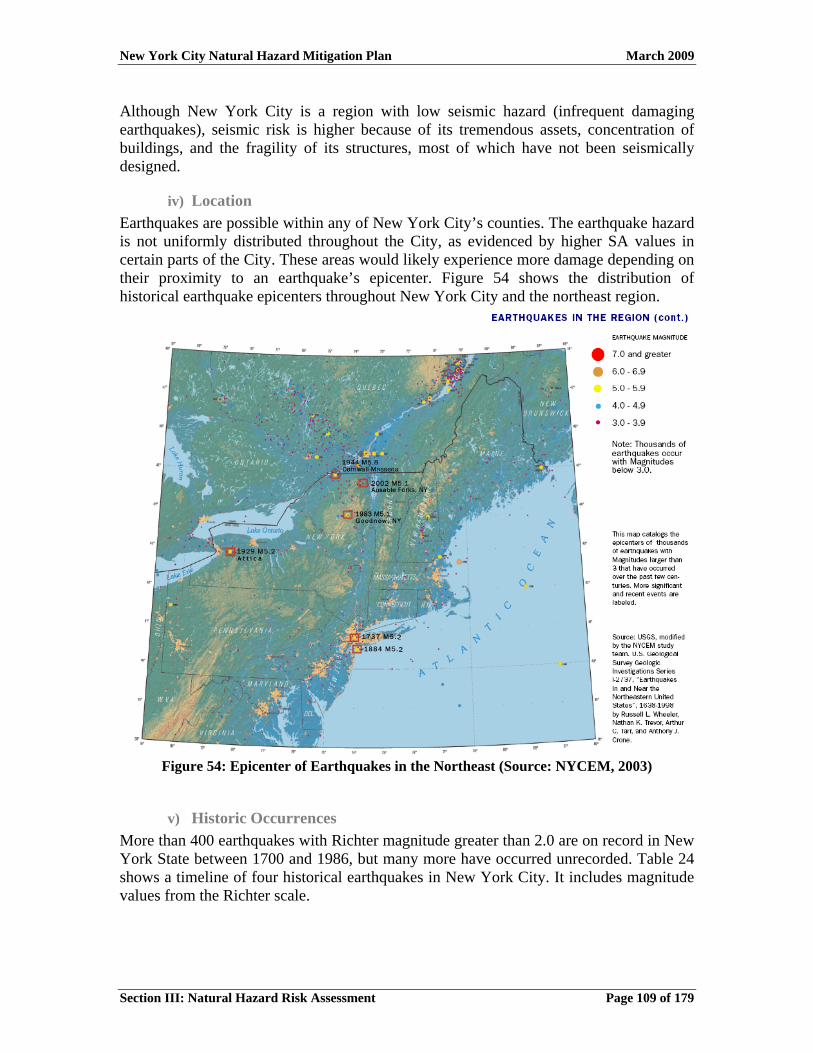
iv) Location Earthquakes are possible within any of New York City’s counties. The earthquake hazard is not uniformly distributed throughout the City, as evidenced by higher SA values in certain parts of the City. These areas would likely experience more damage depending on their proximity to an earthquake’s epicenter. Figure 54 shows the distribution of historical earthquake epicenters throughout New York City and the northeast region.
Figure 54: Epicenter of Earthquakes in the Northeast (Source: NYCEM, 2003)
v) Historic Occurrences More than 400 earthquakes with Richter magnitude greater than 2.0 are on record in New York State between 1700 and 1986, but many more have occurred unrecorded. Table 24 shows a timeline of four historical earthquakes in New York City. It includes magnitude values from the Richter scale.

New York City Natural Hazard Mitigation Plan March 2009
Section III: Natural Hazard Risk Assessment Page 110 of 179
Historic Occurrences of Earthquakes in New York City
Date Location Richter Magnitude Description
Dec. 18, 1737 Citywide 5.2 Bells rang, several chimneys fell
Sept. 2, 1847 Citywide (offshore) 3.5 No reference and/or no damage reported
Aug. 10, 1884 Citywide 5.2 Chimneys and bricks fell, walls cracked
July 9, 1937 Brooklyn 3.5 No reference and/or no damage reported
Table 24: Historic Occurrences of Earthquakes in New York City
b) Vulnerability Assessment
i) Impact to New York City The infrequency of major earthquakes, coupled with relatively low magnitude events in the past, has led the public to perceive New York City is not vulnerable to a damaging earthquake. This perception has allowed New York City to develop largely without regard for earthquake safety. While the City does not sit on a major fault system, like the San Andreas in California, it is susceptible to earthquakes that originate in or near the City. A high-magnitude earthquake could cause significant financial losses, casualties, and disruptions in critical facilities and services. New York City’s unreinforced masonry buildings and underground infrastructure are especially vulnerable to ground acceleration caused by earthquakes. Upstate dams and aqueducts are also a concern and could incur serious damage from an earthquake, affecting the water supply to New York City.

New York City Natural Hazard Mitigation Plan March 2009
Section III: Natural Hazard Risk Assessment Page 111 of 179
Table 25 and Table 26 describe the potential impact of a variety of earthquake scenarios in and around New York City as modeled in the New York City Area Consortium for Earthquake Loss Mitigation (NYCEM) Study published in 2003.
Deterministic Results of the NYCEM Study (Summary)
Richter Scale
Building Damage (billion)
Income Loss
(billion) Total
(billion) Hospitalization
(people) Shelter
Required (people)
Fires Buildings
Completely Damaged
Debris (million tons)
5 $4.4 $0.4 $4.8 24 2800 500 45 1.66 $28.5 $10.8 $39.3 2,296 197,705 900 2,600 31.97 $139.8 $57.1 $196.8 13,171 766,746 1,200 12,800 132.1
Note: Epicenter located at historic August 10, 1884 location Table 25: Summary of Deterministic Results of the NYCEM Study (Source: NYCEM, 2003)
Probabilistic Results of the NYCEM Study (Summary)
Return Period
Building Damage (billion)
Income Loss
(billion) Total
(billion) Hospitalization
(people) Shelter
Required (people)
Fires Buildings
Completely Damaged
Debris (million tons)
100-year $0.1 $0.1 $0.2 0 0 0 0 0.2 500-year $6.1 $2.0 $8.1 28 575 50 100 3.1
2,500-year $64.3 $20.4 $84.8 1,430 84,626 900 2,200 34.0Annualized
Losses $0.1 $0.1 $0.2 N/A N/A N/A N/A N/A
Table 26: Summary of Probabilistic Results of the NYCEM Study (Source: NYCEM, 2003)

New York City Natural Hazard Mitigation Plan March 2009
Section III: Natural Hazard Risk Assessment Page 112 of 179
ii) Structural Vulnerability A building’s construction is a key factor in how well it can withstand the forces produced by earthquakes. Unreinforced masonry buildings are most at risk in an earthquake because the walls are prone to collapse outward. Steel and wood buildings have more ability to absorb the energy from an earthquake. Wood buildings with proper foundation ties have rarely collapsed in earthquakes. The greatest concentration of masonry buildings are found in Brooklyn (178,920) followed by Queens (115,062), the Bronx (54,434), Manhattan (28,762) and Staten Island (8,870). Masonry buildings make up roughly 48% of the buildings in all of New York City. It is likely Brooklyn, the Bronx, and Queens would sustain the highest amounts of building damage during an earthquake. This estimation is refined further in the HAZUS-MH analysis presented below. DOB has addressed structural vulnerability for earthquakes in the revised Construction Code. The current code contains seismic provisions that, in effect, require a building to be “stronger” by requiring designers to increase the load the building can withstand. The newly enacted code not only makes buildings “stronger,” but also “flexible.” For example, the type of soil and foundation underpinning of the building will be taken into account, and seismic detailing is required to ensure the joints and connections of a building hold up during an earthquake. Inspections are also required during construction to ensure seismic features are built correctly. Furthermore, as they are in the old code, critical facilities—such as firehouses and hospitals will be designed under the revised code to not only survive an earthquake, but also remain open and functional afterwards. For more information on the New York City Construction Code, see page 57. The Planning Team used HAZUS-MH to estimate losses and structural vulnerability for earthquakes in New York City. The Planning Team used a probabilistic model for earthquakes. The probability is expressed as a percent chance that an earthquake of a specific magnitude will occur in any given year. For example, an earthquake with a 100-year return period, or occurrence rate, has a 1% chance of occurring in any one year. This is also called a 100-year return period.
Probabilistic Modeling
Return Period (Years) Chance of Occurrence in Any Given Year (%)
100 1 200 0.5 250 0.4 500 0.2
1,000 0.1 2,500 0.04
Table 27: Return Periods for Probabilistic Modeling for Earthquakes
New York City Natural Hazard Mitigation Plan March 2009
Section III: Natural Hazard Risk Assessment Page 113 of 179
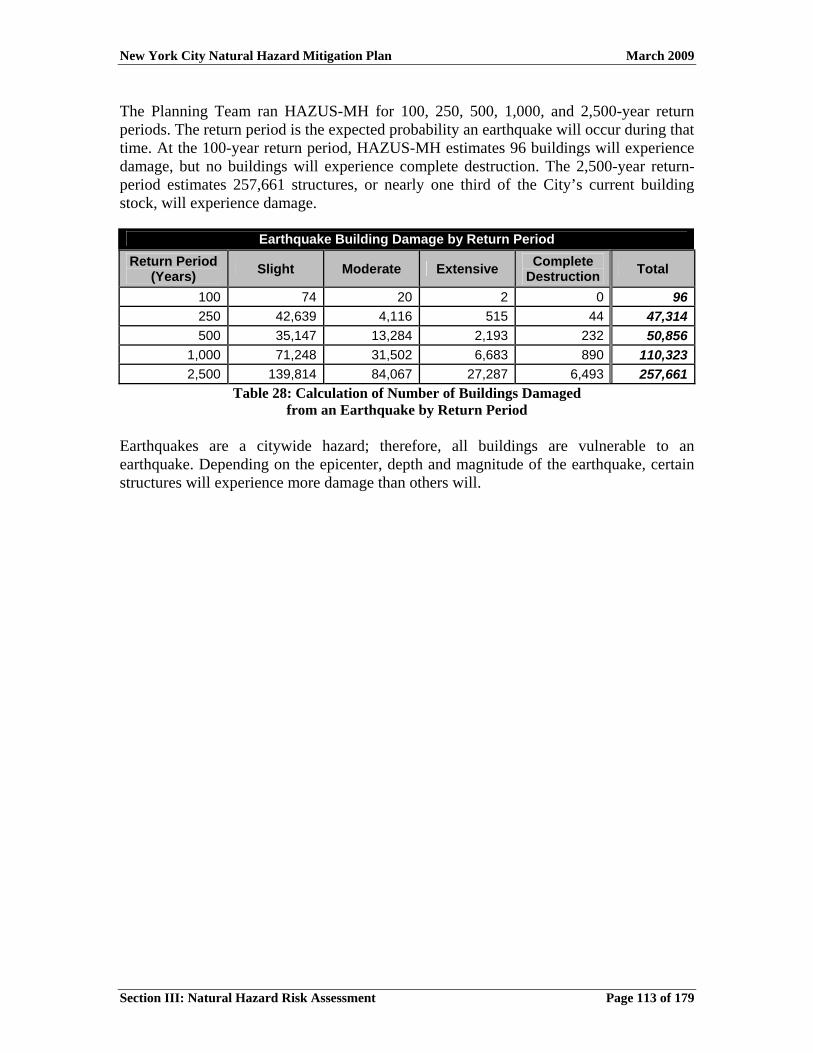
The Planning Team ran HAZUS-MH for 100, 250, 500, 1,000, and 2,500-year return periods. The return period is the expected probability an earthquake will occur during that time. At the 100-year return period, HAZUS-MH estimates 96 buildings will experience damage, but no buildings will experience complete destruction. The 2,500-year return-period estimates 257,661 structures, or nearly one third of the City’s current building stock, will experience damage.
Earthquake Building Damage by Return Period Return Period
(Years) Slight Moderate Extensive Complete Destruction Total
100 74 20 2 0 96250 42,639 4,116 515 44 47,314500 35,147 13,284 2,193 232 50,856
1,000 71,248 31,502 6,683 890 110,3232,500 139,814 84,067 27,287 6,493 257,661
Table 28: Calculation of Number of Buildings Damaged from an Earthquake by Return Period
Earthquakes are a citywide hazard; therefore, all buildings are vulnerable to an earthquake. Depending on the epicenter, depth and magnitude of the earthquake, certain structures will experience more damage than others will.

New York City Natural Hazard Mitigation Plan March 2009
Section III: Natural Hazard Risk Assessment Page 114 of 179
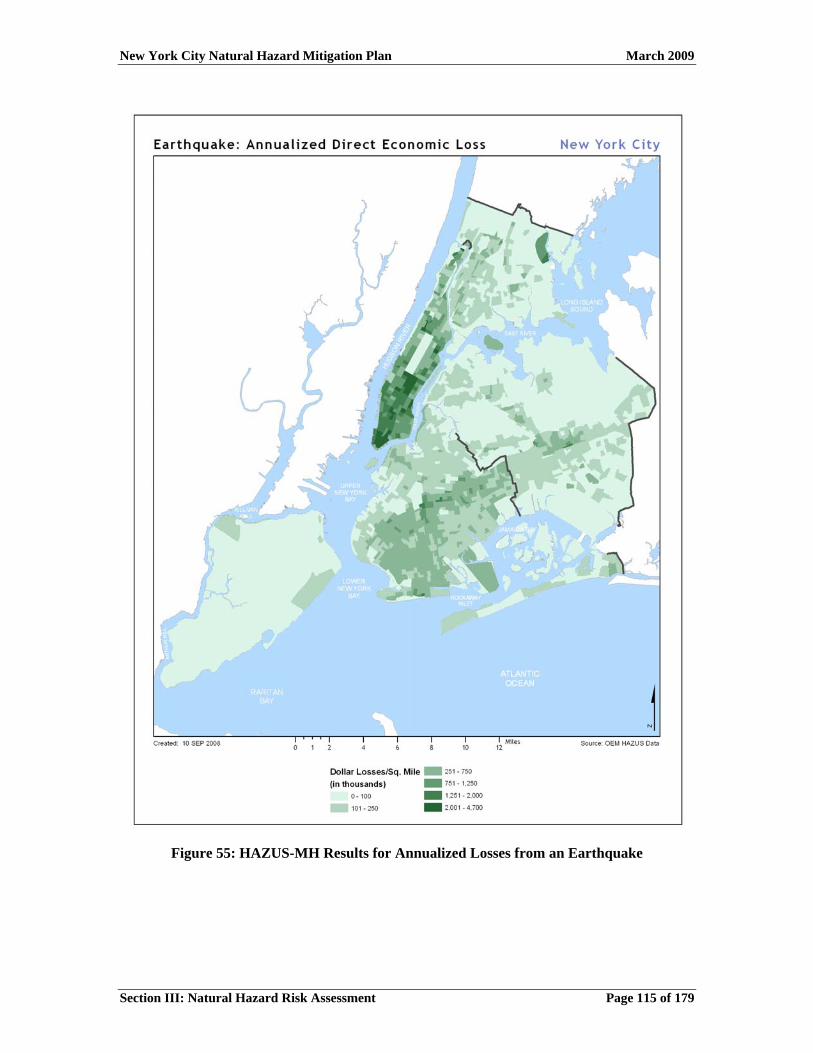
iii) Potential Loss Estimate The Planning Team used HAZUS-MH to calculate building damage from an earthquake at the county level. Table 29 and Figure 55 display HAZUS-MH estimates of annualized capital stock losses. Annualized losses are an estimated long-term value of earthquake losses to the general building stock in any single year for New York City. Overall, New York City has a total annualized loss of $45.2 million from earthquakes. More than half of this cost is from non-structural damage or damage done to architectural, mechanical, and/or electric components of the building. Manhattan and Brooklyn have the highest annualized losses of the five boroughs with 67% of the citywide losses.
Annualized Capital Stock Losses for Earthquakes ($1,000s)
Borough Structural Damage
Non-Structural Damage
Contents Damage Total
Brooklyn 2,883 9,002 2,932 14,817Bronx 825 2,594 851 4,270Manhattan 3,056 9,893 3,593 16,542Queens 1,542 4,881 1,776 8,200Staten Island 217 837 363 1,417Total 8,524 27,207 9,516 45,247
Table 29: HAZUS-MH Calculation of Annualized Capital Stock Losses for Earthquakes
New York City Natural Hazard Mitigation Plan March 2009
Figure 55: HAZUS-MH Results for Annualized Losses from an Earthquake
Section III: Natural Hazard Risk Assessment Page 115 of 179