9. j. wolf, f.h. rijsdijk and h. van keulen 9.1.1 introduction · 48 - 50 crops are divided into...
TRANSCRIPT

9.1 A FORTRAN model of crop production
J. Wolf, F.H. Rijsdijk and H. van Keulen
9.1.1 Introduction
In the preceding chapters of this monograph the method to calculate crop production for the various production situations has been illustrated using a desk-top calculator. However, when the method has to be applied in a more practical situation, where the number of alternatives in terms of soil types, weather conditions and crop species is large, the time required for calculations with a desk-top calculator may be prohibitively long. In these situations a microcomputer, that can perform repetitive calculations rapidly is indispensable. In this section a program is presented, written in FORTRAN 66, which is available on most microcomputers, that permits the execution of calculations for various site - specific basic data sets.
The terminology used in this section corresponds to that used by de Wit & Goudriaan (1972) and Penning de Vries & van Laar (1982) in earlier volumes of the Simulation Monographs series*. A listing of the simulation model is given in Subsection 9.1.4. Because the acronyms used in this model are not always identical to those used in the preceding chapters, an alphabetical list of acronyms is provided (Subsection 9.1.5).
The model calculates crop growth and production in a dynamic way both for the situation of potential crop production (Production Situation 1) and for that of water - limited production (Production Situation 2). Production for the third production situation, i.e. unfertilized soil, is subsequently determined from the supply of nutrients by natural sources. This supply is introduced in the model as an exogenous variable, derived from fertilizer experiments (Section 5.3). In addition, the fertilizer application required to arrive at both potential and water - limited crop production is calculated from a exogenou-sly derived fertilizer recovery fraction and from the calculated yields of marketable products and crop residues with their crop specific minimum nutrient concentrations. Finally, a yield level is determined as influenced by the effects of weeds, pests and diseases.
In Subsection 9.1.2, a short description is given of the functional relations and the data used in the model. Because they are mostly identical to the ones treated in the preceding chapters, it is superfluous to go into great detail; reference will be made to the equations or subsections, where more extensive information can be found. In Subsection 9.1.3, an outline is given of the data that have to be changed to use the simulation model in the reader's situation.
343

9.1.2 Description of the simulation model
The lines starting with a C in the first column are in FORTRAN convention comment lines; they are ignored during execution.
Lines
RANDOM
1 - 20 This routine is used to transform sequential files with data on soil characteristics, capillary rise and climate (Tables 92 to 94) to random access files in which the required data can be read per record number. Thus this program is not used during the crop growth simulation. For example, when new data on climate are available, the sequential file CLIMEAN.DAT has to be changed. Next by running the program RANDOM, CLIMEAN.DAT is transformed to a random access file. After that the calculations of crop growth can be executed.
RANDOMP
1 - 9 This routine is used to transform sequential files with data on crop characteristics (Table 95) to random access files in which the required data can be read per record number. It acts in the same way as RANDOM but is only used for plant data.
WOFAUTN
4 - 32 At compilation, the COMMON blocks of the data base called WOFOST.CMN are inserted.
33 - 35 Dimension declaration of data base. In the present example the data base is restricted to six land units, but this number can be expanded without any problems.
36 - 43 For each of the six land units the relevant climatic data set, soil texture classes, surface roughness, slope angle of the land, minimum and maximum depth of the groundwater table and relative area with particular soil texture class are specified. Names of some land units in Bangladesh are given in Table 91.
45 " - 46 These lines specify for 24 crop species or cultivars the factors to convert the calculated dry matter yield of the economic plant parts to the marketable product.
47 Harvest losses as a fraction of the economic plant part are specified per crop species or cultivar.
344

Table 91. Soil texture classes, crop species, land units.
1. = Coarse sand 2. = Loamy sand 3. = Fine sand 4. = Fine sandy loam 5. = Silt loam 6. = Loam 7. = Loess loam 8.= Sandy clay loam 9. = Silty clay loam
10. = Clay loam 11.= Light clay 12.= Silty clay 13. = Heavy clay 14.= Peat
1. = Spring Wheat 2.= RiceHYVIR8 3. = Rice BR 3 boro/aus 4. = Rice BR 7 aus 5.= RiceBR9boro 6. = Rice BR 41. aman 7. = Rice Nizersail t. aman 8. = Jute (C. capsilahus) 9. = Jute (C. olitorius)
10. = Groundnut 11.= Cassava 12. = Maize 13. = Lentil 14. = Chickpea 15. = Tobacco 16.= Cotton 17. = Sugar cane 18.= Chillies 19. = Rapeseed 20. = Barley 21. = Sweet potato 22. = Onion 23. = Sesame 24.= Potato
1. = N.E. Barind tract 2. = N. Tista flood plain 3. = Gangus tidal flood plain 4. = Chittagong hill tract 5. = Dacca se 6. = Sylhet basin
345

48 - 50 Crops are divided into two groups that have a different susceptibility to pests and diseases (IDISR = 1 (less susceptible) or 2 (susceptible)). The relation between relative yield (see lines 132 - 147) and the reduction due to pests and diseases is specified in data sets TAB1 and TAB2 for group 1 and 2, respectively.
51 Specification of crop part that constitutes the marketable product: 1 (leaves), 2 (stems) or 3 (storage organs).
54 - 59 To open input files for data on specific crop growth calculations, on soil and crop characteristics and on capillary rise and climate, and to open the output file in which the results of the simulation will be written. The contents of these files are shown in Tables 92 to 96 and they are specified in subroutines PLANTR, CRDAT, CLIMIN, SOILR.
61 - 69 Read specification of land unit, crop species and starting date of crop growth for which the calculation has to be carried out. The dates are counted according to the Julian calendar for a standard year of 365 days. For the specified land unit, the climatic data set, surface roughness, slope angle of the land and minimum and maximum groundwater depth are found.
70 - 74 For the specified land unit, the calculations are carried out for five soil texture classes, unless the relative area for a given soil texture class equals 0. If IOPT is larger than zero, the crop growth simulation without water balance is omitted.
76 - 84 Call subroutines, which are described further on. 86 - 91 A variable IPS controlling output is specified, the variable speci
fying day number is set equal to the starting date, the base uptake of nitrogen and phosphorus and the recovery fraction of applied nitrogen and phosphorus fertilizer are given.
94 - 100 Call subroutines, which are described later. Crop production is first calculated without water balance (IWB = 0 ; potential production) and subsequently with water balance (IWB = 1).
102 - 113 The output of the crop-growth simulation model is specified. The calculated production of leaves, stems and storage organs is given for potential production (1-3), water - limited production (4-6), nutrient - limited production (7-9) and water-- plus — nutrient — limited production (10-12), respectively.
114 - 120 The calculated production of leaves, stems and storage organs, expressed in dry matter, is corrected for harvest losses, and is multiplied by 1.15 to arrive at air-dry material. Depending on the marketable product (leaves, stems or storage organs, i.e. IHP = 1, 2 or 3), the harvested product is converted into the form in which it is generally expressed in the agricultural statistics. Hence, grains are expressed on an air-dry basis, brown rice is converted to paddy; jute is expressed in fibre; groundnut,
346

sesame, lentil, rape-seed and chickpea are expressed in air--dry seed; cassave in dry matter; tobacco and sugar-cane in air-dry leaves and stems, respectively; onions, sweet potato and potato in fresh tubers; cotton in seed plus lint and chillies in dry matter. The sequence of the 24 crop species or cultivars is given in Table 91.
122 - 131 For the marketable plant organ, the additional yield per unit applied fertilizer nutrient, both for the potential and the water-- limited production situation, is calculated.
132 - 147 For Production Situation 4, the effects of weeds, pests and diseases on production are taken into account. The yields in the absence of control measures are calculated from the water - limited and water - plus - nutrient - limited production through application of a reduction factor. The value of this reduction factor is a function of the relative yield, i.e. the yield compared to the potential yield. The relation is such that a greater reduction is assumed at higher yield levels. Two crop groups are distinguished comprising less and more susceptible crop species (lines 48 - 50).
149 - 160 Write in the output file of a particular crop growth simulation the relevant land unit, the texture class with its relative area, crop species, starting date of crop growth, total transpiration for potential and water — limited production and total surface runoff during the crop growth period. Write further the yield increment per unit of applied nitrogen or phosphorus (legumes only) fertilizer, and the production of leaves, stems and storage organs for the potential and the water - limited production situation, for the nutrient - limited and the water- plus - nutrient - limited production situation, both with and without reduction for the effects of weeds, pests and diseases. The limiting nutrient is normally nitrogen, but for nitrogen - fixing crop species, such as legumes, it is supposed to be phosphorus. At the end of a complete sequence of calculations the files are closed and the calculations stopped.
BLOCK DATA
164 - 192 At compilation the COMMON blocks, called WOFOST.CMN, are inserted.
194 - 200 A data block is given here with initial or default values for the variables used in the calculations of crop growth and the water balance. The soil default values refer mainly to Texture Class 7, i.e. loess loam. For other texture classes, data are read from an input file and replace the default values.
347

202 - 207 The relation between air temperature and a reduction factor for gross C02 assimilation rate is given for C4 and C3 crop species. The C3 species are subdivided into those normally growing under temperate and tropical conditions, respectively. The base uptake of nutrients is defined for crops with a growth period of 120 days. For crops with shorter or longer growth periods the base uptake is corrected on the basis of the relation given.
FUNCTION AFGEN
209 - 232 This function allows linear interpolation in a table for a given value of the independent variable X. The table consists of 15 values for the independent variable (odd numbers, i.e. TA-BLE(l), (3)...) and of 15 values for the corresponding dependent variable (even numbers, i.e. TABLE(2), (4)...) The value of the independent variable X is compared with the values of the odd numbers. When the value of TABLE(I) exceeds the value of X for the first time, the slope of the function is calculated from the values of the independent variables nearest to X. This slope is equal to the difference between two adjacent even numbers divided by the difference between the two corresponding odd numbers. The value that results from the interpolation in the tables for the given value X is called AFGEN. For example, TABLE(5) is the first value larger than X. Then,
SLOPE = (TABLE(4) - TABLE(6)) / (TABLE(3) -TABLE(5)) AFGEN = TABLE(6) + SLOPE • (X — TABLE(5))
If the independent variable X is larger than or equal to the largest independent TABLE value or is smaller than or equal to the smallest independent TABLE value, the largest or the smallest dependent TABLE value is chosen.
SUBROUTINE SOILR
236 - 264 At compilation the COMMON blocks, defined in WO-FOST.CMN, are inserted.
266 - 271 Read from the input file on unit 7 starting on record 1 for soil texture class, 1 record 2 for texture class 2, etc. In total, data for 14 soil texture classes (Table 91) are included, which are given in Table 92. The data provided per texture class are: saturated hydraulic conductivity, the suction limit (Equation 31), the transmission —zone conductivity, empirical constants 1 and 2, respectively (Equations 30, 31), geometry factor (Equation 27), slope angle of the land, surface roughness, clod/furrow angle,
348

initial groundwater depth, standard sorptivity and total pore space. In the present set - up the slope angle is associated with a texture class. That is not always necessary, however. The maximum rooting depth is assumed equal to 150 cm.
272 - 275 In these lines a message is defined that appears if soil data for a texture class cannot be read.
SUBROUTINE PLANTR
279 - 307 At compilation the COMMON blocks, defined in WO-FOST.CMN, are inserted.
310 - 328 Read from the input file on unit 8 starting on record 1 for crop 1, record 25 for crop 2, record 49 for crop 3, etc. Data for 24 crops or cultivars (Table 91) are included, which are given in Tables 95 and 96. For each crop, the following data are supplied: - name of crop - crop type (1 = C4 crop; 2 = C3 crop, adapted to temperate regions; 3 = C3 crop, adapted to (sub)tropical regions; 4 = leguminous crop); with or without air ducts (1 or 0); increase in maintenance respiration rate per 10 °C temperature increase; extinction coefficient for total radiation; efficiency of converting assimilates into leaf, storage organ, root and stem structural dry matter, respectively; life span of leaves; relative maintenance respiration rate of leaves. - relative maintenance respiration rate of storage organs, roots and stems, respectively; extension rate of roots; relative death rate of leaves due to water stress; relative death rate due to ageing of roots and stems, respectively; specific pod area; specific stem area; minimum nitrogen concentration in storage organs. - development rate dependent or not on day length; initial rooting depth; initial total dry weight (living); maximum development rate for the pre-anthesis period; critical day length for maximum and for zero development; maximum development rate for the post - anthesis period; minimum nitrogen concentration in crop residues; minimum phosphorus concentration in storage organs and in crop residues, respectively. - tables of the partitioning factors of assimilates to roots, leaves, stems and storage organs, respectively and the specific leaf area, all as a function of the development stage. - table of the relative development rate as a function of temperature.
349

o o CN o © CN
o o CM CN CN o © CN
© o CN
o o CN
O o CN CN CN CN CN CN
O co o
co
O CO
O co
O co
O co
O co
O co ©
CO o CO
O CO O
CO o CO
o CO
O O O O O
«n wo wo wo w-> wo wo wo wo wo wo wo •n wo
O oo r^ »o CO oo O oo CO <N CN ~-> © © © ©
© ON vo wo oo wo oo vo ON © wo oo
© © 8 © 8 8 vp
CN
< Q <
< Q
O
.2 •4—»
c 3
a* on a> .c H CN ON JD a H
CO CO CO CO 00 oo
rt ON © Tf o CN co wo CN CN CN O O O O
wo CN
WO CM
WO CN
wo CN
CO
WO CN
CO CN O
CO
CN
CO CO CO CO CO CO t*"* 00 Tf
Os wo co t̂ r̂ oo
S CO CN CN CN
o o o o CN
wo CN
wo CN
wo CN
wo CN
CO
wo CN
CO CO wo
oo CO o *-«
s w-> CN
wo CN
00
o •
o "<t
• vo *"*
ON •
o wo
• VO CN
CO •
r* T
TT •
^r *~*
VO •
CN CN
VO •
CO CO
© •
VO CO
ON VO
• «-M
r* r̂
• CN
CN •
00 CN
VO oo
• Tt
CN OO
• VO
o o o o o o o o o o o o o o c o c o c o c o c o c o c o c o c o c o c o c o c o c o
c o © c o v o c N r - * Q o ~ * o o v o v © o w o v o C N O O C O C O C O O N O O W O — * r » v o o o * - « o o ON 1—4
»-* WO ON CO
r*» • M
ON CO t̂
O CO
ON WN CO 00 VO
s s CO w*>
ON O w->
CO O wo
wo w-> CN
co wo
CN O ~ wo co
wo o wo
O co ^ vo wo 00
o o o r ^ o o O c o o o o C N ^ c o c o c o * - « C N c o c o c o
v o O T f r - v o c o w o w o w o O ^ - ^ c N ^ t w o T t r ^ o o — « r̂ » r -
• • • • • • • • • • • © O N ^ r - ^ r ^ c o o N V O T t o i r t ^ - * c N ^ - 4 « ^ * - ^ ^ ^ < ^ oo ~^
wo © © w o © wo wo wo ON wo
© w->
© 00
© w->
OO ON
co ON
Tt ^t
© CN
co ~^ r*» CN
CO CN CO
vo CN
© wo
CN vo wo Tf CO -* CN
- H © CO p-« © wo
350

- table of the soil - water depletion fraction as a function of potential transpiration.
329 - 332 In these lines a message is defined that appears if a set of crop data cannot be read
SUBROUTINE CRDAT
336 - 364 At compilation the COMMON blocks, defined in WO-FOST.CMN, are inserted.
366 - 371 Read from the output file on unit 9 starting on record 1 for texture class 1, record 11 for texture class 2 etc. In total, data are provided for 14 texture classes. These data are derived from Rijtema (1969) and relate the rate of capillary rise (8 values) and the soil suction in the rooted zone (10 values) to the distance between root zone and groundwater level (RIJTEM (10,8)). An example of this input file derived from Tables 21 to 34 is shown in Table 93. These data are used in subroutine RIJTEMA to calculate the rate of capillary rise.
372 - 375 In these lines a message is defined that appears if a set of data cannot be read.
SUBROUTINE CLIMIN
379 - 407 At compilation the COMMON blocks, defined in WO-FOST.CMN, are inserted.
410 - 432 Read from the input file on unit 10 starting on record 1 for climatic data-set 1, record 14 for climatic data-set 2 etc. In total 6 data sets are included. From each set the following data are read: - name of the location for which the climate applies and its geographical latitude - values for the 12 monthly averages of daily air temperature, monthly rainfall, daily potential evapotranspiration rate, daily potential evaporation rate, daily gross C02 assimilation rate of a closed C3 or C4 crop canopy, respectively, monthly effective irrigation and the number of rainy days per month. An example of this input file is shown in Table 94. The climatic data are entered in tables derived from the data statement DAYNUM that contain initially only the day numbers (the middle of each month in the Julian calendar) and zeros for the corresponding climatic data (lines 408 - 411).
433 - 447 For the potential evaporation rate and evapotranspiration rate the monthly average value is calculated and entered in the tables. For each of the climatic variables the values for the middle of the
351

first and the last month of the year are averaged to obtain the values for the first and the last day of the year.
Table 93. Part of the sequential file RIJTEMA.DAT, containing data for 4 soil texture classes.
20.0 43.3 44.4 44.5 44.5 44.5 44.5 44.5 44.5 44.5 3.7
11.6 13.9 14.5 14.7 14.9 15.1 15.2 15.3 15.3 19.7 47.9 82.0 92.8 94.1 95.1 95.9 96.4 96.8 97.0 19.1 47.0 88.0
137.0 140.9 143.3 145.4 146.6 147.5 148.0 18.3 44.2 81.2
20.0 44.1 45.4 45.5 45.5 45.5 45.5 45.5 45.5 45.5 4.3
13.6 16.4 17.2 17.5 17.7 17.9 18.0 18.1 18.2 19.7 48.3 84.5 97.3 99.0
100.2 101.3 101.9 102.4 102.6 19.3 47.5 90.1
145.4 150.0 153.1 155.6 157.1 158.3 158.9 18.6 45.3 84.2
20.0 45.0 46.7 46.7 46.8 46.8 46.8 46.8 46.8 46.8 5.0
16.5 20.1 21.1 21.5 21.8 22.1 22.3 22.4 22.5 19.8 48.7 87.4
103.3 105.4 107.1 108.5 109.3 109.9 110.3 19.5 48.1 92.3
155.5 162.0 166.0 169.4 171.4 173.0 173.9 18.9 46.3 87.6
20.0 46.1 48.5 48.6 48.6 48.6 48.6 48.6 48.6 48.6 6.0
20.9 26.2 27.6 28.2 28.7 29.1 29.4 29.5 29.6 19.9 49.1 90.8
111.7 115.0 117.4 119.5 120.7 121.7 122.3 19.7 48.7 94.7
169.8 179.4 185.3 190.4 193.4 195.8 197.1 19.3 41.5 91.3
20.0 46.8 49.8 49.9 49.9 49.9 49.9 50.0 50.0 50.0 6.6
24.2 31.0 32.2 33.7 34.3 34.9 35.2 35.5 35.6 19.9 49.3 92.7
117.9 122.1 125.4 128.2 129.9 131.2 131.9 19.7 49.0 95.5
179.5 192.0 199.4 206.7 210.7 213.9 215.6
19.4 48.1 93.3
20.0 47.6 51.6 51.7 51.8 51.8 51.8 51.8 51.9 51.9 7.5
28.9 38.3 41.1 42.4 43.3 44.1 44.6 45.0 45.2 19.9 49.6 94.8
126.7 133.1 138.0 142.2 144.6 146.2 147.6 19.8 49.4 97.2
192.3 210.6 222.4 232.5 238.4 243.2 245.8
19.6 48.7 95.4
20.0 48.4 53.9 54.0 54.1 54.2 54.2 54.3 54.3 54.3 8.3
34.4 48.1 52.7 54.8 56.4 57.7 58.5 59.1 59.5 20.0 49.7 96.7
138.3 148.7 156.8 163.8 167.9 171.2 172.9 19.9 49.6 98.3
206.9 235.5 254.7 271.6 281.5 289.5 293.7
19.8 49.2 97.2
20.0 49.4 58.8 59.2 59.5 59.7 59.8 59.9 60.0 60.0 9.4
43.1 68.8 81.5 87.6 92.3 96.4 98.7
100.6 101.6 20.0 49.9 98.9
165.8 194.6 218.1 238.9 251.0 260.9 266.1 20.0 49.9 99.4
230.0 297.1 350.6 399.9 429.3 453.2 465.9
19.9 49.7 '99.0
352

Table 93. (continued)
127.7 134.4 138.6 142.3 144.4 146.1 147.0 17.7 42.2 74.0
102.6 104.6 105.9 107.0 107.7 108.2 108.5 18.9 43.8 65.4 71.5 74.2 76.2 78.0 79.0 79.8 80.3 19.4 47.3 85.1
110.0 113.9 117.0 119.6 121.1 122.3 123.0 14.0 31.0 48.1 58.2 61.4 64.7 67.5 69.1 70.4
137.2 145.4 150.7 155.3 157.9 160.1 161.2 18.2 43.5 77.7
111.0 113.7 115.3 116.7 117.5 118.2 118.5 19.1 44.9 69.0 76.4 79.8 83.3 84.5 85.8 86.8 87.3 19.5 47.8 87.5
116.3 121.2 125.0 128.2 130.1 131.6 132.4 14.9 33.5 53.1 65.3 69.4 73.5 76.9 79.0 80.6
149.2 160.0 167.0 173.0 176.6 179.4 180.9 18.6 45.0 82.1
122.1 125.7 127.8 129.7 130.7 131.6 132.1 19.3 46.0 73.3 83.0 87.4 90.8 93.7 95.4 96.8 97.5 19.6 48.3 90.1
124.4 130.9 136.0 140.3 142.8 144.8 145.9 15.9 36.5 59.4 75.0 80.5 85.9 90.5 93.2 95.3
165.7 181.4 191.9 201.0 206.3 210.6 212.8
19.0 46.5 87.0
137.8 143.1 146.3 149.1 150.7 152.0 152.7 19.5 47.3 78.9 92.7 99.3
104.4 108.8 111.3 113.4 114.4 19.7 48.9 93.0
136.0 145.7 153.2 159.6 163.4 166.5 168.1 17.1 40.0 67.9 89.5 97.4
105.6 112.5 116.5 119.8
176.8 197.2 211.1 223.2 230.2 236.0 239.0
19.3 47.3 89.8
148.8 155.7 160.1 163.8 165.9 167.7 168.6 19.7 47.9 82.4
100.1 108.8 115.6 121.3 124.7 127.5 128.9 19.8 49.1 94.6
144.3 157.0 167.0 175.6 180.6 184.6 186.8 17.7 42.1 73.3
100.1 110.6 121.3 130.5 135.9 140.2
191.3 220.5 241.0 259.1 269.6 278.2 282.8
19.5 48.2 92.9
164.0 174.2 180.6 186.2 189.4 192.0 193.4 19.8 48.6 86.8
111.2 124.0 134.1 142.7 147.8 151.9 154.1 19.9 49.4 96.3
156.0 174.6 189.4 202.3 209.8 215.9 219.1
18.4 44.4 80.0
115.3 130.8 146.7 160.4 168.5 175.0
207.3 252.1 285.4 315.2 322.8 347.0 354.6 19.7 48.9 95.6
182.0 198.4 209.1 218.3 223.7 228.0 230.3
19.9 49.1 91.1
126.6 147.3 163.8 178.7 168.7 193.5 197.1 19.9 49.7 97.7
170.9 200.3 224.5 245.8 258.3 268.4 273.8
19.0 46.4 86.6
134.7 159.4 185.2 208.0 221.4 232.2
231.3 326.9 414.7 500.3 552.2 594.7 617.4
19.9 49.6 98.5
214.3 256.5 287.2 314.4 330.5 343.5 350.5 20.0 49.7 96.6
165.5 218.3 264.7 307.0 332.1 352.5 363.4 20.0 49.9 99.2
201.7 272.7 338.6 400.5 437.6 467.9 484.0
19.7 48.8 94.9
175.0 235.7 305.6 371.7 411.5 443.9
353

Table 93. (continued)
71.1 12.1 25.6 37.6 43.6 43.9 44.0 44.1 44.2 44.3 44.3 17.1 40.8 73.4
114.5 122.0 127.1 131.3 133.8 135.8 136.9 12.3 22.3 28.0 33.8 37.1 39.7 41.9 43.1 *"f*T • *•*
*T*"T • *
4.7 7.9 9.4
10.4 11.0 11.4 11.8 12.0 12.2 12.3 15.4 22.9 24.4 25.9 26.7 27.3 27.9 28.2 28.4 28.5
81.5 13.1 28.3 42.4 49.7 50.1 50.3 50.4 50.5 50.6 50.6 17.6 42.4 77.4
124.7 134.0 140.3 145.6 148.7 151.2 152.6 13.3 24.8 31.7 38.9 43.1 46.2 49.0 50.5 51.8 52.5 5.5 9.5
11.3 12.6 13.3 13.8 14.3 14.6 14.8 14.9 16.1 24.8 26.6 28.5 29.5 30.3 30.9 31.3 31.6 31.8
96.5 14.3 31.7 48.8 58.2 58.7 58.9 59.1 59.3 59.4 59.4 18.1 44.0 81.9
137.9 150.1 158.3 165.4 169.6 173.0 174.7 14.5 28.0 36.7 46.2 51.7 56.0 59.6 61.7 63.4 64.3 6.7
11.7 14.1 15.8 16.8 17.6 18.2 18.5 18.8 19.0 16.9 27.1 29.6 32.0 33.4 34.4 35.3 32.8 36.2 36.3
121.5 15.8 36.0 57.7 71.2 71.8 72.2 72.5 72.7 72.9 73.0 18.7 45.8 87.0
156.0 173.8 186.1 196.7 203.0 208.0 210.7
15.9 32.3 44.4 58.1 66.3 72.6 78.0 81.2 83.8 85.1 8.6
15.5 19.0 21.6 23.0 24.1 25.1 25.6 26.0 26.3 17.8 30.4 34.0 37.6 39.7 41.2 42.5 43.3 43.9 44.3
142.6 16.7 38.6 63.8 80.9 81.8 82.3 82.7 83.0 93.2 83.3 19.0 46.8 89.9
168.3 191.4 207.7 221.8 230.1 236.8 240.4
16.8 35.2 50.0 67.7 78.5 86.9 94.1 98.4
101.8 103.6 10.0 18.5 23.0 26.5 28.4 29.9 31.1 31.8 32.4 32.7 18.3 32.7 37.4 42.2 44.9 46.9 48.7 49.7 50.5 51.0
178.5 17.7 41.7 71.8 95.2 96.4 97.2 97.9 98.2 98.5 98.7 19.3 47.8 93.0
184.5 217.3 241.3 262.4 274.9 284.9 290.3
17.2 38.8 58.1 83.0 98.8
111.3 122.1 128.4 133.5 136.3 12.0 23.1 29.5 34.6 37.5 39.7 41.5 42.6 43.5 44.0 18.8 35.8 42.5 49.5 53.5 56.6 59.2 60.8 62.0 62.7
238.0 18.5 44.7 80.3
113.7 115.8 117.1 118.2 118.8 119.4 119.6 19.6 48.6 95.6
202.4 252.0 290.7 325.5 346.1 362.9 371.8
18.6 42.4 67.9
105.0 130.2 150.7 168.6 179.1 187.6 192.1 14.3 29.0 38.7 47.0 51.7 55.4 58.5 60.3 61.8 62.6 19.3 39.3 49.5 60.8 67.4 72.5 76.9 79.5 81.5 82.6
461.1 19.5 48.1 92.0
153.9 160.2 164.0 167.2 169.1 170.7 171.5 19.9 49.5 98.5
229.3 332.9 432.8 532.3 593.1 642.9 669.6
19.5 47.1 84.8
158.0 220.6 277.1 329.4 360.7 386.1 399.7
17.6 39.8 60.1 82.2 95.9
106.8 116.1 121.5 125.9 128.3 19.7 45.0 66.5 95.6
114.4 129.5 142.5 150.1 156.3 159.6

Table 94. The sequential file CLIMEAN.DAT for six sites in Bangladesh.
N.E. Barind tract
17.6 19.8 24.5 28.3 28.7 28.7 28.9 28.8 28.4 26.7 22.4 18.8
1.01 1.23 2.01 5.34 16.6 34.1 39.8 32.7 30.5 13.3 .950 .080
.159
.249
.386
.524
.532
.464
.408
.411
.364
.337
.220
.149
.213
.311
.459
.614
.640
.564
.493
.504
.445
.422
.285
.202
595. 678. 799. 879. 869. 736. 611. 654. 584. 666. 626. 587.
25.5
468. 530. 619. 679. 678. 593. 510. 533. 478. 525. 491. 462.
N. Tista flood plain 25.75
17.3 19.5 23.5 27.7 27.8 28.3 28.7 29.2 28.9 26.5 22.4 18.9
1.13 1.48 2.82 8.46 29.8 49.2 41.1 33.3 31.7 16.6 1.00 .140
.156
.240
.366
.488
.487
.436
.429
.431
.382
.347
.195
.149
.210
.311
.448
.584
.594
.532
.526
.527
.467
.431
.294
.198
571. 704. 798. 842. 831. 697. 690. 690. 617. 637. 576. 520.
451. 548. 618. 655. 653. 568. 562. 558. 500. 505. 457. 415.
Gangus tidal flood plain 22.5
19.6 22.2 26.6 29.0 29.5 28.7 28.2 28.3 28.6 27.7 23.9 20.5
1.59 1.90 4.81 10.4 19.6 42.3 45.1 39.5 28.5 19.0 4.23 .990
.215
.305
.435
.520
.524
.412
.396
.375
.400
.353
.260
.189
.271
.371
.513
.618
.631
.496
.482
.451
.488
.434
.327
.250
581. 654. 709. 779. 793. 585. 588. 532. 630. 622. 605. 601.
460. 516. 559. 613. 627. 492. 493. 452. 510. 497. 478. 473.
1. 1. 2. 4. 9.
19. 16. 16. 13. 6. 1. 1.
1. 1. 2. 4. 9.
19. 16. 16. 13. 6. 1. 1.
1. 1. 3. 6.
11. 16. 12. 16. 12. 7. 1. 1.
355

Table 94 (continued)
Chittagong hill tract 23.
19.6 21.6 25.4 27.8 28.4 27.8 27.4 27.3 27.7 27.1 24.0 20.7
Dacca se
18.6 21.2 26.0 28.8 29.3 28.6 28.1 28.5 28.5 27.1 23.2 19.3
Sylhet basin
18.5 20.6 24.1 26.4 26.8 27.2 28.0 28.0 27.8 26.2 22.9 20.0
1.74 2.88 5.86 13.4 25.1 49.3 54.3 46.9 30.8 15.8 6.36 3.81
.560
.530 4.65 8.99 24.7 32.8 33.4 33.9 23.5 15.2 10.8 3.44
1.96 4.74 8.18 31.5 49.4 97.3 73.5 60.0 42.5 17.6 3.53 1.80
.217
.308
.443
.549
.548
.463
.426
.430
.396
.350
.273
.198
.214
.312
.482
.597
.608
.469
.454
.454
.435
.386
.273
.163
.178
.261
.383
.442
.435
.374
.391
.382
.349
.320
.232
.168
.276
.380
.532
.654
.662
.559
.518
.529
.484
.423
.351
.258
.268
.373
.555
.690
.719
.561
.550
.547
.523
.467
.340
.240
.231
.325
.454
.531
.534
.456
.477
.467
.426
.402
.298
.214
588. 710. 788. 848. 863. 688. 644. 691. 629. 573. 666. 562.
587. 664. 738. 797. 847. 657. 675. 665. 630. 624. 625. 576.
574. 663. 720. 746. 744. 577. 606. 600. 560. 625. 604. 511.
465. 553. 612. 659. 674. 561. 531. 558. 509. 464. 520. 446.
24.
464. 522. 578. 625. 663. 540. 551. 541. 510. 497. 492. 455.
24.75
454. 520. 566. 591. 596. 488. 506. 498. 462. 497. 477. 409.
1. 1. 2. 5.
10. 15. 19. 15. 11. 7. 2. 1.
1. 1. 3. 6.
11. 16. 12. 16. 12. 7. 1. 1.
2. 2. 3.
11. 18. 22. 25. 24. 16. 8. 1. 1.
356

SUBROUTINE APPLE
459 - 487 At compilation the COMMON blocks, defined in WO-FOST.CMN, are inserted.
493 - 535 At initialization most variables are set to zero. In the default option the initial soil - moisture content is set equal to a moisture content at a matric suction of 100 cm. The soil - moisture contents at a matric suction of 100 cm and 16000 cm (wilting point) are calculated with Equation 27 and the maximum surface storage capacity with Equation 41. For the latter calculation, clod angle and slope angle are converted from degrees to ra-dians.The calculation proceeds with time steps of 1 day (DELT).
537 - 549 The total amounts of roots, leaves, stems and storage organs at initialization are determined from the total amount of dry matter at emergence or at transplanting, and the partitioning factors for the various plant organs at development stage equal to zero. The total amount of dry matter at initialization is supplied as a crop - specific variable in the plant data. If different sowing or planting densities are to be examined, this variable can be changed. Both the specific leaf area and the partitioning factors depend on the development stage. The leaf area index is calculated from the specific leaf area and the leaf weight. The contribution of photosynthetically active stems and/or pods is also taken into account, if it is of importance.
551 - 556 Write in the output file the soil texture class, the starting day of crop growth, the name of the crop species and that of the climatic data set. Subsequently, write in the output file the day number, the amount of roots, leaves stems and storage organs, the leaf area index, the groundwater depth, the soil - moisture content in the root zone and the development stage, all referring to the date of emergence or transplanting. An example of this output file is shown in Table 97.
558 - 569 The dynamic part of the calculations that is repeated every time step DELT starts here. If the development stage equals two, the crop growth cycle is completed and the calculations are terminated. The duration of the crop growth period is calculated here. Data on temperature, rainfall, gross C02 assimilation rate, potential evapotranspiration rate, potential evaporation rate and effective irrigation rate for day IDAY are derived from subroutine CLIMAT. With subroutine DAYLEN the day length is calculated as function of date and geographical latitude. The fraction of intercepted radiation is calculated according to Equation 5. If control parameter IWB equals zero, the simulation run is executed without taking into account the water balance.
357

573 - 581 The volumetric soil- moisture content at field capacity is calculated with Equation 27 for a matric suction equal to the groundwater depth. The matric suction is calculated with the same equation, solved in the opposite direction for the actual volumetric soil - moisture content in the rooting zone (Equation 68). The hydraulic conductivity results from Equation 30, solved for this matric suction. If the matric suction is higher than a texture-specific suction limit, Equation 31 is used. The maximum infiltration rate is determined by the actual sorptivity plus the transmission zone permeability (Equations 33 and 34).
585 - 590 The actual evaporation rate is calculated from the potential rate, taking into account the reduction due to soil - moisture content and shading by the vegetation (Equations 37, 40 and 71). If crop growth is calculated without water balance, the maximum instead of the actual evaporation rate is calculated. In the case that a water layer covers the field, evaporation takes place out of this water layer instead of from the soil.
594 - 599 The change in surface storage depends on rainfall, irrigation and evaporation. The actual infiltration rate is the maximum of either the calculated change in surface storage or the maximum infiltration rate. The maximum infiltration rate could be corrected for rainfall distribution and slope angle. However, these functions are not yet defined in the model and do not affect the infiltration capacity. Subtracting the actual infiltration rate and the maximum surface storage capacity from the calculated surface storage results in the runoff, which is integrated for the whole crop growth period. These relations are given as Equations 42, 43 and 44.
603 - 614 Below the root zone, the direction of water flow depends on the distance between the bottom of the root zone and the groundwater level and on the matric suction in the root zone. If the suction exceeds this distance, capillary rise will occur, the rate of which is calculated in subroutine RIJTMA. This upward water flow can, however, not result in a moisture content in the root zone above field capacity. In the reverse case, i.e. gravity potential exceeds matric suction, natural drainage will take place (Equation 48), but only the amount of water in the root zone in excess of field capacity can be removed.
618 - 637 The potential and the maximum transpiration rate are calculated according to Equations 51 and 52. The critical soil - moisture content is calculated in accordance with Equation 53, with a soil - water depletion fraction depending on potential transpiration rate and crop species. The actual transpiration rate depends on the soil - moisture content. The reduction in transpiration
358

rate applied here differs to some extent from that used in Section 3.2 (Equations 54 and 55), especially at high soil - moisture contents. Here the decrease in transpiration rate is directly proportional to the soil-air content, between 0.10 and 0.05 cm3 cm-3. Reduction in the transpiration rate does not occur in wet soil if the crop has air ducts (AIRDUC = 1).
641 - 642 The change in volumetric soil - moisture content in the root zone is determined by the balance between the actual infiltration rate, the rate of capillary rise, or drainage below the root zone, and the actual rate of evaporation and transpiration, taking into account the depth of the rooting zone (Equation 24). In the case that the simulation is executed without water balance, the actual rates of evaporation and transpiration are not calculated and the change in soil - moisture content is set to zero.
646 - 648 In situations where artificial drainage systems are available, the resulting drainage can be calculated with Equation 59, assuming that the depth of the groundwater table and the drains, the hydraulic conductivity of the soil, and the drain spacing and drain radius are known.
653 - 655 The depth of the groundwater table may change either by natural drainage or by capillary rise and artificial drainage (Equation 60). The pore space emptied or filled with water at a change in the groundwater depth is supposed to be equal to the air - filled pore fraction in the root zone. When groundwater enters the root zone, the change in groundwater depth and the change in soil - moisture content are calculated in a different way. The groundwater depth (ZTF) and the soil - moisture content (SMF) obtain fixed values at the moment that the groundwater enters the root zone (lines 775 - 777, 783 - 785). The change in groundwater depth is then calculated from the rates of infiltration, evaporation and transpiration using the fixed air-filled pore fraction. The relative change in groundwater depth, in comparison to ZTF, is multiplied with the fixed air - filled pore fraction to obtain the change in soil - moisture content.
665 - 679 The development rate before flowering depends on day length and temperature. After flowering, the development rate only depends on temperature and differs from that before flowering at the same temperature. The specific leaf area of the growing material and the partitioning factors for dry - matter allocation to leaves, stems, etc., depend on the development stage and are obtained by linear interpolation in crop-specific tables (Section 2.2).
683 - 689 The gross rate of C02 assimilation depends on the potential gross assimilation rate, the fraction of intercepted radiation and
359

the actual transpiration rate (Equation 5 and Section 3.3). The potential gross C02 assimilation rate is calculated before and added to the climatic data. The maintenance respiration rate depends on the amount of dry matter in the various plant organs, the relative maintenance respiration rate per plant organ and the temperature. It cannot exceed the gross assimilation rate, i.e. it is assumed that the vegetation will not be *self-destructive' in terms of carbohydrates. Gross assimilation rate minus maintenance respiration rate results in the amount of assimilates available for conversion into structural plant material (Equation 6). The conversion efficiency of carbohydrates to structural plant material is calculated as the weighted average of the efficiencies for the various plaftt organs.
693 - 748 The growth rate of roots, leaves, stems and storage organs depends on the total dry matter increase of the crop, the partitioning factors and the death rate of each of the plant organs. Roots and stems start to die after development stage 1.5 has been reached. Dying of the leaves often starts earlier, because leaves not only die when the oldest leaves exceed their lifespan (DALV), they also die at an increasing rate with increasing water stress, i.e. a decrease in the ratio of actual transpiration rate to the maximum rate (DSLV1). In addition it is assumed that due to self - shading, the leaves in excess of a leaf area index of 7 will die (DSLV2). The growth rate of the leaves is calculated separately per time step, i.e. per day, via LV(1) = GRLV x DELT (line 727); at the same time the corresponding leaf area is calculated. Each day, leaf weight and leaf area are shifted by one class via lines 725 and 726. To the oldest class of leaves, the amount of leaves present at emergence or at transplanting is added (line 729). Leaves that have exceeded their life span will die (DALV = LV(ISPAN); line 721). However, if those leaves died because of stress (DSLV), dying due to senescence is suppressed (via line 709). If the amount of leaves from the earliest date, (LV(IL)), is insufficient to cover leaf death from stress, leaves that are 1 day, 2 days, etc., younger (LV(IL- 1), LV(IL-2) etc.) will die (line 715). Thus, dying of leaves due to water stress takes place at the cost of the oldest leaves. The total leaf area is the result of combining the leaf areas of all leaf age classes (line 734).
752 - 759 The development stage and the dry weights of living roots, leaves, stems and storage organs are calculated from the amount at time t and the development or growth rate during time step DELT. Combining the dry weights of the living plant organs results in total above-ground dry weight and total dry weight (living) of the crop.
360

761 - 769 The dry weight of dead roots, leaves, stems and storage organs are calculated from the amount at time t and the death rate during time step DELT. The total dry weights of roots, leaves, stems and storage organs result from combining the weights of the living and the dead plant organs.
774 - 785 The soil-moisture content in the root zone follows from the rate of change in soil - moisture content, but it is confined between the moisture content of air-dry soil and that of almost saturated soil, respectively. When groundwater enters the root zone, fixed values for soil - moisture content (SMF) and for groundwater depth (ZTF) are established (lines 775 - 777 and 783 - 785). Subtracting the actual infiltration and runoff from the total surface storage, which is the total of the original surface storage plus the balance of rainfall, irrigation and evaporation (line 594), results in the new surface storage. The groundwater depth is determined by the change in groundwater depth, but it is confined between a minimum and a maximum value, which are specified for each land unit (lines 40 and 41), as a function of physiography, river level, etc. Root extension ceases when rooting depth has attained its maximum value.
786 - 796 For crops with air ducts this part is not relevant. When the rooting depth is less than 10 cm above the groundwater level, root extension ceases because oxygen shortage prevents it. When groundwater enters the root zone, roots are dying and the rooting depth decreases. When the amount of assimilates partitioned to the roots becomes zero, root extension will be zero too. The number of days the rooting depth is less than 10 cm is calculated via RTDF. After five days of waterlogging (RTDF = 5), a message of crop failure is printed instead of dry weights of plant organs, etc., and the calculation is terminated.
798 - 800 The green area index (leaf, pod and stem) is calculated from the specific areas and the weights of leaves, stems and pods. The rooting depth results from integration of the root extension rate. Water use by transpiration during the whole crop growth period is obtained by integrating actual transpiration.
TEMPORARY OUTPUT
804 - 817 Every 10 days, the date (Julian calendar day), the dry weights of roots, leaves, stems and storage organs, the leaf area index, the groundwater depth, the soil - moisture content and the development stage are written in the output file (Table 97). The calculations are then continued for the next day. When the development stage reaches two or the leaf weight becomes zero, crop
361

a
-•-»
•a
< Q H
<
a.
ctf
c
43
W ^ Q CM «n VO Os
o o o « s o . ^ o % ^ © © * * © * © © ^ © © ' o o o o o
Tf ON ^ ON * O O
© * " " o * ' © ' ^ © CM* © © ' o d o d d
ON O VO 5 »^ CM < n r o
' © * " * d " * d * " © ^ © © ' d d d d d
ON 00
CM CM m r ^ o o r n o o f^oo ^ ON m ^ 9 # ©
o o © « - < © © © © © © ©
m CM m r*» «o ONOO —« i> © ro © # ^ CM —< oo w^ ©
" d * * © -** * © * * © * © © ' © © ~ © ©
CM CO r ^ © . ^ i**; . ^ ^ , <*) » ON ^ ^ ©
" ̂ ' * © * * © " * © * © © ' d d vi 6 d
CM ON CM CM CM OO «0
vo CM © ^r ~* ^ co ^ r^ »—i © © ^ © © © © © © © © ^** © ©
»—( i—< V© *-^VO CMC** oo CM* G. © * * CM " * CM* " ' © * © © CM © © «0 © ©
© CO
—•• » 0 —« CM . O . <0 ^ «0 VO
© " © ' ' © ^ ' © © " © © © © # © © © © ©
© © »o «o vo CM ' " © " - * © ' ~ © # CM* © © © © © © © © ©
ON
H
<
362
cs o 00 oo
© ~* o o
VO f̂ ON ^t ON t̂ ON
O O O O <N O O
ON TJ- m m rN r̂ oo
© ~* © © ©
«r> S r̂ © © co oo moo m oo o -H O o o
co t̂
ro cj r* o
•o <s r-C* o
*r\ Tt »n en
»o vo Tf vo
<N •O
o o
^tONr»o n r* n r*- csr- ON o o
m vo r ) N h ON «n ^ H » O
o o T f v o c N O f n o « n ^ t •^r«o ~ © o o o o o o
f") 00 © ^H VO ~H vo *-« vo 00 c4 * c4 ' 6 6 ri CN
<N <s
«o *r\ 00 —« 00 v->
«-H
o <n r»
VO O ^ ^ ON «O
VO ON O ^
~ O o o o o
T3 3
•S n o
ON
15 a
<N r- © © m «o «o m *©"•-*© «—" O ^ © © © ©
00
>
X
U 2
363

© © © © © " d
vo © © d © © ' d
vo ̂ t
o o o o o
o o o o o >—•
o o «-« o o
Tf ON
© © </̂ © ©
VO 00 ̂ t
© © ̂ © ©
CO 00
© © »o CO
o o
oo ^ oo «o
O O O O O
n r* © © © © ©
c o o
ON
Xi
H
364

S o Pi
O en
Pi
Pu o
* ©
• • •
o VO O
• • •
o
ON
m
o o ^ o o
CO CO . co ©
O CO P4 W Pu
x t OS ^ t ON »o ~ o CJ © ©
CO ON > ^
< Pu . CO O
> Pi w VO "*fr
<N O 00 —« »o co co rf
~H O O
04 > u
o > u
J > u
<s t^
•
CO t^
•
•
H CO ^
U4 a*
H PN erf w PH
Q Pi w Pu
<s o
<N ©
CO
O •
U ON 5 °° > O
Q d
O
CO 0 0 CO 0 0 ^f ON
~< O O
co r* co O • • •
~ ©
ON OO «-•* 00 «o
o ©
CS t^ c* r» CO 0 0 ON
O O
psj cs pi - :
U oo * £ > o Q '
0 0 CO
. . . - « O o o o
o 2 <N o
*r\ CO
s p<
^H vo ~* vo <s r- oo CJ c* o o
o
u a o
vd
ON
2
u D Q
2 <
Pi u
< m O
13 Pi
O
Pi o
§2
CO
Q d
© CO
CQ H Pi Pu
•
•
O •
•
O
*-*
© CO
0h
CQ H
Pu
•
•
O
•
•
•
O
•
(1,3
0)
0. .62
CQ
CO . ^ PH O
o o o
cs
o co
CQ H ^ • ^ • • •
b O O O
365

o o o o o o
vo o o o o o o
VO ^
o o o o o o
V *
o o o o o o
CO
o o o ~ o ©
"** ON
o o o *r\ © O
<N «0 VO
00 ^
o o *- o o
C) 00
<s o o *r\ © O
.s o
as
H
fN
o o o
< ^ • 4 • • •
CO o o o
oo —« oo «o
S° ° ° o
Pi Q > £
O O O CO cs r*
366

growth is terminated. In that case the same variables that are written every 10 days are saved in the output file for the last time.
818 - 825 The calculated weights of leaves, stems and storage organs, the growth duration and the total water use by transpiration for the potential production situation are renamed to be distinguished from those of the water - limited production situation.
SUBROUTINE CLIMAT
833 - 861 At compilation the COMMON blocks, defined in WO-FOST.CMN, are inserted.
862 - 871 Air temperature, potential evaporation rate, potential evapo-transpiration rate and effective irrigation are read from the climatic tables by linear interpolation for a given day number, designated RI40. With the exception of temperature, these data have to be converted from monthly to daily values. Depending on crop type, the gross assimilation rate on a given day is reduced in the case of sub-optimum air temperature. In addition, the assimilation rate expressed in carbon dioxide is converted to carbohydrates. Daily rainfall is obtained from subroutine RAINDA, using the data on monthly rainfall and the number of rainy days per month.
SUBROUTINE RAINDA
874 - 885 Rainfall on a given day is calculated in this subroutine from the total monthly rainfall and the number of rainy days per month. A data statement is given with 30 random numbers, i.e. the random day numbers in a month. From the given yearly day number (IDAG), the monthly day number (ICD) and the month number (ICM) are derived by using the data statement IDGN that contains the numbers of the first day per month.
887 - 902 Random day numbers (IRAND) are compared with the present day number (ICD) for an equal number of repetitions as the number of rainy days (RDA). If these day numbers are equal, rainfall (RN) on the given date is calculated from the monthly rainfall (RTB) for the given number of rainy days. Otherwise the rainfall on the given date is zero.
SUBROUTINE RIJTMA
909 - 944 The capillary rise is derived here from the tables of Rijtema (Tables 21-34). In these tables, the rate of capillary rise
367

(CCR(8)) is given as a function of the distance between the bottom of the rooted zone and the groundwater level (R(8, 10)) and the matric suction in the root zone (CMH(IO)) for each texture class. If the matric suction is less than 20 cm, the tables cannot be used. In that low suction range, capillary rise is calculated with Equation 44. If the matric suction equals 20 cm, the values of R(l, 1) to R(8,1) are used. If the actual distance is smaller than R(l,l) or larger than R(8,l), the capillary rise is 0.5 or 0.0 cm d"1, respectively. Otherwise, the actual distance is compared with the values of R(2,l) to R(8,l). If, for example, the actual distance, Dj, is less than or equal to R(5,l), the slope of the function is first calculated as:
SLOPE = (CCR(4) - CCR(5))/(R(4,1) - R(5,l)) and the resulting rate of capillary rise is:
C = CCR(5) - SLOPE x(R(5,l) - Ds) If the matric suction is equal to or higher than 16000 cm, the values of R(l,10) to R(8,10) are used. The same method is used as for a soil suction of 20 cm. Thus the capillary rise is 0.5 or 0.0 cm d -1, if the actual distance is smaller than R(l,10) or more than R(8,10), respectively. Otherwise, for example:
SLOPE = (CCR(4) - CCR(5))/(R(4,10) - R(5,10)) C = CCR(5) - SLOPE x(R(5,10) - D;)
If the actual matric suction is between 20 and 16000 cm, this suction has to be compared with the soil suction data given in the array CMH. If, for example, the actual suction is less than or equal to CMH(4), the slope of the relation between matric suction and distance is obtained from :
SLOPE = (R(I,3) - R(I,4)) / (CMH(3) - CMH(4)) and the resulting 8 values (I = 1,8) for the distances VMH obtained from interpolation for the actual matric suction values are:
VMH(I) = R(I,4) - SLOPE x (CMH(4) - RMH) In this case, too, the capillary rise is 0.0 or 0.5 cm d"1, respectively, if the actual distance is larger than the highest (VMH(8)) or smaller than the lowest value (VMH(l)) of the distances found by the interpolation. Otherwise the actual distance is compared with VMH(2) to VMH(8). If, for example, the actual distance is less than or equal to VMH(5), the slope of the relation between capillary rise and distance in the table is obtained from:
SLOPE = (CCR(4) - CCR(5)) / (VMH(4) - VMH(5)) and the resulting rate of capillary rise is: C = CCR(5) - SLOPE X (VMH(5) - DJ
368

SUBROUTINE DAYLEN
950 - 955 Day length is calculated here as a function of geographical latitude and declination of the sun. The declination is a function of the date.
FUNCTION ASIN
956 - 965 The arcsine function is, for example, used in the calculation of the day length. It is approximated here with the equations given because the microcomputer used does not have an arcsine function in its FORTRAN library.
SUBROUTINE NUTRI
972 -1000 At compilation the COMMON blocks, defined in WO-FOST.CMN, are inserted.
1002 -1008 The base uptake of phosphorus and nitrogen obtained from independent data (Section 5.3) is given for a crop with a growth period of 120 days. For crops with shorter or longer growth duration, the base uptake is reduced or increased. The data for this relation are given in BLOCK DATA. The recovery fraction of applied fertilizers is also defined independently. The country to which this example applies (Bangladesh) showed only small variations in base uptake and recovery fraction, so only one value for all soil types is used. In a different situation, tables may be included relating the base uptake and the recovery fraction to soil texture class, land unit, region or soil type. The variables MANF1 and MANF2 are one at this moment, but they offer the possibility to express differences in capability of farmers to increase the recovery fraction of applied fertilizer or the base uptake, for example by split application of fertilizer, better seedbed preparation, water control, etc.
1009 - 1012 The required nitrogen uptake for the potential production situation is obtained by multiplying total dry weight of crop residues by their minimum nitrogen concentration and adding the product of dry weight of storage organs and their minimum nitrogen concentration. The calculation method for the nitrogen requirement in the water - limited production situation is identical to that for the potential production situation, but the amounts of leaves, stems and storage organs may be smaller due to water stress. The amount of nitrogen to be applied as fertilizer for potential or water - limited production is determined from the nitrogen requirements in these production situations minus the
369

base uptake, divided by the recovery fraction of applied fertilizer.
1014 - 1024 In the case that no fertilizer is applied, the nitrogen uptake (base uptake) in Production Situation 3 is a fraction of the nitrogen uptake in the potential production situation. The amount of plant organs produced when no fertilizers are applied is reduced in proportion to this fraction. When, in addition to nitrogen, water also limits crop growth at some stage, the amounts of plant organs produced are assumed equal to the minimum amount found at either situation. The required nitrogen fertilizer application is calculated, both for the potential and for the water — limited production situation.
1029 - 1044 If leguminous crops are considered (CROPT = 4), the nitrogen requirement is largely met by symbiotic nitrogen fixation. Therefore phosphorus is the nutrient limiting the growth of legumes. The total phosphorus requirement, the required phosphorus fertilizer application for the potential and the water - limited production situations and the amount of plant organs produced without fertilizer application are calculated in the same way as described for nitrogen (lines 1009 - 1024).
1047 - 1051 Write in the output file on unit IPS: the amount of nitrogen or phosphorus to be applied for potential and water - limited production; the base uptake of nitrogen and phosphorus for a crop with a growth period of 120 days; the recovery fraction of applied nitrogen and phosphorus fertilizer; the minimum and maximum groundwater depth; the required fertilizer nutrient application for potential and water - limited production; the total water use by transpiration of crops growing in the potential and water-limited production situations; total surface runoff; dry weight of leaves produced in the potential and nutrient — limited production situations; dry weight of stems produced in the potential and nutrient - limited production situations; dry weight of storage organs produced in the potential and nutrient-- limited production situations; dry weight of leaves in the water — limited and water — plus — nutrient — limited production situations; dry weight of stems in the water — limited and water — plus — nutrient — limited production situations; dry weight of storage organs in the water and water — plus — nutrient — limited production situations. An example of this output file is shown in Table 97.
370

R >> cd
T3
c<3 C/3
C • P H
C3 | H H |
cu T3 O O
p ^
UH
ctf • * - »
co • ^ H
H •
<u
6 U
<u VMBW4
c • fc- l
3
3 o
•
ON
2 r 0 0
H
VO CO to
O
3 ••—> X 0> H
N *Cd
s o i *
U
O f O h ^ O O h M O O
•-H ^H «-H ^H CN
C/3 > <
Q o o o o
c o m c j c o c o c o m m c o * 5 c o c o c o c o c o c n c o c o c o
c o o o o o o o o o o
H 8 8 8 8 8 8 8 8 8
N O 0 0 ( S 0 0 0 0 0 0 0 \ 0 \
;* • • • • • • • • •
O O O O O O N O N Q ^ H V O
T f O M r f vo vo
R > * C3
•a C3
•4-»
c *^"4
cS ^••4
a* "O
o o ^ • • ^
UH
a 4 - » CO
• »* H
•
a>
£ • w *
U
^ M ^ O V O O O O O O O ^ n i-J V O N T J - ^ - H - H I O V O
!>• ^ ( S (N <N (N (N ^
n w i - v o t s o o ^ ^ f s P£ o o T t - ^ H T j - x t O N r ^ v o
VO
.2 < 8 § 2 < N m - ^ «o vo r -
CO co
a ^•^4
O
3 X a> H
Ctf
s a o u. U
O c o r - ^ o o r ^ o o o o < n O > n ^ o o v O T t H < N « O t - » O C N « O Q 0 O
O ,"H *"•* ^^ »-* <N
c o v o r ^ o c N o o o o r ^
• • • • • • • • •
c o o o o o o o o o o
o> c **"> s VO c
p vo oo r» c 5 »o vo oo c J H V O O C
? *"> 5 vo 5 co
ON t ^ »o
N <s - * cs
( S O ( S < O ^ O V O ^
O o o o > o o « o r » < N t ^
VO
s
o C/3
O O O O 0 N 0 0 T t ^ t » O r - cs oo oo oo ( S o o n n n
^ O O v f i r t T f f O O V h ^ (S (S N »H »H
i-J V O C S T t O O O S V O ' - H O t > < N r ^ « o ^ - ^ o o t ^ v o
r ; o o T f r ^ < o v o v o - ^ c o c o K O O T f N O \ O W O O M > * — i v o o o o o o o o o r ^ - v o
< " Q O \ C 7 \ 0 \ O v O \ 0 \ 0 \ V O
371

Table 97. (continued)
nmaxo nmaxw nbas nrec ztmi npeo wuseo
LVOPT STOPT SOOPT
TWLV TWST TWSO
=
=
=
=
= —
= =
• M V
=
=
Z»
=s
S 3
311. 51. 30. 0.25 0.
311. 25.5
2818. 4273. 6816.
1926. 2447. 1385.
pmaxo pmaxw pbas prec ztma npew wusew tsr
LVBAS1 STB AS 1 SOB AS 1
LVBAS2 STBAS2 SOBAS2
=
=
=
=
=
=
=
=
222
=
=
=
=
zzz
0. 0. 5. 0.10
200. 51. 9.2 0.0
545. 826.
1318.
545. 826.
1318.
9.1.3 Variable data base of the simulation model
In the preceding subsection a description was given of all the relations and data that are used in the simulation model. To apply the model it is not necessary to specify all these data and relations. Therefore a summary is given here of only those data that have to be changed to adapt the model to a particular situation. If no specific data are available, the default values can be used or intelligent guesses may be made. For each part of the model, the data and the specifications of the data files are given. A list of the variables with their definition is given in Subsection 9.1.5 and more information is supplied in Subsection 9.1.2.
WOFAUTN
Lines 36 - 50: CLIMT, SOILTY, SURROT, SALT, ZTMIT, ZTMAT, LUSTXT, CONV, HVL, IDISR, TAB1, TAB2. It is assumed in the present set - up that the land unit determines a unique combination of the texture classes, climatic data, surface roughness, slope and clod angle, and minimum and maximum groundwater depth from these arrays. That is of course not always so and in that case program statements have to be changed. The relative area of a land unit with a particular texture class is specified in LUSTXT. If the harvested product is required in an other form (Subsection 9.1.2), other data for CONV have to be introduced. Sometimes more specific information on harvest losses (HVL) or on the effects of pests and diseases (TAB1, TAB2) may be available, which can replace the^data given here.
372

lines 54 - 59: The numbers of the land units and the crop species or cultivars (Table 91) and the day number of the start of crop growth for which the calculations have to be carried out, are read from the file WOFOST.IN according to FORMAT no. 1002 (line 62). SOILDATA.RDM, RIJTEMA.RDM and CLIMEAN.RDM are random access files containing data on soil characteristics, capillary rise and climate, respectively. To change the contents of these files, first the sequential files with the same data, called SOILDATA.DAT, RIJTEMA.DAT and CLI-MEAN.DAT, must be changed. The contents of these files are described later in subroutines SOILR, CRDAT and CLIMIN. With the program RANDOM, these sequential files are transformed into the random access files SOILDATA.RDM, RIJTEMA.RDM and CLIMEAN.RDM. After that, the calculations of crop growth can be executed with the new data set. PLANT-DAT.RDM is a random access file containing data on crop characteristics. To change this file it is necessary to change first the sequential file containing the same data, called PLANTDAT.DAT. The contents of this file are described in subroutine PLANTR. With the program RANDOMP this sequential file is transformed into the random access file PLANTDAT.RDM. After that, the calculations of crop growth can be executed with the new data set. RESULT.DAT is the output file (lines 59 and 149 - ' 151), containing the land unit, the texture class, the relative area of the land unit with a particular texture class, the starting date of crop growth, total transpiration for potential and for water - limited production and total surface runoff during the crop -growth period and the additional yield per unit applied nitrogen or phosphorus (legumes only) fertilizer nutrient, the crop growth duration and the production of leaves, stems and storage organs in the potential and water-limited production situation and in the nutrient - limited and water - plus - nutrient-limited production situation, both without and with reduction for the effects of pests and diseases.
lines 88 - 91: NBASE, NREC, PBASE, PREC The base uptake and the recovery fraction for both phosphorus and nitrogen will often depend on soil type or soil texture, land unit or region; then a data array may be given, preferably based on experimental evidence.
BLOCK DATA (lines 162 - 207)
lines 194 - 200: These data are default values that are used if no data for these variables can be derived from PLANTDAT.RDM or SOILDAT.RDM. It is not necessary to change these values, unless to do calculations for a specific combination of
373

data that is not yet available via data files SOILDAT.RDM and PLANT-DAT.RDM.
lines 202 - 206: The relation between air temperature and the reduction factor for gross assimilation rate and that between the crop growth period and the base uptake should be changed only if other pertinent data are available.
SUBROUTINE SOILR (lines 234 - 275)
Soil characteristics per texture class are read from SOILDATA.RDM. The sequential file SOILDATA.DAT (Table 92) contains data for 14 soil texture classes. Normally this file does not need any change except for very particular soil types. A complete description of the required soil characteristics per texture class is given in Subsection 9.1.2. When alternative soil characteristics are inserted in the sequential file, it has to be transformed first into the random access file SOILDATA.RDM with program RANDOM, before calculations can be executed for these new data.
SUBROUTINE PLANTR (lines 277 - 332)
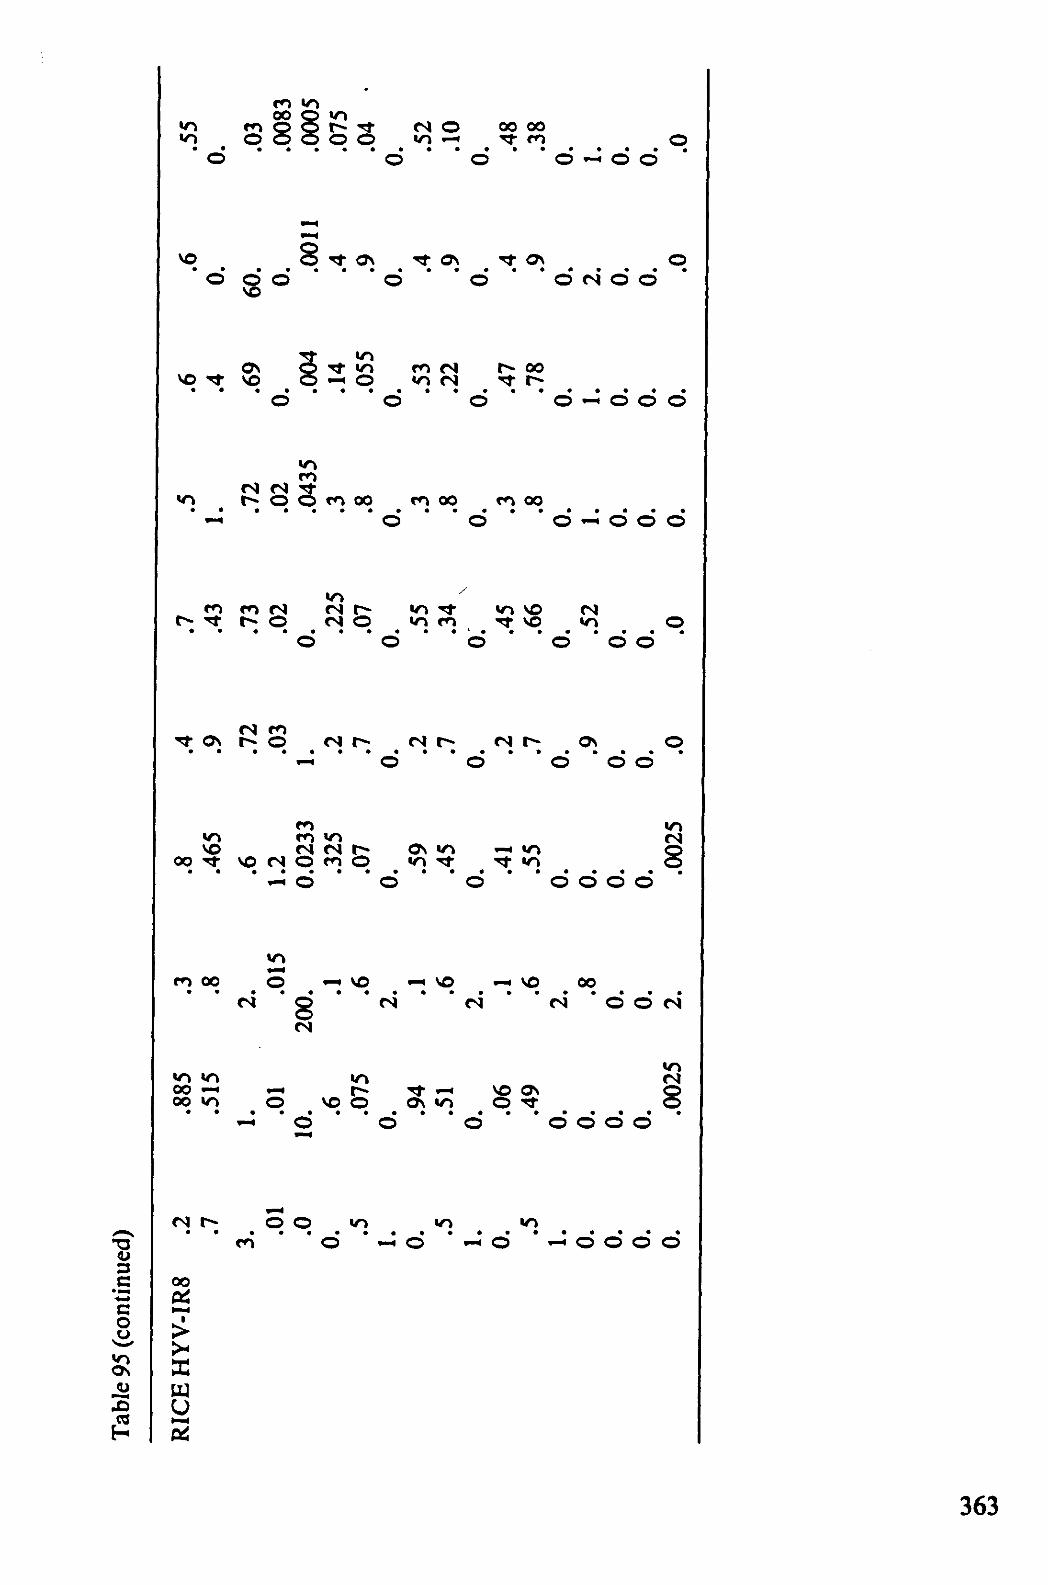
Data on crop characteristics per species or per cultivar are read from random access file PLANTDAT.RDM. To change this file, first modifications must be introduced in the sequential file PLANTDAT.DAT. After that the sequential file is transformed into the random access file PLANTDAT.RDM, with the program RANDOMP. For any crop species or cultivar the crop characteristics, as specified in Table 96 for wheat, as an example, are required. A complete description of these crop characteristics is given in Subsection 9.1.2. In Table 95 a part of the file PLANTDAT.DAT is given that refers to the high yielding rice variety IR8 and wheat, respectively.
SUBROUTINE CRDAT (lines 334 - 375)
Data on the rate of capillary rise as a function of the distance between the bottom of the root zone and the groundwater level, on one hand, and the matric suction in the rooted zone on the other hand (RIJTEM(10,8)), are read from random access file RIJTEMA.RDM. The sequential file RIJTE-MA.DAT (Table 93) contains data for the 14 soil texture classes (Tables 21 -34). Normally this file does not need any change except for very particular soil types. With the program RANDOM this sequential file has to be transformed into the random access file RIJTEMA.RDM before calculations can be executed for new data.
SUBROUTINE CLIMIN (lines 377 - 453)
374

Climate data are read from random access file CLIMEAN.RDM. The sequential file CLIMEAN.DAT (Table 94) contains data for six regions of Bangladesh. A complete description of the required climatic data per region is given in Subsection 9.1.2. When other climatic data are inserted in the sequential file, it has to be transformed first into the random access file CLIMEAN.RDM with program RANDOM before calculations can be executed with these new data.
SUBROUTINE APPLE (lines 455 - 829)
In this part of the program, the dynamic calculations of the water balance and crop growth are executed. For each time step, i.e. each day in the present version, all relevant calculations are updated. This continues until the development stage of the crop equals two. All data used for these calculations are derived from subroutines SOILR, CRDAT, PLANTR and CLIMIN, which are treated above. lines 551 - 556, 808 - 810, 817: Every ten days, day number, dry weight of roots, leaves, stems and storage organs, leaf area index, groundwater depth, volumetric soil - moisture content in the root zone and development stage are stored on unit ISP, i.e. are printed (Table 97), because ISP is set equal to one via line 86 in program WOFAUTN. When the calculations of both the potential and water - limited crop growth calculations are completed, the remainder of Table 97 follows from subroutine NUTRI.
SUBROUTINE NUTRI (lines 968 - 1067)
The required data for the calculations in this subroutine are specified in program WOFAUTN. After completion of the crop growth simulation in subroutine APPLE, the resulting data on crop growth are printed. Below these tables, the results calculated in subroutine NUTRI are printed, i.e. the amount of fertilizer nutrients to be applied for potential and water - limited production, respectively, the base uptake and recovery fraction per nutrient, the minimum and maximum groundwater depth, the additional dry-matter production per unit applied nutrient, the total water use in transpiration, the total surface runoff, the dry weights per plant organ for the various production situations. An example of this output file is shown in Table 97. More detailed information about the printed variables can be found in Subsection 9.1.2.
9.1.4 Listing of the model (see appendix A)
375

9.1.5 List of acronyms
Acronym Description
ADMI AIRDUC ASRC
CCR(I)
CLIM CLIMT
CLM CLMNAM
CLODAN CLODAR CMH(I)
CONV (ICROP)
CRMD CROP CROPT
CRPNAM CVF
CVL
CVO
CVR
CVS
D
DAGLEN DALV DD
above - ground dry - matter increase indicates presence of air ducts in plant (logical) carbohydrates available for dry - matter increase values of rate of capillary rise in Tables 21 to 34 per soil texture class variable indicating particular climatic data set array containing variables indicating climatic data set per land unit variable indicating climatic data set name by which climatic data set is designated (alphanumeric) clod/furrow angle clod/furrow angle values of matric head used in Tables 21 to 34 per soil texture class
conversion factor from Calculated dry - matter production to marketable product per crop species rate of capillary rise or of natural drainage crop species or cultivar crop type: C3 (tropical or temperate), C4, leguminous name of crop or cultivar (alphanumeric) average efficiency of conversion of assimilates into plant dry matter efficiency of conversion of assimilates into leaf dry matter efficiency of conversion of assimilates into storage organ dry matter efficiency of conversion of assimilates into root dry matter efficiency of conversion of assimilates into stem dry matter distance between groundwater and rooting depth day length, in subroutine DAYLEN death rate of leaves as a result of ageing drain depth of artificial drainage system
Units
kgha-'d"1
unitless
kgha-'d'1
cmd'1
unitless
unitless unitless
unitless degrees radians
cm
unitless cmd"1
unitless
unitless unitless
Kg Kg
Kg Kg
kg kg
kg kg
kg kg
cm h kgha-'d"1
cm
376

Acronym DECL DELT DISFAC
DL DLC DLO DMAX DMI DRA DRAINS DRLV DRRT DRSO DRST DSL
DSLV
DSLV1 DSLV2 DSP DVR DVRC DVRC1
DVRC2
DVRED
DVRET
DVRETB
DVS DWLV DWRT DWSO DWST DZ E EO
Units degrees d
unitless h h h cmd"1
kg ha"1
cm unitless kgha-'d"1
kgha^d"1
kgha^d"1
kgha^d"1
^ - 1
- i
Description declination of the sun time interval of integration reduction factor for crop production due to pests and diseases day length, in subroutine APPLE lower threshold day length for development optimum day length for development rate of artificial drainage rate of dry - matter increase of the crop drain radius presence or absence of drains (logical) total death rate of leaves death rate of roots death rate of storage organs death rate of stems variable indicating development rate being a function of temperature death rate of leaves due to water stress or due to a high LAI kgha~!d_1
potential death rate of leaves due to water stress kg ha"1 d"1
potential death rate of leaves due to a high LAI kg ha"l d"l
drain spacing actual development rate of the crop maximum development rate of the crop maximum pre - anthesis development rate of the crop maximum post - anthesis development rate of the crop reduction factor for development rate; function of day length reduction factor for development rate; function of temperature table of reduction factor for development rate; function of temperature development stage of the crop dry weight of dead leaves dry weight of dead roots dry weight of dead storage organs dry weight of dead stems rate of change in groundwater depth actual soil evaporation rate potential soil evaporation rate
cm d"1
d"1
d"1
d"1
unitless
unitless
unitless unitless kg ha"1
kg ha"1
kg ha"1
kg ha"1
cmd"1
cmd"1
cmd"1
377

Acronym EOTB(I)
EL EM ETO ETOTB(I)
EXC FINT FL
FLTB FO
FOTB FR
FRBASO
FRTB FS
FSTB GASS
GDUR GDURO GEOP
GP
GRLV GRRT GRSO GRST GWLV GWRT GWSO
GWST HVL(ICROP)
Description table of potential soil evaporation rate versus day number evaporation rate from surface water layer maximum soil evaporation rate potential evapotranspiration rate table of potential evapotranspiration rate versus day number extinction coefficient for total radiation fraction of radiation intercepted by the crop fraction of shoot dry - matter increase partitioned to leaves table of FL versus development stage fraction of shoot dry - matter increase partitioned to storage organs table of FO versus development stage fraction of total dry - matter increase partitioned to roots base uptake as fraction of total nutrient uptake in the potential production situation table of FR versus development stage fraction of shoot dry - matter increase partitioned to stems table of FS versus development stage actual gross assimilation rate of the canopy expressed in CH20 variable indicating crop - growth duration counter for crop - growth duration geographical latitude of location, in subroutine CLIMIN geographical latitude of location, in subroutine DAYLEN rate of increase in leaf dry matter rate of increase in root dry matter rate of increase in storage - organ dry matter rate of increase in stem dry matter net rate of increase in leaf dry matter net rate of increase in root dry matter net rate of increase in storage - organ dry matter net rate of increase in stem dry matter fraction harvest losses per crop species
Units
unitless cmd"1
cmd"1
cmd""1
unitless unitless unitless
unitless unitless
unitless unitless
unitless
unitless unitless
unitless unitless
kg ha"1
d d
degrees
- i
degrees kg ha"1
kg ha"1
kg ha"1
kg ha"1
kg ha"1
kg ha"1
kg ha"1
kg ha"1
unitless
'd-1
'd-1
•d"1
•d"1
•d"1
'd"1
•d"1
'd-' i
378

Acronym HRD
ICROP IDAG
IDAY IDISR (ICROP)
Description difference between matric head and gravity head at rooting depth rank number of crop species number of Julian calendar day in subroutine RAINDA number of Julian calendar day
Units
cm unitless
unitless unitless
subdivision of crops in species being more and less susceptible to pests and diseases (logical)
IHP(ICROP) variable indicating plant organ 1. leaves; 2. stems; 3. storage organs unitless
IL counter for days after emergence d IOPT parameter allowing omission of crop - growth
simulation without water balance unitless IPS output control parameter, determining the unit
on which the output of the crop - growth simulation is written unitless
IRAND table containing 30 randomized (day) numbers unitless ISP AN life span of leaves d IWB parameter allowing choice between crop growth
simulation with (1) or without (0) water balance K0 KMH LA(I) LAI LASUM LUNIT LUSTXT
LV(I) LVBAS1
LVBAS2
LVOPT MANF1
MANF2
MH MHMAX
cmd"1
cmd"1
ha ha"1
ha ha""1
ha ha"1
unitless
saturated hydraulic conductivity hydraulic conductivity at MH array containing leaf area growth per day green area index (leaf, pod and stem) total green leaf area rank number of land unit array containing relative area of land unit with particular soil texture class unitless array containing leaf dry weight growth per day kg ha"l
nutrient - limited dry - matter production of leaves kg ha water - plus - nutrient - limited dry - matter production of leaves potential dry - matter production of leaves factor accounting for effect of farmers capability on recovery fraction factor accounting for effect of farmers capability on base uptake unitless actual matric head in root zone cm texture - specific suction limit cm
- i
kg ha l
kg ha"1
unitless
379

Acronym MRES
MT NBAS
NBASE
NEO
NEW
NEOC
NEWC
Description Units maintenance respiration rate crop at average air
NMAXO
NMAXW
NOPT
NPERSO
NPERVE
NREC NWAB
OUTPUT(I)
PBAS
PBASE
PERDL
PERRT PERSO PERST
temperature hydraulic head midway between drains actual base uptake of nitrogen, function of crop - growth duration and farmers ability base uptake of nitrogen by crop species with growth duration of 120 days required fertilizer - nutrient application for the potential production situation required fertilizer - nutrient application for the water - limited production situation additional yield per unit applied fertilizer -nutrient for the potential production situation additional yield per unit applied fertilizer -nutrient for the water - limited production situation required nitrogen fertilizer for the potential production situation required nitrogen fertilizer for the water -limited production situation required nitrogen uptake for the potential production situation minimum nitrogen concentration in storage organs minimum nitrogen concentration in crop residues recovery fraction of applied nitrogen fertilizer required nitrogen uptake for the water -limited production situation array containing dry matter production per plant organ for the various production situations actual base uptake of phosphorus, function of crop growth duration and farmers ability base uptake of phosphorus by crop species with growth duration of 120 days maximum relative death rate of leaves due to water stress relative death rate of roots relative death rate of storage organs relative death rate of stems
kg ha cm
kg ha
kg ha
kg ha
kg ha
kg kg
kg kg
kg ha
kg ha
kg ha
kg kg
Kg Kg
kg kg
kg ha
kg ha
kg ha
kg ha
d"1
d'1
d"1
d"1
- i
380

Acronym PGASS
PGS3TB(I)
PGS4TB(I)
PMAXO
PMAXW
POPT
PPERSO
PPERVE
PREC
PWAB
Q10
R(I,J)
Description Units potential gross assimilation rate of closed canopy expressed in CH20 kg ha" table of potential gross C02 assimilation rate of a closed C3 crop versus day number kg ha" table of potential gross CQ2 assimilation rate of a closed C4 crop versus day number kg ha required phosphorus fertilizer for the potential production situation kg ha required phosphorus fertilizer for the water -limited production situation kg ha required phosphorus uptake for the potential production situation kg ha minimum phosphorus concentration in storage organs kg kg minimum phosphorus concentration in crop residues kg kg' recovery fraction of applied phosphorus fertilizer kg kg" required phosphorus uptake for the water — limited production situation kg ha" increase in relative maintenance respiration rate per 10 °C increase in temperature unitless array used in subroutine RIJTEMA, containing distance between bottom of rooting zone and groundwater level per texture class (Tables 21 to 34) daily rainfall array containing number of rainy days per month array containing rainfall per month rooting depth array containing number of rainy days per month,in subroutine RAINDA maximum rooting depth recovery fraction of applied nutrient, function of type of nutrient and of farmers ability kg kg
RIJTEM(IK,I)array containing distance between bottom of rooting zone and groundwater level per texture class (Tables 21 - 34) cm
RMH actual matric head in rooting zone cm RML relative maintenance respiration rate of leaves d"l
- i
- i
- i
RAIN RAIND(I)
RAINTB(I) RD RDA(I)
RDM REC
cm cmd"1
d month"1
cm month"1
cm
d month"1
cm
- i
381

Acronym RMO
RMR RMRES
RMS RN RR RSM
RTB(I)
RTDF
S SO SAL SALR SALT
SLA SLATB
SM SMO SM10
SMCR SMF
SMFC SMFCF
SMW SOB AS 1
SOBAS2
SOILTY SOOPT
Description relative maintenance respiration rate of storage organs relative maintenance respiration rate of roots maintenance respiration rate of crop at temperature of 25 °C relative maintenance respiration rate of stems daily rainfall, in subroutine RAINDA vertical extension rate of root system rate of change of soil - moisture content in rooting zone array containing rainfall per month, in subroutine RAINDA counter for number of days with RD less than 10 cm actual sorptivity of the soil standard sorptivity of the soil slope angle of the land slope angle of the land array containing slope angle of the land per land unit specific leaf area table containing specific leaf area as a function of development stage of the crop actual soil - moisture content total pore space soil - moisture content at air content of 0.10 cm3 cm"3
critical soil - moisture content soil - moisture content fixed at moment groundwater enters the root zone soil - moisture content at field capacity soil - moisture content at fixed field capacity, i.e. matric suction of 100 cm soil - moisture content at wilting point nutrient - limited dry - matter production of storage organs water - plus - nutrient - limited dry - matter production of storage organs table specifying soil texture class per land unit potential dry — matter production of storage organs
Units
d"1
d"1
kgha-'d-1
d-1
cmd"1
cmd'1
cm3cm"3d_1
cm month"1
unitless cmd"05
cmd"05
degrees radians
degrees ha kg"1
unitless cm3 cm cm3 cm
cnr cm" cm3 cm"
cm3 cm' cm3 cm"
cm3cm" cm3 cm"
kg ha"1
kg ha"1
unitless
kg ha - i
382

Acronym SOPE SPA SPAN SR SS SSA SSMAX SSR
STARTD STB AS 1
STBAS2
STOPT SURRO SURROT SWDEP SWDPTB
T TO TAB1
TAB2
TADW TBIRR(I)
TCC3M
TCC3T
TCC4
TDW TEFF
Description transmission zone conductivity specific pod area life span of leaves rate of surface run-off actual surface storage specific stem area maximum surface storage capacity actual surface storage available in one time interval (= SS / DELT) starting date of crop growth nutrient - limited dry - matter production of stems water - plus - nutrient - limited dry - matter production of stems potential dry - matter production of stems surface roughness table specifying surface roughness per land unit soil - water depletion fraction table of soil - water depletion fraction versus potential transpiration rate actual transpiration rate potential transpiration rate relation between relative crop production and reduction in production due to pests and diseases (less susceptible) relation between relative crop production and reduction in production due to pests and diseases (more susceptible) total above - ground dry weight (living) array containing effective irrigation rate per month relation between air temperature and the reduction factor for gross assimilation rate (C3 crop of temperate regions) relation between air temperature and the reduction factor for gross assimilation rate (C3 crop of tropical regions) relation between air temperature and the reduction factor for gross assimilation rate (C4 crop) total crop dry weight (living) temperature effect on maintenance respiration
Units cmd"' ha kg"1
d cmd"1
cm ha kg"1
cm
cmd"1
d
kg ha - i
kg ha"1
kg ha"1
cm cm unitless
unitless cmd"1
cmd"1
unitless
unitless kg ha"1
cm month - i
unitless
unitless
unitless kg ha"1
unitless
383

Acronym TEMP TEMPTB(I) TEXTCL TM TSC1
TSC2
TSGF
TSR TWLV TWRT TWSO TWST UPTB
WLV WRT WSO WST WUSE
WUSEO
WUSEW
XIE XIM XIMMAX ZT ZTF
ZTMA ZTMAT
ZTMI ZTMIT
ZTMRD
Description Units average daily temperature °C table of average temperature versus day number unitless
cm
cm
soil texture class (alphanumeric) maximum transpiration rate texture - specific empirical constant 1 in matric head - hydraulic conductivity relation texture - specific empirical constant 2 in matric head - hydraulic conductivity relation texture - specific geometry factor in matric head - soil - moisture content relation total surface runoff total dry weight of leaf tissue total dry weight of root tissue total dry weight of storage organs total dry weight of stem tissue table containing relation between growth period and relative base uptake total dry weight of living leaves total dry weight of living roots total dry weight of living storage organs total dry weight of living stems total water use by transpiration over crop - growth cycle total water use by transpiration during crop - growth cycle for the potential production situation cm total water use by transpiration during crop - growth cycle for the water - limited production situation effective irrigation rate actual infiltration rate maximum infiltration rate actual groundwater depth groundwater depth fixed at moment that ground — water enters root zone maximum groundwater depth array containing maximum groundwater depth per land unit cm minimum groundwater depth cm array containing minimum groundwater depth per land unit cm distance between groundwater depth and rooting depth cm
unitless cmd"1
2.4 A -1
- 1
cm"1
cm kg ha"1
kg ha"1
kg ha"1
kg ha"1
unitless kg ha"1
kg ha"1
kg ha"1
kg ha"1
•cm
cm cmd* cmd" cmd" cm
cm cm
-i
-l
• l
384