9.5.3 meat rendering plants total voc emissions for the ... 4-1. test results - supercooker exhaust...
TRANSCRIPT
9.5.3 Meat Rendering Plants
Total VOC emissions for the Supercooker
TRC Environmental Corporation for IBP, Inc.
August 1998
1998 (post section publication) source test data.
October 13,1998
MI. Dave Meierhera Air Quality Compliance Section Nebraska Department of Environmental Quality P. 0. Box 98922 Lincoln, NE 68509-8922
RE: IBP, inc., Lexington, Nebraska Updates to the Lexington VOC Final Report
Dear MI. Meierherq:
Please find enclosed a copy of the updates for the final VOC report submitted August 26, 1998. The updates reflect the changes discussed with myself and TRC.
If you have any questions concerning the testing results or procedures used, please contact me a 402-241-3647 or you may contact MI. Scott Miller, TRC Project Manager, at 630-810-1 122.
Sincerely,
Rechelle Kruse Air Pollution Control Engineer
Enclosure
C: Leo Lang Ryan Post Dallas Safriet
RK98-598nE-Slack Tests
IBP. inc. P.O. BOX 515, DAKOTA CITY, NEBRASKA68731 TELEPHONE: 402-494-2061

SECTION 2
TGNMO as Carbon, ppmc
SUMMARY OF RESULTS
358.0 273.0 296.0
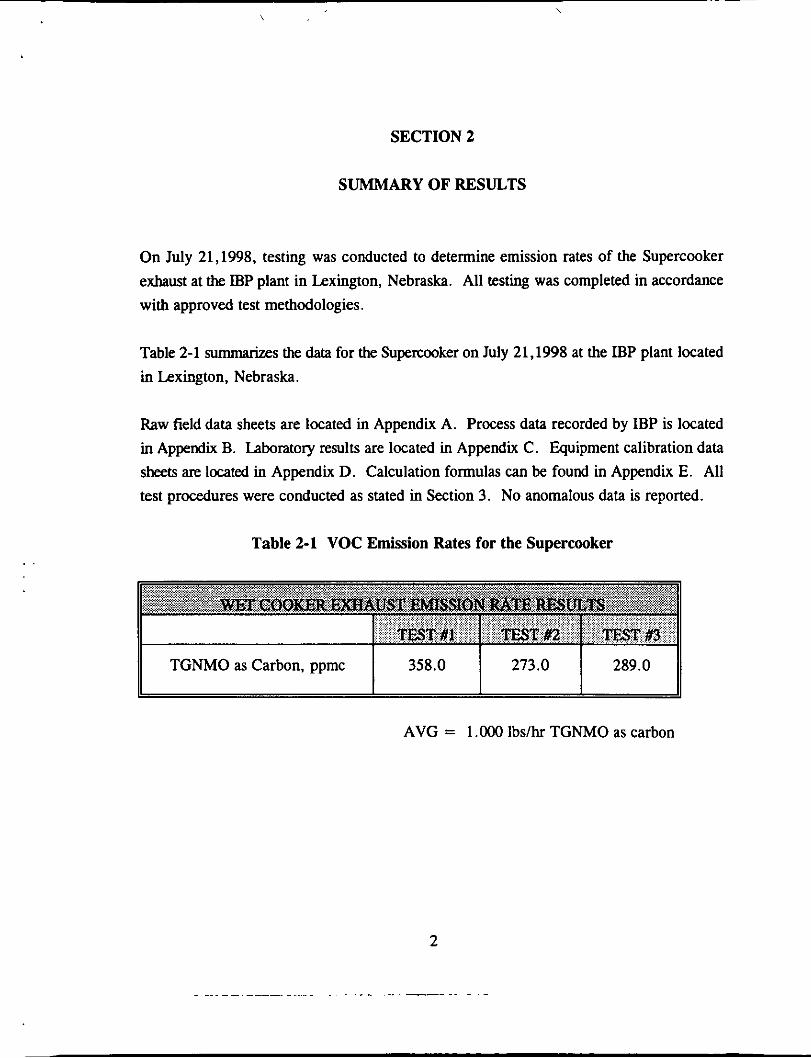
On July 21,1998, testing was conducted to determine emission rates of the Supercooker exhaust at the IBP plant in Lexington, Nebraska. All testing was completed in accordance with approved test methodologies.
Table 2-1 summarizes the data for the Supercooker on July 21,1998 at the IBP plant located in Lexington, Nebraska.
Raw field data sheets are located in Appendix A. Process data recorded by IBP is located in Appendix B. Laboratory results are located in Appendix C. Equipment calibration data sheets are located in Appendix D. Calculation formulas can be found in Appendix E. All test procedures were conducted as stated in Section 3 except:
On Run #2&3 the moisture content was above saturation therefore moisture was determined by using stack temperature and the saturation table. On Run #1,2&3 RM 25, lab receipt data was used to calculate VOC emission rates. Lab receipt data was used because line loss was not taken into account when final tank measurements were taken. TRC feels that the lab receipt data is the accurate data to be used and is also considered worst case scenario.
Table 2-1 VOC Emission Rates for the Supercooker
2
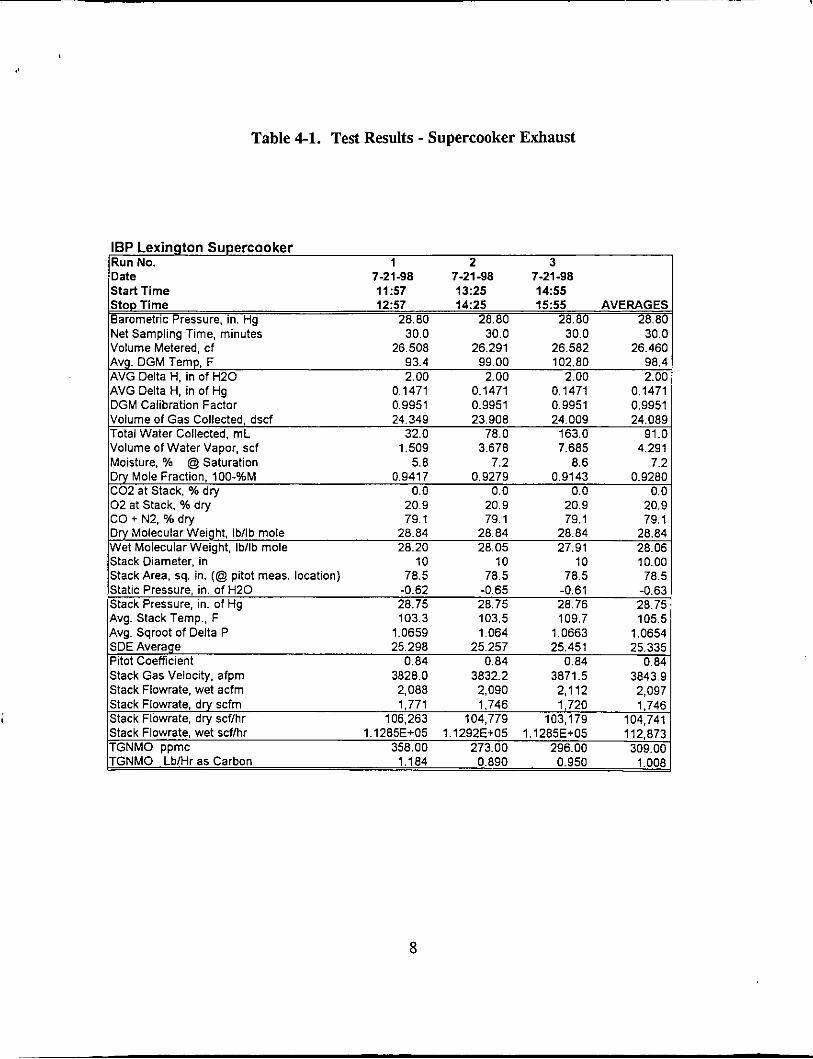
Table 4-1. Test Results - Supercooker Exhaust
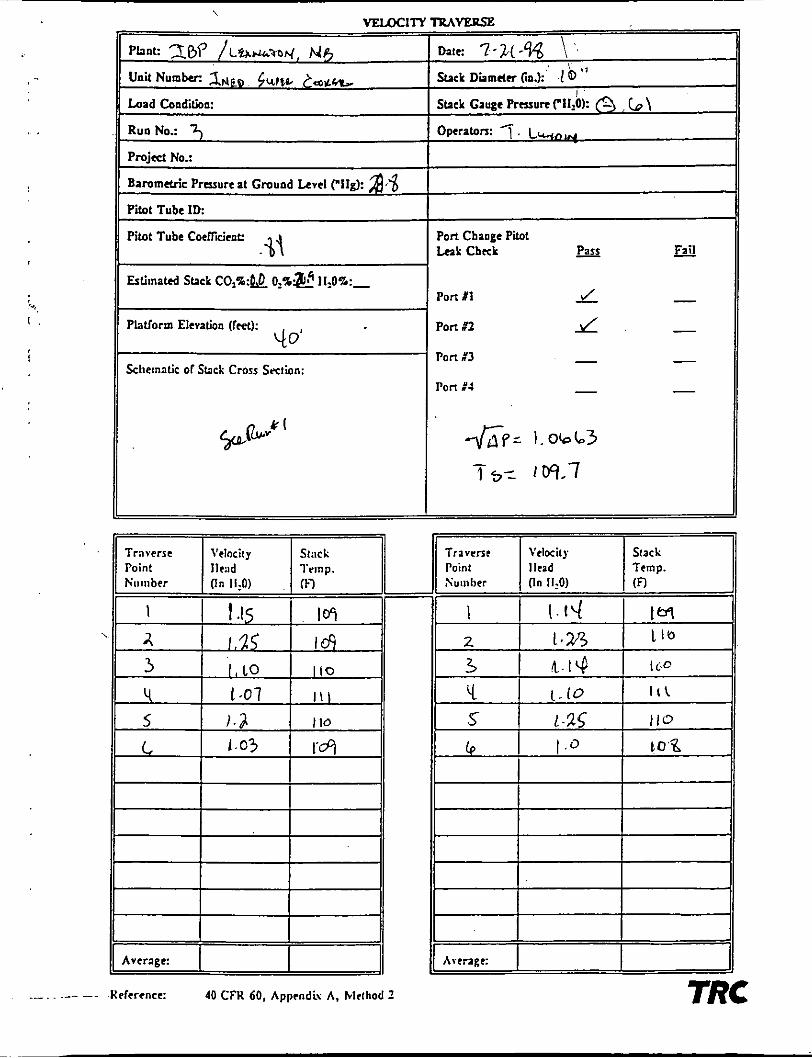
IBP Lexington Supercooker lRun No. 1 2 3 Date 7-21-98 7-21-98 7-21-98 Start Time 11:57 13325 14:55 StoD Time 1257 14:25 1555 AVERAGES Barometric Pressure, in. Hg 28.80 28.80 28.80 28.8C Net Sampling Time, minutes 30.0 30.0 30.0 30.C Volume Metered, cf 26.508 26.291 26.582 26.46C Avg. DGM Temp, F 93.4 99.00 102.80 98.4 AVG Delta H, in of H20 2.00 2.00 2.00 2.oc AVG Delta H, in of Hg 0.1471 0.1471 0.1471 0.1471 DGM Calibration Factor 0.9951 0.9951 0.9951 0.9951 Volume of Gas Collected, dscf 24.349 23.908 24.009 24.089 Total Water Collected. mL 32.0 78.0 163.0 91.0 Volume of Water Vapor, scf 1.509 3.678 7.685 4.291 Moisture, % @ Saturation 5.8 7.2 8.6 7.2 Dry Mole Fraction, 100-%M 0.9417 0.9279 0.9143 0.9280 C02 at Stack, %dry 0.0 0.0 0.0 0.0 0 2 at Stack, % dry 20.9 20.9 20.9 20.9 CO + N2.% d N 79.1 79.1 79.1 79.1 Dry Molecular Weight. lblib mole 28.84 28.84 28.84 28.84 Wet Molecular Weight, Ib/lb mole 28.20 28.05 27.91 28.06 Stack Diameter, in 10 10 10 10.00 Stack Area, sq. in. (@ pitot meas. location) 78.5 78.5 78.5 78.5 Static Pressure, in. of H 2 0 -0.62 -0.65 -0.61 -0.63 Stack Pressure, in. of Hg 28.75 28.75 28.76 28.75 Avg. Stack Temp., F 103.3 103.5 109.7 105.5 Avg. Sqroot of Delta P 1.0659 1.064 1.0663 1.0654 SDE Average 25.298 25.257 25.451 25.335 Pitot Coefficient 0.84 0.84 0.84 0.84
Stack Flowrate. wet acfm 2.088 2.090 2,112 2.097 Slack Gas Velocity. afpm 3828.0 3832.2 3871.5 3843.9
Stack Flowrate. dry scfm 1,771 1,746 1,720 1.746 Stack Flowrate, dry scf/hr 106,263 104,779 103,179 104,741 Stack Flowrate, wet scflhr 1.1285E+05 1.1292€+05 l,1285E+05 112.873 TGNMO ppmc 358.00 273.00 296.00 309.00 (TGNMO LblHr as Carbon 1.184 0.890 0.950 1.008
8

Triangle Environmental Services, Inc
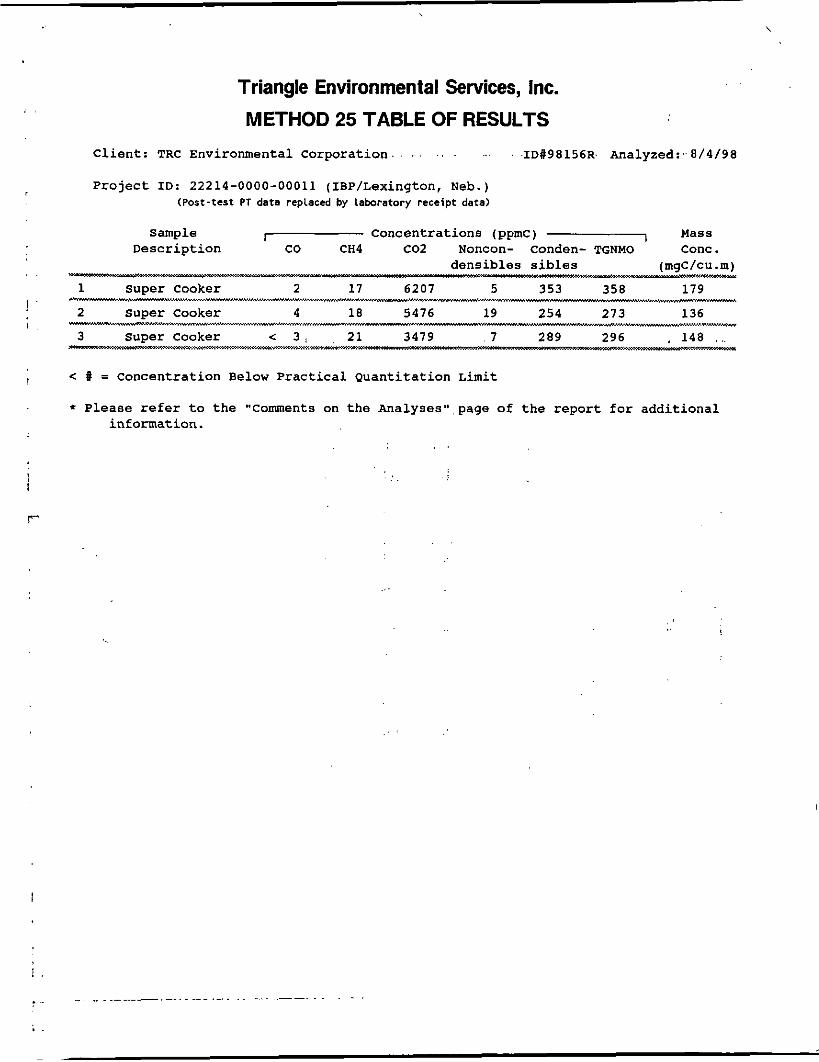
METHOD 25 TABLE OF RESULTS
Client: TRC Environmental Corporation 1 ~ # 9 8 1 5 6 ~ Analyzed: 8/4/98
Project ID: 22214-0000-00011 (IBP/Lexington, Neb.) (Post-test PT data replaced by laboratory receipt data)
Sample ,- Concentrations (ppmC) -1 Mass Description co CH4 C02 Noncon- Conden- TGNMO Conc .
densibles sibles (mgC/cri.m) _M_____mMl-
1 Super Cooker 2 17 6207 5 353 358 179
2 Super Cooker 4 18 5476 19 254 273 136
3 SuDer Cooker < 3 21 3479 7 289 296 148
* - ~ w - " * " ~ w . % w ~ . ~ - - ~ w ,--- ~ . ~ - . - - ~ - ~ ~ . ~ . . ~ ~ ~ . ~ . . . ~ ~ . - ~ ~ . * - ~ , ~ ~ . ~ , . ~ . ~ - - - - - ~ ~ - ~ - - ~
~ ~ ~ ~ . . ~ ~ . ~ - . ~ . - - . - ~ ~ . - - - " , - - ~ ~ ~ " ~ " - ~ ~ ~ - - . ~ ~ ~ - - - ~ -.,I*-.---*-
< # = Concentration Below Practical Quantitation Limit
* Please refer to the "Comments on the Analyses" page of the report f o r additional information.

Triangle Environmental Services, Inc.
METHOD 25 DATA REPORT
Client: TRC Environmental Corporation ID#98156R Analyzed: 8/4/98
Project ID: 22214-0000-00011 (IBP/Lexington, Neb.) (Post-test PT data replaced by labratory receipt data)
Sample # 1 Super Cooker
Pressure, Temperature, Volume Data:
Pressure Temp. P/T (mm Hg) (K) Tank N283A:
Presampling 3.5 305.37 0.011 Tank Volume = 0.004542 cu.m Volume Sampled = 0.003258 dscm Postsampling 556.0 297.15 1.871 Lab Recei t P T = l.ooo Lab Receipt 556.0 297.15 1.871 Postsampl~nq
Tank Final 1218.0 297.15 4.099 Trap GGI ~
Cv Final 1493.0 298.65 4.999 Collection Vessel 33: CV Volume = 0.008361 cu.m
Response Factors (RF), Practical Ouantitation Limits (POL), and Area Counts:
RF PQL Area 1 Area 2 Area 3 (arealppmc) (ppmc)
co 246.7 2 376 358 0 CH4 259.6 2 2,024 2,072 1,977 c02 256.4 2 723,098 722,715 722,456 Noncondensibles 253.5 5 576 490 589 Condensibles 256.4 4 19,003 19,132 19,107
Recovery Oxidation Catalyst Efficiency Check: C02/CH4 = 100.6% CO Blank = 0 area counts C02 Blank = 3 ppm
Concentrations: *=corrected for Blank co* CH4 c02* Noncondensibles Condensibles" TGNMO
I ppmc 1 Amount f SD %RSD
2 * 2 86.7 17 f 0 2.3
6207 f 3 0.0 5 * 0 9.8
353 f 1 0.4 358
Mass Concentration 179 mgC/cu.m

Triangle Environmental Services, Inc.
METHOD 25 DATA REPORT
Client: TRC Environmental Corporation ID#98156R Analyzed: 8/4/98
Project ID: 22214-0000-00011 (IBP/Lexington, Neb.) (Post-test PT data replaced by laboratory r e c e i p t data)
Sample # 2 Super Cooker
Pressure, TemDeratUre, Volume Data:
Pressure Temp. P/T (mm Hg) (K) Tank 6209T:
Presampling 1.5 308.71 0.005 Tank Volume = 0.006126 cu.m Volume Sampled = 0.004147 dscm Postsampling 523.0 297.15 1 .760
= 1.000 Lab Recei t Lab Receipt 523.0 297.15 1.760 Postsampl~ng p;T Tank Final 1512.0 297.15 5.088 Trap DDZ ~
CV Final 1500.0 299.65 5.006 Collection Vessel 12: CV Volume = 0.008343 cu.m
ResDonse Factors (RF), Practical Ouantitation Limits (POL), and Area Counts:
RF PQL Area 1 Area 2 Area 3 (arealppmc) (ppmc)
co 246.7 3 347 330 368 CH4 259.6 3 1,635 1,597 1,581 c02 256.4 3 485,063 485,058 485,253 Noncondensibles 253.5 6 1,703 1,679 1,669 Condensibles 256.4 4 17,479 17,554 17,528
Recovery Oxidation Catalyst Efficiency Check: C02/CH4 = 100.5% CO Blank = 0 area counts C02 Blank = 3 ppm
Concentrations: *=corrected for Blank co* CH4 c02* Noncondensibles Condensibles* TGNMO
I PPmC 7 Amount * SD %RSD
4 * 0 5.5 18 i 0 1.7
5476 f 1 0.0 19 i 0 1 .o
254 f 1 0.2 273
Mass Concentration 136 mgC1cu.m

Triangle Environmental Services, Inc.
METHOD 25 DATA REPORT
Client: TRC Environmental Corporation ID#98156R Analyzed: 8/4/98
Project ID: 22214-0000-00011 (IBP/Lexington, Neb.) (Post-test PT data replaced by l a b r a t o r y rece ip t data)
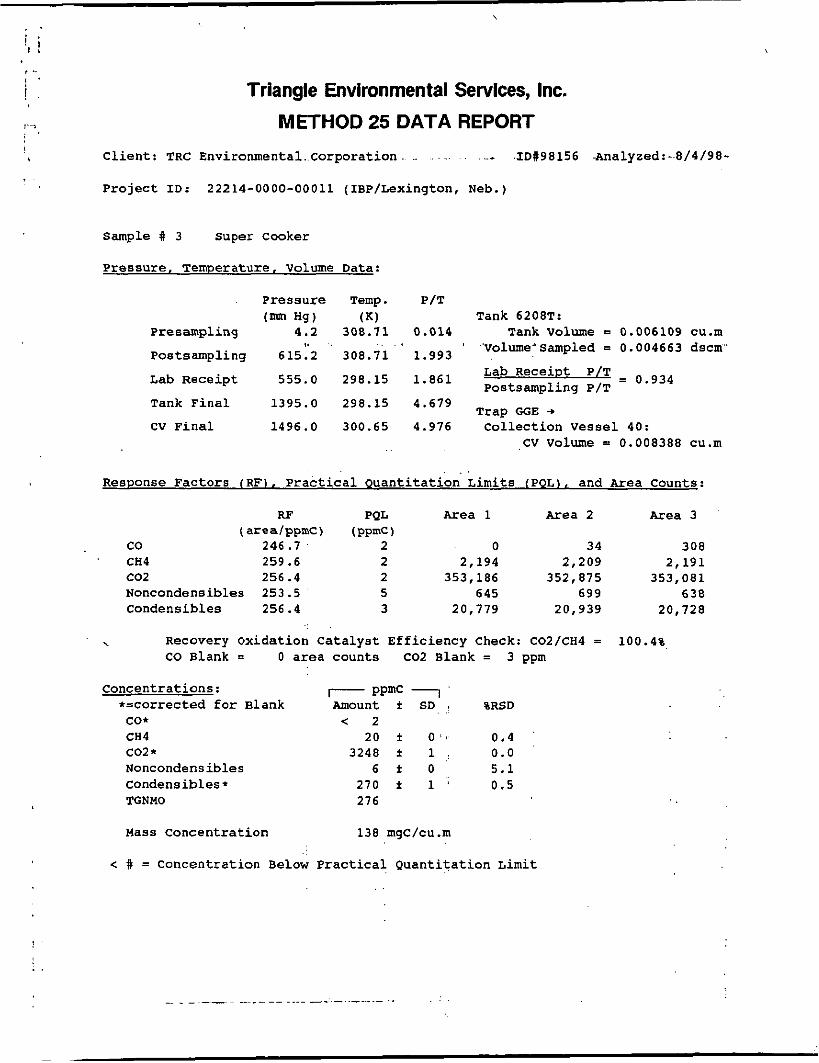
Sample # 3 Super Cooker
Pressure, Temperature, Volume Data:
Pressure Temp. P/T (mm Hg) ( K ) Tank 6208T:
Presamplinq 4.2 308.71 0.01.4 Tank Volume = 0.006109 cu.m Volume Sampled = 0.004354 dscm Postsampling 555.0 298.15 1.861
Lab Receipt 555.0 298.15 1.861 Lab Postsampl~ng Recei t P p$T T = l,ooo Tank Final 1395.0 298.15 4.679 Trap GGE ~
CV Final 1496.0 300.65 4.976 Collection Vessel 40: CV Volume = 0.008388 cu.'m
Response Factors (RF), Practical Ouantitation Limits (POL). and Area Counts:
RF PQL Area 1 Area 2 Area 3 (area/ppmC) (ppmc)
co 246.7 3 0 34 308 CH4 259.6 3 2,194 2,209 2,191 c02 256.4 3 353,186 352,875 353,081 Noncondensibles 253.5 6 645 699 638 Condensibles 256.4 3 20,779 20,939 20,728
Recovery Oxidation Catalyst Efficiency Check: C02/CH4 = 100.4% CO Blank = 0 area counts C02 Blank = 3 ppm
Concentrations: *=corrected for Blank
CO" CH4 C02" Noncondensibles Condensibles" TGNMO
I PPmC 1 Amount i. SD %RSD
21 2 0 0.4 3479 t 2 0.0
7 2 0 5.1 289 t 2 0.5 296
< 3
Mass Concentration 148 mgC/cu.m
< # = Concentration Below Practical Quantitation Limit
‘ I
August 26, 1998
Mr. Dave Meirhenry Air Quality Compliance Section Nebraska Department of Environmental Quality P. 0. Box 98922 Lincoln, NE 68509-8922
RE: IBP, inc., Lexington, Nebraska Inedible Cooking System VOC Test Report
Dear Mr. Meirhenry:
Please fmd enclosed a copy of the VOC Test Report for the IBP, Lexington, Nebraskq facility. The testing was conducted on July 21, 1998, by TRC Environmental Corporation. Volatile organic carbon testing was completed per the Nebraska Compliance Sampling Methods and was approved through protocol submittals. As shown in the detailed testing report on page 3, the average VOC (Total Hydrocarbons as Methane) emission rate from the steam heated Dupps Supercooker is I .OO Ibshr as carbon.
If you have any questions concerning the testing results or procedures used, please contact me a 402-241-3647 or you may contact Mr-Scott Miller, TRC Project Manager, at 630-810-1 122.
Sincerely,
Rechelle Kruse Air Pollution Control Engineei
Enclosures
C: Leo Lang (without test report) Ryan Post (with test report) Mr. Dallas Seifert, Federal EPA- AP-42 (with Test Report)
W98-563A.E-Slack Testing . . - ~ ~ . - ~ . . . ...
IBP, inc. P.O. BOX 515, DAKOTA CITY, NEBRASKA 68731 TELEPHONE: 402-494-2061

/ \ ::
)II \
Project Summary:
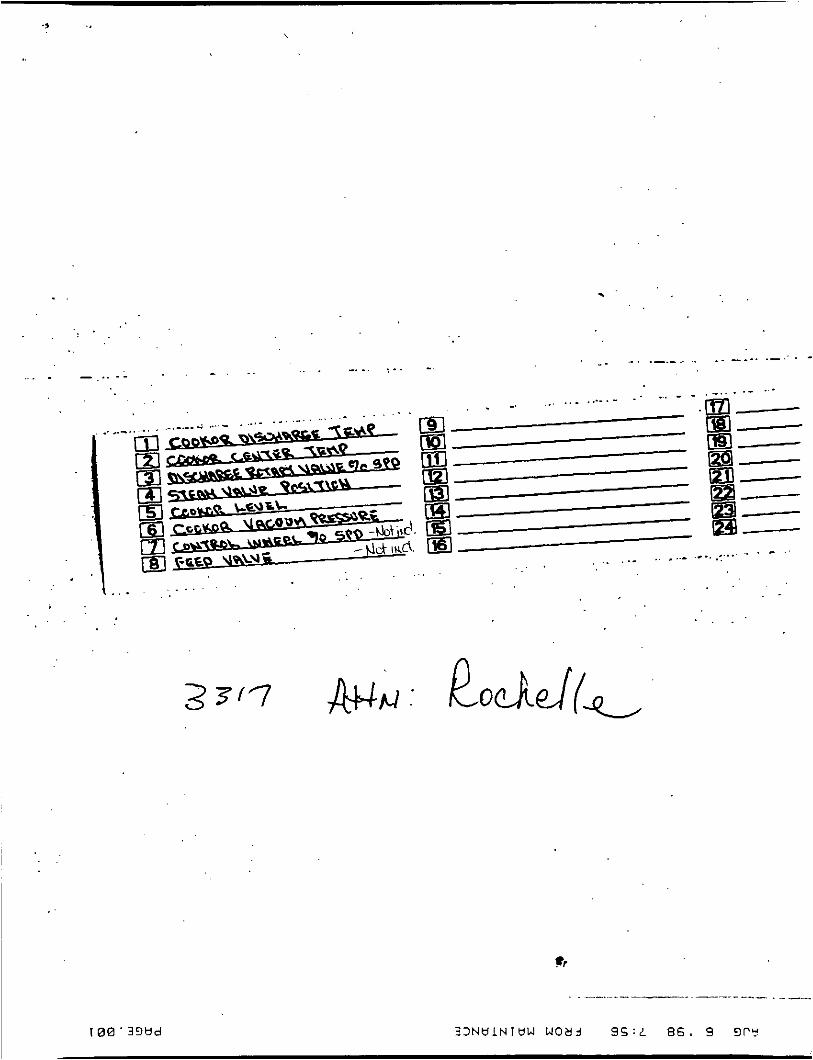
IBP created a project to quantify VOC emissions from their rendering processes including blood dryers, edible dryers, and inedible cookers for both beef and pork. The testing was conducted on all three systems under various heating conditions. The intent was to quantify VOC emissions for natural gas system as well as steam systems and to prove or disprove the difference in VOCs from products developed in fuel fired vs. steam heated processes.
A VOC test was conducted on the exhaust outlet of the Lexington steam Dupps Supercooker after the condenser per method 25 TGNMO.
Emission Data:
Test Data: Test #I l.l841bs/hr Test #2 0.890 I b h Test #3 0.928 Ibs/hr Average 1.00 Ibs/hr
Process Information During Test: Head Kill 4,665 hdlday Inedible Yield 39.6 lbslhd finished crax Inedible Operation 20 hrs.
Total Inedible Crax Processed: [(4,645 hdlday) x (39.6 Ibslhd)]L20 W d a y = 9,236.7 I b s h finished crax (9,236.7 I b h ) x ( I tonf2,OOO Ibs) = 4.62 t o n s h finished crax
Inedible Crax Emission Factor: Crax Processed 4.62 t o n h VOC Emissions from Blood Drying
1 .00 lbs/hr/4.62 tonslhr = 0.23 Ibdton finished crax
1 .oO I b s h
!
!
FINAL REPORT
TOTAL VOC EMISSIONS OF -
THE SUPERCOOKER
Prepared for
IBP, Inc. Lexington, Nebraska
Prepared By
TRC ENVIRONMENTAL CORPORATION DOWNERS GROVE, ILLINOIS 60515
August 21, 1998

\
I '
I ' .
FINAL REPORT
TOTAL VOC EMISSIONS OF THE SUPERCOOKER
Prepared for
IBP, Inc. Lexington, Nebraska
Prepared by I
TRC ENVIRONMENTAL CORPORATION 1307 Butterfield Road, Suite 412
Downers Grove, IL 60515 (630) 810-1122
August 21.1998
TRC Project No. 22214-11

DISCLAIMER
This report is intended for use solely by IBP, Inc. the specific purposes described in the
contractual documents between TRC Environmental Corporation (TRC) and IBP. All
professional services and reports generated by TRC have been prepared for IBP's purposes
as described in the contract. The information, statements, and conclusions contained in the
report have been prepared in accordance with the work statement, contract terms, and
conditions. The report may be subject to differing interpretations and/or may be
misinterpreted by third persons or entities who were not involved in the investigative or
consultation process. TRC Environmental Corporation therefore expressly disclaims any
liability to persons, other than IBP, who may use or rely upon this report in any way or for
any purpose.
i

TABLE OF CONTENTS
Section Page
LISTOFFIGURES . . . . . . . . . . . . . . . . . . . . . . . . . . . . . . . . . . . . . . . . . iii
LIST OF ACRONYMS AND ABBREVIATIONS . . . . . . . . . . . . . . . . . . . . . . iv
PROGRAMSUMMARY . . . . . . . . . . . . . . . . . . . . . . . . . . . . . . . . . . . . . . . v
INTRODUCTION . . . . . . . . . . . . . . . . . . . . . . . . . . . . . . . . . . . . . . . . . . . 1 1 . 1 ProjectScope . . . . . . . . . . . . . . . . . . . . . . . . . . . . . . . . . . . . . 1 1.2 Sampling Locations . . . . . . . . . . . . . . . . . . . . . . . . . . . . . . . . . 1
SUMMARYOFRESULTS . . . . . . . . . . . . . . . . . . . . . . . . . . . . . . . . . . . . . 2
FIELD SAMPLING PROCEDURES . . . . . . . . . . . . . . . . . . . . . . . . . . . . . . . 3 3.1 Field Sampling Summary . . . . . . . . . . . . . . . . . . . . . . . . . . . . . 3
3.1.1 Pre-Sampling Preparation . . . . . . . . . . . . . . . . . . . . . . . . . 3 3.2 Sampling Methods . . . . . . . . . . . . . . . . . . . . . . . . . . . . . . . . . . 4
3.2.1 Flow Rate Measurements . . . . . . . . . . . . . . . . . . . . . . . . . 4 3.2.2 CO, and 0, Measurement . . . . . . . . . . . . . . . . . . . . . . . . . 4 3.2.3 Moisture Measurement . . . . . . . . . . . . . . . . . . . . . . . . . . 4 3.2.4 Total Hydrocarbons . . . . . . . . . . . . . . . . . . . . . . . . . . . . 4
3.2.4.1 USEPAMethod25TrainforTGNMO . . . . . . . . . . 4
DATAREPORTING . . . . . . . . . . . . . . . . . . . . . . . . . . . . . . . . . . . . . . . . . 7 4.1 Data Reporting . . . . . . . . . . . . . . . . . . . . . . . . . . . . . . . . . . . . . . 7
.
ii
.................... _-- . ...
\ . . >
LIST OF FIGURES
Figure 3-1 Method 25 Sampling Train . . . . . . . . . . . . . . . . . . . . . . . . . . . . . . 6 Figure 4-1 Measurement Data Flow Scheme . . . . . . . . . . . . . . . . . . . . . . . . . . 9 Figure 4-2 Analytical Data Report Scheme . . . . . . . . . . . . . . . . . . . . . . . . . . 10
LIST OF TABLES
Table 2-1 VOC Emission Rates for the Supercooker . . . . . . . . . . . . . . . . . . . . . 2 Table 4-1 Test Results-Supercooker Exhaust . . . . . . . . . . . . . . . . . . . . . . . . . . 8
LIST OF APPENDICES
A Raw Field Data Sheets B Process Data C Laboratory Data D Equipment Calibration E Calculations Formulas
iii

acfm
afmp
CEM
CEMS
cf
CO, dscf
EPA
"F
ft
in H,O
in Hg
lblhr
4 ppm (VI
QMQC scfm
TGNMO
THC
TRC
voc
LIST OF ACRONYMS AND ABBREVIATIONS
actual cubic feet per minute
actual feet per minute
continuous emission monitor
continuous emission monitoring system
cubic feet
carbon dioxide
dry standard cubic feet
Environmental Protection Agency
degrees Fahrenheit
feet
inches of water
inches of mercury
pounds per hour
oxygen
parts per million volume
Quality AssurancelQuality Control
standard cubic feet per minute
total gaseous non-methane organics
total hydrocarbons
TRC Environmental Corporation
volatile organic compound

PROGRAM SUMMARY
The IBP, Inc. facility located in Lexington, Nebraska has a Supercooker in their rendering
operations. TRC Environmental Corporation (TRC) was contracted by IBP, Inc. to conduct
emission testing on the Supercooker. The major objectives of the test program was to
collect representative flue gas samples and determine the emission rates of volatile organic
compounds (VOC's) at the Supercooker exhaust.
TRC accomplished this objective through the use of acceptable test methods performed by
trained and experienced staff. IBP, Inc. personnel were responsible for maintaining the
proper operations during the emission test series. The emission test program was conducted
on July 21,1998. The emission tests included sampling for total gaseous non-methane
organics (TGNMO), total hydrocarbons (THC), volumetric flow rates, and moisture content
of the Supercooker flue gas following USEPA Methods 1 (Sampling Location Selection),
2 (Flow Rate), 3 (CO, and 0, for Molecular Weight), 4 (Moisture), and 25 (TGNMO).
V

\
SECTION I
INTRODUCTION
1.1 Project Scope
The IBP, Inc. facility operates a Supercooker at its Lexington, Nebraska facility. TRC was contracted by IBP, to conduct TGNMO emission testing for determination of volatile organic compound (VOC) emission rates of the Supercooker exhaust.
The major objective of the test program was to collect representative flue gas samples and determine emission rates of VOC at the Supercooker exhaust. Three 1-hour tests were conducted at the Supercooker exhaust, simultaneously with flow rates, C02 and 0, for molecular weight, and moisture.
1.2 Sampling Locations
Sampling for TGNMO was conducted on the Supercooker exhaust. The inside stack dimension was measured to be 10 inches in diameter; therefore, the stack area equals 78.5 square inches. Stack gas velocity, moisture, and volumetric flow rates were measured simultaneously with the TGNMO sampling. The required number of sample points and the sample point locations for the velocity traverses of each source were calculated according to 40 CFR Part 60, Appendix A, Method 1. A copy of the field data sheet can be found in Appendix A.
.\
1
.
SECTION 2
TGNMO as Carbon, ppmc
SUMMARY OF RESULTS
358.0 273.0 289.0
On July 21,1998, testing was conducted to determine emission rates of the Supercooker exhaust at the IBP plant in Lexington, Nebraska. All testing was completed in accordance with approved test methodologies.
Table 2-1 summarks the data for the Supercooker on July 21,1998 at the IBP plant located in Lexington, Nebraska.
Raw field data sheets are located in Appendix A. Process data recorded by IBP is located in Appendix B. Laboratory results are located in Appendix C. Equipment calibration data sheets are located in Appendix D. Calculation formulas can be found in Appendix E. All test procedures were conducted as stated in Section 3. No anomalous data is reported.
Table 2-1 VOC Emission Rates for the Supercooker

\\ \
SECTION 3
FIELD SAMPLING PROCEDURES
3.1 Field Sampling Summary
After consideration of the program requirements, TRC provided a experienced professional to conduct the field effort. Mr. Thomas Lundin of the Chicago Measurements office performed the testing.
3.1.1 Pre-Sampling Preparation
Equipment was inspected for proper operation and durability prior to calibration. All calibrations were performed prior to and at the conclusion of the emissions test program as shown below:
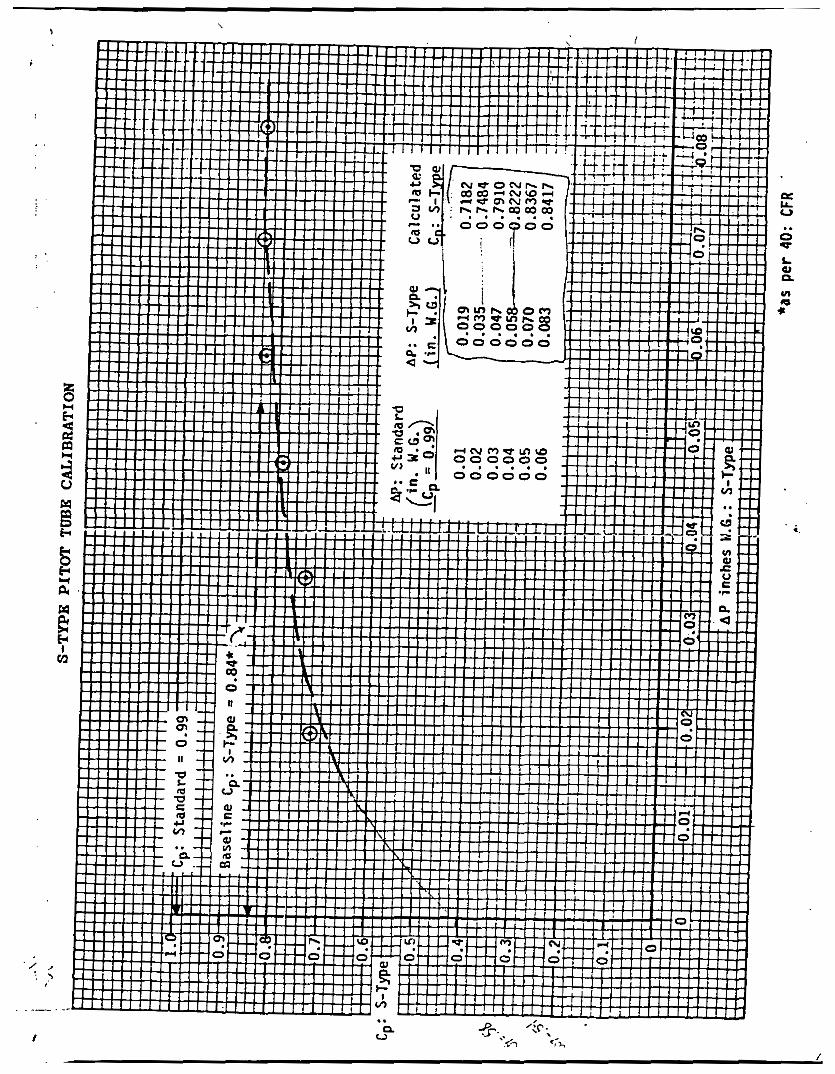
Pitot tubes (QA Handbook Section 3.12, pp. 1-13 and USEPA Reference Method 2) - measured for appropriate spacing and dimensions or calibrated in a wind tunnel. Rejection criteria given on the calibration sheet. Post-test check to inspect for damage.
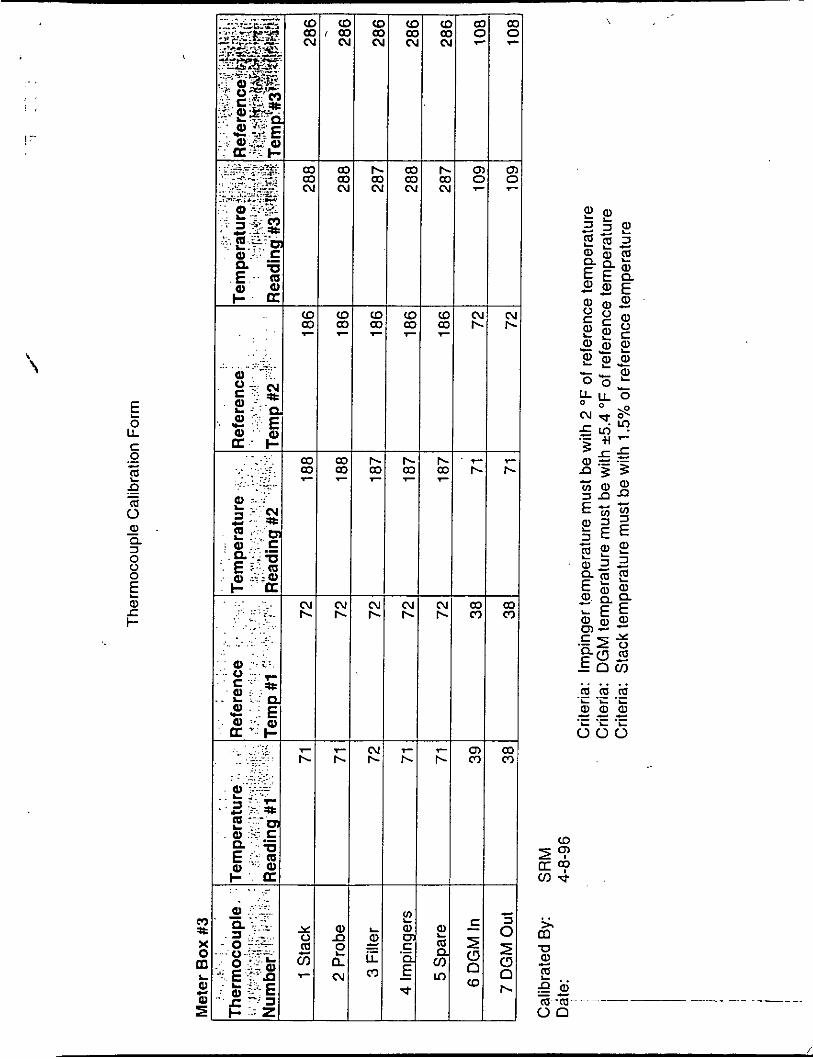
Thermocouples (QA Handbmk Section 3.4,2,pp. 15-18) - verified against a mercury- in-glass thermometer at three points including the anticipated measurement range. Acceptance limits - impinger f2"F; DGM f5.4"F; stack f1 .5 percent of stack temperature.
Field barometer (QA Handbook Section 3.4.2, pp. 18-19) - compared against a mercuIy-in-glass barometer or use the airport station's barometric pressure and correct for elevation. Acceptance criteria - f 0.02 in. Hg; post-test check - same.
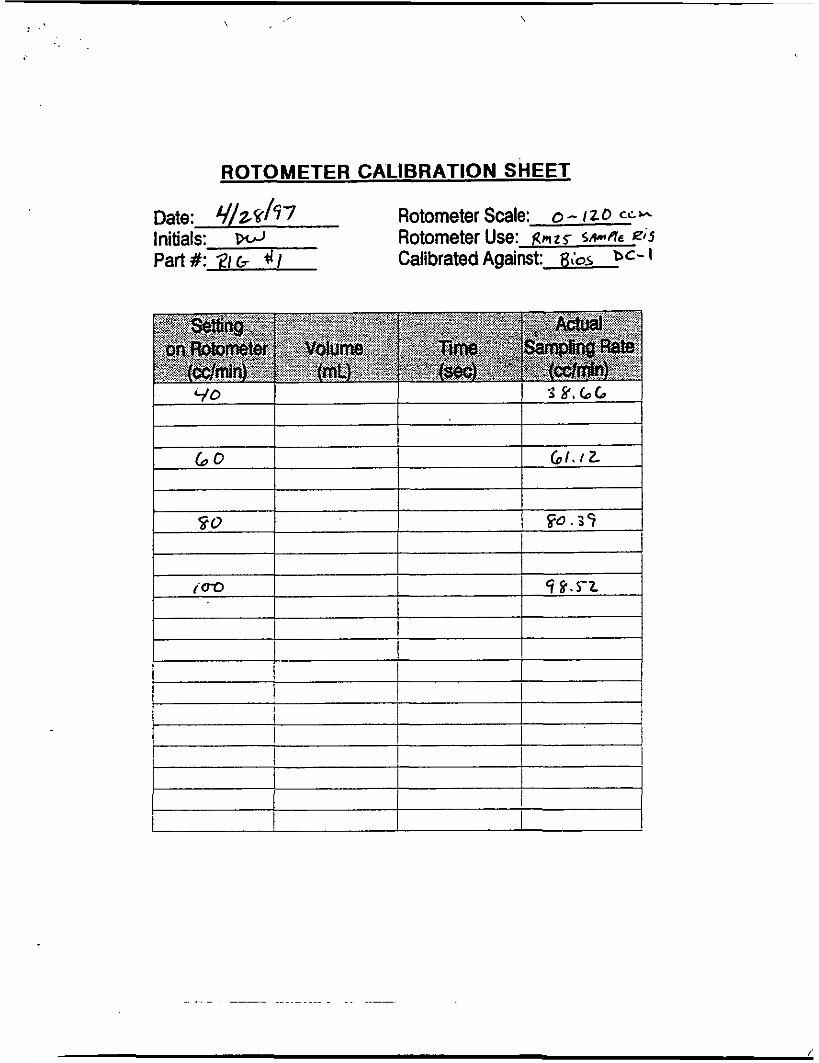
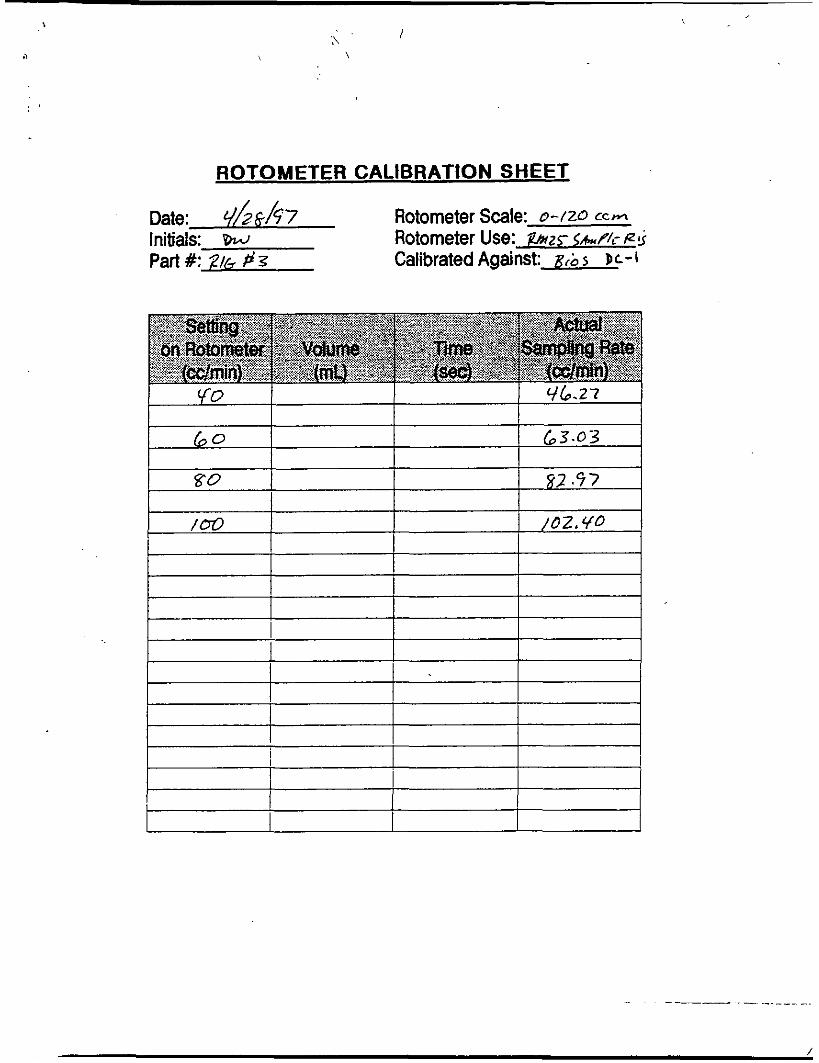
Method 25 rotometers - (QA Handbook Section 3.17.2, pp. 4-8) - calibrated against a standard bubble meter. Acceptance criteria - pretest Yi = 0.05Y; post-test check -average 3 run theoretical volume f 10% of average 3 run actual volume.
3

3.2 Sampling Methods
3.2.1 Flow Rate Measurements
Velocity measurements at the sampling locations were made following EPA Reference Methods 1 and 2 simultaneously with the TGNMO and (THC) sampling. A Type-S pitot tube with an attached water manometer was used to measure the exhaust velocities at the sampling ports. An attached Type-K thermocouple with remote digimite was used to determine gas temperature.
3.2.2 C02 and O2 Measurement
T e d l d bag flue gas samples were taken concurrently with the TGNMO sampling. A Fyrite was used to determine percent by volume of CO, and 0,.
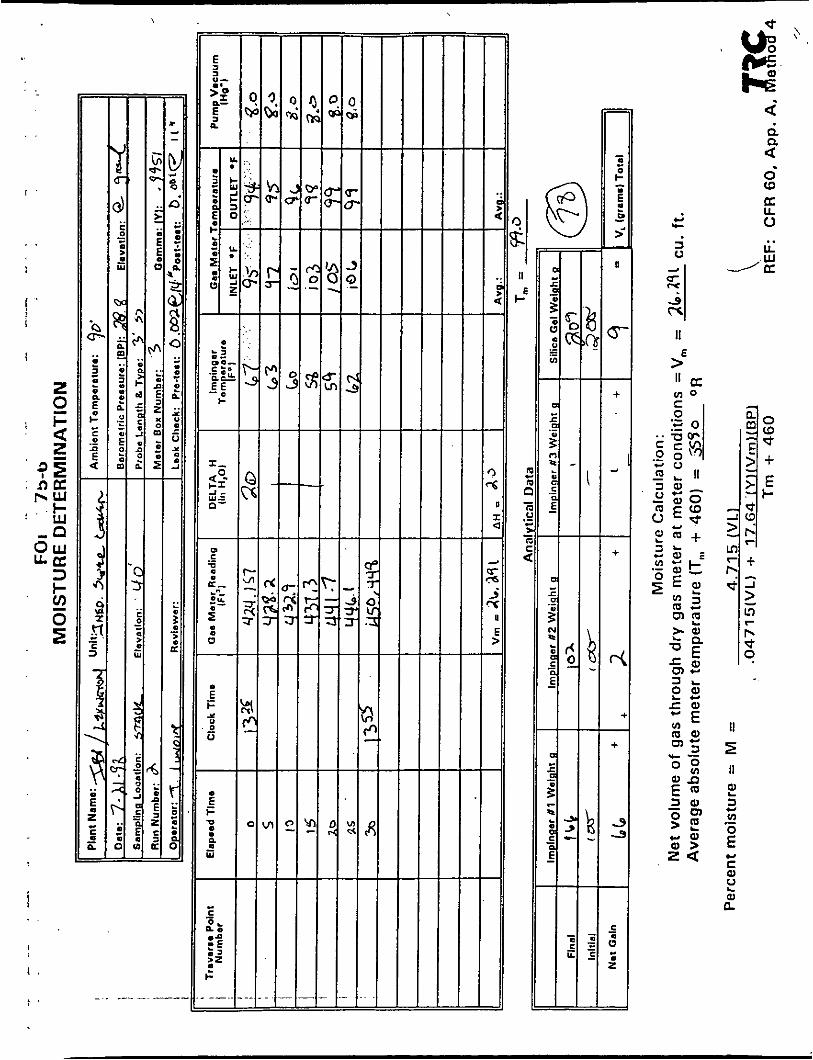
3.2.3 Moisture Measurement
Moisture was measured simultaneously using USEPA Method 4 for each test mn. The moisture train was operated for 30 minutes acquiring a minimum of 21 dry standard cubic feet of gas during the TGNMO sampling run.
, 3.2.4 Total Hydrocarbons
TRC conducted (TGNMO) testing at the Supercooker exhaust following USEPA RM25.
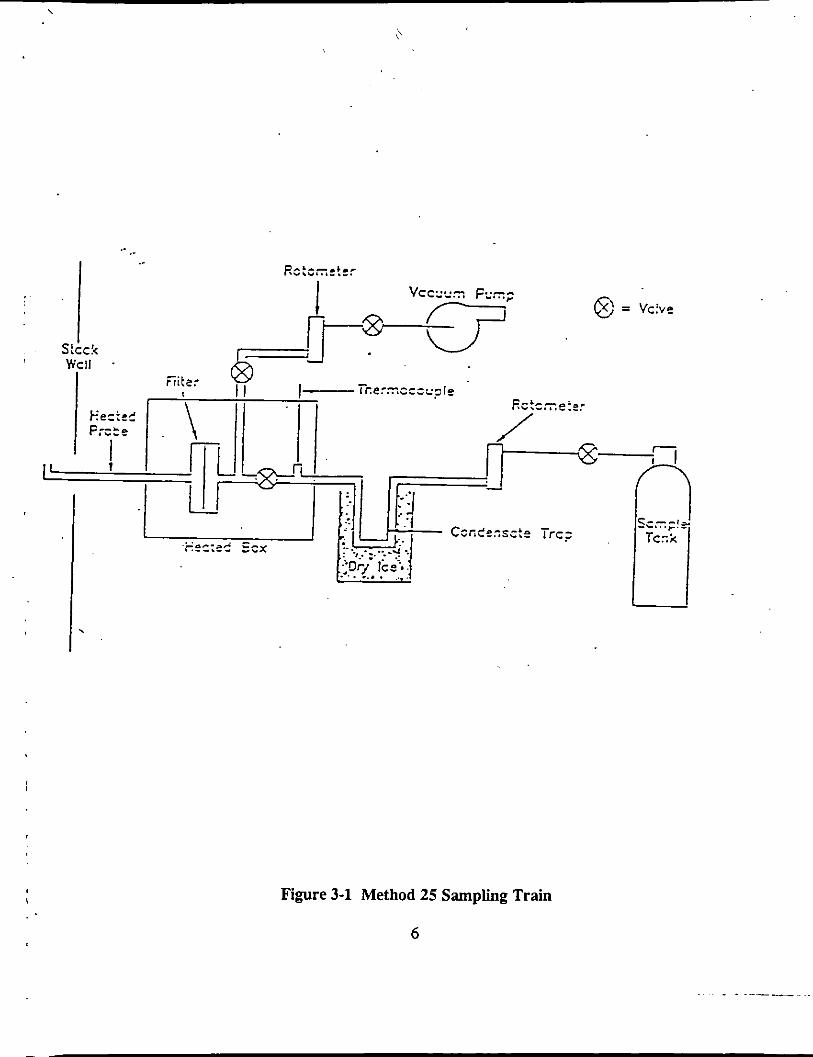
3.2.4.1 USEPA Method 25 Train for Total Gaseous Non-Methane Organics
TGNMO sampling as conducted following the criteria of USEPA Reference Test Method 25. Flue gas was sampled from the Supercooker exhaust at a constant rate through a heated probe and filter and a chilled condensate trap by means of an evacuated sample tank. The heated probe and oven were kept at a temperature of 2265°F and 250k5"F respectively
4
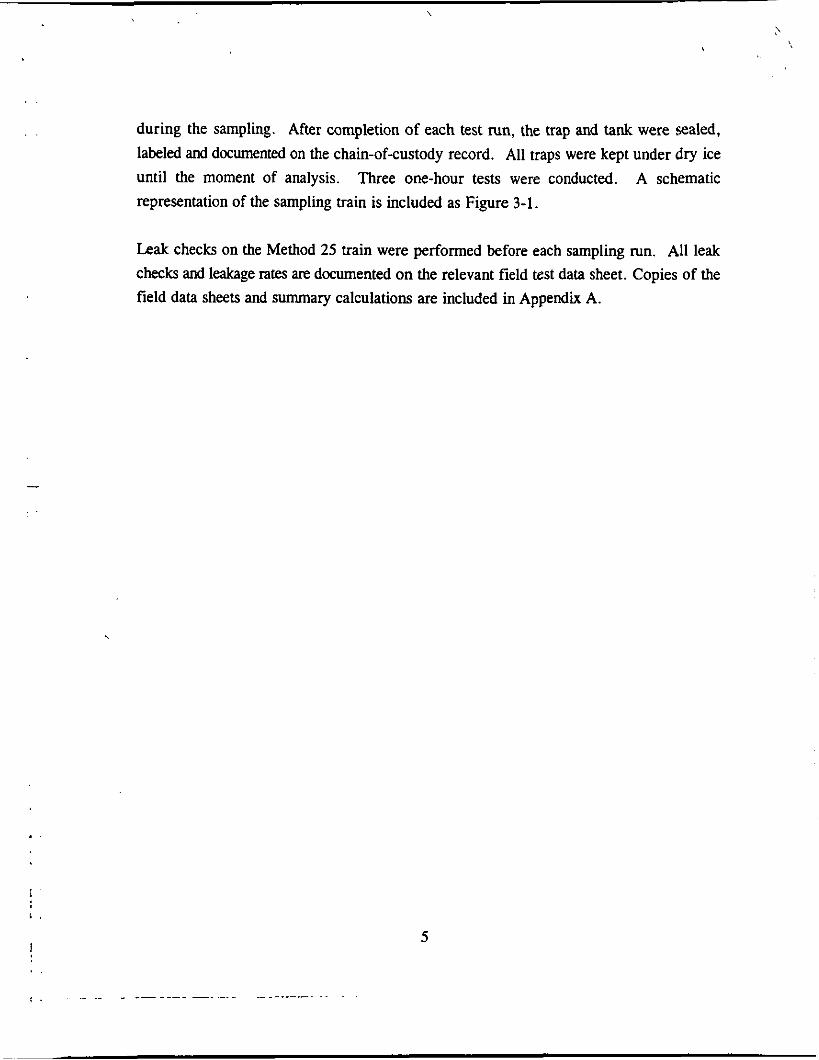
during the sampling. After completion of each test run, the trap and tank were sealed, labeled and documented on the chain-ofcustody record. All traps were kept under dry ice until the moment of analysis. A schematic representation of the sampling train is included as Figure 3-1.
Three one-hour tests were conducted.
Leak checks on the Method 25 train were performed before each sampling run. All leak checks and leakage rates are documented on the relevant field test data sheet. Copies of the field data sheets and summary calculations are included in Appendix A.
5
I'
Figure 3-1 Method 25 Sampling Train
6
__ . . .
. . '\
\
SECTION 4 DATA REPORTING
4.1 Data Reporting
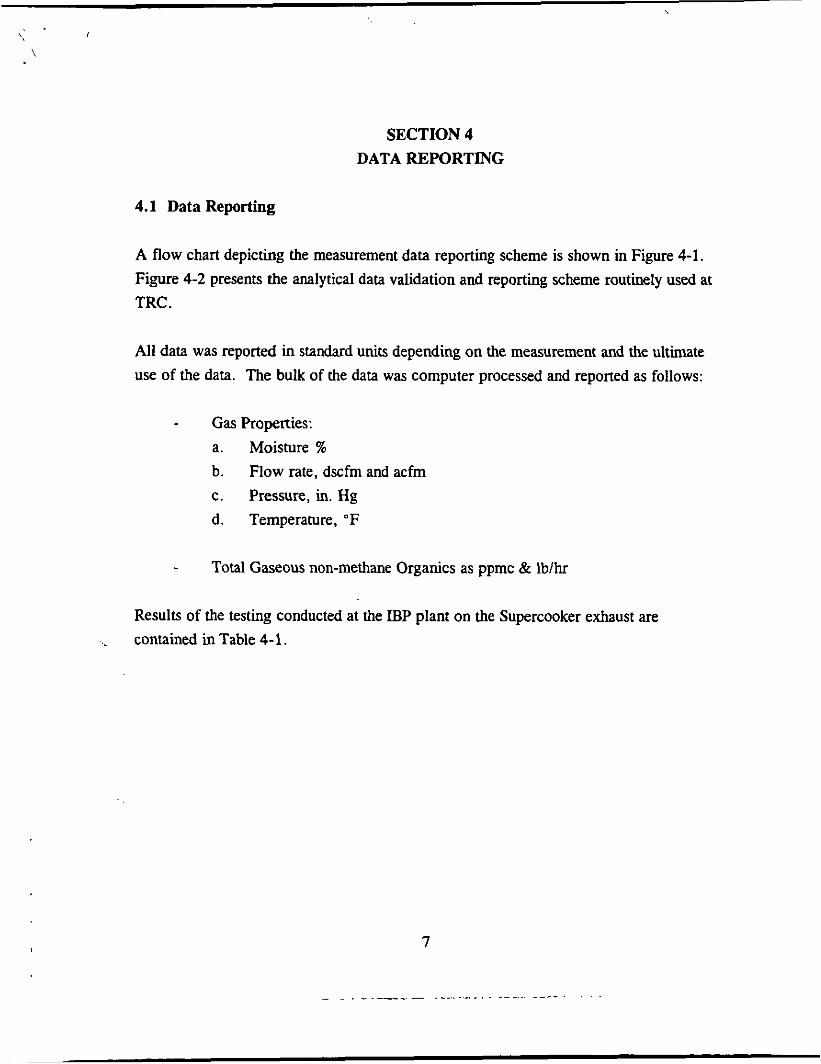
A flow chart depicting the measurement data reporting scheme is shown in Figure 4-1. Figure 4-2 presents the analytical data validation and reporting scheme routinely used at TRC .
All data was reported in standard units depending on the measurement and the ultimate use of the data. The bulk of the data was computer processed and reported as follows:
- Gas Properties: a. Moisture % b. c. Pressure, in. Hg d. Temperature, "F
Flow rate, dscfm and acfm
- Total Gaseous non-methane Organics as ppmc & lblhr
Results of the testing conducted at the IBP plant on the Supercooker exhaust are ._ contained in Table 4-1.

Table 4-1. Test Results - Supercooker Exhaust
8

DATASHEETS
\
TWO FIELD CREW
DATA SUBMllTED ERRORS AND TO FIELD TEAM OUTLIERS NOTED IN
FIELD LOGBOOK
PRELIMINARY DATA REDUCED AND
CHECKED IN FIELD
SUBCONTRACTORS SAMPLES AND DATA RETURNED TO TRC
SAMPLING AND PROCESS DATA SUBMITTED TO
FIELD PRINCIPAL INVESTIGATOR *
DATA CHECKED AND ENTER INTO
COMPUTER SHEETS
RESULTS , SUBMllTED TO COMPUTER INPUT
MADE AND RESUBMllTED TO
. LABORATORY PRINCIPAL
INVESTIGATOR
I FINAL RESULTS WRllTEN RECEIVED
Figure 4-1. Measurement Data Flow Scheme
9
SAMPLE PREPARATION AND
ANALYSIS
REVIEW DATA REANALYZE IF NECESSARY
-
SUBCONTRACTOR LABORATORY
REVIEW I QC DATA RESULTS UNACCEPTABLE
PRECISION AND REVIEW DATA ACCURACY b REANALYZE IF ACHIEVED NO NECESSARY
PROCEED WITH DATA REDUCTION,
REPORT ALL VALUES TO TRC
* 1
1
REVIEW DATA REANALYZE IF NECESSARY
DATA REVIEWED BY ' ,TRC QC PERSONNEL
DATA UNACCEPTABLE
DATA ACCEPTABLE
1. VALIDATED DATA ENTERED INTO PROJECT FILE
2. DATA REPORTED
Figure 4-2. Analytical Data Report Scheme 10
.. .- __ ._ - -

,\ . .
....
APPENDIX A
RAW FIELD DATA SHEETS
: . .
!
\A '
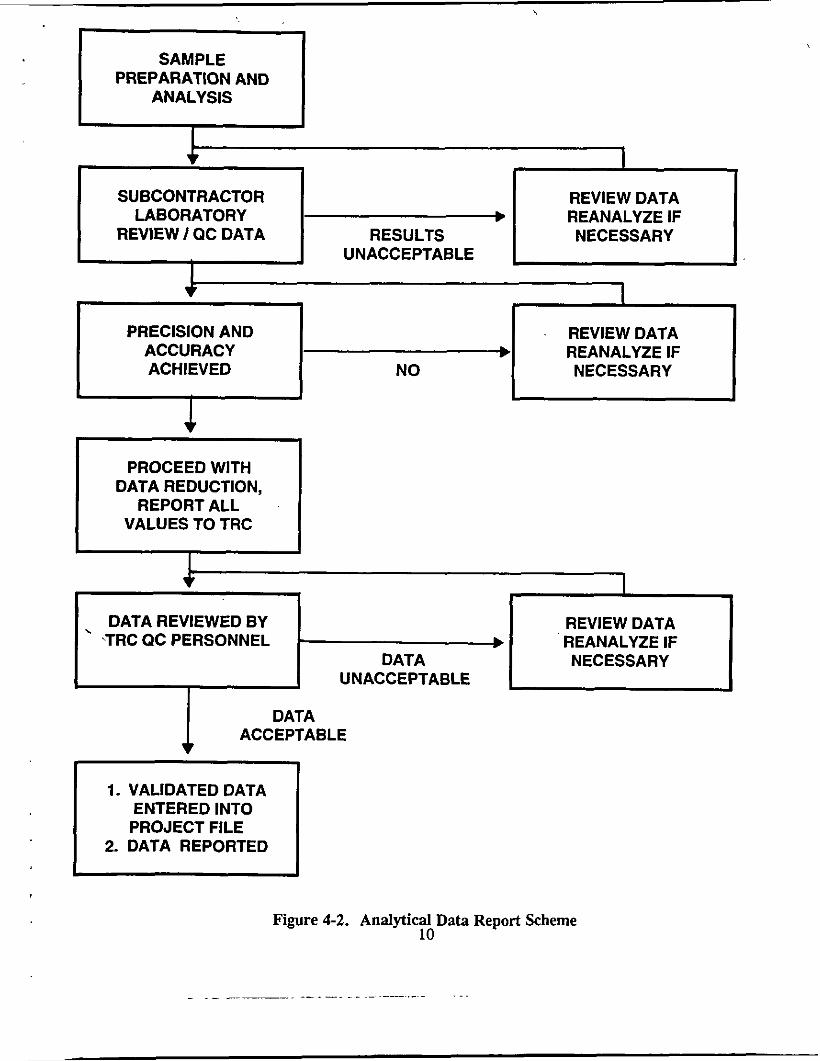
Traverse Point Location for Circular and Rectangular Ducts
-"reject Number: Duci Mundar Upstream from flow Dlrtutbance (0hlar.s 0)
03 in 1.5 2 0 2.3 Glient: 384 t hh4m rJs so . Date: 2 .a 1-
I . " - 1u*I*-u-Is*r 0 "--%...-o,.D 5: 4 0 - E r .i= 10- 0 1. -a¶,*,
Sampling Location: T q Q . 5% Internal Stack Diameter: 10 Nipple Length: 1 .S Total Stack Diameter: 11.5 Nearest Upstream Disturbance (C): Nearest Downstream Disturbance (D): $5' Calculator:
Y
- < I -
7. I dp-4 .f 20 - .=z E .':
r 10 . . s . . 1 1 1
. . . . . . , . . ' (romPoinlo~ayTyp1Oil~~c1(E1n4Conu;rctlon.Y4
-.- . , Rmulgulrt Dud Equivateflt0lrm~l.r De /amidan = =w
=I
c - . . .
tul O u . . - , . U I "ll*.1.W,-
- h a Diameter Dmnrtr~am trom Flow D l r t u r h c a (Dlr'axeC)
L-w
LOcaUon of Tnvene Po lm In Clxular stacks 4 6 c a IO 12 14 16 18 20 22 24
1 5.7 4.4 3.2 2.6 2.1 1.3 1.6 1.4 1.3 1.1 1.1 2 25.0 14.6 10.5 8.2 6.7 5.7 4.9 4.4 3.9 3.5 3.2 3 75.0 29.6 19.4 14.6 11.8 9.9 8.5 7.5 6.7 6.0 5.5 4 93.3 70.4 32.3 22.6 17.7 14.6 12.5 10.9 9.7 8.7 7.9 5 85.4 67.7 34.2 25.0 20.1 16.9 14.6 12.9 11.6 10.5 6 95.6 80.6 65.8 35.6 26.9 22.0 18.8 16.5 14.6 13.2
8 96.8 85.4 75.0 63.4 37.5 29.6 25.0 21.8 19.4 9 91.8 82.3 73.1 62.5 38.2 30.6 26.2 23.0
11 93.3 85.4 78.0 70.4 61.2 39.3 32.3 12 97.9 90.1 83.1 76.4 69.4 60.7 39.8 13 94.3 875 81.2 75.0 68.5 602 14 98.2 91.5 85.4 79.6 73.8 67.7 15 95.1 89.1 83.5 78.2 72.8 16 98.4 92.5 87.1 82.0 77.0 17 95.6 90.3 85.4 80.6 i a 98.6 93.3 88.4 83.9 19 96.1 91.3 86.8 20 98.7 94.0 89.5 21 96.5 92.1
96.8 23 98.9 24
7
10
89.5 77.4 64.4 36.6 28.3 23.6 20.4 18.0 16.1
97.4 88.2 79.9 71.7 61.8 38.8 31.5 272
22 98.9 94.5
2 75.0 50.0 37.5 30.0 25.0 21.4 18.8 15.7 15.0 13.6 12.5 3 83.3 62.5 50.0 41.7 35.7 31.3 27.8 25.0 22.7 20.8 4 87.5 70.0 58.3 5.0 43.8 38.9 35.0 31.8 29.2 5 90.0 75.0 64.3 56.3 50.0 45.0 40.9 37.5 6 91.7 78.6 68.8 61.1 55.0 50.0 45.8 7 92.9 81.3 72.2 65.0 59.1 54.2 8 93.8 83.3 75.0 68.2 62.5 9 94.4 85.0 77.3 70.8 10 95.0 85.4 79.2
95.8 12 I 1 95.5 87.5

\
Pretest Post Term
Method 25 Field Data
Barometric Ambient Tank Vacuum Manometer Gauge Pressure Temperature
mmlcmHg mmlunH@nHg d a n Hpnn. Hg C & 7118 22s aj. ab YV 1Sb 5 2 9L' .\ d
Client: >w Projea N u m k r : Location: ~ Y C O , r&r&Q. Sample Location: 5711~k Date: 7 -21 - 9% Run Number: I
W D ~ J / Operator:
TankNurnber: ,3,%3 Trap Number: 6G Sample ID: $/I
I
Pretest Leak Rate ( m d c m Hg/in Hg/5 min): 0.0 L CkCh
TRC ENVIRONMENTAL
i -~ L .
'1

Method 25 Field Data
Pretest Post Term
Tank Vacuum Barometric Ambient Manometer Gauge Pressure
mnu'mng m m l o n ~ n t l g mmlmHgnlhHg
SF?" 7 9 x s 28 .T Qb i s 4 5 .S 8 . - qL'
.

,-. Method 25 Field Data
Client: % 4 1 Location: L+{,A,W
Date: - _ _ Project Numkr: SarnpleLocation: S.).IFCP. %PI.+ L d i q RunNumber: 3 Operator: 7. L k U O i r l
Tank Number: b2fl Trap Number: G&L Sample ID: Q!3
Pretest Leak Race ( m d c m Hglin Hg/5 min): 0 0 e SA,.+!
. . __. ~ . .

\ vELOc1r
Phnl:'@p
Unit N u m k WE8, h q . L- Load Condition:
Run No.: I Project No.:
Barometric Prmure at Ground k c l ("llg): as-$% Pitot Tube I D
z . 4 Pitot Tube Coeficient:
Ertiinatcd Sbck C O , % : ~ O , % . ~ 11,0%:-
Platform Elevation (fret): , v o
Sclieinatic of Shck Cross Section:
~
Pen Change Pitot L n k Cbrck - Pass - Fail
.. - -- 7RC Kelrrencc: . ... . 4 0 CFK 60. Appmdis A. Mrthod 2

11 Barnmetric Prerture at Gmund Level (“Ild: $@% 11 Pitot Tube ID
1) Estimated Sbck COX%@ O,%a ll:O%:-
Platform Elevation (feet): I1 Sclieinntic of Sack Cross Section:
st, fWb \
Date: 7- 21 ,q4 \, Stack Durnctrr Ci.): Ib” Stack Gauge Prasurr (“1I:O): @ Operaton: 7 . ~ - d
i
7RC Hcferencc: 40 CFH-60. Appmdi~~A,-h.IrclioJ-2. -- -. .
. .
'a,
I Platform Elevation (IN): I/ W' Sclieinatic or Stack Cross Srction: II
II ' ! II
Port Change Pitot L n k Check - Pass
-
Average . . -- -- -Hrfermce: 40 CFH 60, A p p m d k A, Mrthod 1

L -
i
. . I
I , i
I
i .
Y c

i: , .. '
! '
I
'2
- r
i 0
K
0 U
.. U UI K
APPENDIX B
PROCESS DATA

Attv\: bchd LEXINGTON PLANT
OTAL KILL 1'5 15.5 18 18 15 25 16 11.25 90
NET HOURS 15 15 5 15.5 14.5 15 25 10.75 86.5 GROSS HOURS
ACT SUNSHINE MIN 0 6 0 8 10 0 24 PD SUNSHINE MIN 0 6 0 8 10 0 24 HEAD KILLED 4.429 4.665 4.499 4.435 4.599 3.228 25.855 LIVE WT 5,571,088 S.720.389 5,709,897 5.519.687 5.77i.636 4.060.934 32,353,811 DRESS WT 3.546-865 3,648,150 3,644,494 ' 3,518,645 3,674,170 2.594.594 20,628,918~
CONDEMNS 1 1 3 4 4 4 17
SLUNKS 2 21 3 0 0 0 26 PERFECT KILL 4.576 4.730 4.730 4.500 4 734 3.279 26.549 PLANNEO KILL 4.831 4,960 4,092 4.707 4.938 3.662 27.689 HD FROM PERFECT (147) (65) (231) (65) 11351 (57) (694: no FROM PUNNED (402) (295) (493) (2721 (3391 (234) 12.034: TARGETED no A 2.365 2.385 2.355 2 3 5 2.365 1.144 12.969
TARGET % A lW.OO% iOo.OO% 9362% lM).OO% ' 94.29% 96.26% 97.47% TARGETED no E 2.211 2.365 2.365 2.135 2.365 2.135 13,576
TARGET % B 93.34% 97 25% 96.62% 96.96% , 100.17% . 9963% ' 97.3%. ROCESSING MON TU€ WED TNU FRI SAT TOTAL
SHIFT CUT
-~
n m D CUT 2.086.0 2.013.5 2,206.0 2.167.5 2.209.5 1.576.5 12.259.0 e 6 8 5.5 45.5
7.75 7.75 5.25 I 14 GROSS HOURS 8 8 , NET HOURS 7.73 7.75 7.75
', SHIFTCUT HEAD CUT 1.981.5 1.942.0 2.008.5 1 . 9 5 5 2.099.5 1.574 0 11.5600 GROSS HOURS 6 8 8 8 e 6 46 NET HOURS 7.15 7.75 7.75 7.75 7.75 5.75 44s
HEAD CUT 4.067.5 3.955 5 '' 4,212.5 , A.124.0 A.309.0 3.1505 23.e19.0
NET HOURS 15.5 '5.5 15.5 15 5 15.5 11 68.5
l T A l CUT rs GROSS HOURS 16 16 16 16 16 11.5 91.5
WE 07/25/98
. .k
DAILY STATISTICS ' q E V S E 0 '
?nu FRI SA 1 TOTAL LAUGHTER MON TU€ WED
SHIFT KILL 8 6 e 8 e G R O S S ~ ~ ~ R S
NET HOURS 7 75 i.75 7 75 7 5 7.75 0 6 0 8 0 0 6 0 e 0
LIVE Wl 3.013.537 2,876.047 2,837,450 2,962,056 2,863,579
ACT SUNSHINE MIN PD SUNSHINE MIN HEAD KILLED 2.365 2 . W
DRESS WT 1,923.966 1,846,132 1,815,978 1.877.733 1,816.021
2.214 2.365 2.230 1.101
7 25 SHIFT KILL
7 5 8 e 7.25 8 7.75 7.75 7 7 5 7 44.25
GROSS HOURS NET HOURS 7.25 ACT SUNSHINE MIN 0 PO SUNSHINE MIN
2.300 2.285 2.070 2369 2,127 13.215 nwa KILLED 2.064 LIVE WT 2.557.531 2,844.342 2.872.U7 2.557.631 2.808.257 2,612,023 16.362.231
0 0 0 IO 0 10 0 0 0 0 10 0
DRESS WT 1,622.899 1,602,018 1.828.516 1,840,912 i.BS8.1d9
.. .
** TOTRL PFlGE.01 *-
. . .
. _ _ _ .-:. _. ... ... . . . . :.. -. . . - . .. - ....
3 3 f 7
. . .
I . .
I BQ ' 3 9 H d
APPENDIX C
LABORATORY DATA
i
f I .
-. _.

\
I
/.
Method 25 Analytical Results
prepared for
TRC ENVIRONMENTAL CORPORATION 1307 Butterfield Road, Suite 420
Downers Grove, IL 60515
Triangle Environmental Services, Inc.
Reviewed by &- Donna Nolen-Weathington
Laboratory Analyst
lpprove by: ,/&+& . '
Report 98156
August 6, 1998
Approved by: Y-?? John Y. Mo ' 010, Ph.D.
P.O. Box 13294 Research Triangle Park, NC 27709 (800) 367-4862
. - -
, ,
. .
! I
I
f
Triangle Environmental Services, Inc.
METHOD 25 TABLE OF RESULTS Client: TRC Environmental Corporation.. . . . . . -. . .ID#98156R- Analyzed:v8/4/98
Project ID: 22214-0000-00011 (IBP/Lexington, Neb.) (Post-test PT data replaced by Laboratory receipt data)
Sample ,- Concentrations (ppmc) -, Mass Description co CH4 COZ Noncon- conden- TGNMO conc .
densibles sibles (mgC/cu.m)
1 super cooker 2 17 6207 5 353 358 179
136 2 super cooker 4 18 5476 19 254 273
3
____I_______
*-
super Cooker < 3 , 21 3479 . 7 289 296 , 148 . . -- .-m
c il = concentration Below Practical Quantitation Limit
* Please refer to the "Comments on the Analyses",page of the report for additional information.
, .
. . !
I
I .
.. - . ... . . ~ . . . . . . .
!
I
.... - - . ..- .
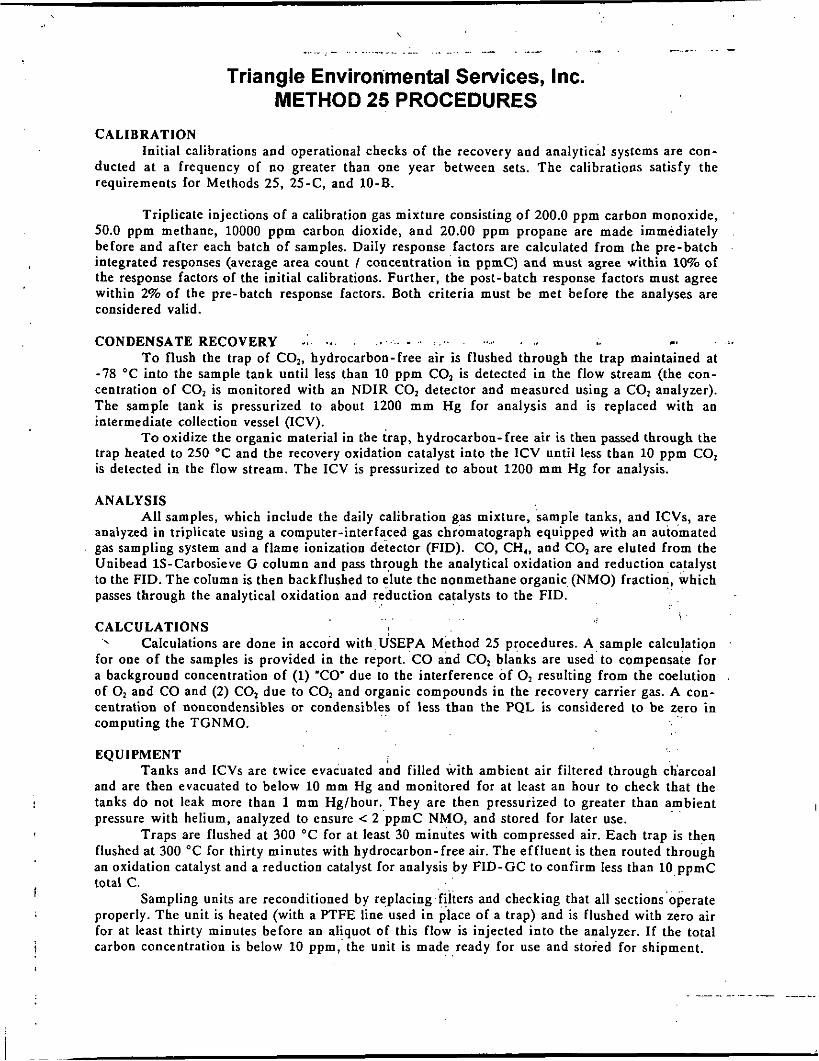
Triangle Environmental Services, Inc. METHOD 25 PROCEDURES
CALIBRATION Initial calibrations and operational checks of the recovery and analytical systems are con-
ducted a t a frequency of no greater than one year between sets. The calibrations satisfy the requirements for Methods 25, 25-C, and 10-B.
Triplicate injections of a calibration gas mixture consisting of 200.0 ppm carbon monoxide, 50.0 ppm methane, 10000 ppm carbon dioxide, and 20.00 ppm propane are made immediately before and after each batch of samples. Daily response factors are calculated from the pre-hatch integrated responses (average area count / concentration in ppmC) and must agree within 10% of the response factors of the initial calibrations. Further, the post- batch response factors must agree within 2% of the pre-batch response factors. Both criteria must be met before the analyses are considered valid.
CONDENSATE RECOVERY .,. . . . . . . . . . . . . . . : . . . . . . . . . . ., I. . .,. To flush the trap of CO?, hydrocarbon-free air is flushed through the trap maintained at
-78 "C into the sample tank until less than 10 ppm C 0 2 is detected in the flow stream (the con- centration of CO, is monitored with an NDIR CO, detector and measured using a CO, analyzer). The sample tank is pressurized to about 1200 mm H g for analysis and is replaced with an intermediate collection vessel (ICV).
To oxidize the organic material in the trap, hydrocarbon-free air is then passed through the trap heated to 250 "C and the recovery oxidation catalyst into the ICV until less than 10 ppm CO, is detected in the flow stream. The ICV is pressurized to about 1200 mm Hg for analysis.
ANALYSIS All samples, which include the daily calibration gas mixture, sample tanks, and ICVs, are
analyzed in triplicate using a computer-interfaced gas chromatograph equipped with an automated gas sampling system and a flame ionization d&tector (FID). CO, CH,, and C 0 2 are eluted from the Unibead 1s-Carbosieve G column and pass through the analytical oxidation and reduction catalyst to the FID. The column is then backflushed to elute the nonmethane organic. (NMO) fraction, which passes through the analytical oxidation and reduction catalysts to the FID.
CALCULATIONS Calculations are done in accord with USEPA Method 2.5 procedures. A sample calculation
for one of the samples is provided in the report. CO and C02 blanks are used'to compensate for a background concentration of (1) TO" due to the interference o f 0, resulting from the coelution of O2 and CO and (2) C 0 2 due to C 0 2 and organic compounds in the recovery carrier gas. A con- centration of noncondensihles or condensibles of less than the PQL is considered to be zero in computing the TGNMO.
EQUIPMENT Tanks and ICVs are twice evacuated and filled with ambient air filtered through ch'arcoal
and are then evacuated to below 10 mm Hg and monitored for at least an hour to check that the tanks do not leak more than 1 mm Hglhour. They are then pressurized to greater than ambient pressure with helium, analyzed to ensure < 2 .ppmC NMO, and stored for later use.
Traps are flushed at 300 "C for a t least 30 minutes with compressed air. Each trap is then flushed at 300 "C for thirty minutes with hydrocarbon-free air. The effluent is then routed through an oxidation catalyst and a reduction catalyst for analysis by FID-GC to confirm less than 10 ppmC total C.
Sampling units are reconditioned by replacing.'fikers and checking that all sections'operate properly. The unit is heated (with a PTFE line used in place of a trap) and is flushed with zero air for at least thirty minutes before an aliquot of this flow is injected into the analyzer. If the total carbon concentration is below 10 ppm, the unit is made ready for use and stored for shipment.
. . . . i .(
''
. .
. .
. .
I

..: ' ..
Triangle Environmental Services, Inc.
METHOD 25 SAMPLE CALCULATION
client: TRC Environmental corporation Io#98156 Analyzed: 8/4/98
Project ID: 22214-0000-00011 (IBP/Lexington, Neb.)
Sample # 1 super cooker
D A T A Note: A L L pressure values have been converted when necessary t o m Hg end a l l temperature values t o Kelvin.
Pressure, Temperature, Volume Data:
Pressure Temp. (m Hg) ...,.:.,. (K)". . .., Tank N283A:
Presampling 3.5 305.37 Tank Volume = 0.004542 cu.m Postsaupling 575.5 305.37 Lab Receipt 556.0 297.15 Tank Final 1218.0 297.15 Trap GGI -f
CV Final 1493.0 298.65 collection Vessel 33:
... .... . .
. . . . .. CV Volume = 0.008361 cu.m
ResDonse Factors I R F ) , Practical Quantitation Limits (PQL), and Area counts: . . . .
RF PQL Area 1 Area 2 Area 3 (area/ppmc) ..'. (ppmc)
co 246.7 2 376 358 0
c02 256.4 2 723,098 722,715 722,456
Condensibles 256.4 4 19,003 19,132 19,107
CH4 259.6 2 .2,024 2,072 1,977
Noncondensibles 253.5 5 576 490 589
CO Blank = 0 area counts ' C02 Blank = 3 ppm
C A L C U L A T I O N S
Measured Concentrations, corrected for blank (ppmc):
Cm(c0) = [Area(CO) - co Blank] / RF(C0) = [ 376 - 0 ] / 246.7 = 1.5 = [ 358 - 0 ] / 246.7 = 1.5 = [ 0 - 0 ] / 246.7 = 0.0
Cm(CH4) = Area(CHB)/RF(CH4) = 2024 / 259.6 = 7.8 = 2072 / 259.6 = 8.0 = 1977 / 259.6 = 7.6
Cm(co2) = Area(CO2)/RF(CO2) - C02 Blank = 723098 / 256.4 - 3 = 2817.2 = 722715 / 256.4 - 3 = 2815.7 = 722456 / 256.4 - 3 = 2814.7
. .

, - . . .. - - ..... . . - . . . . I . .... . .... >
. . . , Triangle Environmental Services, Inc. Method 25 Sample Calculation (p. 2)
Cm(Noncondensib1es) = - - - - =
Cm(Condensib1es) = - - - - - -
Area(Noncondensibles)/RF(Noncondensibles) 576 / 253.5 = 2.3 490 / 253.5 = 1.9 589 I 253.5 = 2.3
Area(Condensib1es) IRF(Condensib1es) - C02 Blank 19003 / 256.4 - 3 = 71.1 19132 / 256.4 - 3 = 71.6 19107 I256.4 - 3 = 71.5
f i i = P i T i (nun Hg/K):
Tank Presampling: Q(2) = 3.5 / 305.37 = 0.011 Tank Postsampling: Qtl).= 575.5 / 305.37 = 1.885 Tank Lab Receipt: Q(5) = 556.0 / 297.15 = 1.871 Tank Final: Q(3) = 1218.0 / 297.15 = 4.099 CV Final : Q(4) = 1493.0 / 298.65 = 4.999
Volume Sampled (dscm) = 0.3857 x Tank Volume x [Q(l)-Q(2)] = 0.3857 x 0.004542 x [i.eas - 0.0111 = 0.003281
Averages and % Relative standard Deviations (%RSD) of Cm's are calculated. ( % E D of C=%RSD Of Cm)
calculated concentrations (ppmc):
C(C0 ) = Q(3)/[Q(l)-Q(2)1 X Cm(C0.J = 4.099/(1.885 - 0.011) X 1.0 = 2.2
C(CH4) = Q(3)/[4(1)-4(2)] X Cm(CE4) 4.099/(1.885 - 0.011) X 7.8 = 17.1 .
. . . C(CO2) = Q(3)/[Q(l)-Q(Z) 1 x Cm(CO2)
= 4;099/(1.885 - 0.011) X 2815.9 6161.9
C(Noncondensib1es) = Q(3)/[Q(l)-Q(Z)] x Cm(Noncondensible8) = 4.099/(1.885 - 0.011) x 2:2 = 4.8'
C(Condensib1es) = Volume(cV)/Volume(Tank) x Q(4)/[Q(l)-Q(Z)] x Cm(condensib1es) = 0.008361/0.004542 X 4.999/(1.885 - 0.011) X 71.4 = 350.9 . .
Total Gaseous Non-Methane Organics(TGNMO)=C(Noncondensibles)+C(Condenaibles) = 4 . 8 +350.9 = 355.6
Mass Concentration (mgC/cu.m) = 0.4993 X TGNMO = 0.4993 x 355.6 = 177.6

\ \
> . --.. . ~ _- . _. ..... - ....... i ..... ~ .............................. .i
Triangle Environmental Services, Inc. METHOD 25 SAMPLE W Q C DATA
DAILY RECOVERY'SYSTEM CHECKS
4.3.1.1. Condensate Recovery System Leak Check
Evacuate system to s10 mm H g absolute pressure, isolate system, and monitor for ten minutes.
Requirement: Pressure Change i 3 mm Hg
4.3.1.2. Condensate Recovery System Background Test .,. ...... . , I .::,. . . . . . . . .,. ... . . . . # T ~ . . . . . . .
Analyze recovery system effluent for C02 concentrations. Requirement: C02 i 10 ppm
4.3.1.3. Condensate Oxidation Catalyst Efficiency Check
Analyze 1% methane standard through oxidation catalyst. Requirement: C02 = CH, concentration r 2%
DAILY ANALYZER CHECKS
5.3' Daily Calibration
Response Factor Checks Requirement: Daily R F = Initial RF f 10% .
daily response factor
Analyzer B
219.06 247.31
NMO 228.34 250.52
Triplicate injections of a mixture of CO, CH,, COX, and C,H, are made before and after each batch of samples.

.. - _. ... . . . . ... . ,.. . . .. .. _. _- . . .- '\ ,
:.. :
i . Triangle Environmental Services, Inc. Method 25 Sample QAIQC Data (p. 2)
INITIAL CONDENSATE RECOVERY SYSTEM TESTS
5.1.1. Carrier and Auxiliary Gas Blank
Requirement: CO + CH, + CO, + NMO s 5 ppm
5.1.3. System Performance Check I I I I I
INITIAL NMO ANALYZER PERFORMANCE CHECKS
5.2.1. Oxidation Catnlyst Etliciency Check Analyzer A,4/8/98; Analyzer B,4/21/98 . .
FID response with reduction catalyst in bypass mode = 0, 0 Requirement: < 1%
5.22' Reduction Catalyst Elliciency Check Analyzer A,4/8/98; Analyzer B,4/21/98 . Response of CH, with oxidation and reduction catalysts in series mode
compared to response with both catalysts in bypass mode. 100.0%, 100.0% Requirement: > 95%
5.2.3' Analyzer Linearity Check+NMO Calibration Analyzer A,4/8/98;Analyzer B,4/21/98
lOOx(1- RF/RF.-) Requirement: max. dev. CO: +1.70%, +1.28% ? 2.5% max. dev. CH,: -2.00%, -1.77% * 2.5% max. dev. CO,: +1.71%, +2.1Wo * 2.5% max. dev. NMO: -1.4270, -1.12% t 2.5% max. 7oRSD: 1.50%. 0.54% < 2%
RF 'NMo' = 0.98, 1.00 RF (Cod
1.0 -k 0.1
\ - .- - ........... .- . - - -
Triangle Environmental Services, Inc. Method 25 Sample QA/QC Data (p. 3)
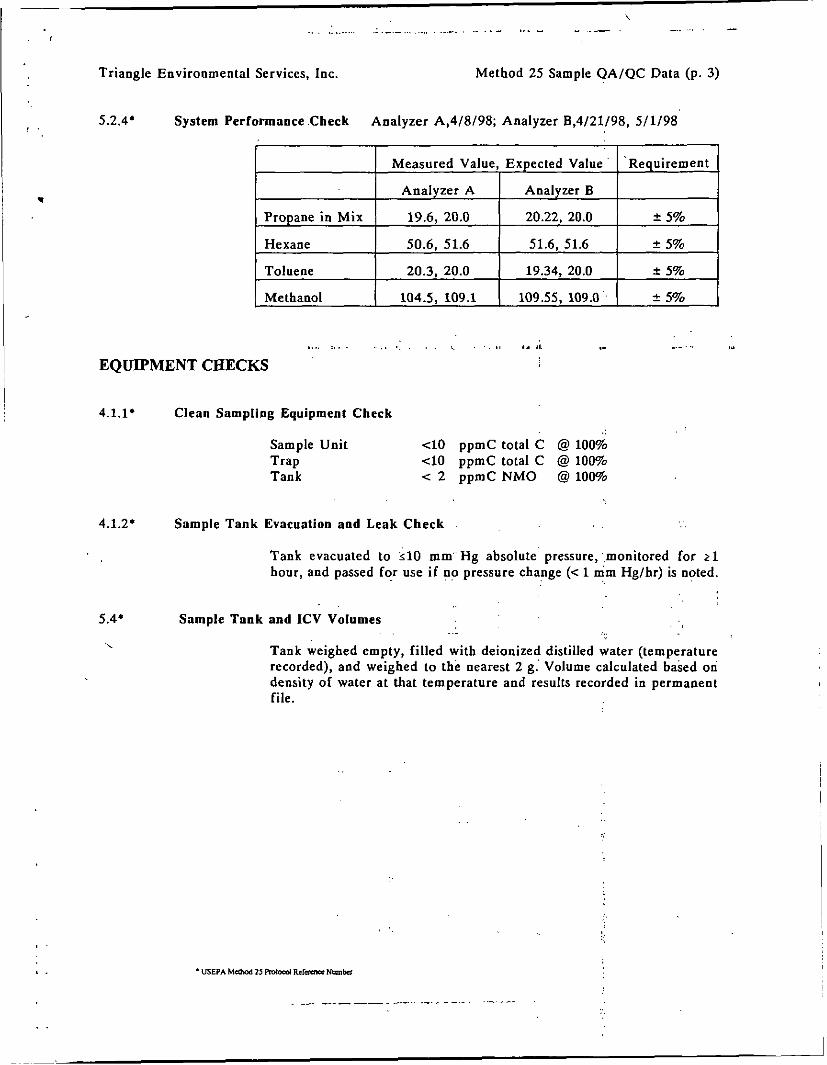
. . 5.2.4. System Performance Check Analyzer A,4/8/98; Analyzer 8,4121198, 5/1/98
,.., :... . . . . . . . . . . . . . . I. ..'I. .- .,._ ...
EQUIPMENT CHECKS
4.1.1. Clean Sampling Equipment Check
Sample Unit t10 ppmC total C @ 100% Trap 4 0 ppmC total C @ 100% Tank c 2 p p m C N M O @lo%
4.1.2' Sample Tank Evacuation and Leak Check
Tank evacuated to <lo mm.. Hg absolute pressure, .monitored for 21 hour, and passed for use if no . . pressure change (< 1 mm Hglhr) is noted.
, ... ...
5.4. Sample Tank and ICV Volumes
Tank weighed empty, filled with deionized distilled water (temperature recorded), and weighed to the nearest 2 9.' Volume calculated based on density of water a t that temperature and results recorded in permanent file.
'\

\
'h ,
. .. . ., . .... . . .. . .. Triangle Environmental Services, Inc.
METHOD 25 DATA REPORT
Client: TRC EnVironIiIental Corporation ID1198156 Analyzed: 8/4/98
Project ID: 22214-0000-00011 (IBP/Lexington, Neb.)
Sample # 1 Super Cooker
Pressure. Temoerature, Volume Data:
Pressure Temp. P/T (m Bg) (K) Tank N283A:
Presampling 3.5 305.37 0.011 Tank Volume = 0.004542 cu.m
Postsampling 575.5 305.37 1.885 Volume sampled = 0.003281 dscni' I .
Lab Receiot P/T = o.993 Postsampling P/T Lab Receipt 556.0 297.15 1.871
Trap GGI + Tank Final 1218.0 297.15 4.099
CV Final 1493.0 298.65 4.999 Collection Vessel 33: CV Volume = 0.008361 cu.m
Response Factors ( W ) , Practical Quantitation Limits (POL). and Area counts:
RF PQL Area 1 Area 2 ?+rea 3 ( area/ppmc ) ( ppmc )
co 246.7 2 376 358 0 CH4 259.6 2 2,024 2,072 1,977 c02 256.4 2 723,098 722,715 722,456 Noncondensibles 253.5 5 576 490 589 Condensibles 256.4 4 19,003 19,132 19,107
Recovery Oxidation Catalyst Efficiency check: COZ/CH4 = 100.6% CO Blank = 0 area counts COZ Blank = 3 ppm
Concentrations: *=corrected for Blank co* CH4 COZ * Noncondensibles Condensibles* TGNMO
Mass Concentration
I PPmc 1 Amount f SO %RSD
2 f 2 86.7 17 f 0 2.3
6162 f 3 0.0 5 f 0 9.8
351 f 1 0.4 356
178 mgc/cu.m

Triangle Environmental Services, Inc.
METHOD 25 DATA REPORT
Client: TRC Environmental.Corporation - 1~898156 Analyzed:-8/4/99-
Project I D : 22214-0000-00011 (IBP/Lexington, Neb.)
Sample # 2 Super cooker
Pressure. Temperature. Volume Data:
Pressure Temp. P/T (m W) (K) Tank 6209T:
Presampling 1.5 308.71 0.005 Tank Volume = 0.006126 cu.m Volume Sampled = 0.004409 dscm Postsampling 577.5 308.71 1.871
.. ,,
Lab Recei t P T = o.941 Lab Receipt 523.0 297.15 1.760 Postsampl~ng p;T .
Tank Final 1512.0 297.15 5.088
cv Final 1500.0 299.65 5.006 Collection vessel 12: Trap DDZ *
CV Volume = 0.008343 cu.m
Response Factors ( R F ) . Practical Quantitation Limits (POL), and Area Counts:
RF PQL Area 1 Area 2 Area 3 (area/ppmC) (ppmc)
co 246.7 3 347 330 368 CH4 259.6 3 1,635 1,597 1,581 c02 256.4 3 485,063 485,058 485,253 Noncondensibles 253.5 6 1,703 1,679 1,669 Condensibles 256.4 3 17,479 17,554 17,528
Recovery Oxidation catalyst Efficiency Check: co2/cH4 = 100.5% CO Blank = 0 area counts C02 Blank = 3 ppm
Concentrations: *=corrected for Blank co* CH4 c02* Noncondensibles Condensibles* TGNMO
7 ppmc 1 .' AmOUnt f SD.. %RSD
4 f 0 5.5 17 f 0 1.7
18 f 0 1.0 239. f . 1 " 0.2 257
5152 f 1 ,: 0.0
Mass Concentration 128 mgc/cu.m
Triangle Environmental Services, Inc. , --3 METHOD 25 DATA REPORT . .
Client: TRC Environmental..Corporation . .. . . .. . ...- .IDA98156 -~nalyzed:-~8/4/98-
Project ID: 22214-0000-00011 (IBP/Lexington, Neb.)
!
Sample # 3 super cooker
Pressure, Temperature, Volume Data:
Pressure Temp. P/T (m Hg) (K) Tank 6208T:
Presampling 4.2 308.71 0.014 Tank Volume = 0.006109 cu.m
Postsampling 615.2 308.71 1.993 ' Volume'sampled = 0.004663 dscm'
Lab Recei t P T Lab Receipt 555.0 298.15 1.861 PostsarDl~nq p;T = 0.934 ~
TraD GGE -, Tank Final 1395.0 298.15 4.679
cv Final 1496.0 300.65 4.976 collection Vessel 40: CV volume = 0.008388 cu.m
Response Factors fRFI. Practical Quantitation Limits fPQLI. and Area counts:
RP PQL Area 1 Area 2 Area 3 (area/ppmc) (ppmc)
co 246.7 2 0 34 308 CH4 259.6 2 2,194 2,209 2,191 c02 256.4 2 353,186 352.875 353,081 Noncondensibles 253.5 5 645 699 638 Condensibles 256.4 3 20,779 20,939 20,728
. Recovery Oxidation Catalyst Efficiency check: COZ/cH4 = 100.4% CO Blank = 0 area counts C02 Blank = 3 ppm
concentrations: *=corrected for Blank co* CH4 c02* Noncondensibles Condensiblest TGNMO
I PPmc 7 Amount f SD . %RSD
20 f 0 ' 8 0.4 3248 f 1 0.0
6 f 0 5.1 270 f 1 ' 0.5 216
< 2
Mass concentration 138 mgc/cu.m
< # = concentration Below Practical Quantitation Limit
. .
Chain O f
Custody -
+T '0 ,
c
- -
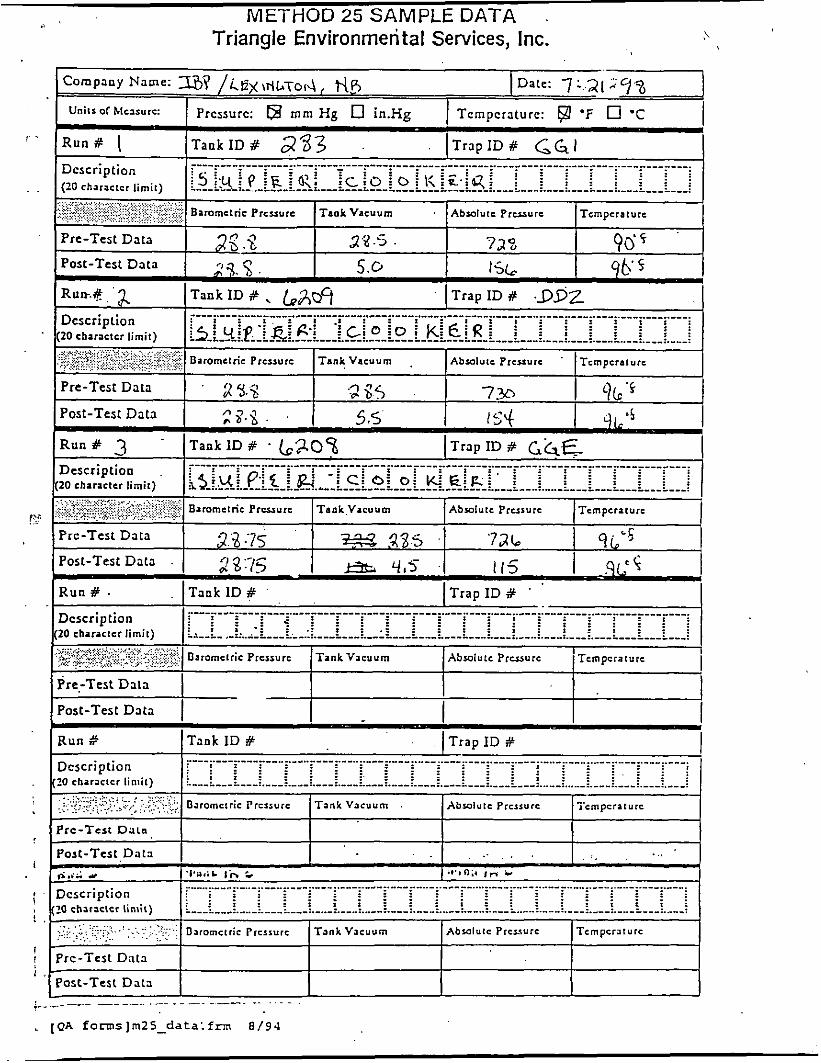
METHOD 25 SAMPLE DATA . Triangle Environmental Services, Inc. >
Pre-Test Data
Post-Test Data c 2 . 3 .
Run# 7 Tank 1D # . ~~0~
I 2 3 '75 I 72b Prc-Test Data
Post-Test Data
R u n # . I Tank ID # ITrapIDB ' '
G. '7 ;I 1-15 lib q,s .I i r5 I 9L.C L
.._- .. . - .. : : : : : : : : : :
L ~ -. ..
. [ Q A forms]mZS-data:f~m 8 / 9 4

!
!
APPENDIX D
EQUIPMENT CALIBRATION

~
=EST DRY CAS METER CALIBRATION DATA FORM (ENGLISH UNITS)
hlE+ER BOX NUMBER: 3
DRY CAS METER NUMBER: 1197469 DATE:
REFERENCE TEST MET DELTA-E
VWT 521.05
Vdr 37.43
T I Tdi Tddo
Td(AVE)
TEFXA VAC.
YI
DELTA-B@I V"
Vd
Vd/Mi&
WAVE) DELTA-€I@(AVE)
YUMBER: 0.5
527.050
43.636
68
75
77
75.8
14.0
1
0.9797
1.5253
5.995
6.201
0.4429
L
27865
1 1.5 2 2.5 3 3.5 4
533.777 539.676 546.597 552.364 558.432 564.039 569.999
50.553 56.606 63.691 69.599 75.930 81.677 87.795
70 70 70 70 70 70 70
81 87 91 95 97 98 100
77 79 80 81 83 84 85
79.0 82.8 85.3 87.8 89.8 91.0 92.3
11.0 8.0 8.1 6.0 6.0 5.0 5.0
1 1 1 1 1 1 1
0.9866 0,9943 1.0000 1.0026 0.9868 1.0055 1.0050
1.4989 1.5358 1.5181 1.4928 1.6121 1.5263 1.5403
6.727 5.899 6.921 5.767 6.068 5.607 5.96
6.917 6.053 7.085 5.908 6.331 5.747 6.118
0.6288 0.7566 0.8747 0.9847 1.0552 1.1494 1.2236
0.9951
1.5313 CALIBRATED BY
29.47
D.W.
V-REFERENCE TEST METER READING VdEDRY GAS METER READING ,
V m A S VOLUME PASSING THROUGH THE REFERENCE TEST METER, CUBIC FEET VdCAS VOLUME PASSING THROUGH THE DRY GAS METER, CUBIC FEET Tw=TEMPERATURE OF THE GAS IN THE REFERENCE TEST METER, DEGREES F Tdi=TEMPERATURE OF THE INLET GAS OF THE DRY GAS METER, DEGREES F Tdo=TEMPERATURE OF THE OUTLET GAS OF THE DRY GAS METER, DEGREES F Td=AVERAGE TEMPERATURE OF THE GAS IN THE DRY GAS METER, DEGREES F DELTA-H=PRESSURE DIFFERENTIAL ACROSS ORIFICE, in. WATER Yi=RATIO OF ACCURACY OF REFERENCE TEST METER TO DRY GAS METER FOR EACH RUN Y=AVERAGE RATIO OF ACCURACY OF REFERENCE TEST METER TO DRY GAS METER DELTA-H@i=ORIFICE PRESSURE DIFFERENTIAL THAT EQUATES TO 0.75 cfm OF AIR
DELTA-H@=AVERAGE ORIFICE PRESSURE DIFFERENTIAL THAT EQUATES TO 0.75 cfm OF AIR
TOLERENCE OF Yi=PLUS OR MINUS 0.020 FROM Y TOLERENCE OF DELTA-H@i=PLUS OR MINUS 0.20 FROM DELTA-H@ PbaEBAROMETRIC PRESSUREJn. Hg. THETA=TIME OF CALIBRATION RUN, Min.
AT 68 DEGREES F AND 29.92 INCEES OF Eg., INCHES OF WATER
AT 68 DEGREES F AND 29.92 INCHES OF Hg.,mcms OF WATER
\
\ \ . . ' ,
I
ROTOMETER CALIBRATION SHEET
Date: q,Zd77 Rotometer Scale: o - I z D =c Initials: W Rotometer Use: ~ m z r SAI~RE ai5 Part#: P I G 41 Calibrated Against: 8;05 bC- I
I
I
61. I L I I
60 I
I I

r SHEET NO.- OF - PROJECT NO.
>
DATE

\ i ,
Date: Lj/t~?/77 Initials: w Part#: p i t d t
J / A
ROTOMETER CALIBRATION SHEE ., !
Rotometer Scale: diL0
Calibrated Against: Rlj. Rotometer Use: -,&-

\ N
’ @
I SHEETNO. OF
\ PROJECT NO
DATE
. . . . . . . . . . . . . . . . . . . . . . . . . . . . . . . . . . .~
q - $ ‘. ~’ % 0
I
.. .- .....
....................
. . . . . . . . . . . . . . . . . . . . . . . . . . . .
.......... . . . . . . . . . . . . . . . . . . . . .
. . . . .
. . . . . . . . . . . . . . . . . . . . . . i . . . . . . . . . . . . . . . . . . . . . . . . \ \ \ \
. . . . . . . . . . . . . . . . . . . . . . . .
....... . . . . . . .
. . . . . . . . . . . . . . . .
. . . . . . . . . . . . . .
...................................
. . . . . . . . . . -\;
.....
. . . . . .
. . . . .
N 2r
9J *
, / :\ , \
ROTOMETER CALlBRATlON SHEET
Date: L//Z&7 Rotometer Scale: cwzo c c m
Initials: w Rotometer Use: mzr GWX- Part #: 216 $3 Calibrated Against: grb 5 Dc-I

, ..
F
I
......
...
. . . . . . . . . . . . . . . . . . . . . . . . . . . . . . . . . . . . . . . . . . . . . . . . . . . . . . . . . . . . . . . . . . . . . . . . . . . . . . . . . .
........................................ .......... . . . . . .~ . . . . . . . . . . . . . . . . . . . . . . . . . . . . . . . . . . . . . . . . . . . . . . . . . . . . . .~ . . . . . . . . . . . . . . . . . . . .
. . . . . . . . . . . . . . . . . :\.. ...
.......
. . . . .
.....................
\ ................
. . . . . . . . . . . .
. . . . . . . . . . . .
..... ..
, .
. . . . . . . . . . . . . . . . ...... ~ .. .................. . . h . .
. . . . . . . . . . . . . ?t . .
. . . . . . . . . . . . . . . . . . . . . . . . . . . . . . . . . . . . . . \
. . . . . . . . . . . . . . . . . . . . . . .
\
. . . . . . . . . . . . . .
. . . . . . .
.
' i

\
Pitot Tube No. ' ' s q
. - \
I .
Type S Pitot Inspection Form
Tubing Olameter, Dt gR Pilot Tube Assembly Level7 e o
Pitot Tube Opening Damaged? g N 0
I fl a l n - a . . . P 2 . O .
I
&t r (< 10')
I I
Level Posltlon IO flnd e =
W = A' sin e
- 5'
In. (< 1132 In.) '009 Comments:
Date: - - Checked by:
Calibratlon Required? a0
Dt = External Tube Olameter
A' = Distance Between Tips (PA+ Pa) inches
3 2 1

I , \
\
. ...
! '
APPENDIX E
CALCULATION FORMULAS
I
\ 1.
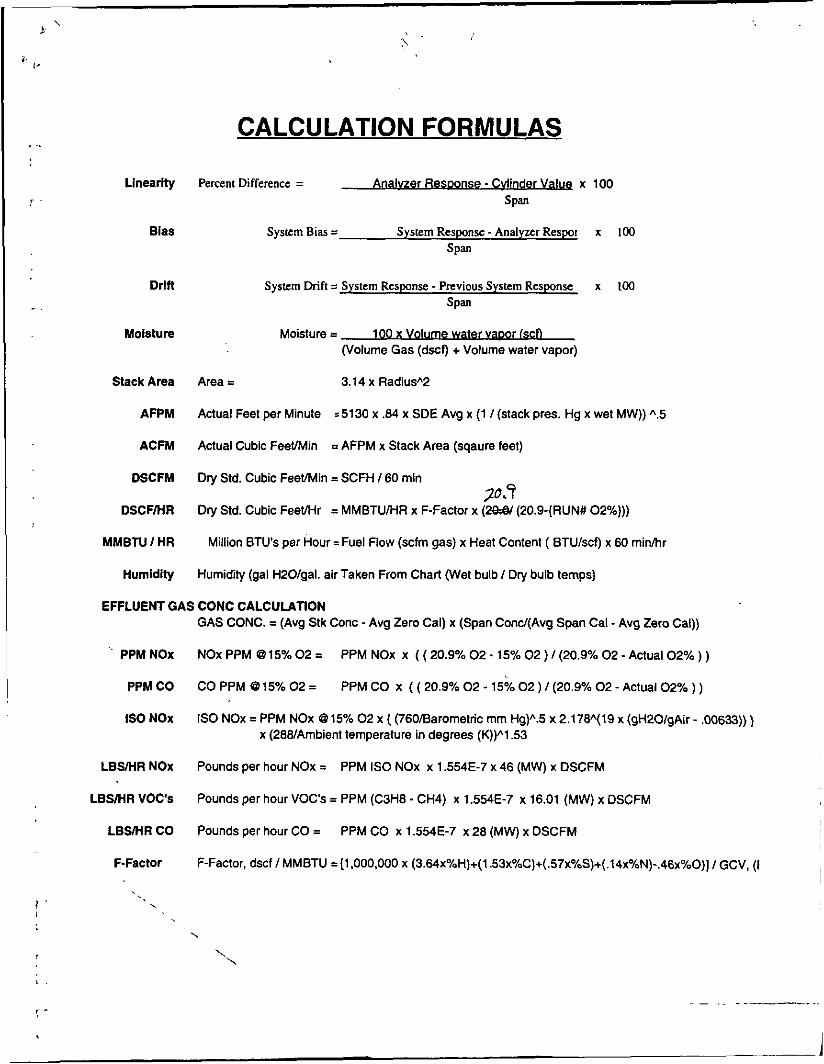
CALCULATION FORMULAS
Linearity Percent Difference = Anal- x 100 span
Bias System Bias = System Response - Analyzer Respor x 100 Span
Drm System Drift = System Response - Previous System Response x IW span
Moisture Moisture = 100 x Vo-r (sa (Volume Gas (dscf) + Volume water vapor)
Stack Area Area = 3.14 x RadiusA2
AFPM
ACFM
DSCFM
DSCFMR
M M B N I HR
Humidity
Actual Feet per Minute = 5130 x .&I x SDE Avg x (1 I (stack pres. Hg x wet MW)) A S
Actual Cubic FeeUMin = AFPM x Stack Area (sqaure feet)
Dry Std. Cubic FeeVMin = SCFH I 6 0 min
Dry Std. Cubic FeeVHr = MMBTUlHR x F-Factor x (W (20.9-(RUN# 02%))) 20.q
Million BTU's per Hour = Fuel Flow (scfm gas) x Heat Content ( BTUIscf) x 60 minhr
Humidity (gal H20Igal. air Taken From Chart (wet bulb I Dry bulb temps)
EFFLUENT GAS CONC CALCULATION
' PPM NOx
PPM CO
IS0 NOx
L B W R NOx
LBS/HR VOC's
L B W R CO
F-Factor
', .
GAS CONC. = (Avg Stk Conc - Avg Zero Cal) x (Span Concl(Avg Span Cat - Avg Zero Cat))
NOx PPM 63 15% 0 2 = PPM NOx x ( ( 20.9% 0 2 .15% 0 2 ) I (20.9% 0 2 - Actual 02% ) )
CO PPM @15% 0 2 =
IS0 NOx = PPM NOx 63 15% 0 2 x ( (760iBarometric mm Hgp.5 x 2.178y19 x (gHZO/gAir - ,00633)) )
PPM CO x ( ( 20.9% 0 2 - 15% 0 2 ) / (20.9% 02 -Actual 02% ) )
x (28UAmbient temperature in degrees (K))V .53
Pounds per hour NOx =
Pounds per hour VOC's = PPM (C3H8 - CH4) x 1.554E-7 x 16.01 (MW) x DSCFM
Pounds per hour CO =
F-Factor, dscf / MMBTU =(l.OOO,OOO x (3.64x%H)+(1.53x%C)+(.57x0/~S)+(.14x0~N)-.46x0~0)] I GCV, (I
PPM IS0 NOx x 1.554E-7 x 46 (MW) x DSCFM
PPM CO x 1.554E-7 x 28 (MW) x DSCFM