9a.4 urban field study results in operational airborne ... · 1 9a.4 urban field study results in...
TRANSCRIPT

1
9A.4 Urban Field Study Results in Operational
Airborne Health Hazard Decision Aid
By
Gail Vaucher and Sean O‟Brien
1. Background History: Field Study to First Responder Decision Aid
In the early 2000s, the U.S. Army Research Laboratory (ARL) conducted three
progressively more complex urban field studies aimed at characterizing the airflow and
stability around a small cluster of urban buildings. As part of the final Study, three
Disaster Response Drills were executed. Observing the emergency response within the
densely instrumented urban field site, the need for a tool to link health and safety
professionals with current, relevant atmospheric-environment data became apparent. A
survey of existing technologies offered potential solutions. However, the ARL saw a
niche for a timely, relevant, user-friendly tool that had not yet been filled, and
consequently, has been developing an information systems technology / decision aid to
satisfy this need. This system is called the Local Rapid Evaluation of Atmospheric
Conditions (L-REAC™)1 System. We will briefly describe the field study and research
that led to this decision aid in the next two subsections.
1.1 Urban Field Study
In March 2003, the White Sands Missile Range (WSMR) 2003 Urban Study, or W03US
for short, characterized surface layer stability transition patterns in the urban
environment, as well as, the airflow behavior around and above a single building. This
Study served as a pre-test for the JOINT URBAN2003 (JU2003)2 field study. The
Study‟s results also qualitatively verified the 1994 National Oceanic & Atmospheric
Administration (NOAA) / Environmental Protection Agency (EPA) wind tunnel study
which examined airflow over a single structure/building (Snyder and Lawson, 1994).
The W03US test subject was a two-story, rectangular, concrete-block office building at
WSMR, NM. Data were acquired 24 hrs per day, 7 days per week (24/7), over a
consecutive two week period. The field study design included four instrumented 10-m
towers, one 5-m tower, and data acquisition systems measuring pressure, temperature,
relative humidity, wind speed, wind direction, and solar radiation. The test site design
was derived from the 1994 NOAA/EPA wind tunnel study. A sample of the wind tunnel
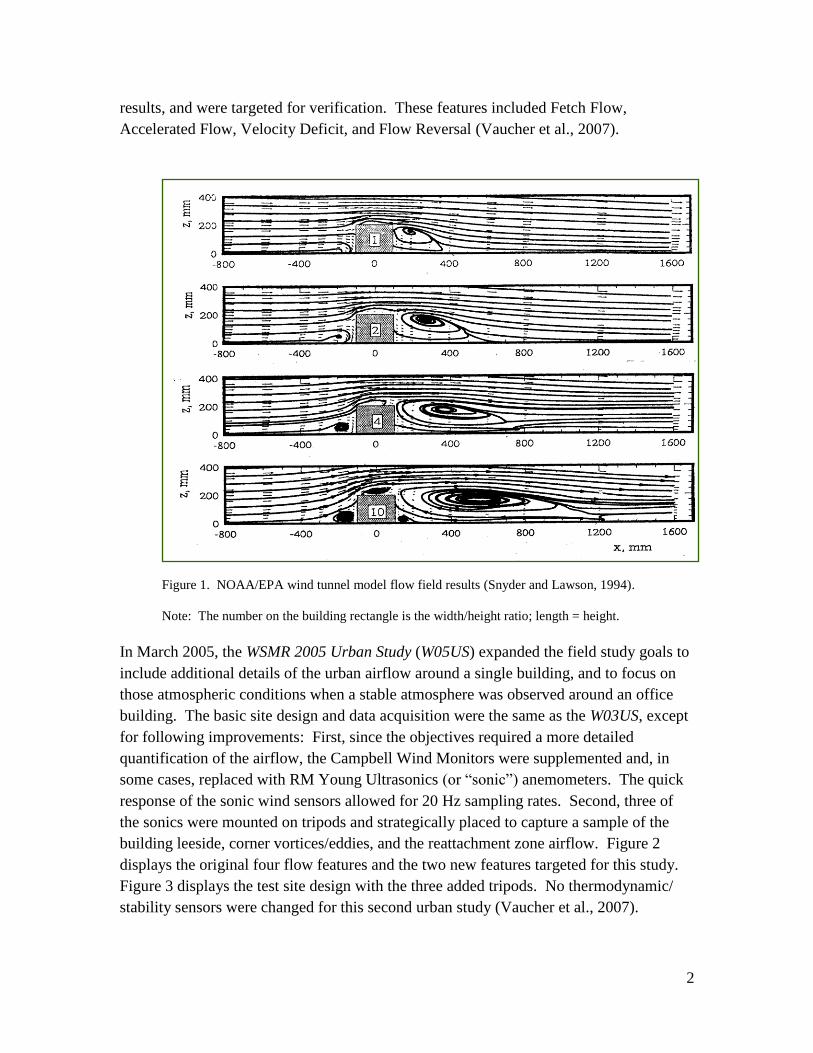
results is shown in figure 1. Four airflow features were identified within the NOAA/EPA
1 The L-REAC System trademark is owned by the Department of the Army, Washington DC, 20310.
2 JU2003 was a multi-agency urban field study conducted at Oklahoma City, OK, in the summer of 2003.
2
results, and were targeted for verification. These features included Fetch Flow,
Accelerated Flow, Velocity Deficit, and Flow Reversal (Vaucher et al., 2007).
Figure 1. NOAA/EPA wind tunnel model flow field results (Snyder and Lawson, 1994).
Note: The number on the building rectangle is the width/height ratio; length = height.
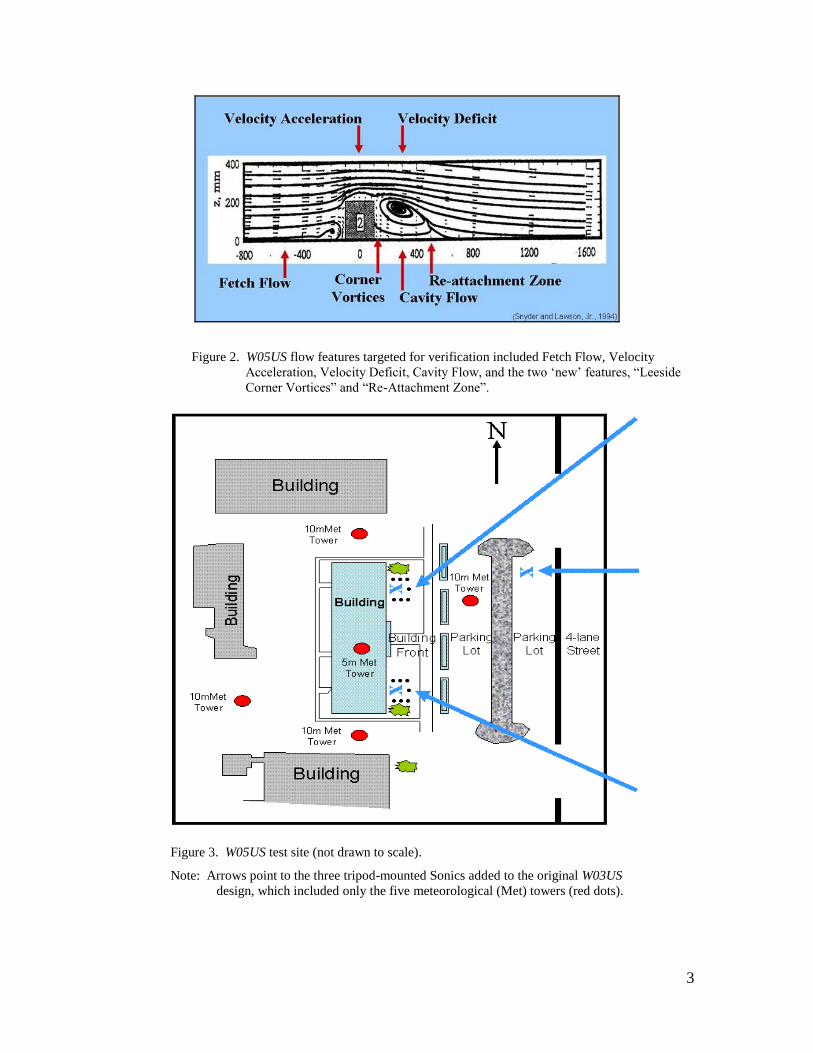
In March 2005, the WSMR 2005 Urban Study (W05US) expanded the field study goals to
include additional details of the urban airflow around a single building, and to focus on
those atmospheric conditions when a stable atmosphere was observed around an office
building. The basic site design and data acquisition were the same as the W03US, except
for following improvements: First, since the objectives required a more detailed
quantification of the airflow, the Campbell Wind Monitors were supplemented and, in
some cases, replaced with RM Young Ultrasonics (or “sonic”) anemometers. The quick
response of the sonic wind sensors allowed for 20 Hz sampling rates. Second, three of
the sonics were mounted on tripods and strategically placed to capture a sample of the
building leeside, corner vortices/eddies, and the reattachment zone airflow. Figure 2
displays the original four flow features and the two new features targeted for this study.
Figure 3 displays the test site design with the three added tripods. No thermodynamic/
stability sensors were changed for this second urban study (Vaucher et al., 2007).
3
Figure 2. W05US flow features targeted for verification included Fetch Flow, Velocity
Acceleration, Velocity Deficit, Cavity Flow, and the two „new‟ features, “Leeside
Corner Vortices” and “Re-Attachment Zone”.
Figure 3. W05US test site (not drawn to scale).
Note: Arrows point to the three tripod-mounted Sonics added to the original W03US
design, which included only the five meteorological (Met) towers (red dots).
4
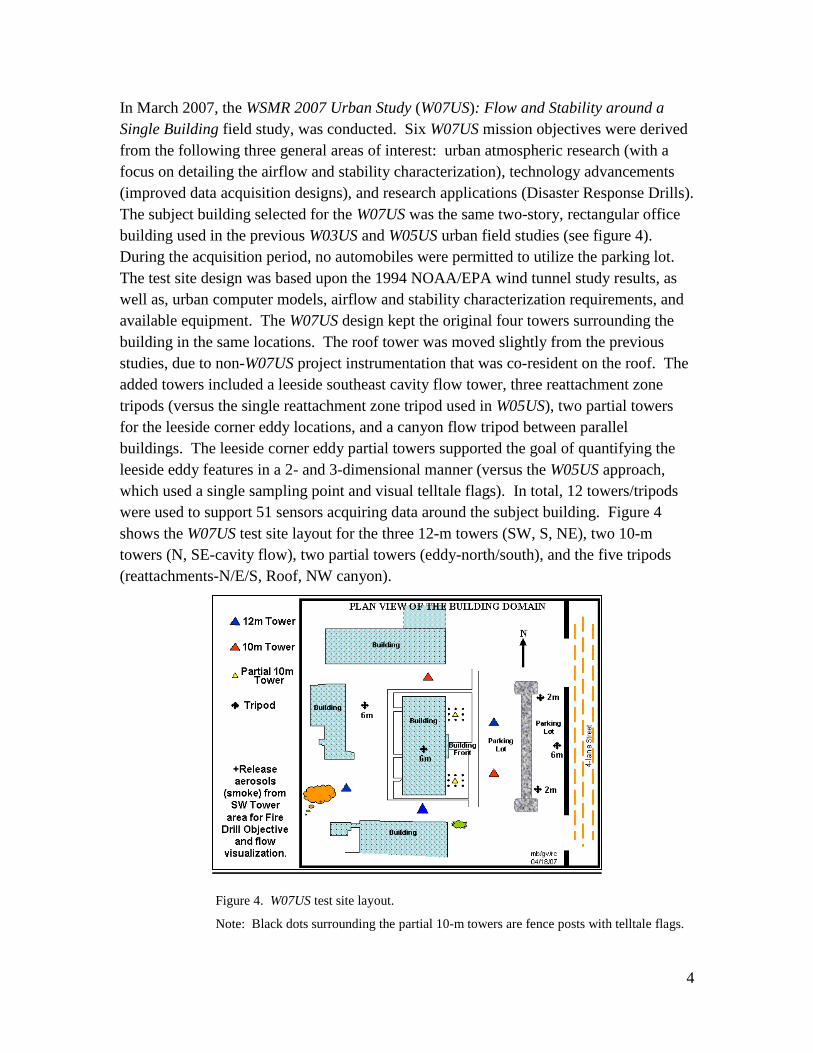
In March 2007, the WSMR 2007 Urban Study (W07US): Flow and Stability around a
Single Building field study, was conducted. Six W07US mission objectives were derived
from the following three general areas of interest: urban atmospheric research (with a
focus on detailing the airflow and stability characterization), technology advancements
(improved data acquisition designs), and research applications (Disaster Response Drills).
The subject building selected for the W07US was the same two-story, rectangular office
building used in the previous W03US and W05US urban field studies (see figure 4).
During the acquisition period, no automobiles were permitted to utilize the parking lot.
The test site design was based upon the 1994 NOAA/EPA wind tunnel study results, as
well as, urban computer models, airflow and stability characterization requirements, and
available equipment. The W07US design kept the original four towers surrounding the
building in the same locations. The roof tower was moved slightly from the previous
studies, due to non-W07US project instrumentation that was co-resident on the roof. The
added towers included a leeside southeast cavity flow tower, three reattachment zone
tripods (versus the single reattachment zone tripod used in W05US), two partial towers
for the leeside corner eddy locations, and a canyon flow tripod between parallel
buildings. The leeside corner eddy partial towers supported the goal of quantifying the
leeside eddy features in a 2- and 3-dimensional manner (versus the W05US approach,
which used a single sampling point and visual telltale flags). In total, 12 towers/tripods
were used to support 51 sensors acquiring data around the subject building. Figure 4
shows the W07US test site layout for the three 12-m towers (SW, S, NE), two 10-m
towers (N, SE-cavity flow), two partial towers (eddy-north/south), and the five tripods
(reattachments-N/E/S, Roof, NW canyon).
Figure 4. W07US test site layout.
Note: Black dots surrounding the partial 10-m towers are fence posts with telltale flags.

5
The sensor systems mounted on each of these 12 towers/tripods consisted of an RM
Young Ultrasonic Anemometer, and/or a suite of sensors linked to a Campbell CR23X
micro-logger mounted on the tower. The meteorological sensors sampling the dynamic
data included the Campbell Wind Monitor (model 05103) and the RM Young Ultrasonic
Anemometer (model 81000). The Wind Monitor sampled every 5 s, then processed the
data into 1-min averages. The sonic sampled data at 20 Hz, and were processed
independently from the wind monitor data. The sonic was selected for its high data rate
capability, which was needed to support the post-test data analysis of turbulence.
The thermodynamic instrumentation consisted of a barometer (with mb units, for output
data), thermometer (C), humicap (%), wind monitor (m/s), pyranometer (W/m2), and for
three locations, a net radiometer (W/m2). All these sensors fed data into a Campbell
CR23X micro-logger. Though the micro-logger‟s 1-min average output reduced the time
resolution, the data acquired did capture the diurnal cycle trends. To optimize the
turbulence measurements (minimize wake effects), the turbulent sensors (sonics) were
mounted on the windward (west) side of the towers, and the mean flow sensors
(Campbell system sensors) were attached to the leeward (east) tower side. The solar
radiation sensors were placed on the un-shadowed south side of the tower.
W07US data were acquired over a two week period in 2007 March, and ran 24/7. The
data acquisition period selected was based on atmospheric stability requirements (March
equinox was selected to minimize the systematic seasonal effects on the daily heating /
cooling cycles), and atmospheric dynamics requirements (March/April NM windy season
was selected to optimize field study conditions for characterizing airflow and in
simulating a wind tunnel) (Vaucher et al., 2007).
1.2 Disaster Response Drills Define a Need
The W07US field study included research application scenarios, which consisted of the
following three simulated Disaster Response Drills: a simulated fire event, a simulated
bomb threat, and a simulated airborne chemical release. Volunteer participants in these
drills responded according to regulations and their role-playing requirements. No
atmospheric data were directly accessible by those commanding the professional
emergency responder actions.
After the scenarios were concluded, an analysis of the atmospheric data acquired during
the three disaster response scenarios was conducted and weighed against the participant
responses (Vaucher, 2011a). In several situations, evacuation instructions followed by
personnel put them in direct danger with the simulated airborne threat. Consequently, a
need to remedy this inadvertent hazard was sought. The primary cause for the
endangerment was a lack of current, relevant, critical atmospheric intelligence. The
6
proposed solution: to find or design a user-friendly system that will provide both timely
and relevant atmospheric information to emergency first responders.
2. Decision Aid Development
Weather plays a key role in responding to emergencies caused by airborne-released
hazards. This role may manifest as a cause, a remedy, and/or a subsequent influence on
the hazardous event‟s evolution. Atmospheric scientists have proposed and employed
various meteorological models to generate emergency-relevant information. While
models are a major contributor toward addressing life-threatening situations, a survey
was conducted that investigated an even wider perspective. The survey focused on
complete, end-to-end service, systems. Results from this investigation were published in
the January 2010, 16th Conference on the Applications of Air Pollution Meteorology
paper, A Survey of Meteorologically-Based Systems for Airborne-Released Hazard
Emergencies (Vaucher and Brice, 2010).
The meteorologically-based systems surveyed showed several common features for the
first-responder, such as the networking of various samplers, the use of various models to
diagnose an incident, and the efficiency of hardware installation. With all the hardware
and software technological advancements, the one piece that afforded improvement was
the certification and integration of the advanced atmospheric transport and dispersion
models into the operational environment. The models themselves were advanced;
however, their operational readiness for emergency first-responder, decision-making
implementation, had not yet come together. Another significant element that seemed
incomplete was the availability of actionable information 24/7, on a local scale. This
requirement prompted the design and development of ARL‟s L-REAC™ System.
2.1 Concept
The L-REAC™ System concept was built on generating near real-time, actionable
information for a full array of emergency first responders, at a local scale. The
subsequent, patent pending system provided a 24/7, automated, near real-time, measured
and modeled, mapped, wind and plume information resource to multiple end users. The
design included instrumentation, data logging interfaces, models, user-friendly output,
quality control tools, and archiving capabilities for post-incident, forensic analysis.
2.2 An Operational System
The L-REAC™ System was first created as a “Proof of Concept” in 2009 (Vaucher et al.,
2009). In 2010, a derivative Prototype was constructed (Vaucher et al., 2010). In 2011,
the first operational system was built and utilized by professional emergency first
responders (Vaucher et al., 2011). With this tool, civilian and military decision makers
have already been able to lower the potential for human suffering, loss of life, and
7
property damage. As an example, in April 2011, a forested area near ARL experienced
an extensive fire that threatened an entire civilian/military New Mexico community. This
incident, known as “the Abrams Fire”, escalated to the point where serious consideration
for a community-wide evacuation (including the ARL workforce) had to be considered
by the local authorities. Early on during this multi-day incident, the Installation
Operations Center (IOC) called on the L-REAC™ System for consultation.
Communication links between ARL and the community advisors to the local authorities
were immediately activated. For the next three days, the L-REAC™ System produced
timely and relevant wind fields and sampled data output for the IOC, Fire and Rescue
Departments, and the New Mexico offices of the Department of the Interior Bureau of
Land Management. Decisions to NOT evacuate the region, and when to implement a
preventative “back” fire were made, in part, on the L-REAC™ System output. Post-
incident reviews prompted such a strong interest in the L-REAC™ System, that training
sessions were organized for the voluntary and professional emergency first responders.
2.3 Human Interactions with the Decision Aid
There are many types of life-saving decisions made during an active incident. The L-
REAC™ System was designed to assist in the majority of these critical choices. Using a
simulated scenario, we‟ll now demonstrate how the L-REAC™ System output might aid
both the spontaneous and willful decision makers. This demonstration presumes that an
L-REAC™ System is installed in the referenced office building, with output accessible to
the simulated incident participants.
SCENARIO: A tanker truck accidently hits a telephone pole near an office building,
releasing toxic fumes into the surrounding area. The sound of the impact prompts
building occupants to respond to this incident.
The persons who are literally the first to respond to this event can either click on their
office computer icon, which will immediately bring up the most current L-REAC™
System wind (and plume) outputs, or they can view these outputs from their building‟s
front lobby screen as they approach the building exit. The L-REAC™ wind (and plume)
outputs empower these initial (trained) responders with near-real-time mapped
information, from which they can discriminate between potential safe and hazardous
areas, as they quickly strategize their retreat from the airborne toxin.
For the untrained building residents, L-REAC™-trained onsite managers can rapidly
formulate and issue informed instructions, directing these personnel to a safe area, based
on the latest wind (and plume) information.
Once Dispatch (911 operators) have been notified, these professionals can view the same
near-real-time L-REAC™ System output, and advise residents whether to shelter in
place, or to evacuate. Dispatch will then determine which response units to activate

8
(security, safety, and/or property preservation). With the L-REAC™ output, Dispatch
can suggest how these units might safely approach the hazardous incident, and from what
location police can safely direct or re-direct traffic.
On location, the incident commander can use the L-REAC™ System output to help
determine where to place the “hot”, “warm”, and “cold” zones. (A hot zone contains the
toxic threat; the “warm” zone is for decontamination operations; a “cold” zone is safe for
support and public relations activities (Multiservice, 2008)).
The airborne toxin identity and quantity data often take time to gather. In anticipation of
this period during which a void of information occurs, L-REAC™ continues to provide a
wind field output from which preliminary decisions can still be made. Once the toxin is
identified, this information is entered into the L-REAC™ System, and modeled plume
outputs are subsequently added to the L-REAC™ output. These outputs are tiered
gradients, showing the threat‟s impact on human life. With this second visual output of
plume geometry, decision maker resources are strengthened, increasing the potential for a
timely resolution to the threat.
Finally, the Incident Commanders (at a command center and/or in the field) need to
delineate the extent of the incident‟s impact, and advise field units accordingly. The L-
REAC™ System provides near real-time mapped images that can assist with this task.
All these critical decisions, as well as other cascaded choices, continue until the area of
interest is once again declared safe for public use. The automated L-REAC™ System is
designed to continually function before, during, and after the incident.
3. Professionals Evaluate Decision Aid
As part of a technology transfer process, the L-REAC™ System was subjected to several
informal and formal evaluations. The first evaluation examined the intuitive nature of the
output. Thirty Gains in the Education of Mathematics & Science (GEMS) high school
students/teachers were asked to use the L-REAC™ System to assess the wind flow and
safe zone locations. The success of this informal evaluation was followed by several
Exercises and Emergency Response Drills, during which informal feedback by various
end users was provided. In 2011, the Operational L-REAC™ System participated in real-
world events. These usages prompted formal training sessions for the local professional
emergency organizations. Within these training sessions, the first formal L-REAC™
System evaluations were conducted. The focus of the evaluation exercise was to identify
practical system improvements, after an initial training session.
The formal, written evaluation was organized into two questionnaires: (1) A detailed
review of the L-REAC™ System Functionality; and (2), an Administrative
Questionnaire, which looked at the L-REAC™ System from an overview and future

9
vision perspective. The first questionnaire also served as an informal test for the students
who had just completed their initial training. This „test‟ was not graded, and in fact, the
turned in evaluation forms were labeled by a randomly-drawn number that the students
used in place of their name.
The final list of evaluators represented both voluntary and professional emergency first
responders. The majority of participants had no formal meteorological instruction prior
to the L-REAC™ Training I class.
3.1 Evaluation of Functionality
The L-REAC™ System functionality evaluation focused on the two main End User‟s
Display (EUD) products, called the 1-Plot and 2-Plot graphics. Figures 5 and 6 give an
example of these outputs.
Figure 5. L-REAC™ System EUD, 1-Plot graphic.
Figure 6. L-REAC™ System EUD, 2-Plot graphic.

10
The functionality questionnaire examined L-REAC™ System EUD details while running
three Cases:
• Case I: No Plume Scenarios.
• Case II: Plume Scenarios.
• Case III: No Plume/Plume Scenarios, using Trainer and Trainee-selected locations.
Each scenario consisted of a timed series of real-time images (lasting about 2 minutes for
each image), from which the trainees independently determined their questionnaire
responses. For all but one trainee, the sequenced Cases of L-REAC™ System output
were viewed from their office computer. One trainee utilized a conference room display.
The questionnaire topics began with an assessment of connectivity to the L-REAC™
System, moved to identifying multiple output details, then focused on features critical to
decision makers. For the wind field graphics, the three critical features consisted of:
• Finding compass North
• Determining airflow direction
• Determining airflow speed
Compass North was a key element because the correct map orientation is critical to all
subsequent decision aid applications. Identifying the current wind direction and speed
were also flagged as crucial, since one of the very first questions normally demanded of
any responder, following an airborne toxin release, involves the current winds.
For the plume graphical output, the three critical elements were:
• Finding compass North
• Determining the (general) hazardous areas generated by the plume
• Determining the most/least hazardous areas
Again, map orientation was assessed as crucial to a successful communication of decision
aid results and receiving field observations. Interpreting the EUD for the hazardous
areas, as well as, identifying the most and least hazardous areas, is the primary objective
for this decision aid.
A brief summary of the trainee responses to the functionality questionnaire follow
(Vaucher, 2011b):
The L-REAC™ System communications and output frequency updates were
determined to be “sufficient” by the users/evaluators.
11
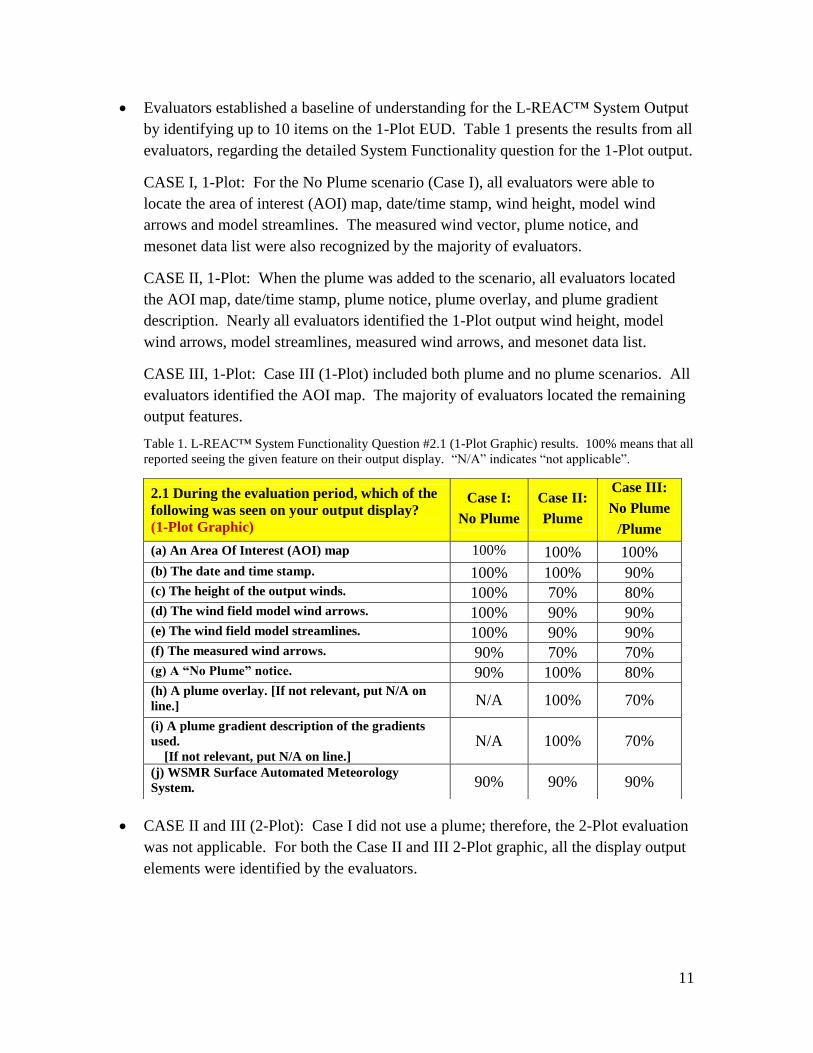
Evaluators established a baseline of understanding for the L-REAC™ System Output
by identifying up to 10 items on the 1-Plot EUD. Table 1 presents the results from all
evaluators, regarding the detailed System Functionality question for the 1-Plot output.
CASE I, 1-Plot: For the No Plume scenario (Case I), all evaluators were able to
locate the area of interest (AOI) map, date/time stamp, wind height, model wind
arrows and model streamlines. The measured wind vector, plume notice, and
mesonet data list were also recognized by the majority of evaluators.
CASE II, 1-Plot: When the plume was added to the scenario, all evaluators located
the AOI map, date/time stamp, plume notice, plume overlay, and plume gradient
description. Nearly all evaluators identified the 1-Plot output wind height, model
wind arrows, model streamlines, measured wind arrows, and mesonet data list.
CASE III, 1-Plot: Case III (1-Plot) included both plume and no plume scenarios. All
evaluators identified the AOI map. The majority of evaluators located the remaining
output features.
Table 1. L-REAC™ System Functionality Question #2.1 (1-Plot Graphic) results. 100% means that all
reported seeing the given feature on their output display. “N/A” indicates “not applicable”.
CASE II and III (2-Plot): Case I did not use a plume; therefore, the 2-Plot evaluation
was not applicable. For both the Case II and III 2-Plot graphic, all the display output
elements were identified by the evaluators.
2.1 During the evaluation period, which of the
following was seen on your output display?
(1-Plot Graphic)
Case I:
No Plume
Case II:
Plume
Case III:
No Plume
/Plume
(a) An Area Of Interest (AOI) map 100% 100% 100%
(b) The date and time stamp. 100% 100% 90% (c) The height of the output winds. 100% 70% 80% (d) The wind field model wind arrows. 100% 90% 90% (e) The wind field model streamlines. 100% 90% 90% (f) The measured wind arrows. 90% 70% 70% (g) A “No Plume” notice. 90% 100% 80% (h) A plume overlay. [If not relevant, put N/A on
line.] N/A 100% 70%
(i) A plume gradient description of the gradients
used.
[If not relevant, put N/A on line.] N/A 100% 70%
(j) WSMR Surface Automated Meteorology
System. 90% 90% 90%

12
3.1.1 Wind Field EUD Output
For the 1-Plot/Wind Field output, nearly all evaluators were able to find compass North
for each of the three Cases. All evaluators defined the determining of the airflow
direction as “easy” for Cases I and III. In Case II, one person selected “sort of” easy,
while all others found the task “easy”. The airflow speed was a little more challenging,
as they had to refer to the mesonet data table, and locate the measured vector on their
visual output. Still, the majority labeled the task as “easy”.
For the 2-Plot/Wind Field output, the majority of the evaluators found compass North
“easy” for each of the three Cases. The airflow speed and direction were also considered
“easy” for the majority of responses. There was a consistent increase in the percentages
between Cases I and II, which implied an improved understanding, and served as a
reminder that most of the evaluators were still assimilating the L-REAC™ Training I
information.
3.1.2 Plume EUD Output
Case I did not use a plume, and therefore was not included in the questionnaire‟s plume
assessment portion. When the 1-Plot showed a plume (Cases II and III), the evaluators
were able to identify the plume and the hazard-gradient information. For the Plume/2-
Plot output, the majority of evaluators found compass North “easy”.
The “hazardous areas” were “easy” to locate for the majority of evaluators.
The “most and least hazardous areas” were considered “easy” to find by the majority of
evaluators. A suggestion to darken the contrast within the plume gradients was
implemented as a system upgrade.
3.2 Evaluation of System Application
The results of the Administrative Questionnaire reported that, from the remote access
start up, through the perpetually updated wind and plume images, the L-REAC™ System
was easily understood and utilized. Evaluators unanimously stated that they would
recommend the L-REAC™ System. The greatest strengths and their reasons for
recommending the System aligned with the original L-REAC™ System design objective
of “saving lives” and “ease of use”. The user comments also underscored the challenge
of finding funding resources to support system development costs.
The individual evaluator applications listed for the L-REAC™ System consisted of
Chemical, Biological, Radiological and Nuclear Effects (CBRNE) Force Protection
applications, IOC, Emergency Operations Centers (EOC), Fire and Rescue Departments,
and Emergency Dispatch. All evaluators reported that the L-REAC™ System would be
an asset to their profession/application.
13
System strengths cited included five comments which praised the ease of use,
understandability of end products, and the “great” potential of the System. Specific
statements explaining what the evaluators liked about the system included:
• A great tool with potential (#11)
• Very easy to understand and read winds (#15)
• Clear and concise output and user friendly (#16)
• Easy to use & understand. (#10)
• Clear and concise. Displays the most pertinent information (#8)
• Everything: wind flow, speed, current data, (and) toxic plume data (#18)
Note: the numbers following a statement indicate the evaluator number.
Two scenarios for integrating the L-REAC™ System into the operational emergency
environment were offered to the evaluators: (1) Multiple L-REAC™ Systems would be
owned and operated by various organizations. (2) One L-REAC™ System would be
owned and operated by a single organization, who served multiple users representing
different organizations.
The evaluators commented on the given scenarios, but also volunteered a third possible
system integration arrangement: Two local organizations would own an L-REAC™
System, with one organization as the primary operator, serving multiple users of different
organizations. The second System would be installed at a different location, and would
serve as a backup unit, should the primary unit/location suddenly lose power or network
connectivity. Based on current national economics, this third option may be the best
arrangement.
Evaluators unanimously selected the Fire Dept/Medical and the IOC as appropriate
System owners, with the majority also selecting the EOC and the Incident Command (IC)
on location. The least recommended owners were the installation command offices. The
top recommendation for prospective System users was the Fire Dept/Medical, with the
IOC, EOC, Police, IC on location, and IC in IOC also suggested by the majority of
evaluators. The least recommended user was again the installation command office. The
“Dispatch” office was a written-in suggestion for both an owner and user.
The directions for accessing L-REAC™ System output were unanimously evaluated as
“easy to follow,” and the output was flagged as timely. The output details were assessed
as “enough” (versus “too many details”). The Operator‟s zoom in capability was
considered very useful in the EM (emergency management) arena.

14
Regarding the two main output display products (current wind field and plume overlays
mapped onto a given area of interest), the majority of evaluators considered the product
features useful, with 78% of evaluators indicating ALL information as “most useful”.
The Administrative Questionnaire concluded with an invitation to make any „Final
Comments‟. A sample of the evaluator final comments included the following:
• Good & easy system to use. Is this the system used by the weather people on TV
that show wind maps of the area; or can they be tied in together. (Evaluator #10)
• Keep up the great work. (Evaluator #14)
• I think the IOC could use a bigger map for the wall, so that when things get
hopping, we don’t have a crowd behind a computer. Also, it would help (to) show
the bigger picture. (Evaluator #15)
• Great demonstration. (Evaluator #16)
• Incredible what comes out of burning… [toxic waste]! Also, would like one day a
week for a month or so to train operators by having L-REAC™ on-line and
processing data requests from the IOC. (Evaluator #18)
4. Summary
The ARL conducted three progressively more complex urban field studies aimed at
characterizing the airflow and stability around a small cluster of urban buildings. Three
Disaster Response Drills were executed, as part of the final urban field study. Observing
the emergency response within the thickly instrumented urban field site (51 sensors on 12
strategically-placed tower/tripods), a need to link health and safety professionals with
current and relevant atmospheric-environment data became apparent. A post-study
analysis of the atmospheric data acquired concurrently with the drill executions,
confirmed this requirement.
Existing meteorologically-based technologies were surveyed, offering potential solutions.
However, the ARL saw a niche for a timely, relevant, local, user-friendly tool that had
not yet been filled. Consequently, the Local Rapid Evaluation of Atmospheric Conditions
(L-REAC™) System was designed and developed.
The L-REAC™ System design (patent pending) was built on task of generating near real-
time, actionable information, for a full array of emergency first responders, at a local
scale. The subsequent system provides a 24/7, automated, near real-time, measured and
modeled, mapped, wind and plume information resource, to multiple end users. The
design included measurements, models, user-friendly output, quality control tools and
archiving capabilities for post-incident, forensic analyses.

15
The decision aid construction has evolved from a concept, to a “Proof of Concept”, to a
Prototype, and is now an Operational System. As part of a technology transfer effort, the
system has undergone several informal evaluations. Feedback from these informal
resources has ranged from high school students, who demonstrated the intuitive nature of
the system, through emergency response professionals, who offered very practical
suggestions.
In 2011, the decision aid was asked to participate in „real world‟ incidents. This
opportunity led to training sessions for volunteer and professional emergency first
responders. As part of the second training level, a formal evaluation was solicited from
the trainees. This evaluation also served to test the trainees on the materials they had just
learned.
The evaluation was subdivided into two questionnaires: A Functionality Questionnaire
that focused on details from the two primary EUD outputs, and an Administrative
Questionnaire that looked at the „big picture‟ issues. A sample of the results was
included in sections 3.1 and 3.2. The majority of users were able to identify the
requested details of the EUD output. The key elements for the wind field and plume
outputs were also scaled as “easy” by nearly all users.
Participants responding to the questionnaires represented CBRNE Force Protection
applications, IOC, EOC, Fire/Rescue, and Emergency Dispatch. All evaluators reported
that the L-REAC™ System would be an asset to their profession/application. They
unanimously stated that they would recommend a purchase of the system, citing the
potential for „saving lives‟ and „ease of use‟ as motivations.
A sample of evaluator “Final Statements” were listed in section 3.2. Evaluator numbers
are listed next to the comments.
All evaluator comments were extremely helpful in calibrating the value of the L-REAC™
System to the emergency response community. Several suggestions have already been
implemented into the current Operational L-REAC™ System. Our original goal was to
empower emergency first responders of airborne hazards with a tool capable of providing
timely and relevant atmospheric data. Between the evaluation results, and the positive
feedback the L-REAC™ System received after participating in the real-world incidents,
we think we‟re at least in the right direction for lowering human suffering, and the loss of
life in the local environments.
ACKNOWLEDGMENTS: The authors would like to thank all the L-REAC™ System
Improvement Evaluation participants for their constructive and candid feedback.
16
REFERENCES
Multiservice Tactics, Techniques, and Procedures for Chemical, Biological,
Radiological, and Nuclear consequence Management Operations, FM3-11.21,MCRP
3-37.2C, NTTP 3-11.24, AFTTP(I) 3-2.37, 2008 Apr.
Snyder, W. and R. Lawson, Jr., Wind-Tunnel Measurements of Flow Fields in the
Vicinity of Buildings, 8th Conf on Appl. Air Poll. Met., Jan 1994.
Vaucher, G. T.; Bustillos, M.; D‟Arcy, S.; Brice, R.; Cionco, R.; Chamberlain, F.;
Trammel, J.; Luces, S.; Padilla, R.; Yarbrough, J. White Sands Missile Range 2007
Urban Study: Flow and Stability Around a Single Building, Volume 1: Field Study
Overview; ARL-TR-4255; U.S. Army Research Laboratory: WSMR, NM,
September 2007.
Vaucher, G.T.; Luces, A.; O‟Brien, S.; Brice, R.; Bustillos, M.; D‟Arcy, S. Local-Rapid
Evaluation of Atmospheric Conditions (L-REAC) System, Design and Development,
Volume 1 (“Proof of Concept”); ARL-TR-4958; U.S. Army Research Laboratory:
White Sands Missile Range, NM, September 2009.
Vaucher, G. and Brice, R.; A Survey of Meteorologically-Based Systems for Airborne-
Released Hazard Emergencies, 16th
Conference on the Applications of Air Pollution
Meteorology, 90th
AMS Annual Meeting, Atlanta, GA, Jan 2010.
Vaucher, G.T.; Luces, A.; O‟Brien, S.; Brice, R. Local-Rapid Evaluation of Atmospheric
Conditions (L-REAC) System, Design and Development, Volume 2 (“Prototype”);
ARL-TR-5332; U.S. Army Research Laboratory: White Sands Missile Range, NM,
September 2010.
Vaucher, G. T.; Brice, B.; Luces, S.; O‟Brien, S. Local-Rapid Evaluation of Atmospheric
Conditions (L-REAC) System, Design and Development, Volume 3 (“Operational L-
REAC™ System”); ARL-TR-5727; U.S. Army Research Laboratory: White Sands
Missile Range, NM, September 2011.
Vaucher, G.T. White Sands Missile Range 2007 Urban Study (W07US): Data Analysis,
Volume DA-1 (Analysis of Disaster Response Drills and Concurrent Atmospheric
Data); ARL-TR-5706; U.S. Army Research Laboratory: White Sands Missile Range,
NM, September 2011a.
Vaucher, G. T. Local-Rapid Evaluation of Atmospheric Conditions (L-REAC) System,
Volume 4 (System Evaluation); ARL-TR-5848; U.S. Army Research Laboratory:
White Sands Missile Range, NM, December 2011b.