9j ge 8 - d28rz98at9flks.cloudfront.net · contents summary 1. introduction 2. p~ous geophysical...
TRANSCRIPT

.,'
COMMONWEALTH OF AUSTRALIA
/ - / Nv~l
DEPARTMENT OF NATIONAL DEVELOPMENT
BUREAU OF MINERAL RESOURCES, GEOLOGY AND GEOPHYSICS
.. ---- --- ".-.-.... -~~-"-=-~ ~DUf"""'\ 9J 0'" ., .... q. '. . . ''''-''-3 1 'H1.~, ;' liHi'la::.l";J... i, ••.••.. : .•••.• , ,
\ GEf"\'~PV'~ t (,,.. L i! r:~:\ r~\1 f~~V! 11 ~ UI\)R - t:..,IL'I'i~d ~ .: .. '
1.' ~Jf., .•..•.. 0 .. <4 ••• 8 ......... "u ........ _ '.' 'l' ___ .~~~
RECORD No. 1965/22
MENZIES' AND' LEONORA AIRBORNE MAGNEl'IC AND· RADIOMErRIC SURVEY, WA 1964
by
RESTRICTED
Thi~ Record contains preliminary information only and is subject to amendment before final issue. It is intended I
for the private use of tenement holders or authorities who can, make immediate use of the data and is not to be made available to anyone other than the original recipients without the Director's approval. The data after further review mav be issued as an unrestricted Record. .

.... ,.
---
-'
-.-
... . -
CONTENTS
SUMMARY
1. INTRODUCTION
2. P~OUS GEOPHYSICAL INVESTIGATIONS
3. GEDLOGY
Menzies 1:250,000 area
Leonora 1 :250,000 area
MAGNEl'IC RESULTS AND INTERPREl'ATION
RADIOMETRIC RESULTS AND INTERPRETATION
6. CONCLUSIONS AND RECOMMENDATIONS
REFERENCES
APPENDIX 1 - Operation Details
APPENDIX 2 - Outboard Radiometric Anomalies
ILLUSTRATIONS
Plate 1. Locality Map
Plate 2. Geop~sical interpretation and geology
Plate 3. Geop~sical interpretation and geology
Plate 4. Total magnetic intensity profiles
Plate 5. Total magnetic intensity profiles
Plate 6. Total magnetic intensity profiles and
magnetic trends
Plate 7. Total magnetic intensity profiles and
magnetic trends
Plate 8. Radiometric profiles
Plate 9. Radiometric profiles
Plate 10. Radiometric contours and geology
Plate 11. Radiometric contours and geology
Plate 12. TYPes of radiometric anomalies
( , L
I •• l '~. I :"') .,
. I', i •.
(.:, ",' ., I
,,,I " :'
Menzies
Leonora
Menzies
Leonora
Menzies
Leonora
Menzies
Leonora
Menzies
Leonora
Page
1
2
3
4
6
8
13
15
16
;

,..-
"', ... '"
. '\ ...
.An airborne magnetic and radiometric survey of the Menzies
and Leonora 11250,000 areas was nown in 1964. This reoord deals with
analyses of the magnetic and radiometrio results.
Interpretation of the magnetio data is primarily qualitative
and inoorporates the resolution of magnetio trends and subdivision of
the survey area into zones of speoified magnetio charaoter. The geological
signifioance of these zones has been tentatively ascribed to oertain rook
types.
A limited interpretation of regional geological struoture has
been made from a study of zonal oonfigurations and the repetition of
intrazonal magnetio anomalies, supplemented by qualitative and quantitative
dip analyses.
Seven major east-west dykes have been defined. These dykes
generally appear to have widths of 1000 feet, near vertioal dip and depth
of burial wi thin 100 feet of surfaoe level. Two dykes have remanent
magnetisation, the remainder appear normally polarised.
The oonvergenoe of magnetio and interpret.ted geologioal
features at latitude 290 33'S, lOngitude 1200 11 IE defines a looality whioh
warrants ground investigation~
A oontour presentation of radiometrio data reveals a general
oorrelation between variations in gamma radiation and both the known
geology and that interpreted trom magnetio data.
Sixty four radiometric anomalies of restrioted source have been
deteoted of which forty seven are recommended for ground investigation •

'\
"', ..
,
1
• .
1 • INTRODUCTION
A programme of airborne magnetic and radiometric surveys
in the goldfields region of Western Australia including the Balfour Downs,
Roy-Hill, Mt. Bruce, Wyloo, Yarraloola, Dampier, Belele, Meekatharra,
Wiluna, Kingston, Edjudina, Menzies, Laverton, Leonora, Youaruni, Duketown,
Sir Samuel and Sandstone 11250,000 areas was requested by the Western
Australian Mines Department in February 1959. Following the completion of
the airborne survey programme of the 1 :250,000 areas Southern Cross,
Kalgoorlie, Barlee, Jaokson, Kurnalpi, Widgiemool tha, Boorabbin, Norseman
and Lake Johnston, which had been commenoed in 1956, the request was reviewed
in Ootober 1963 by the Geologioal Survey of Western Australia. As a result
the programme was altered to the 1:250,000 areas of Menzies, Edjudina,
Leonora, Mt. Egerton, Mt. Phillips, Robinson Range, Belele, Cue, Kirkalocha,
Laverton, Youanmi and parts of Glenburg, Byro, Murgo and Yalgoo. Priority
was given to the Menzies and Leonora areas as the.y formed a northerly
extension of the work alrea~ oompleted (Plate 1). These two areas which
are defined by the 28000' and 30000' parallels of south latitude and
120000' and 1210 30' meridians of east longitude were surveyed by the Bureau
of Mineral Resouroes t D. C. 3 airoraft VB-MIN during the period October to
November 1964. This report deals with the interpretation of the magnetic
and radiometric results.
Geologioally the goldfields included in Plate 1 are located in the
Pre-Cambrian shield area of Western Australia whioh is a oomplex of meta-
igneous and meta-sedimentary rocks with a variety of intrusive and
replaoement rooks.
Forman (1953) classifies the basio meta-igneous and meta-sedimentary
rooks of this Pre-Cambrian shield into three series 1-
1. The Older Greenstones
2. The Whi testones
3. The Younger Greenstones
These series have a dominant structural trend in a north-north-west to
north-west direotion. A further subdivision has been made, (Low 1959) of
the Older Greenstones into basio lavas and a suite of ultra basio rooks •
Both the Older Greenstones and the Whitestones contain minor developments of
banded iron formations or jaspilites.

i •
2.
Mineralisation, of which gold has the greatest economio
importanoe, is predominately confined to the Greenstones though bearing
an association with intrusive granite. The concept of ttfavourable beds"
and ttgold lines" is supported in most geological reports on the
goldfields.
The objective of this survey was to provide data to assist in
the future regional mapping of the area, rather than an attempt to detect
eoonomio mineralisation direotly.
2. PRlWIOUS GEOPHYSICAL INVESTIGATIONS
There is no referenoe to e:rry previous geop~sical work in the
Menzies or Leonora 11250,000 areas; however limited work is at present
being oarried out by Western Mining Corporation.
The use of the airborne magnetic survey method in the goldfields
area was advocated by Miles 1953 with the object or delineating the
banded iron formations which might serve in establishing the control on
geological structures and ore genesis in areas of extensive alluvium cover.
It was not suggested that direct detection of economic mineralisation
would be possible in this locality.
Airborne magnetio and radiometric surveys have been flown over
the Kalgoorlie, Southern Cross, Barlee and Jackson (Spence 1958),
Kurnalpi and Widgiemooltha (Carter 1959), Boorabbin and Norseman (Forsyth
1963) and Lake Johnston (Wells 1962) 1:250,000 areas, (Plate 1).
It has now been shOwn( Quilty/1964) that the banded iron
(jaspilite) formations within the Archaean metamorphosed sediments and
lavas are clearly delineated in these maps of total magnetic intensity,
and furthermore do serve as marker horizons in tracing the major fold
axes. The correlation of aeromagnetic data with geological mapping of
Soufoulis (1960) in the Boorabbin 11250,000 area, showed that here the
more intense anomalies are associated with ultra-basic rocks and basic
lavas of the Greenstone Phase, and also meta-dolomitic rocks of the

.,
y
•
'.
.. •
Whitestone Phase. At the present stage of mapping, Quilty is uncertain
whether all these iron-rich rocks are interbedded units of the metamorphic
belts. He considers that their general conformity with the typical pattern
of jaspilite outcrops suggests that this is the case.
Suites of basic intrusives occupying fissures produced by oross
folding of the metamorphic belts have also been recognised by their
distinctive magnetic properties.
A review of geophysical surveys in the Norseman area (DalY11963)
indicates that the reconnaissance airborne magnetic method is not successful
in providing direct information on the oocurrence of ore-bodies. In the
Mararoa area, taken as typical of ore-bodies not closely associated with
banded iron formations, it did not appear that this type of magnetic survey
could be relied upon to give definite information on the geological
structure in the greenstones.
In the oase of the Iron King ore-bo~, which is associated with
structure in the banded iron formation, ground magnetic surveys showed a
feature correlating with the structure; however this feature is not
visible on the aeromagnetic contour map produced by lines spaoed at t mile
intervals aoross the magnetio strike.
Interpretation of the airborne radiometric data in these same
areas has indioated the presence of numerous anomalies which markedly exoeed
the average intensity of gamma radiation. ~ of these anomalies are
attributed to outcrops of granite; however in the Southern Cross-Kalgoorlie
Regions (Mulder 1958), 84 anomalies were recommended fer ground investigation )'
following a low-level airborne radiometric survey.
3. GIDLOGY
The geology of the region about and to the south of the survey area
is of ancient, strongly folded and highly metamorphosed igneous and
sedimentary rooks whioh have been subjeoted to granitio intruSion,
grani tisation and invasion by ~ke suites typioal of a Pre-Cambrian shield
area •

'I
'it
The metamorphic rocks are generally exp~sed in belts which
show a regional north-north-west trend. Major folding of the meta-igneous
generally parallels this axis with the subsidiary folds being tightly
packed and often isoclinal with some overturning.
A system of subordinate folding whose axial trend is east-north-
east to north east is superimposed on the major regional folding and has
had a signifioant role in localising mineralisation (Ellis 11939;lVIcMath) 1953).
In the Yilgarn Goldfield a suite of late basic intrusive rocks
show an east-north-east trend and bears a close relationship to the axis
of cross folding in the metamorphio belts (~ilt.Y~ 1964).
The geological mapping of the Menzies and Leonora 1:250,000 areas
involves little more than a distinction of regions as either granitic or
greenstone types.
Menzies 1:250,000 area.
The geology shown in Plate 2 is based on data compiled by
Talbot (1912) and the Tectonic Map of Australia (1960). Little geological
information other than major rock type divisions is available. Detailed
or semi-detailed mapping is confined to small areas about mining townships
such as Menzies (Woodward 1906), lVIulline, Riverina and Ularring (Feldtmann , J
1915), Kookynie, Niagara and Tampa (Jutson 1921), Comet Vale (Jutson 1921) \ J
and Mount Ida (Gibson 1901 and Tomich 1953), and is discussed briefly below. \ I
In the western part of the Menzies area Talbot (1912) makes the
broad division or rock types into granitiC and greenstone areas often
on a basis of vegetation or soil type due to the limited exposures of rock
in situ.
The greenstones mainly occur in long comparatively narrow belts
which trend north-north-west. According to Talbot (1912) these greenstones
consist principally of epidiorites with some amphibolites, the latter due
to metamorphosed Qykes of no great extent.
High serrated ridges formed by ferruginous quartz schists are
found in all the greenstone areas; in some localities the bands occur
across the full width of the greenstone belts, in others only at one edge.

.,
<II ' - ..
'I
Talbot is unsure whether these ferruginous quartz schists represent
shear zones or whether they may be highly metamorphosed sediments. They
are usually inolined at a very high angle and folding is very marked in
the :Brooking Range.
Numerous aoidio ~kes, whioh probably emanated from the main
mass of intrusive gTanite, have been noted by Talbot in several looalities
in the different greenstone areas.
Geology of Mining Centres
Menzies Rook types distinguished are reoent alluvium and laterites,
orystalline and altered rocks whioh are subdivided into basic and acidio
groups, and igneous rocks occurring as dykes.
Mulline. Riverina and Ularring Rooks of the district are classified
as amphiholites (including epidiorites and hornblende sChists), granite,
acidic ~kes, basic ~kes and recent superficial deposits.
Kookynie, Niagara and Tampa The rocks of the area are almost
whol~, if not entirely, of igneous origin. They form a comprehensive
group, varying in oomposition from moderately basio rocks to highly
aoid ones, ultra basic rocks being almost entirely absent. The rocks
have been generally olassified as basio and intermediate rooks of
igneous origin, aoid rooks of igneous origin, schistose rocks of unoertain
origin and recent superfioial deposits.
The geologioal trend of the area is generally east-north-east,
faulting not being discovered to any extent.
Comet Vale The rocks of the district are divided into three main groups:
basic and ultra basic rooks, the aoid rocks and the recent superfioial
deposits.
As in other mining areas auriferous mineralisation is main~
oonfined to quartz reefs and lode formations which are frequently
contained in the fine grained epidiorites and amphibolites of the basic
and ultra basic rook group.
Mt. Ida In general the distriot is one of greenstones (clastio
and igneous), basic intrusives, porphyries, jaspilites and erosion
sediments intruded by three more-or-Iess separate masses of granite.

•
6.
The interbedded rook formations are steep~ inolined and strongly folded
and exhibit a high degree of metamorphism, although the metamorphio
grade varies.
The oldest rooks are a series of meta-sedimentar,y and basio
£low8 or tuffs of high metamorphic grade. Interbedded in this series is
a band of coarse grained hornblende-feldspar rock which is considered to
be a sill (Tomich 1953). All known auriferous mineralisation occurs in , this greenstone series which is also intruded by a suite of basic dykes
with north-east to north-north-east trend.
Another series of interbedded igneous greenstones and sediments
occurs with strong folding along north-west to north-north-west axis.
Jaspilites are associated with both series of metamorphio rocks;
however they are more ferruginous and less massive in the latter series.
Of the granitio masses the central and eastern granites are
concordant, foliated or gneissic types in which the foliation is parallel
to that of the enclosing greenstones, whereas the western granite appears
to be discordant.
A number of olivine dolerite dykes with uniform east-west strike
transgress all rock formations including the granite.
Structurally the central granite mass occupies the core of a
southerly pitching anticline. No large faults have been recognised in the
area, ore bodies have however been influenoed in deposition by a shear
pattern.
Leonora 1:250.000 area
The geology shown in Plate 3 is based on data compiled by Talbot
(1~12) and Clarke (1925), little geological information other than the broad
rock type divisions being known. Detailed mapping is again confined to
small areas about mining townships such as Lawlers (Gibson,1901) and Leonora
(Noldert and Book, 1959).
The geology of the western part of the Leonora area is similar
to that of the region immediately to the south which has been dealt with
already (western part Menzies area) •
The eastern part of the area consists mainly of a north-north-west
trending greenstone belt whioh passes through Lawlers and Leonora and thence

.'
continues into the Edjudina. 1: 250,000 area. Clarke states "the greenstone
belt includes a wide assortment of rocks of which the most important are the
various epidiorites, amphibolites, chlorite-carbonate rocks etc., to which
the terms "greenstone" or It diori te" are generally applied. The present
character of these rocks results from great local and regional metamorphism.
A minor but by no means insignificant feature of the greenstones is the
development of more acid rocks both intrusive and effusive varying from
andesi tea and porphyri tes to rhyolites and quartz porpbJrries". What are
apparently metamorphosed sediments are also included in this group.
A series of acid rocks have intruded the greenstone areas to form
the granitic areas enclOSing the greenstone belts.
D,ykes ranging from camptonites to basaltic dolerites have been
found to intrude both granite and greenstone.
Rather siliceous ferruginous quartzites are exposed in the greenstone
bel t between Gwalia and hIt. Newman. Shear planes and quartz veins striking
more or less at right angles to the main north-north-west shear lines and
veins were noted by Clarke in the Leonora-Duketown area in addition to some
ferruginous quartzites which have an east-west course.
No continuation of the north branch of the Mt. Celia-Yundamindera
fault (Honman 1917, Edjudina 1:250,000 area) is knovm in this area. ~
Geology of Mining Centres
Lawlers The rocks have been divided into two main classes, the
granites and the greenstones.
Acidic dykes are found most largely developed close to the junction
of the granite and greenstones varying from coarse-grained granite through
aplites and quartz-porPh3ries to fine-grained compact felsites and rocks
having the appearance of q~tzites.
~asic dykes (dolerite) intrude the granite but cannot be
distinguished in the greenstones.
Leonora Rock types in an area of 400 square miles centred on Leonora are
classified into Quaternary alluvium, surface cements and laterites, Tertiary?
iron cappings, Pre-cambrian intrusive and meta-sedimentary and igneous rocks
of the lliIargaret "System". The Pre-Cambrian intrusives include granitic rocks
and quartz reefs. The Margaret "System" includes sediments, jaspilites,

1\ .. ..
. '"
•
8.
quartz-~anite sohists, serioitio sohists, basio lavas and epidiorites.
Noldart and Book made the following oomments regarding the struotural
and eoonomio geology of this distriot.
"Major faulting was not observed ••••• although small soale
faulting is present •••• The area forms portion of the western flank
of a large synolinorium extending in a general north-north-west direotion
from Ko0k1nie (Menzies 11250,000 area) through Leonora to b~ond Mt. Clifford
••••• Variations in the trends of the jaspilitio horizons suggest strong
west-north-westerly trending anticlinal cross-folding through the point
of maximum flexure of the main range. A similar, and probably stronger
crossfold, is postulated following approximately along the drainage ohannel
occupied by Lake Raeside •••••
Easterly of the main range is a system of sub-parallel anticlines
and synclines trending in the same general direction as the range •••••
Repetition of the jaspilite beds by isoclinal folding has probably taken
place but no evidence is available ••••• U
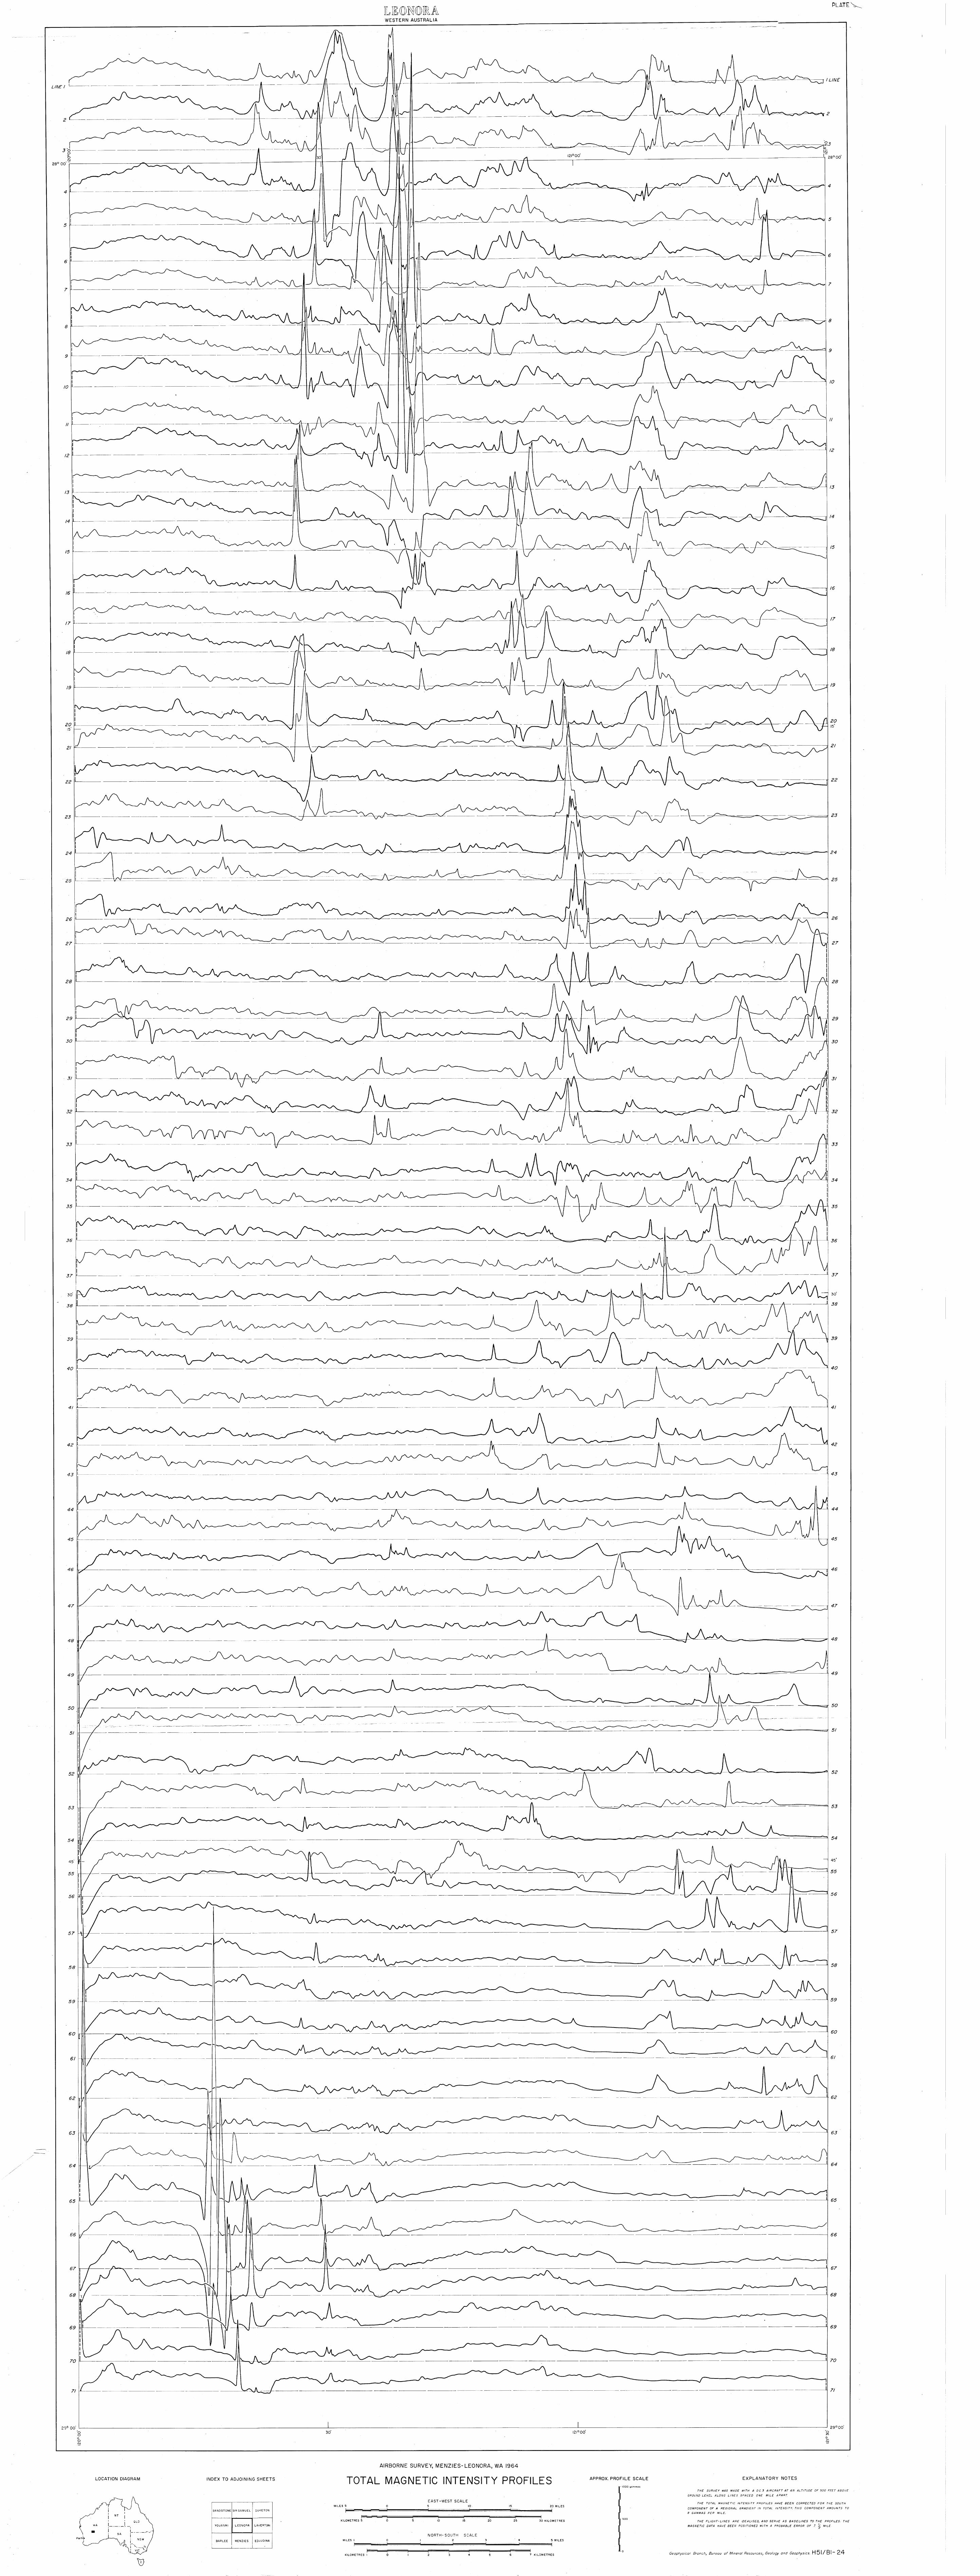
MAGN:E1rIC RESULTS AND INTmPRErATION
Magnetio profiles, which have been reduced to an east-west soale
of 1:250,000 are shown for all flight lines in the Menzies and Leonora
areas in Plates 4 and 5. A north-south scale of 1 :62,500 has been used
to improve data presentation. The magnetio profiles are aoourately
positioned near the longitudes 1200 22i'E and 1210 07i'E. The maximum
probable error, at longitudes 1200 OO'E, ~1200 45'IE and 1210 30 t E is
± i mile east-west.
Every fourth magnetic profile together with magnetio trends are
shown for the Menzies and Leonora 1:250,000 areas in Plates 6 and 7
respectively. In order to illustrate the magnetic trends which strike
east-wesj, Plates 7 and 8 also show the magnetic profiles obtained from the
tie-line systems.
Due to the sparsity of geological information available in the
Leonora and Menzies 1:250,000 areas, a basioal~ qualitative interpretation
of the magnetio data has been applied. Magnetic trends have been resolved
and the survey area has been zoned by consideration of magnetic character

'.
(Plates 2 and 3). Well defined anomalies have been analysed quantitatively
assuming the magnetisation is wholly induoed, and a qualitative
assessment of structural dip has been made. Listed below are the zonas
with a brief description and their magnetic character.
~ Magnetic character
1 Random magnetic disturbance less than 50 gammas
2
3
4
It
It
d
It
It
tI
It It It 150 ga.DlLlaB
tt It tt 250 gammas
If greater than 250 gammas
5 Magnetic lineations with amplitudes less than 150 gammas
6 " " " 7 tt It It
8 tt It "
tt
.. "
II
It
It 250 gammas
" 500 gammas
It greater than 500 gammas
Geological signifioance of zones
Zones 1 and 2 are interpreted as ei ther relatively homogenous
acidic igneous rocks or non-magnetic sedimentary sequences. This
interpretation is based upon the magnetic profiles being generally smooth,
the ~ack of linearity of magnetic feature between adjacent flight lines,
and the generally lower magnetic intensity as compared with neighbouring
zones.
Zone 1 regions are irregularly shaped; nevertheless either
individually or in groups they show some evidence of elongation trending
NNW to EW. If these regions are the magnetic expression of an igneous
source-rock, this elongation m~ be interpreted as evidence for NNW trending
fold axes.
Zone 2 regions cover much of the area, and are extremely
irregular in shape. It is probable that a number of rock types are
represented possibly including slightly more basic variations of the rocks
of zone 1.
Zone 3 regions are restricted to the western parts of the Leonora
and Menzies 1 :250,000 areas. This zone is interpreted as the magnetic Ii1/
expression of hetrogeneous igneous bodies which are of greater basicity than "it
rocks included in zones 1 and 2.

•
10.
Zone 4 includes magnetic anomalies characterised by high
amplitudes and random shape. Such anomalies are typical of major basic
intrusions.
Zones 5 and 6 are transitional between the 1-2 and 7-8 zones.
The linearity and moderately low amplitudes of the anomalies evident in zones
5 and 6 suggest stratigraphic sequences possibly comprising lavas and
sediments. Regions of both zones show a somewhat elongated character. The
division between zones 5 and 6 is based on average anomaly amplitudes. It
is not implied that the two zones necessarily represent two distinct
geological provinces, but rather a gradation in basicity.
Zone 7 has a high degree of linearity and elongation of regions.
This is interpreted as being due to a series of basic lavas and sediments.
Zone 8 is characterised by very high amplitudes and very pronounced
linearity. The anomalies ~ be conveniently grouped into two distinct
categories, those of the order of 1000 gammas and those many times greater.
Estimates of susceptibilities range from 2 x 10⁻³ to 3 x 10w3 and 25 x 10-3
to 40 x 10-3 C.g.Se units for the two groups respectively. The former
anomalies are interpreted as being due to serpentinite bodies and the latter
due to banded iron formations. Quilty (1964) records susceptibility values
as high as 200 x 10-3 c.g.s. units which is comparable to the value obtained
for the magnetic anoD~ly evident in the extreme south west of the Menzies
area.
Analysis of magnetic trend lines oriented north-south
The resolution of trend lines bears in general a direct
relationship to anomaly amplitude. The isolated trend lines within zones 1 and
2 are relatively short and are possibly caused by either ~kes or granitisation
of pre-existing magnetic bodies. Trend lines become pronounced in zones 5
and 6. The continuous strong lineations are almost wholly confined to the
intense anomalies of zones 7 and 8 in the Menzies area and the moderately
intense anomalies of zone 6 in the Leonora area.
Within zone 2 and the transitional zones 5 and 6, it is not
uncommon for a trend line to pass from one zone to another. This illustrates
the lack of well defined interzonal contacts and the limited difference of
geological significance between these zones. Conversely, trends within
zones 7 and 8 remain, with very few exceptions, confined to their respective

."
11.
zones suggesting"distinot ese11eteal lithologies.
Menzies 1:250.000 area. The greatest oonoentrations of trend
lines ooour in the western half of the area and are direoted NNW to N\7.
This general direotion, paralleled by most other trends, is indioative
of the regional strike for the entire area. \Vhilst individual trend lines
follow the general pattern there are looal variations, most, but not all
of which are looated near the western boundary of the area where positional
acouraoy is at a minimum.
Leonora. 1: 250,000 area. Trend lines are most concentrated in the
north and eastern parts of the area with a dominant trend direotion NNW
indicative of the regional strike. An exception to this is the group of
NNE direoted trend lines in the north west of the area. This major local
variation possibly results from outorop oontrolled by interseotion of major
fold axes. Immediately to the south the east-west trend lines probab~
result from ~kes.
Sharp flexures in trend lines are again probably related to
positional inaccuraoies of the magnetic data.
AnalYsis of magnetic trend lines oriented east-west
The tie-line profiles shown in Plates 6 and 7 reveal the presenoe
of seven major ~kes of similar character to those reported by Quilty (1964).
~titative analysis of three major ~kes in the Menzies area show them to
be identical in form, having widths of approximately 1000 ft. and depth of
burial 50 to 100 ft below ground level. The pronounced magnetic lows,
associated with dykes A and r. have been interpretated as the effect of /P\(4..'c--e.Z
remanent magnetisation inclined at an angle _600 to the horizontal, whereas
the anomaly associated with dyke C has been produced primarily by induction.
Based on this interpretation, the three ~kes are oalculated to dip southerly
at SOo. Calculated values of apparent intensities of magnetisation for the
dykes are as follows :-
Dyke A
Dyke B
Dyke C
0.017 x 10"'3
0.004 x 10⁻³
0.012 x 10⁻³
c.g.s. units
o.g.s. units
c.g.s. units

...
... '
"
12.
Inspeotion of the magnetio anomalies assooiated with the
remaining 4 dykes indioates that these dykes are in general similar to
dyke C •
AnalYsis of dips
There is no direot evidenoe that remanent magnetisation is
assooiated with meridional trending magnetio anomalies; aocordingly
interpretation is based on the assumption that souroes are magnetised
by induotion onlY. Magnetic features are oharaoterised by pronounced
north-south elongation, and a high degree of east-west symmetry. The
magnetic anomalies are therefore interpret~tkd as being produced by
two-dimensional thin sheet structures with high dip angle. Calculations
of dip for typical anomalies yield, with few exceptions, angles ranging
from 10~ through vertical to 10oE. This result is comparable with
that obtained by Quilty (1964).
The absence of magnetic lows flanking positive anomalies is
indicative of sources with large vertical extent.
A comprehensive calculation of dip angles has not been made due
to the uncertainty which exists regarding the basic assumption that
remanent magnetisation is negligible. When regional geological mapping
is carried out, reinterpretation of aeromagnetic data would be invaluable
as the presence of remanent magnetisation could be ascertained by reference
to the geological data.
Regional Geological Structure
A few major structural features have been interpreted from
the magnetic data by a combined study of zonal configuration, magnetic
anomaly repetition and major displacements of magnetic trend lines. This
is a development of the approach advocated by Ellis 1939, and adopted by
Qui I ty 1964, which involved' the study of magnetic patterns produced by
arcuate remnants of banded iron formations. Interpreted fold axes are
shown on Plates 2 and 3 together with the locations of major dykes.
Menzies 1:250,000 area. The limited geological control at present
available in the northern part of the Kalgoorlie 1 :250,000 (Kreiwaldt,. 1964) C) .
indicates that major anticlinal axes are commonly defined by outcropping

..•.
13.
grani te and minor synclinal axes by basic rocks of the greenstone series.
The major fold axis determined in the ~-central part of the
Menzies 1 :250,000 area is interpreted as anticlinal. Evidence for 'this is
the large region of zone 1 flanked on both sides by areas of zone 6 through
zone 7 to zone 8. The closure of magnetic trend lines south of Lake Ballard,
indicates a northerly pitch to this anticline. Two possible major anticlines
sub-paralleling this central anticline are also shown on Plate 2.
A number of probable and possible associated minor synclines
of probable isoclinal form, have been interpreted throughout the area.
The convergence of the minor synclinal SiJles north of Lake Ballard
defines a possible crossfold axis which is interpretated as being synclinal.
This is coincident ,vi th the major dyke striking N 700.E. The postulated
crossfold axis coupled with the three synclinal axes in the north-east
quadrant of the area, is considered responsible for the symmetrical zonal
configurations.
Leonora 1:250,000 area. The south western part of this area shows a
continuation of the relatively simple zonal configuration apparent in the
Menzies area. The high degree of zonal complexity in the remainder of the
area will however require extensive geological control to reveal its
significance.
A few short fold axes have been resolved as shown in Plate 3.
The possibility of additional folding is recognised from the magnetic data;
however the limited degree of certa;i.nty does not warrant the display of these
axes.
There is no magnetic or geological evidence to suggest the cause
for the trend line convergence in the north of the area, although it almost
certainly results from intersection of major fold axes.
The two major dykes do not appear to have had any recogniz~ble
control on the geological structure.
5. RADIOMEl'RIC RESULTS AND INTERPRErATION
Inboard Scintillometer results
Change in level of radiometric intensity (ClLORI) profiles have
been adjusted to an east-west scale of 1:250,000 and are shown for the
. v
.. '
.,
. /
14.
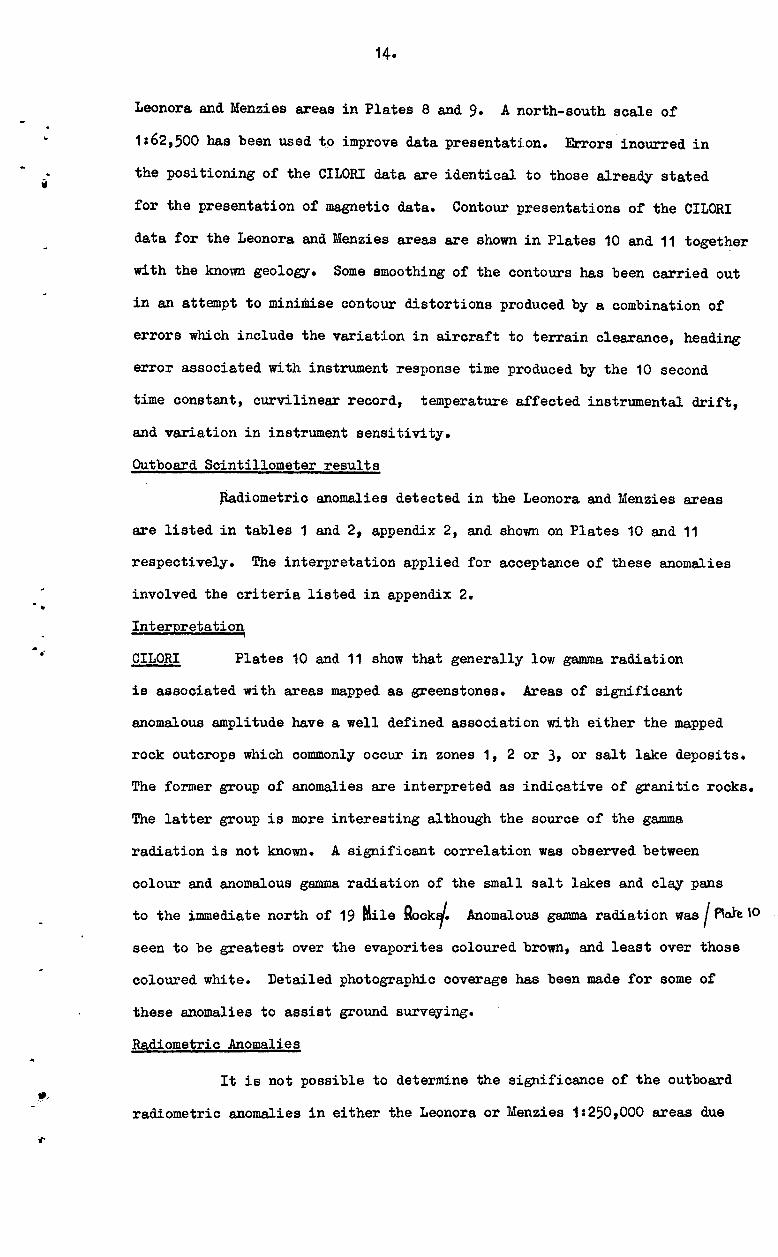
Leonora and Menzies areas in Plates 8 and 9. A north-south scale of
1:62,500 has been used to improve data presentation. Errors incurred in
the positioning of the CILORI data are identical to those alrea~ stated
for the presentation of magnetic data. Contour presentations of the CILORI
data for the Leonora and Menzies areas are shown in Plates 10 and 11 toget~er
wi th the known geology. Some smoothing of the contours has been carried out
in an attempt to minimise contour distortions produced by a combination of
errors which include the variation in aircraft to terrain clearance, heading
error associated with instrument response time produced by the 10 second
time constant, curvilinear record, temperature affected instrumental drift,
and variation in instrument sensitivity.
Outboard Scintillometer results
~diometric anomalies detected in the Leonora and Menzies areas
are listed in tables 1 and 2, appendix 2, and shown on Plates 10 and 11
respectively. The interpretation applied for acceptance of these anomalies
involved the criteria listed in appendix 2.
Interpretation ;
CILORI Plates 10 and 11 show that generally low gamma radiation
is associated with areas mapped as greenstones. Areas of significant
anomalous amplitude have a well defined association with either the mapped
rock outcrops which commonly occur in zones 1, 2 or 3, or salt lake deposits.
The former group of anomalies are interpreted as indicative of granitic rocks.
The latter group is more interesting although the source of the gamma
radiation is not known. A significant correlation was observed between
colour and anomalous gamma radiation of the small salt lakes and clay pans
to the immediate north of 19 Mile Rocki. Anomalous gamma radiation was I Plate \0
seen to be greatest over the evaporites coloured brown, and least over those
coloured white. Detailed photographic coverage has been made for some of
these anomalies to assist ground surveying.
Radiometric Anomalies
It is not possible to determine the significance of the outboard
radiometric anomalies in either the Leonora or Menzies 1:250,000 areas due

....
15.
to the lack of detailed geologioal information. To make suoh a determination it
would be neoessary to oarry out a ground radiometrio survey; however
only anomalies of oategories A and B warrant investigation as types C and
D may prove ver,y diffioult to deteot by ground work and their significance
is marginal.
6. CONCLUSIONS AND RECOMMENDATIONS
The magnetic trend assessment and zonal interpretation of the
survey area should be of considerable value to regional geologioal mapping.
However, the significanoe of each zone can only be asoertained during the
course of such mapping.
Dip angles oalculated from meridional magnetic anomalies range
from 700 to 900 and compare favourably with results obtained from previous
airborne surveys in this locality. Remanent magnetisation has again been
found to be associated with some, but not all, of the east-west qykes.
It is advocated that reinterpretation of the magnetic data,
in particular dip analysis be made in conjunction with future regional
geological mapping. This would test the validity, and possibly lead to the
expansion of the limited interpretation of geological structure.
The convergence of magnetic, and interpreted geological, features
at latitude 290 33 t S, longitude 120011'E warrants detailed ground investigation
to determine whether economic mineralisation exists.
Data obtained from the inboard scintillometer (ClLORI) has been
successfully contot~ed, using a oontour interval of 50 counts per second.
There is a general correlation between the CILORI anomalies and both the
known geology and that interpreted from the magnetic data. The anomalies
commonly associated with salt lake evaporites require ground investigation
to ascertain the radioactive sources and their economic significance.
The outboard scintillometer detected 64 point source anomalies of
which 47 warrant investigation to determine any possible economic significance.

B.M.R.
CARTER, R.
CLARKE, E. de C.
DALY, J.
ELLIS, H.A.
• FELDTMANN', F. R •
FORMAN, F. G •.
FORSYTH, W.A.L~
GIBSON, C.G.
HONMAN, C.S.
16.
7. REFERENCES
1960
1959
1925
1939
1915
1953
1961
1907
1917
Tectonic Map of Australia.
Bur. Min. Resour. Aust.
Airborne magnetio and radiometric survey.
Kurnalpi and Widgiemooltha, W.A. 1958.
Bur. Min. Res. Aust. Record 1959/137
The field geology and broader mining
features of the Leonora-Duketown District.
Bull. Geol.· Surv. W. Aust. 84
Norseman geophysical surveys, W.A.
1946 and 1953. Bur. Min. Resour. Aust.
Record 1963/62
Geology of the Yilgarn Goldfield, South
of the Great Eastern Railw~,
Bull. Geol. Surv. \7. Aust. 91
Geological observations in the Mulline,
Ri verina, and Ularring centres, North
Coolgardie Goldfield. Bull. Geol.
Surv. W. Aust. 64
The geological structure of the shleld
in southern Western Australia in relation
to mineralisation. THE GIDLOGY OF AUSTRALIAN
ORE DEPOSITS A.I.M.M., Melbourne.
Boorabbin and Norseman airborne magnetic
and radiometric surv~s W.A. 1959.
Bur. Min. Resour. Aust. Record 1961/55.
The geology and mineral resources of Lawlers,
Sir Samuel, Darlot and Mount Ida.
Bull. Geol. Surv. W. Aust. 28.
The geology of the North Coolgardie Goldfield.
The Yerilla District Bull. Gaol. Surv.
W. Aust. 73.

-,
JUT SON , J.T.
JUTSON, J.T.
LOVI, C.H.
McMATH, J .C.
MILES, K.R.
MULDER, J.M
1921
1921
1959
1964
1953
1953
1960
NOLDART, A.J., BOCK, W.M 1959
QUILTY, J.
SOUFOULIS, J.
SPENCE, A.G. 1958
17·
The mining geology of Kookynie, Niagara
and Tampa North Coolgardie Goldfield.
Bull. Gaol. Surv. W. Aust. 78
The mining geology of Comet Vale and
Goongarrie, North Coolgardie Goldfield
Bull. Geol. Surv. W. Aust. 79
Progress report on survey of Widgiemooltha
area, Coolgardie Goldfield.
Ann. Rep. Dep. Min. W. Aust. 1959.
Personal oommunioation. Geol. Surv. W. Aust.
The geology of the oountry about Coolgardie,
Coolgardie Goldfield W.A.
Bull. Geol. Sur!. W. Aust. 10I
Banded iron formations in Western Australia.
THE GEOLOGY OF AUSTRALIAN ORE DEPOSITS
A.I.M.M. Melbourne.
Southern Cross and Kalgoorlie regions
airborne radiometrio survey, W.A. 1958.
Bur. Min. Resour. Aust. Reoord 1960/120
Notes on the geology of portion of the
Mt. Maloolm Distriot, Mt. Margaret
Goldfield. Ann. Rep. Dap. Min. W. Aust •
.1.222.
Interpretation of aeromagnetio data,
Goldfield region, Western Australia.
In preparation.
Boorabbin 1:250,000 geologioal series.
Bur. Min. Resour. Aust. Explan.Notes
Sheet SH/51-13.
Preliminary report on airborne magnetio and
radiometrio surveys in Kalgoorlie-Southern
Cross region Uestern Australia(1956-1957) Bur. Min. Resour. Aust. Reoord 1958/45

J
, ,
TALBOT, H.rI.B.
'IDMICH, S.A.
VIELLS, R.
t;lOOD'JARD, H.P.
18.
1912
1953
1962
1906
Geologioal investigations in the
North Coolgardie and East Murchison
Goldfields.
Bull. Geol. Surv. W. Aust. 45
Summary report on the geology of portion
of the Mt. Ida district North Coolgardie
Goldfield. Ann Rep. Dept. Min. W. Aust.1953
Lake Johnston area airborne magnetic and
radiometric survey. Bur. lVI:i.n. Resour.
Aust. Record 1962/100
The auriferous deposits of mines of Menzies
North Coolgardie Goldfield.
Bull. Geol; Surv. W. Aust. 22

,
r
/
APPENDIX
OPERATIONAL DErAILS
STAFF
Party Leader
Geophysicist
Senior radio technician
Draughting assistant
Geophysical assistants
Pilots
a
I
:
I
I
G.A. YO'Wlg
D.B. Tipper
P.B. Turner
P. Kersulis
K.A. Mort
D. Park
I. Parkinson
Capt. T. Newman
Aircraft maintenance engineer :
First Offioer D. Brown
First Offioer J. Rollston
B. Hall
EQUIPMENT
Aircraft
Magnetometer
Sointillographs
Camera
Radi 0 Al timeter
Air Position Indioator
Magnetometer
SURVEY SPECIFICATIONS
Altitude
Line spaoing
Line orientation
I D.C.3 VH-MIN
I MFS-5 saturable oore fluxgate, tail-boom
installation ooupled to 'Speedomax' and
digital reoorders
:
:
I
:
:
:
Twin orystal MEL sointillation deteotor
heads inboard and outboard (the latter
suspended from a cable 200 feet below
aircraft). Outputs ooupled to Kelvin
Hughes recorders.
"Aeropath t, 35 mm strip
STR30B, frequency modulated type
Traok reoorded by Esterline Angus recorder.
MFD-3 saturable oore fiuxgate, ground
installation for storm warning.
500 feet above gro'Wld level
1 mile
East

.'
,
"
• e
Tie system
Navigation control
Record sensitivity
rii?5-5
Inboard (OILORI) scintillometer
Outboard scintillometer
Scintillometer time constants
Inboard (OILORI)
Outboard
2.
Single lines spaced 15 miles a.part,
doubla lines at eastern and western
boundaries of individual 4-mile areas.
Aerial photographs
: 100 gaIDlflas/in
: 100 cep.s./cm
100 o.p.s .. /cm
10 secs
1 sec.
t
" •
j
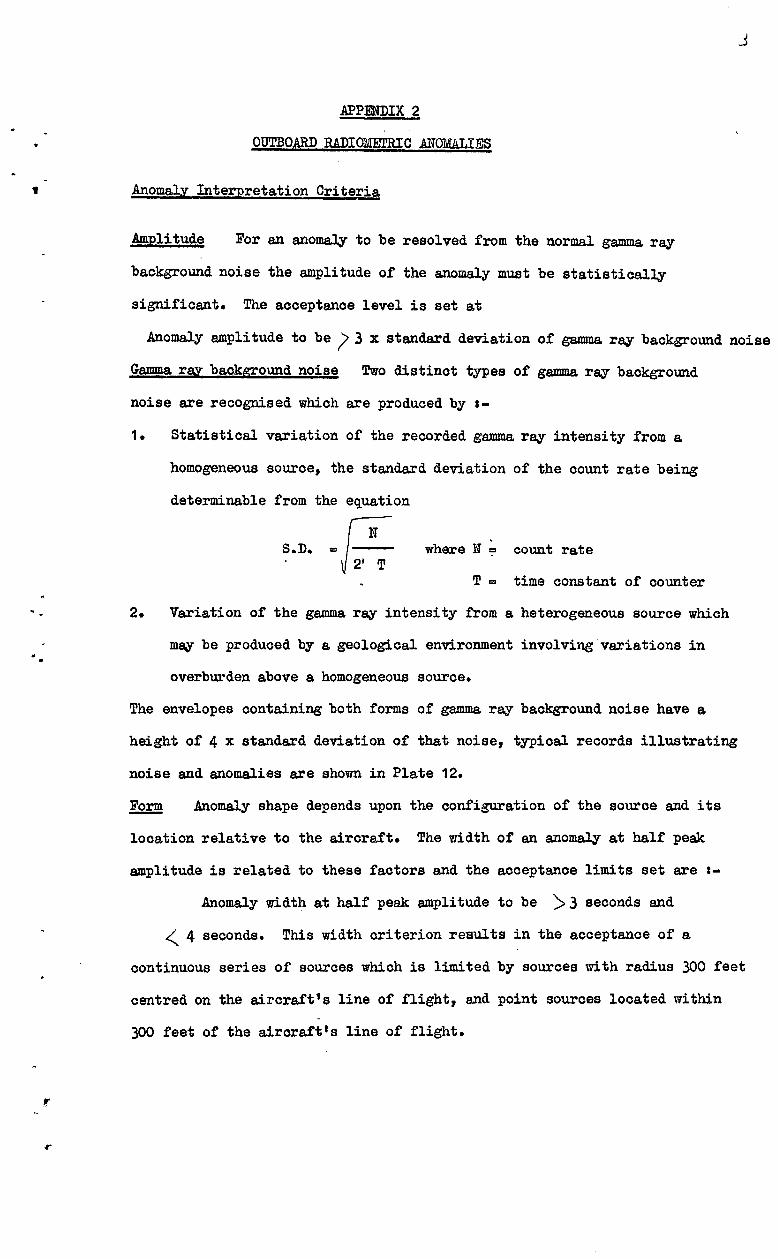
APPENDIX 2
OUTBOARD RADIOMErRIC ANOMALIES
AnomalY Interpretation Criteria
Amplitude For an anomaly to be resolved from the normal gamma. ray
background noise the amplitude of the anomaly must be statistically
significant. The acceptance level is set at
Anomaly amplitude to be / 3 x standard deviation of gamma. ray background noise
Gamma. ray background noise Two distinct types of gamma. ray backgrolmd
noise are recognised which are produced by 1-
1. Statistical variation of the recorded gamma ray intensity from a
homogeneous source, the standard deviation of the count rate being
determinable from the equation
S.D .... /N J;-;- where N ~ count rate
T... time constant of counter
2. Variation of the gamma ray intensity from a heterogeneous source which
may be produced by a geological environment involving variations in
overburden above a homogeneous source.
The envelopes containing both forms of gamma ray background noise have a
height of 4 x standard deviation of that noise, typical records illustrating
noise and anomalies are shown in Plate 12.
~ Anomaly shape depends upon the configuration of the souroe and its
location relative to the aircraft. The width of an anomaly at half peak
amplitude is related to these factors and the acceptance limits set are :
Anomaly width at half peak amplitude to be "> 3 seconds and
~ 4 seconds. This width criterion results in the acceptance of a
continuous series of sources which is limited by sources with radius 300 feet
centred on the aircraft's line of flight, and point sources located within
300 feet of the airoraftts line of flight.

Table 1. Outboard radiometric anomalies Menzies 1:250,000 area
Anomaly Line Fiducial Half Peak Amplitude Anomaly No • lifo. No. width (sees) (x.S.D.) Classification
.. 1 78 W 854.8 4.0 9 D
2 78 \l 849.5 4·0 9 D
3 80 If 318.7 3·5 5 A
4 84 VI 795.0 3.0 8 B
5 85 E 511.1 3·5 5 B
6 86 IT 290.0 3·0 8 B
7 89 II 233.1 3.0 7 A
8 91 VI 599·7 3.0 8 B
9 94 E 506.6 4.0 9 B
10 94 E 528.6 3.0 7 B
11 96 E 030.2 3.0 6 A
12 97 W 805·4 3.0 4 A
13 103 E 825.5 4.0 9 B
14 103 Ii.: 974·8 4·0 10 A
15 106 w 088.3 3.0 16 B
16 108 VI 753.6 3.5 6 A
17 108 "Vi 693.9 4·0 10 B
-. 18 110 II 167.4 3·5 12 A
19 112 VI 749.3 3.0 10 C ". 20 114 w 139.0 4·0 12 B
21 116 E 885·0 3·5 14 B
22 116 E 922·4 4·0 6 A
23 119 W 189.8 3·5 15 B
24 120 E 885.6 3.0 4 C
25 120 E 042·4 3·5 10 B
26 121 W 820.0 3.0 7 A
27 121 fl 654.1 3.0 12 B
28 122 E 430.5 4·0 7 C
29 123 \1 298.8 3·5 5 A
30 123 VI 297.8 4·0 6 A
31 123 rl 294·3 3·5 18 B
32 128 II 184·0 4·0 7 A
33 129 E 842.0 3.5 4 A
34 133 E 944·3 4·0 6 A
35 137 E 639.2 4·0 6 A
36 137 E 686.6 4.0 8 A
37 140 W 167.1 4. 0 6 A
~-

-.5
Table 2. Outboard Radiometric Anomalies: Leonora 1:250.000 Area
Anomaly Line Fiducial Half Peak Amplitude Anomaly No. No. No. width (sees) (x.S.D.) Olassifica.tion
.. 1 4W 179.8 3.5 4 D
2 5 E 364.3 3.5 7 D
3 6W 624.7 4.0 4 0
4 7 E 764.5 3.5 4 D
5 8W 234."0 3.5 6 D
6 12 VI 144.7 3.5 7 D
7 15 E 749~8 3.0 4 A
8 17 E 256.3 3.0 6 B
9 23 E 799.6 3.5 5 B
10 27 E 743.5 4.0 9 D
11 28 W 176.5 4.0 4 B
12 29 E 316.2 4.0 6 D
13 31 E 902.6 3.0 5 B
14 32 W 134.0 4.0 5 B .'.
15 44 E 378.0 3.5 5 A
16 48 E 194.1 4.0 8 A
17 51 E 709.6 3.0 6 D
18 55 E 692.1 4.0 26 B
19 57 E 718.3 4.0 6" D
20 57 E 739.7 3~0 5 A
21 59 E 144·5 4~0 10 B
22 60 W 934.4 4.0 12 A
23 61 E 691.7 3.5 6 A
24 62 W 511.7 4.0 15 B
25 62 w 474.4 3.0 8 D
26 64 E 209.7 4.0 5 A
27 66 E 820.6 3.5 5 D
,fl··

, "
Pt rr. ! • . .....
II
, "
" '
-,
B
, ,
: c
o· o· " ". ",\
\ ''f.''
D -,
- . J ~
.-
, '
, t , '. '.. _ ,'~ \ '.:
\~. -
" . ~. '. ,....
;, ~ t>
,RIB'l'OGFjU.'f~ OF' - -,
'/ b i1 , :L' , 2 1,,") 11}: 1 ti J. i( j, C1 J. ~,f '2 ~ AM±'LI'1'UD8 p.1JD r'rtE\ot'tJENCY (iF OCCURE1\CE OP.oUTB.OJ\rlD
• . ~----. ~101~~Lt~s " ---- - .\ rlADIOMJ3TR Ie .-----~-.-

"
•
PROBABLE RELATIONSHIPS BEl'WEEN ANOMALY AMPLITUDE, FREQUENC¥
AND RESOLUTION.
t Anomaly Frequency
I
\
FIG. 2
10 '5
ANOMALY AMPLITUDE x S.D.
f Anomaly Resolution
11
Figure 1 illustrates the distribution of outboard radiometric
anomalies in terms of their amplitudes. The cause for peaking of the
composite histogram at 6 x S.D is interpreted as the effect of anomaly
resolution decreasing rapidly below 1 x S.D., being zero at 3 x S.D. This
indicates the subjective nature of the method of anomaly selection coupled
with the interference produced by statistical noise on anomaly form. Figure 2
illustrates the probable relationships between anomaly amplitude, frequenc,
and resolution.

•
/ . . . /
. . EAST
MURCHISO~
YOU A N M I/';-~ ~.
LAVERTON • LAVERTOIV
\ '.
HYOEI' "
"~'. HYDEN b \
o •
0,
" . -" .
" .
: ./ I .. ~'--- MT. MARC AR E T ~ ~ LEON RA /
: - -; MALCOLM J~
NORTH
LOCALITY MAP
AIRBORNE MAGNETOMETER AND SCINTILLOGRAPH SURVEY 1964
MENZIES - LEONORA AREA WA SCALE IN MILES
40 0 40 80 ------.-..1 I ; 120 ,
LOCATION DIAGRAM
AREA PREVIOUSLY SURVEYED
1964 SURVEY BOUNDARY o GOLDFIELDS BOUNDARIES
PLATE I
GeophysIcal 8rdnch, Bureau 01' Mineral Resovrces Ceolo9!1 .,. Oeo,ohflsK:s. H 51 / B 1- 21

AUSTRALIA I 250000
IS'
30
8 o o N
45
/
A ----
7
I I~
'. \_,~ \
./~" .. ~ ---- / "-.---._.. "-
! I
\
".
3
\ ( . \ \ '~ \ "
\ 1 \\'~~\ " " o o N
(BASED ON H51 /BO-51
Potrlh
LOCATION DIAGRAM
WA
•
NT I OLD
I '-'-- _., j_. ___ .r ....
, NSW -I \._~
VIC .
ClYO~ (;, ROCIr
\
.' I , .
.,/
I J "',
_-....,.-~:> WALLING / / i:,.~~~ _____ /
I
, ,
-.-
INDEX TO ADJOINING SHEETS
YOUANMI LEONORA lLA~:R:~1 ! BARLEE MENZIES EDJUDINA I
[CKSO~ JALGOORLIE I KURNA~
- -' ,-
fiIEN~TIE§ WESTERN AUSTRALIA
4" 121 0 00'
\ \ \
~. .......... 2 ' .....
is'
" ~ 'I,. rI'" " . -. _/,.1-"'\.'1 Desdemona
~----.-.-.,
( I '\ \ , ., ...... 6 / \
...... i' .................
2
. ....... ................ .._'f-..
.... ".... : '\'\.\
. I
..... -. -'-._'-
A
\
5
,,/ ,
.... ) ,-'-.- ,,,' ./ ~
" /'-; . \. :/
\ ..,.. ...... : I ,.... I .I
....\ : )11 :j /' T 1'-:
. \ . ,
----------::o~-_:r_--.,. ----~------
"<
-.- -.-
/
I
---~ I \
./ /
/
_.-.- . .,.., -' ~,--
\
I -.~
!~, \ I
",. r---j'- -; ,
I -. I " . ........ , '. . .....
\ ',. . '-. \ ' .....
"
. '. \ \. , \
\
\ I i
5
" ;\ I " , ,
'. \ . ". , ,
---
\ \ \
GEOPHYSICAL INTERPRETATION
AND
GEOLOGY
\ \
6
. I . I . I \
, I
. \ . I I . \
,
\ . I
! () \ . . \ '-. . \
6 ..... ·--·'·,\
\ \
" .....
"i \ I . i
/
\ ..... "_.-.-
/ /
I /
1 (
I I \
\ \
\
\ \
7
MILES 4 0 4 8- 12 16 .;::0 MILES ~L~--J-~ __ ~,----------~ ________ -J------·--__ ~ ________ ~----------~l
KllOr.tlETRES!5 0 10 15 20 2!5 ~O KILOMETRES
~--~~~~~~--------~------~I--------~~~--~I_'------~I~~~~q
2
'5'
A i I
/ I
/
...... ) -'-. -. ! - .. ,\ \ \,
\"
'. ' . .....
\ \ . \ \ . J I '.
/ i. ,
" "' 19MI~OCK5
.-.
6
t 29" 00'
J/ V , "
.....
I
\
'\
............. ~
\ , \.
o
N
PLATE 2
GEOLOGICAL LEGEND
AFTER TECTONIC MAP OF AUSTRALIA
Geulogical bound'Jry
Interpolated trends r. f beddmg, fol/alron elc.
<;0"" •• _" =" = c, Syncline
AFTER WESTERN AUSTr;,c,LlA, GEOLOGICAL SURVEY,
BUU_E fir! 45
~ r ITJ ~ h_gn j
Geological bOu(];ilJry
Bedding strike 0'7 i d/rectiol7 of d/p
Dyke or veir;.' q - Quort?
i/ndiffprentiated (mostly granlle or gneiss w/th
some melo-v!:lcanic.y ond mela-sedlments)
"Greenstcnes"
A Wester·n Australia, Geologico: S'Jr'lf:.j, Bulletm 45
8 1ectoniC Mop of Al·~.tr~il(l
GEOPHYSiCAL c..EGEND
TOPOGRAPHICAL LEGEND
o
HIf)hwoy
Rood or frOCK
Railway
Named place
Home5fead
HIli feafure
ROCk feature

AUSTRALIA 1:250,000
2
, , I
( I \ ,
\ \ \ , ,
! I
i I I ~'\_, I '-i----1
5
j : ".-, ./.
• o ~
I I \ j
./
8 gn
.-"
7
(
'/ I . '/
J
\ \
I
\.
A
(BASED ON ~5V80-3)
Perth
LOCATION DIAGRAM
WA
•
NT I QLD
L_._I~ I ! ___ ._..r .....
SA I , NSW
I '" 1'·_,,0
VIC ....
2
os·
INDEX TO ADJOINING SHEETS
SANDSTONE SIR SAMUEL DUKETON
VOUAN MI LE.ONORA LAVERTON
8ARLEE MENZIES EOJUDINA
'. \. \. \ \ j
I I ,
, ,
~ (
" " \ 'I /. I •
I ! \. :!\' \ l\"," {: '{MARoaN 4 .\ RANGE "", .. , \.
2
.L /
r-----·---------~c;-.~1
I r \,
-. ---._-_.-'
I I I ( 6
/ I
.I
WESTERN AUSTRALIA
2
I I
/
I \. '. ,,.....
/ ~. \ \ i.
I)
I i . I I I I
. V4-).-1 2
'=:~.:' /J '1(~·-·1-.:·· ( \ \ I " \
I /1 \ I / I . , 1/' >.. I 1 )1 I ,\ . . / . /' I I " I. \ ~ i! \/.
...... '. /\ ...... --. \ ....... \
I, ,
....... \ " \ . \ --______ ~ \ I
"' ..... ~I ., .......
2 r------, I ,---I I
I ,----."-'-'
--{----_ .. ,.
30'
MILES 4
F
KILOMETRES :5
AIRBORNE SURVEY. MENZIES ~ LEONORA! WA 1964
GEOPHYSICAL INTERPRETATION
0 •
0 ,
AND
GEOLOGY
,
'0 "
" "
'0 "
20 MILES
==I
30 KILOMETRES
1-"-00 - - I ... I =1
•
...... _ ........ 4 .,,---' " , .~\ 6 2
, ............ .">.-. ._.,. f-\ 7 \. /. .........
4
....... ""'.
gn
,s'
4"
•
GEOLOGICAL LEGEND
AFTER TECTONIC MAP OF AUSTRALIA
6eo/09lcol boundary
Undifferentiated (mostly granile or qneiss with some meta-volcanics and meta-sediments)
''Greenstones''
AFTER WESTERN AUSTRALIA, GEOLOGICAL SURVEY,
BULLETINS 45 AND 84
Ge%gical boundary
Bedding, strike and direction of dt'o
• • •• ... Dyke or vein.- quartz - q J josper- qfe
• Quartz blow
METAMORPHOSED
SEDIMENTARY ROCKS r=-lL as ' _I Andalusde
PLATE 3
OLDER IGNEOUS ~l BE " " {Derivatives of do/erifes and gabbros Greenstones
Serpentine ROCKS
LATER ACID
IGNEOUS ROCKS
L.3£J Contemporaneous (Foliated quartz porphynBs
acid rocks t (granite schists)
IT] Gran/Ie and conlemooroneous fJorphyry and porphyrite dykes.
GEOLOGICAL REFERENCE
~ B
A
A, Western Australio, Geological Survey, Bulletin 45
8. Western Australia, Geological Survey, Bulletin 84
C. Tectonic Map of Australia
GEOPf1YSICAL LEGEND
-+- o
TOPOGRAPHICAL LEGEND
Ilfllflr qr cr,,/( 0 Nam,d plac.
HiJ7hway • Ham""lId
Rood (Jr Irock ."".' Hili ftl(Jfur. "I'~"~
R(Jllray «> Rock f'lIf,u,
GeophysIcal Ekonch, Bureau of Mmerol Resources, Geology and Geopllyslcs H51 / B I - 37


AUSTRALIA I 250000
8
TIE 21llII
119~,--
i
123 f-----I
I
: , 13/~' -t-~t-btl---'-
139~ I
L '0 o
'b N
(BASEO ON H51/eo-4)
LOCATION DIAGRAM
Perth
WA
•
NT
OLD
' ___ __ .-r.,/
I
I NSW
I' . VIC·--\·}
'IJ"'''''£UROCK
\
~-------
'I ,
x
--....... -<1 .....•...... ~--'2> '. i ',' '1
------:::::'\ _. --.,,~. -- -
iNDEX TO ADJOINING SHEETS
YOUANMI LEONORA lAvERTON
BAR LEE MENZIES EDJUDINA
JACKSON KALGOORLI E )(URNALPI
WESTERN AUSTRALIA
XI
'I' . -----r- f--··...:<'" -~--~ ---I
!
----
-----:-'--
--------+ I
-_ .•.• -'--_.- ._--_ ...... -
xm .... )"; II
• Desdemona
y\\'.,\f/~ ,I
I '--~-r
---'c-- ---'--H 1 3 (
. ~. ___ ._. ___ ~=~ -'--!l---'--'- ~_-,+i 11l,
--'-_ ..... ,,-- --,_._-(
13
NILE~ 'r---'\-- -.--.---- ---t-- ----"--;'--L·t--l_1+i-- --"c--~ --.~+'!--'~\lt,",.
I /
-~,1/39
AIRBORNE SURVEY, MENZIES-LEONORA, WA 1964
TOTAL MAGNETIC INTENSITY PROFILES AND
MAGNETIC TRENDS
MILES 4 0 4 8 12 I. 20 MILES
I I I I =1
KILCMETRES 5 0 5 10 15 20 25 30 KI LOMETRES
1= - ~ I I I I I .. ""i -
APPROX, PROFILE SCALE
1000 gammas
i 500
0
00'
EXPLANATORY NOTES
THE SURvEY WAS MADE IN,rH A OC.3 JJIRCF?A~7 Ar AN AL T/TUD£ OF 500 FE~T
ABOVE GROuND LEvEL ALONG LINES SPACED ONE MILE APARr.
THE TOTAL MAGNETIC INTENSfT'r' PROFILES HAVE BEEN CORRECTED FOR THE
SOUTH COMPONENT OF A REGiONAL GRADIENT {N TOTAL INTENSITY.
THIS COMPONENT AMOUNTS TO 8 GAMMAS PER MILE
PROFILES RECORDED AT INTERvALS OF FOUR MILES ARE SHOW'" ON THE MAP
THE F"LIGHT-LINES ARE IDEALISED, ANO SERvE AS BASELINES TO THE PROFILES.
THE MAGNETIC DATA HAVE BEEN POSITIONED WITH A PROBABLE ERROR OF:: f.;, ,,!!LE.
PLATE 6
GEOPHYSICAL LEGEND
\\ ( ( TOPOGRAPHICAL LEGEND
R;ver or creek 0 Named place
Hi<;hwoy • Homestead
----- Rood or frack $I"'~'i Hill feoture 'Ill'--""-I
I' I
!1! I Roilway Rock feature
• I
, i
!
,.

AUSTRALIA 1:250000
I I
LINE T ~----',---'-'-~ ,
1/
15
19
23
I I , "
\ \ \ +---- -+--.~ ~~.- .
........ ,--.... _-----"
... -~--~ ~. ---
.","~
_~ ------1-"' __ "- '\
",,"", .j \'IJt~1I'" 'll}.;,~·
",~#Ij,\f ' .," ........ JoIII"'.,.4~1I' .. ·'
2
''''''''I( ....... ~ ;11'
~"IIl{ ,
----
I L __ --'-________ ~ ___________ _________J..__ __________ _
, o ~
(BASED ON H51/BO-21
LOCATION DIAGRAM
WA
• Perlh
L I
NT
SA , I
I
OLD
_ ,oJ
N5W
I \... _._ 0)
VIC -.....
M
- -- -- ---- -,
::.'"
~~~--
..... ", ) "-,,
/ /
"
"
/'
I , /
I ,
, I
I 1-----
--.............. , ~~~",,-,"------. ~
f"+/r.?" _,0 ':0-
.~-
, " "-
" "-~ ,
, I I
__ -1 _ I ,
INDEX TO ADJOINING SHEETS
! I
'SANDSTONE SIR SAMUE_ OUKETON i ,
c--- ----
YOUI'INMI lEONOI'<A LAVER TON
8ARLEE MENZIES EDJIJOIJ\jl:.
I
"
~jllllll\',.;"""'J
IL :B'1([ll N (iji ;R~ k W ESTERN AUSTRALIA
I~+--I--+~~~~rl ~~~~=~~~~----T I
\ I _I_-~:\~}LJ--~-\t-Vr--
--1_
----1
, , " --~" ,
'.
1 1
I I
I
"
-----
I --~~~~~~~~,,--=---~---------I.--,--
~c~~~- 1 __ _ "" .,. ! ;
I +-~
AIRBORNE SURVEY, MENZIES-LEONORA, WA 1964
I TOTAL MAGNETIC INl1ENSITY PROFILES
I
AND' I
MAGNETIC ~RENDS I
MILES :4_-.. __ - ___ ;O-------4~ _____ ...:...:8;..------.;12:... ______ ..1'6;...-----.....;20 MILES
KILOMETRES 5 0 5 to 15 20 25 30 KILOMETRES O~_-__ ~~~ ____ ~----~ __ _L~----~--~~--~I
~-~~~~~,,~~~,~,~~A-'------ --~'7--'-------------"~--~~ Weebo ,,/ ',...... ,/ "
/ ........... // / ........... /
// '--{ \ \
/ I / I
./ I
__ -'--;..-______________ --"J_~ _____ _
APPROX. PROFILE SCALE
1000 ~ommlJl
500
o
" --------~\-
( LINE
23
~------------~~~I /
/ /
/
.~---.~----
EXPLANATORY NOTES
/ /
/
/ /
5
3
THE SUI"VEY ... AS MADE WITH A DC_'AIRCRA.~T AT A,'V AL"flTUOE OF '00 FEET ABO ..... £
6"0I.J.I'ID LEVEL ALO'll':> ,--lIVES $PlJ;:E:J ONE MiLE APARr.
T"HE '-OTI<,-- MIJ(jr."tTiC {",rOJs;rr PROF.'LES "'AVE BEEN caR~£crEO FO" T,.£ SOur~
CO,o,APON£NT OF A REGIOhAL GRAD'EII,'T ,/I, ;orAL :,..T[,"'5 r.
T-IIS CCVPOf'i£rvr A~:)(."vrs TO 8 GA..,,"'45 PER ~"LE
ThE FLl6Hr~LI,.,E5 ARE IDEALISED, A"fO SERvE AS B.d5ELlfltES T'J TftE PRCrrl.£S THE
MAGNETiC OATA HAVE BEt:tV POSITIONeD WITH A PROBABLE ERROR or ! ~ 4f,:"£
I
•
GEOPHYSICAL LEGEND
//// Fligh! lint]
TOPOGRAPHICAL LEGEND
River or crl?tJk
Rood or froclr
Rm/woy
i ,
~,
0°30'
i
r
o
i'"'~''''~",...."".-
PLATE 7
Nomw ploce
Homestead
Hill leature
GeJohYS;COi Bronch, BoJreo:.J ;)~ M ne,-o' t:;eS~lJrces, Ge:J109Y cr~ S!3..J;Y/S'CS H51 /81 - 23 I


AUSTRALIA
8 ::, N
,/
15' , ® 7
1250000
gn
cs
30'
45' --
gn
L
~.
(BASEO ON "'~I/BO-5)
a
LOCATION DIAGRAM
Perth
WA
•
NT
A
'"'
-------
@ 35
AYOWIE <f2ROCK
15'
\ : - \' ,
~"
~,.\ -3' ...,,- '
\.::$ \ ~'. . \--:;'~i
-----
- - - -,~-=---~;;;,i " ' s
/
50 _____________ --~
-,
.Qp CHINGALING t-s ROCI!
21
A
'O~0 - - '---........ GABBLING
'" OCK , "-,
MOUNT
__________ -T -----------
o
INDE X TO ADJOINING SHEETS
YOUANMI LEONOR~ LAVERTQN
9ARLEE MENZIES EDJUOINA
JACKSON KALGOORLIE KURNALPI
30'
MILES 4 0
I<ILOMETRES 5 0 r ___ :;;;;z
OCEW71IT1E§ WESTERN AUSTRALIA
4" 15'
~so L~:<)' (~~~\( L<KE fA~ '- ____ 1 ,''', 3! 'soo~~
'ILl' \ "'°0 .... ' ...------------------------1_________ ~ / ff \ /
o-----------~-------------------_t. ___ "" ~e lit a" ~; _ --. .-"0:;2. ~,
t
~'~ o
A
A
I 1/ ,
::::::'" '''~ JOO------,
__ ----__ 50--'-=..:;;::'"
~".',',',' 4t.
t.-4..,tj> C < D ,/6.~, =::..=::::::::~.,'.,,'
" _-- I --";- J -_/ "-
\ I \ gn I --------
I)<) 8
o
\ I
\ 2.UN~bAGA~ ----:±-~ ------r I _--- I I
I -, -----
A /
{
I I I I
~ I
/ (
,0
I J
/ I
I ! J
/
/
J+_, 4"
AIRBORNE SURVEY, MENZIES- LEONORA, WA 1964
RADIOMETRIC RESULTS AND
GEOLOGY
• " I.
, '0 " '0 1 1
RADIOMETRIC CONTOUR INTERVAL 50 COUNTS PER SECOND
" 1
I I
/
/ /
/
/
A
I /
/
I I \ I I
,I
2.0 NIlLES
I
/
30 KILOMETRES
I
/
\ I
I /
/
\ i
I I I \ I
\/ /\ / \ I \
\ \
\ \
\
A o 5
o c!J
~ gn
COMET
o 20
1/
,ii',;,
~:%
/
I I
/
I I
I I
I
I I
)i
I
I I
I
I
\ I I I I I
I
50
I I
o
IS'
~ °t
,0
A
19 MILE ROCKS
~ '-
, , " ,
I i I
J
o
OJ
·0 n
'~
'I 29 0 00'
'"'
30'
4"
,,;
I .. - !
t., ;.
!
PLATE 10
GEOLOGICAL LEGEND
AFTER TECTONIC MAP OF AUSTRALIA
Geologlca/ boundary
" Interpolofe:d trel7ds cf bedding, foliattOn etc.
Synclme
AFTER WESTERN AUSTRt.LlA, GEOLOGICAL SURVEY,
BULLETlrl 45
• ••••• ••
Geological boundary
Bedding stnke and direction of dip
Dyke or vein: Q -quartz
UndIfferentiated (mostly granite or gneiss with som8 meto-volcanics and meta-sediments)
"Greenstcnes /I
GEOLOGISt.L RC:FERENCE
A Western Australia, Geologicol Survey, Bulletin 45
B Tecfonlc Map of Australia
GEOPHYSICAL LEGEND
_50-__ '00-___ 1$0-
RadJ()melric confours (no can/aurs or. sflown ".IJtJre radiom~f(f(' prafi/~s hove bffn Ifderpa/!)t,d)
340
,
RadlomflfriC anomaly resfricf,d sourc, ('1namali,s (1f' numbfH,d for nler,nc, OfJly)
TOPOGRAPHICAL LEGEND
River or creek
Highway
Rood or frock
ROIlwoy
r I
o
•
i"·'''-' ,,,,,,,,,,,{
Named place
Homestt!od
Hill feoture
ROCK feoture
Geophysical Bronc!?, Bureau of Mineral Resources, Geology and Geophysics_
I H51/BI-36

AUSTRALIA 1:250,000
'0 o
• o ~
29° 00'
,
i
?
'0 o o o N
Q;o __ gr,
----
gn
o
-----.. ...... _-- .....
........ _ .... --
(eASED ON HS'/E:'O-3)
LOCATION DIAGRAM
WA
• L I
NT
OLD
SA
M
,50--"
o
1'5'
I '
I
o
, I I
I
r;?0 (
c?/0 (Jz~O/
----------__ -1/-/
/ / o
I I
50--........ 10 INDEX TO ADJOINING SHEETS
,------ -- r ---
SANDSTO"E SIR SAMUE_ ! _D~~ETON i r--t----I --1
lAvERTON j if-' ---t----\ ---J !
YOUAN ~~I LEO~ORA
I 8ARLEE MENZIES EDJUDI~lA
I I __ ~ L __ ~
, I
'f'-"'''i-
i MAROON
~" ) RAN~E
\~"I!I\I'"
/
I J
"\ . . -
\'1',. ,,'II"'~
/ /
////
/
/ / ------
/
IL G OJ t~X (CD 81 j~ WESTERN AUSTRALIA
,,0 _----1'-------
,,-"";,-,';-';;.'IIl/'\} PEPERILL HILL
~
----- ........ ,
'Go " "- "-"
~r
--....;. "Ida Valley"
I: I'j I I I I , I
r I
[
I I I I I
I 1 )--~o.~ J
30'
. --
o 23
""'027 C2 W ,50 --------------------_---:
<. ~ ----------{\oo I
--
I /
I /
I
..... -- - -- -~-, I
! '
20U
AIRBORNE SURVEY, MENZIES - LEONORA, WA 1964
RADIOMETRIC RESULTS I
AND
GEOLOGY
o 025
._---<-0--
MILES 4 0 12 16 20 MILES
~p~--~~------~------~~-=--~------~------~I
gr, !
Ot
,
I )
i /
\ \ \
~9 ' ,,~ I
J I
t I" 11 --+---) _. BJnriilrrJ / y-----
I! J\ \\_,~ \~ I I \ \ I I \ \
\0
\ )
\ \ \ I /
/ I
\
\ ,. \ {', " " .----1....-
/ J
f )
/ j
/~--- "
(:;11"\---__
a
-----"-.. ..... ..'!50 o
o
•
.............. -..... ------, '---
o
o •
o 05
I
07
08
MT CLiFrON
I \
-----1 45'
"-
~MTMALCOLM Q
" \
00
PLATE II
GEOLOGICAL LEGEND
AFTER TECTONIC MAP OF AUSTRALIA
Geological boundary
Undifferentiated (mostly grnnde cr qnei5s wIth samp
r.7f?to-vo/cordcs and mpfn-sed,inenfs)
'Greer:slanes"
AFTER WESTERN AUSTRALIA, GEOLOGICAL SURVEY,
BULLETINS 45 AND 84
Geologlcol boundary
--.- Reddmg, strike and direction of dip
.-. .. . ... D/ke or vem: quartz -f/.,J0::,per-Qff'
• Quort z blow
~, ETAMORPHOSED l
SEDIMENTARY ROC'(S US Andalustle 1____ _ _i
: Den:;oflvC's of dolenfes /]nd gobbro_,-
()L~ER IG~;E~LS 'r ~ , ::,prpf-'nflf7{,
~OCKS ,.
I
ContpmporU/7eoJ'" : FoliO/eo qJOrt2 J)orp/7yr/es
aCid rOc-'k:;,' (grande :;,,,h/sL)
LATER ACID IG~;EOUS k,:J:':KS
t, ~-;ron/te and Cl·r;/~IlI;:C-rJrf,.cJr;us i-'lf[,f;/'y crlci j)orohY'~/le d/k>::'s
GEOLOGICAL REFEF,:Cr'J r [
A Western Australio) Geological Survey, Bulletin 45
8. Western AU'3tr::lIiO) Geologicul Survey, Ddlletin 84
C Tectonic Mop of Australia
_50_ _100_ _150_
GEOPHYSICAL LEGEND
Rodi"mtlfrl~ ~or;'o<lrs (no CO"'a~', C'l! '"0''''' "h~~. ra":am.'rl~ prO',i(!S "ave b.lln r'.,pOi{!'f'cI)
150 RadlomflNiC ""omOly r9S"';C"" 'O,HCII (a"omoJlII~
.rll "ufft/lllr.d fru ,.f.,.nc. only)
TOPOGRAPHICAL LEGEND
Riv(lr or craak
Hi"h..-ay
Rood Or 'FOCI'
Railw"y
.1
I~ z ,; o •
o
•
Nomad plI'}Cf'
Homf'Sfllad
Hill fgatuF9
Rock f."f"r,
I Geo,Jhysica! Branch, Bureau of Resources, GeaJo~y oM Geophysics H 51 / 81- 35 ,

I -
;
\
"
A. Anomaly signif'1cant with re:apect togeolo~ical noise envelope.
B. Anomaly s1..~n 1f1cant wi th respe C't t 0 s~ at 1st lcal noll5e envelope.
-.
)
C. Anomaly slgnificant with respect to associated .~e21o~tC:f!1 noise emvelope but 1nsignificant with l'e'spect to neL;hbourirj7 geolo~ical noise envelope.
D. Anomaly si~niflcant filth respect to associated statisticBl "Iolse envelope but insignificant with respect to ne t'lhbouring ~eolo:~lcal noise envelope ...
'. "