a 100-year review: methods and impact of genetic selection ... · that were influenced by local...
TRANSCRIPT

10234
J. Dairy Sci. 100:10234–10250https://doi.org/10.3168/jds.2017-12954© American Dairy Science Association®, 2017.
ABSTRACT
In the early 1900s, breed society herdbooks had been established and milk-recording programs were in their infancy. Farmers wanted to improve the productivity of their cattle, but the foundations of population genet-ics, quantitative genetics, and animal breeding had not been laid. Early animal breeders struggled to identify genetically superior families using performance records that were influenced by local environmental conditions and herd-specific management practices. Daughter–dam comparisons were used for more than 30 yr and, although genetic progress was minimal, the attention given to performance recording, genetic theory, and statistical methods paid off in future years. Contem-porary (herdmate) comparison methods allowed more accurate accounting for environmental factors and ge-netic progress began to accelerate when these methods were coupled with artificial insemination and progeny testing. Advances in computing facilitated the imple-mentation of mixed linear models that used pedigree and performance data optimally and enabled accurate selection decisions. Sequencing of the bovine genome led to a revolution in dairy cattle breeding, and the pace of scientific discovery and genetic progress accel-erated rapidly. Pedigree-based models have given way to whole-genome prediction, and Bayesian regression models and machine learning algorithms have joined mixed linear models in the toolbox of modern animal breeders. Future developments will likely include elu-cidation of the mechanisms of genetic inheritance and epigenetic modification in key biological pathways, and genomic data will be used with data from on-farm sensors to facilitate precision management on modern dairy farms.
Key words: genetic selection, dairy cattle, genomic selection, statistical models
THE BUILDING BLOCKS
Performance Recording
Pedigree records and performance data were the key building blocks in developing effective genetic selection programs in the pre-genomic era, as noted in Appendix Table A1. Pedigree records traced back to the origin of breed societies in the late 1800s, and widespread collec-tion of performance data began shortly thereafter, with the encouragement of early dairy industry pioneers such as W. D. Hoard. The first statewide association for recording milk weights and analyzing butterfat samples was formed in Michigan in 1905, and by 1908, the United States Department of Agriculture (USDA) Bureau of Animal Industry began organizing local and state cow testing associations into the national Dairy Herd Improvement Association (DHIA). Responsibil-ity for this effort was transferred to federal extension workers in 1914, and participation in milk testing grew rapidly (VanRaden and Miller, 2008), as shown in Fig-ure 1.
Monthly DHIA testing was the norm for many de-cades, but now about two-thirds of dairy farms use labor-efficient a.m./p.m. testing plans, in which milk samples are taken at alternate times each month. Future strategies that focus on more frequent DHIA sampling of recently fresh cows or cows in the highest-producing pens may provide more useful data for cows that are at peak efficiency and at the greatest risk for common health disorders. Electronic measurement of data, via radiofrequency identification (RFID) sensors and inline sampling systems, has replaced manual entry of pedi-gree and performance data, as shown in Figure 2.
Local bull associations were common during the 1920s and 1930s, until the widespread adoption of AI in the 1940s, when dozens of regional AI cooperatives were formed. Because virtually all traits of interest in dairy cattle are sex-limited, genetic evaluation of a bull’s own
A 100-Year Review: Methods and impact of genetic selection in dairy cattle—From daughter–dam comparisons to deep learning algorithms1
K. A. Weigel,*2 P. M. VanRaden,† H. D. Norman,‡ and H. Grosu§*Department of Dairy Science, University of Wisconsin, Madison 53706†Animal Genomics and Improvement Laboratory, USDA-ARS, Beltsville, MD 20705‡Council on Dairy Cattle Breeding, Bowie, MD 20716§National Research and Development Institute for Biology and Animal Nutrition, 077015 Balotesti, Romania
Received March 29, 2017.Accepted June 11, 2017.1 This review is part of a special issue of the Journal of Dairy Science
commissioned to celebrate 100 years of publishing (1917–2017).2 Corresponding author: [email protected]

Journal of Dairy Science Vol. 100 No. 12, 2017
100-YEAR REVIEW: METHODS AND IMPACT OF GENETIC SELECTION 10235
Figure 1. Participation in milk recording programs in the United States, from 1908 to 2017.
Figure 2. Recording of performance data for dairy cows then (1936, left panels) and now (2017, right panel).

10236 WEIGEL ET AL.
Journal of Dairy Science Vol. 100 No. 12, 2017
phenotypes is not useful, and strategies for estimating a bull’s genetic superiority or inferiority based on the performance of his offspring were needed.
Pedigree Data
Despite the fact that dairy cattle breed societies as-signed unique identification numbers to individual cows and bulls as early as the late 1800s, a large proportion of nonregistered animals (“grades”) were not included in breed society herdbooks. An alternative identifica-tion method was needed, and USDA introduced metal ear tags with unique numbers in 1936. These evolved into the 9-digit tag series (e.g., 35ABC1234) introduced by the Animal and Plant Health Inspection Service (APHIS) and National Association of Animal Breed-ers (NAAB) in 1955, which are still used for many cows today. The American ID series, introduced in 1998, features a 2-character breed code, 3-character country code, and 12-digit identification number (e.g., HOUSA00035ABC1234 or HO840012345678910). This system was designed to be unique worldwide and to in-clude both registered and grade animals, and it allows multiple identification codes for individual animals to be cross-referenced to a single unique number.
EARLY METHODS TO PREDICT BREEDING VALUES
Daughter–Dam Comparison
The lactation performance of a cow was long thought to be influenced by heredity, and early selection deci-sions were based simply on an individual cow’s pheno-type for milk or butter yield. The idea of comparing a cow’s milk production with that of her dam emerged near the turn of the 20th century. Several indices were proposed for this purpose (Davidson, 1925; Graves, 1925; Yapp, 1925; Goodale, 1927; Gowen, 1930; Bon-nier, 1936; Allen, 1944) and their relative accuracy was compared by Edwards (1932). In practice, the earliest known daughter–dam differences in the United States were computed by individual bull associations around 1915, based on a handful of sires with a few offspring apiece—this was the first serious attempt to improve dairy cattle by selection. By 1927, approximately 250 cooperative dairy bull associations, representing more than 6,000 farmers, provided data to the USDA and, for the next 4 decades, the USDA computed daugh-ter–dam comparisons for dairy bulls and mailed the results to their owners. Artificial insemination became available in the late 1930s, and with it, the opportunity for superior bulls to produce hundreds or thousands of offspring in many herds. Large groups of daughters performing under a variety of management and envi-
ronmental conditions greatly enhanced the accuracy of genetic predictions. During this period, the work of giants such as R. A. Fisher (1918, 1930) and J. B. S. Haldane (1932) laid the foundations of population and quantitative genetics, which allowed pioneers such as Sewall Wright (1932) and Jay Lush (1931, 1933) to develop the science of animal breeding and the sta-tistical methodologies needed for accurate evaluation of dairy sires. Various indices based on daughter–dam comparisons were developed, including those of Wright (1932) and Lush et al. (1941).
Daughter–dam comparisons facilitated genetic evalu-ation of bulls that were used in multiple herds, as long as performance data were available for the dam and her daughters. This method accounted for herd-specific management practices and local environmental condi-tions if the dam and daughter were housed in the same herd. Changes in management or environmental con-ditions that occurred in the time between dam’s and daughter’s performance were ignored. Relationships between sires and their mates were not considered, and this assumption was sometimes violated if the bull was used in his herd of origin. Variation in the phenotypic performance of the dam, relative to her actual genetic merit, was a huge source of error in the resulting pre-dictions. Genetic trends over time were ignored, but ge-netic progress was negligible in most herds at the time. An important limitation was that sire evaluations were not regressed to the mean, so bulls evaluated based on only a few daughter–dam pairs were more likely to have extremely high or low genetic predictions. During this period, methods were developed to standardize records for lactation length (305 d), milking frequency (2×), and age at calving (mature equivalent). Adjustments for season of calving were also developed, but differ-ences in environmental conditions between years were generally ignored.
Selection Index
Hazel and Lush (1942) introduced the selection index for EBV for individual traits, and this method was used by Lush (1944) to derive weights for various sources of information in daughter–dam comparisons. The EBV of a selection candidate was predicted using multiple linear regression, where each independent vari-able represented individual or mean performance for a specific type of relative, such as dam, sire, maternal half-siblings, paternal half-siblings, or progeny. The regression coefficients represented index weights, which were a function of genetic relationships and the amount of information contributed by the phenotypic record or average (e.g., number of lactations or number of off-spring). The amount of information from various types

Journal of Dairy Science Vol. 100 No. 12, 2017
100-YEAR REVIEW: METHODS AND IMPACT OF GENETIC SELECTION 10237
of relatives often differed between selection candidates, so index weights were adjusted for the number of rela-tives or lactations contributing to mean performance, based on heritability and repeatability parameters.
Contemporary (Herdmate) Comparisons
Contemporary comparisons represented a huge leap in the accuracy of genetic evaluations because of their ability to account for the specific management and en-vironmental conditions under which phenotypes were expressed (Robertson et al., 1956). Robertson and Rendel (1954) are credited with introducing contempo-rary comparisons, and Henderson et al. (1954) formally published the herdmate comparison model in the same year. However, Searle (1964) noted that this method had been used in New Zealand before either publication. The concept of contemporaries or herdmates exposed to similar management and environmental conditions is much like that of an epidemiological “cohort,” in which patients are grouped based on commonalities in demo-graphic features (e.g., age, sex, or geographical region) and lifestyle characteristics (e.g., exercise regimen or tobacco usage). A critical consideration in designing contemporary groups is the balance between a precise definition of the cow’s environmental conditions and the need for enough herdmates to provide an accurate estimate of the contemporary group effect.
Progeny testing became widespread during the era of daughter–dam comparisons. However, the introduction of contemporary comparisons allowed AI centers to fully capture the benefits of distributing the semen of young bulls to dozens or hundreds of herds with differ-ent geographical locations, environmental conditions, and management practices. Contemporary comparisons were enhanced by regressing average daughter contem-porary deviations (now known as daughter yield devia-tions) toward zero, based on heritability and number of progeny, because mean deviations for bulls with few offspring have larger variance than mean deviations for bulls with many offspring. Some contemporary com-parison models also included a herd by sire interaction adjustment to limit the effect of a single herd on a sire’s EBV.
Cornell University implemented a regional sire evalu-ation system based on contemporary comparisons in the mid-1950s (Henderson, 1956), in which records were weighted based on the number of lactations per cow and a repeatability parameter. However, informa-tion about the number of daughters or contemporaries was not used when combining daughter contemporary deviations to compute the sire’s EBV. The contempo-rary comparison method was applied by the USDA in 1961, replacing the daughter–dam comparison system.
This model allowed the inclusion of cows for which performance records of the dam were unknown. Herd-year-season contemporary groups were based on a 5-mo moving average, and herdmate averages were adjusted for seasonal effects. As in the Cornell model, sire effects were regressed to the mean, so a bull could not rank highly unless he had a significant number of daughters. Records of cows that were culled or sold for dairy pur-poses were extended to 305 d, whereas longer records were truncated at 305 d.
Other adjustments were implemented at this time, including factors for extending short lactations to 305 d that were specific to breed, region, season, and parity, and records were weighted by length of lactation. A time lag between the cow’s calving date and initiation of the sire summary ensured that records from culled cows with short lactations did not bias the genetic evaluations of their sires. This was an obvious limita-tion as regards timeliness of data entering the genetic evaluation system, at least until 1975, when records in progress became available for all cows in the herd. Estimates of sires’ genetic merit were published as the predicted difference (PD) in performance of their daughters relative to contemporaries in a typical herd. The term “repeatability” (later “reliability”) was used to denote the accuracy of a bull’s PD, and it indicated the level of confidence a farmer should have when pur-chasing the bull’s semen. This method, which was used until 1973, allowed the inclusion of more data, tended to be less biased, and provided a cow index for ranking elite females.
Several competing methods for sire evaluation were introduced during this period. Most were closely re-lated to each other and to the weighted least-squares approaches of C. R. Henderson (1952, 1963) and Cun-ningham (1965), as well as simplified versions of the best linear unbiased prediction (BLUP) models de-scribed in subsequent sections (Thompson, 1976). The cumulative difference method of Bar-Anan and Sacks (1974) is essentially equivalent to the contemporary comparison method but with an adjustment for the genetic level of sires of the cow’s contemporaries. The term “cumulative” recognized that performance data of a bull’s daughters accumulate over time, resulting in increased accuracy of predictions, and this method was the basis of the modified cumulative difference method proposed by Dempfle (1976).
Genetic evaluations of dairy sires were unified at USDA in 1968 (Plowman and McDaniel, 1968), when dairy cattle breed associations discontinued their own sire rankings for production traits. In 1972, the USDA Division of Dairy Herd Improvement Investigations was renamed as the USDA-ARS Animal Improvement Programs Laboratory (AIPL)—this laboratory set the

10238 WEIGEL ET AL.
Journal of Dairy Science Vol. 100 No. 12, 2017
global standard for translational research on genetic evaluation of dairy cattle for the next 45 years.
Modified Contemporary Comparison
In 1974, the modified contemporary comparison (MCC) method was introduced (Dickinson et al., 1976; Norman et al., 1976). In this model, a bull’s PD repre-sented a weighted average of his pedigree value and the deviation in performance of his daughters from their contemporaries. In previous methods, a bull’s pedigree information was generally discarded when data from milking daughters became available. The MCC method also allowed the inclusion of sire and maternal grandsire pedigrees. The genetic merit of competing sires within a given herd (i.e., sires of contemporaries) was taken into account, and this approach could better accommodate genetic trends over time (Norman et al., 1972). These features of the MCC method were increasingly impor-tant, because modern selection tools and advanced reproductive technologies now allowed some farmers to make more rapid genetic progress than their peers (McDaniel et al., 1974). In addition, positive assorta-tive mating had become popular, as farmers “mated the best to the best” to improve their herds (Norman et al., 1987). The first 5 lactation records from a given cow were included in the MCC model, which provided a more accurate picture of an animal’s genetic superior-ity or inferiority in lifetime productivity. Contemporary groups differed for primiparous and multiparous cows within a herd. As previously, a bull’s evaluation was regressed based on heritability, number of daughters, and lactations per daughter, but regression was toward his pedigree value, rather than the population mean.
The MCC method produced results that were nearly identical to those of BLUP in a sire model, but with substantially lower computing requirements. The prac-tice of resetting the genetic base was initiated during this time, so farmers would be reminded to raise their sire selection standards as the breed made genetic prog-ress. However, periodic resetting of the genetic base “forgives” undesirable genetic trends that may occur as correlated responses to selection (e.g., female fertility) or biases in the perceived value of certain traits (e.g., stature). The MCC method was widely accepted by pedigree breeders and AI studs, and it led to impressive annual genetic gains of about 45 kg of milk per cow per lactation. Another innovation during this period was the incorporation of pricing data for milk, fat, and protein, so that estimates of genetic merit could be expressed as the financial gain or loss relative to an average sire of the same breed (PD$). Cow indices became widely used during the MCC era; these represented a weighted average of the cow’s modified contemporary deviation
and her sire’s PD (and later her dam’s cow index), with weights depending on the amount of information contributing to each component.
LINEAR MODELS
Mixed Linear Models
Henderson (1953) advocated the use of statistical models to partition genetic and environmental variance components and predict the genetic merit of dairy sires, and this led to the development of BLUP methodology. Despite its theoretical appeal, computing limitations prevented implementation of BLUP until 1972, when Cornell University implemented BLUP in a sire model; this model was later modified to include genetic rela-tionships among sires.
A mixed linear model is expressed most succinctly in matrix notation as
y = Xb + Zu + e,
where y is a vector of phenotypic measurements on a group of animals; b is a vector of continuous or categor-ical fixed effects that are known to influence the pheno-type, such as age at calving or herd-year-season con-temporary group, as one would encounter in a tradi-tional least-squares analysis; u is a vector of random effects, such as sire breeding values; X and Z are inci-dence matrices that map the phenotypic observations in y to the fixed and random effects in b and u, respec-tively, and e is a vector of random residual effects, such as temporary environmental conditions or measurement error. The variance components σu
2 and σe2, correspond-
ing to the random effects u and e, can be estimated using a variety of methods, such as maximum likeli-hood (Harville, 1977).
Sire and Maternal Grandsire Models
If the vector u in the mixed model equations com-prises the breeding values of dairy sires and y contains the lactation records of their daughters, the aforemen-tioned mixed linear model would be considered as a “sire model.” If we specify that G I= ( )N u0 2, ,σ this
model assumes that sires are unrelated to each other, and the resulting sire EBV are regressed toward the population mean in proportion to the magnitude of σu
2 relative to σe
2. The assumption that sires are unrelated to each other is highly unrealistic, given the widespread use of AI and embryo transfer, which lead to large families of paternal half-siblings and small families of

Journal of Dairy Science Vol. 100 No. 12, 2017
100-YEAR REVIEW: METHODS AND IMPACT OF GENETIC SELECTION 10239
full-siblings, respectively. The concept of modeling cor-relations between the elements of u when specifying G is straightforward, and in this application pedigree in-formation was used to derive a matrix of expected ad-ditive genetic relationships, where G A= ( )N u0 2, .σ The
resulting A matrix is very large, of the order of the number of elements of u, and it could not be inverted with computational resources available at the time. Henderson (1976) developed a set of rules for construct-ing A−1 directly, without building A. This allowed more precise modeling of relationships among sires than the MCC model, as well as relationships between sires and cows or relationships between sires and mater-nal grandsires (Henderson, 1975). Later, this method was extended to allow efficient construction of A−1 in the presence of inbreeding (Tier, 1990).
In the sire model implemented for the Northeast AI Sire Comparison at Cornell University in 1972, the vec-tor b included the fixed effects of herd-year-season of calving and genetic group of the sire, where the latter was based on birth year of the bull and the AI orga-nization from which he came. The idea was that all young bulls purchased by a given AI center in a given year were of similar genetic merit, which facilitated the assumption that the sires in u represented indepen-dent (unrelated) samples from the same distribution. Only first-lactation records of AI daughters were used, although this restriction was later relaxed if the ad-ditional records were from the same herd (Ufford et al., 1979). Random mating between sires and dams was as-sumed, and maternal relationships between cows were ignored.
To address the naïve assumption that sires were ran-domly mated to dams, Quaas et al. (1979) proposed a maternal grandsire model. This model included an additional random effect, which represented the addi-tive genetic merit of the maternal grandsire, as well as an additional fixed effect, which represented the genetic group of the maternal grandsire. Although this was a positive step in addressing assortative mating, it still assumed that each mate of a given bull represented a random sample of all daughters of that maternal grandsire. Maternal relationships between dams were ignored and the model did not add value in cases where the maternal grandsire was unknown. A comprehensive examination of assortative mating for milk yield by Norman et al. (1987) showed that herds with higher average genetic level consistently used genetically su-perior bulls. However, the primary concern was bias due to within-herd assortative mating, which was not common at the time (Norman et al., 1987), and few AI bulls were affected negatively in the national sire evaluation system.
Animal Model
The inability of sire or maternal grandsire models to fully account for nonrandom mating of sires with expensive semen to cows and heifers with highest per-ceived value within a given herd was well known. In addition, farmers who wished to market superior breed-ing stock were no longer content with a genetic evalu-ation system that focused on sires and treated cows as a by-product. In 1989, AIPL scientists introduced the “animal model” (Wiggans and VanRaden, 1989), which used all known relationships between cows and their maternal and paternal ancestors. In this model, the additive genetic effects of animals represent an infinite number of alleles with very small effects—the so-called infinitesimal model of inheritance.
Once implemented, by using an iteration on data al-gorithm and the supercomputer at Cornell University, the animal model became the global standard for ge-netic evaluation of dairy cattle. The statistical method-ology, which had been derived almost 3 decades earlier, allowed precise accounting of the genetic merit of mates and provided a consistent framework for simultaneous evaluation of male and females. The breeding value of an individual animal is represented as the sum of one-half of the additive genetic merit of its sire, one-half of the additive genetic merit of its dam, and a Mendelian sampling term that represents its deviation from the average additive genetic merit of its full-siblings due to random sampling of alleles represented in the gametes. All known relationships are considered in the A matrix, so the performance of one animal contributes to the EBV of all known paternal and maternal relatives, with degree of the contribution depending on proximity of the relationship. Users typically provide at least 4 or 5 generations of pedigree data, and pedigrees are rarely traced beyond the 1970s, when herdbook records were computerized. When pedigree data are missing, un-known (phantom) parent groups (Westell et al., 1988) can be used to account for differences in the genetic merit of missing ancestors.
In the USDA animal model, management groups were defined according to parity (first vs. later), regis-try status (registered vs. grade), and 2-mo time blocks within herd-year. As in previous systems, adjustments were used to account for age, milking frequency, and length of lactation, and these factors were specific to breed and geographical region. Records in progress have been used in the United States since 1975; this increased genetic progress by up to 10% by reducing the time lag between data collection and breeding value prediction (Powell et al., 1975). Incomplete lactation records were projected to a 305-d basis once the cow had completed 2 or 3 monthly DHI tests, to produce

10240 WEIGEL ET AL.
Journal of Dairy Science Vol. 100 No. 12, 2017
timely genetic predictions and enable rapid selection decisions for cows and their sires. Data collection rat-ings (DCR) were introduced by USDA in 1998; these are based on the number and spacing of test-day milk records relative to standard monthly supervised record-ing of all milkings per day, which receives a score of 100. The DCR system allows weighting of records ac-cording to their expected value in genetic evaluations, and they can be used as a guide to reimburse farmers who provide high quality data.
The accuracy of EBV produced by an animal model can be calculated from the elements of the inverse of the mixed model coefficient matrix, but this is compu-tationally infeasible, so approximations are used (Har-ris and Johnson, 1998). A practical approach is to sum the number of daughter equivalents that contribute to the genetic prediction of a given animal (VanRaden and Wiggans, 1991), where the quantities of informa-tion from the animal’s descendants, own phenotypic records, and ancestors (noting that siblings and cousins contribute through the animal’s parents) are counted when computing reliability values.
Test-Day Model
In 1993, Cornell University was granted a US patent for the “test-day model,” in which the performance of an animal relative to its herdmates was evaluated us-ing daily milk weights from the herd’s monthly test, rather than standardized 305-d lactation yields. This model was introduced for routine genetic evaluations in several countries (e.g., Canada, Germany) in which the genetic evaluation center obtained a license or suc-cessfully challenged the patent. However, because of this patent, a test-day model was not implemented for routine genetic evaluations in the United States. The Cornell patent was controversial because many organi-zations (including USDA) had been providing informa-tion for decades about the performance of an individual cow relative to her herdmates on a given test date, and Australia had formally implemented a test-day genetic evaluation model in 1984. However, no one had previ-ously considered patenting this relatively well known statistical process (Rothschild and Newman, 2002). An interesting feature of test-day models is their ability to produce genetic evaluations for lactation persistency; for example, the ratio of expected milk yield at 280 d versus 60 d postpartum. Animals with greater lacta-tion persistency may be more likely to remain healthy throughout the lactation and might be able to meet their nutritional needs with a less expensive ration because they do not experience the extremes of DMI or negative energy balance of their less-persistent con-temporaries.
Random Regression Models and Covariance Functions
Data that are collected over time, such as test-day milk weights of lactating cows or periodic body weights of growing heifers, are often analyzed using a random regression model (Henderson, 1982; Ali and Schaeffer, 1987; Jamrozik et al., 1997). Functions such as Leg-endre polynomials or splines can be used to describe the trajectory of genetic, permanent environment, and temporary environment effects during the lactation. Numerous linear and nonlinear functions have been proposed for modeling these effects. For example, the Ali and Schaeffer (1987) model included a random herd-test date contemporary group effect, as well as fixed (overall mean) and random (additive and permanent environmental) regression coefficients corresponding to 4 functions of the time during lactation when the cow’s milk weight was recorded. In that study, the residual variance was assumed fixed throughout the lactation but, in general, random regression models can provide estimates of the genetic, permanent environmental, and residual variances (as well as heritability and repeatability) at any time point during the lactation. The EBV of selection candidates can be computed at various time points during the lactation, and random regression models offer greater flexibility in accom-modating variation in the frequency of milk recording between farms.
A similar approach, known as covariance functions (Kirkpatrick et al., 1990), can be used to analyze longitudinal data and explain the interrelationships between genetic and environmental factors over time. These models can be computationally demanding, and one must ensure that trajectories of additive genetic, permanent environment, and temporary environment effects are modeled appropriately. The goal of model-ing the trajectory of genetic, permanent environment, and temporary environment effects precisely using a complicated function with 4 or 5 parameters must be balanced with the reality that parameter estimates will have large standard errors when applied to monthly DHIA records with only 8 to 10 data points per cow per lactation.
Random regression models and covariance functions can provide insight about the trajectory of biological processes during the lactation (e.g., milk fat synthesis, body tissue deposition). In addition, these models can provide information about correlated responses to se-lection for traits expressed over time, such as the effect of selection for peak milk yield in early lactation on milk composition in late lactation. The results of ran-dom regression models or covariance functions can also be used to facilitate the development of efficient data

Journal of Dairy Science Vol. 100 No. 12, 2017
100-YEAR REVIEW: METHODS AND IMPACT OF GENETIC SELECTION 10241
collection protocols that maximize genetic progress per dollar invested in measuring phenotypes.
Multiple-Trait Models
Harvey and Lush (1952) introduced the first selection indices to combine production and conformation traits in cattle, following the work of Hazel and Lush (1942) and Hazel (1943), who defined an animal’s aggregate genotype as a linear combination of the additive genetic values and economic values of traits that comprise the overall breeding goal. The number and definition of traits in the aggregate genotype or breeding goal may differ from the number and definition of traits in the selection index, particularly if some traits are difficult or expensive to measure (e.g., feed efficiency), or if se-lection relies on correlated traits for which phenotypes are more readily available.
Most models for estimation of breeding values can be extended to incorporate multiple traits (Henderson, 1976). Genetic correlations between traits represent the extent to which genetic superiority for one trait tends to be inherited with genetic superiority or inferiority for another trait in the breeding goal. Such correlations can be due to pleiotropy (one gene affecting several traits) or they can be induced by selection. Permanent environmental correlations measure the extent to which nongenetic factors occurring at some point during an animal’s life may affect multiple phenotypes measured in subsequent months or years, whereas temporary environmental (residual) correlations acknowledge the extent to which current management practices, envi-ronmental conditions, or recording errors affect more than one trait.
Examples of favorable genetic correlations in dairy cattle include milk yield with longevity or body condi-tion score with female fertility, whereas examples of unfavorable genetic correlations include milk yield with female fertility or milk yield with mastitis. Enough genetic variation exists within the population to find specific individuals or families that excel for traits that are negatively correlated, such as high milk yield with good female fertility. Multiple-trait models enhance the accuracy of genetic predictions by bringing additional phenotypes from positively or negatively correlated traits into the analysis. In addition, multiple-trait mod-els help alleviate selection bias if phenotypic data for the trait upon which historical selection decisions were made are available (Pollak et al., 1984). However, the primary advantage of a multiple-trait model is its abil-ity to assess interrelationships between traits in the breeding goal; this information is critical for projecting the desirable and undesirable correlated responses that will occur due to selection on EBV for various traits.
Genotype by Environment Interactions
Generally speaking, genotype by environment (G×E) interactions for economically important traits in dairy production systems in temperate environments are small, at least compared with the interactions that plant breeders consider when matching lines or variet-ies with photoperiod, temperature, moisture, and soil conditions. Important G×E interactions exist between temperate and tropical environments, so farmers in countries such as Brazil or Thailand tend to avoid purebred cattle from the common European breeds and prefer cows with 12.5 to 37.5% inheritance of breeds that are adapted to local temperature-humidity condi-tions, tick-borne illnesses, and infectious diseases.
Multiple-trait models are often used to assess G×E interactions. For example, one can consider milk pro-duction in a confined herd with a TMR and milk pro-duction in a pasture-based herd with rotational grazing as separate but correlated traits (Weigel et al., 1999). Phenotypes of the same animals in both production systems (as a plant breeder would do by planting the same variety in different fields) are not necessary, be-cause genetic relationships between cows in different systems allow partitioning of phenotypic covariances between environments into their genetic and environ-mental components.
Reaction norm models, which are conceptually simi-lar to covariance functions, can describe the trajectory of genetic or environmental effects across some gradi-ent, usually a gradient that spans overall management level or specific environmental conditions (Strandberg et al., 2009). A conceptually similar approach was used by Ravagnolo et al. (2000) when modeling the effect of heat stress on milk yield and fertility using temperature-humidity index (THI) data from local weather stations. Each animal is hypothesized to have a specific intercept for the onset of heat stress—the THI at which a decline in milk yield or fertility is observed for a particular cow. In addition, each animal is assumed to have a specific slope, which represents the rate of decline in milk yield or fertility per additional increment of THI beyond that animal’s point of onset. Similar analyses have been car-ried out in Australia to quantify the ability of individ-ual animals or sire families to cope with the effects of climate change (Garner et al., 2016). A challenge with the implementation of heat stress, climate adaptation, or other reaction norm models is the presentation of re-sults. Sire EBV for every trait in each of low, medium, or high THI environments would not be sensible due to information overload, but electronic distribution of results could be simple if EBV were customized to end users’ local environmental and production conditions. Customizing EBV or selection index weights to local
10242 WEIGEL ET AL.
Journal of Dairy Science Vol. 100 No. 12, 2017
environmental and herd management conditions could provide additional benefits beyond precise modeling of G×E. For example, it would reduce the tendency for all farmers in a given region or country to select the same sires, thereby addressing the challenge of controlling inbreeding and maintaining genetic diversity.
INTERNATIONAL COMPARISONS
Holstein-Friesian Strain Comparison
A massive cattle breeding trial by the Food and Agriculture Organization (FAO) of the United Na-tions in the 1970s involved mating 30,000 Polish Black and White cows on 70 state-owned farms to interna-tional sires. Approximately 80,000 doses of semen were sourced from young (unproven) Holstein AI bulls in 10 countries, although it was difficult to ensure that these bulls represented a random sample of the country’s Holstein population. This study led to great interest in the international trade of dairy sire semen, particularly the export of semen of North American Holstein bulls to Europe and other continents.
Conversion Equations
Early genetic comparisons of dairy sires from differ-ent countries used regression-based “conversion equa-tions.” The EBV of bulls with milking daughters in multiple countries, usually the country of origin and one or more importing countries, were used to develop conversion equations. The regression model included an intercept (difference in mean) and a slope coefficient (difference in scale), but the accuracy of converted EBV were generally poor, due to large standard errors of the intercept and slope coefficients, unless a large number of bulls had milking daughters in both countries.
Multiple-Trait Across-Country Evaluation
In 1995, the International Bull Evaluation Service (Interbull; Uppsala, Sweden) introduced the multiple-trait across-country evaluation (MACE) method as a replacement for conversion equations (Schaeffer, 1994). This linear model approach allowed the Interbull Centre to generate EBV for every bull in every par-ticipating country simultaneously. The input data were daughter yield deviations or deregressed EBV (with ancestral influence removed) from every country in which the bull had milk-recorded daughters, and these were weighted by the number of progeny per country. More than two dozen countries currently participate
in Interbull sire evaluations, and the service includes production, type, fertility, calving, longevity, health, and workability traits for every major dairy cattle breed. Estimated genetic correlations for milk yield between North American and European countries tend to be high, in the range of 0.85 to 0.95, whereas those with Australia, New Zealand, and other countries with grazing-based production systems can be 0.75 or lower. Genetic correlations for conformation and fitness traits vary widely, due to differences in trait definitions. The influence of factors such as heat stress or parasite resis-tance is largely unknown, due to the absence of tropical or subtropical countries in the Interbull analyses.
Member countries have provided their national bull EBV and pedigree files to Interbull free of charge for more than 2 decades, and Interbull staff have carried out pedigree-based meta-analyses using the MACE methodology. Predictions for young genome-tested bulls can be computed with genomic MACE (Sullivan and VanRaden, 2009), but most countries publish pre-dictions derived from genotype exchanges; for example, the North American Consortium (which includes Great Britain, Italy, Switzerland, Germany, and Japan), Eu-rogenomics (for Holsteins), or Intergenomics (for Brown Swiss). Exchanging genotypes and pedigrees is simpler than sharing and standardizing phenotypes measured in various ways under different conditions, and breeders from more than 50 countries have obtained genomic predictions derived from the North American reference population.
NONLINEAR MODELS
Threshold Models
Threshold models, introduced to the field of animal breeding by Gianola and Foulley (1983), allow proper modeling of binary or categorical traits, such as still-birth or dystocia. Normality assumptions are violated, but a link function (e.g., probit, logit) matches ob-served binary or categorical phenotypes with sire EBV on an underlying “liability” scale. The area under the curve of a normal distribution is modeled such that if a sire’s EBV (λ) is less than the first threshold, it is assigned to category 1, whereas if λ falls between the first and second thresholds, it is assigned to category 2, and so on. Threshold models are commonly applied to calving traits, often in conjunction with maternal effects models, and their usage is generally limited to sire models (rather than animal models). In general, threshold models lead to slightly more precise EBV than can be obtained by fitting binary or categorical phenotypes with a conventional linear model.
Journal of Dairy Science Vol. 100 No. 12, 2017
100-YEAR REVIEW: METHODS AND IMPACT OF GENETIC SELECTION 10243
Survival Analysis
Failure-time (survival analysis) methods, such as Cox or Weibull proportional hazards models, are used widely in epidemiology to account for the presence of “censored” observations; that is, measurements of time to an event for which the starting or ending point (or both) is unknown. An example is longevity or length of productive life (PL), which is measured as time from first calving until death or culling due to illness, injury, or infertility. Cows that are still alive have observations that are right-censored, because their date of death or culling is unknown, as do cows that are sold to another herd for dairy purposes. Likewise, phenotypes for days open, a common measure of female fertility that is com-puted as time from calving until pregnancy, are right-censored for cows that have not yet become pregnant and for nonpregnant cows that left the herd for reasons other than infertility. Simplistic approaches, such as assuming a large and arbitrary value for days open of nonpregnant cows or longevity of living cows, have been implemented in many genetic evaluation systems (VanRaden and Klaaskate, 1993). Ducrocq et al. (1988) extended the Weibull proportional hazards model to in-clude random additive genetic effects and relationships, which allowed computation of sire EBV for survival. Proper modeling of right-censored records allowed the inclusion of massive numbers of animals that were still alive, leading to more timely and accurate results. Pre-vious studies allowed an opportunity period (e.g., 84 mo) for cows to fully express phenotypes for productive life or lifetime net profit (e.g., Cassell et al., 1993), but by the time studies were completed and manuscripts
were published, the youngest cows were born more than a decade earlier. Another advantage of this method is the ability to use time-sensitive covariates, which allows more precise modeling of management and environmen-tal factors that can change over time.
GENOMIC SELECTION
Marker-Assisted Selection
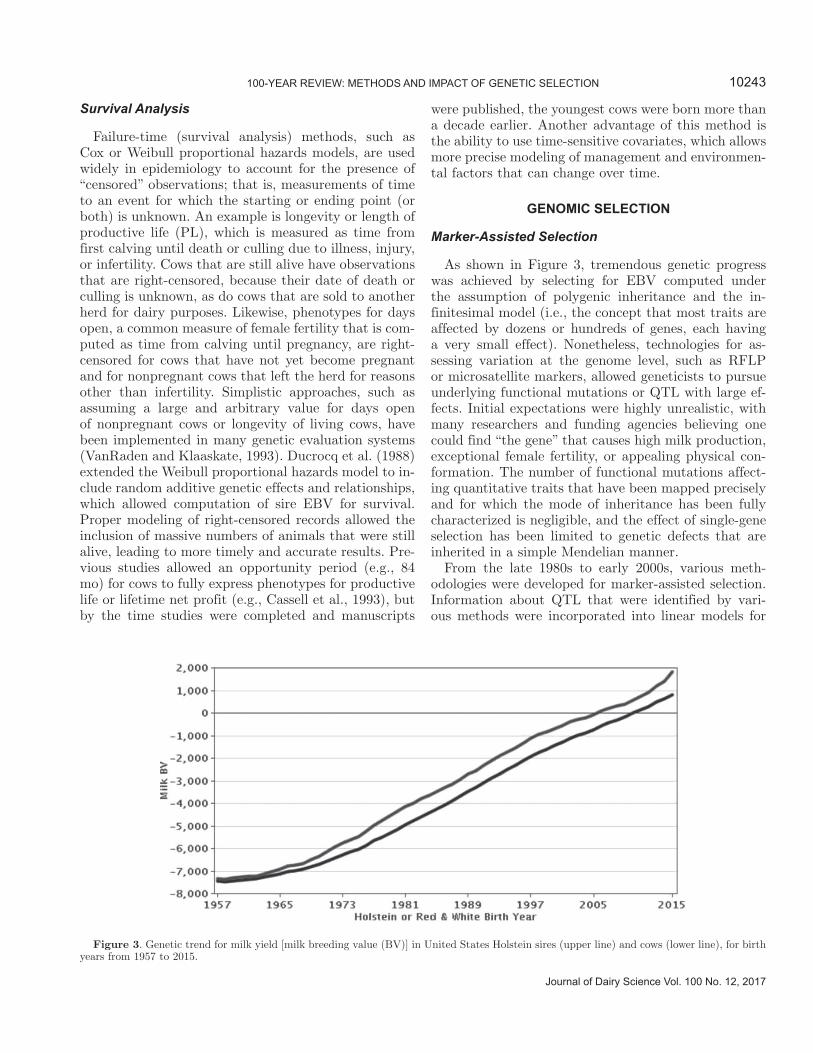
As shown in Figure 3, tremendous genetic progress was achieved by selecting for EBV computed under the assumption of polygenic inheritance and the in-finitesimal model (i.e., the concept that most traits are affected by dozens or hundreds of genes, each having a very small effect). Nonetheless, technologies for as-sessing variation at the genome level, such as RFLP or microsatellite markers, allowed geneticists to pursue underlying functional mutations or QTL with large ef-fects. Initial expectations were highly unrealistic, with many researchers and funding agencies believing one could find “the gene” that causes high milk production, exceptional female fertility, or appealing physical con-formation. The number of functional mutations affect-ing quantitative traits that have been mapped precisely and for which the mode of inheritance has been fully characterized is negligible, and the effect of single-gene selection has been limited to genetic defects that are inherited in a simple Mendelian manner.
From the late 1980s to early 2000s, various meth-odologies were developed for marker-assisted selection. Information about QTL that were identified by vari-ous methods were incorporated into linear models for
Figure 3. Genetic trend for milk yield [milk breeding value (BV)] in United States Holstein sires (upper line) and cows (lower line), for birth years from 1957 to 2015.
10244 WEIGEL ET AL.
Journal of Dairy Science Vol. 100 No. 12, 2017
genetic evaluation, typically as fixed effects. One repre-sented the EBV of a selection candidate as the sum of estimated effects for QTL1, QTL2, QTL3, . . ., and a polygenic EBV that represented unknown loci dispersed throughout the genome that were accommodated by the relationship matrix, A. Gains in genetic progress due to marker-assisted selection failed to meet expectations, as reviewed by Dekkers (2004), particularly when the causative mutation was unknown and selection relied on markers in population-wide linkage disequilibrium, or when selection was carried out within families using markers in population-wide linkage equilibrium. The effects of significant markers were often overestimated (Beavis, 1998), and many QTL with small effects were missed due to stringent significance thresholds (Lande and Thompson, 1990).
Whole-Genome Selection
The seminal genomic selection papers of Nejati-Java-remi et al. (1997) and Meuwissen et al. (2001), coupled with the development of inexpensive high-throughput genotyping platforms for SNP markers (Matukumalli et al., 2009), revolutionized dairy cattle breeding. Dozens of methods and algorithms were developed for whole-genome selection in plants and animals (de Los Campos et al., 2013), and dairy cattle breeders were at the fore-front of this movement (VanRaden, 2008; VanRaden et al., 2009; Wiggans et al., 2017). Additional benefits, such as genome-based discovery of missing ancestors, can further enhance genetic progress. Early computa-tional and statistical hurdles associated with whole-genome selection were formidable, given the problem of estimating a large number (p) of SNP effects from the phenotypic data of a smaller number (n) of genotyped individuals.
BLUP Models
Mixed linear models have been used to estimate SNP effects, where the vector u contains SNP mark-ers that are assumed to represent a sample from a normal distribution; this provides BLUP estimates of SNP effects that can be summed over the genome to obtain genomic EBV of new selection candidates (SNP-BLUP; Meuwissen et al., 2001). Equivalently, a genomic relationship matrix (G) can be constructed from SNP genotypes, and this replaces the pedigree-based relationship matrix (A) in BLUP when comput-ing genomic EBV (GBLUP). Initially, SNP-BLUP was more computationally demanding than GBLUP, because the number of SNP exceeded the number of genotyped animals with phenotypic records. However, the training populations in major dairy breeds now
consist of tens of thousands of genotyped bulls with progeny data or hundreds of thousands of genotyped cows with performance records. The dimension of the mixed model coefficient matrix in GBLUP is of the order of the number of genotyped animals, which is growing very rapidly and often exceeds the number of SNP. Nonetheless, GBLUP is appealing due to its familiarity and ease of implementation among animal breeders who have been using BLUP for decades. The rapid growth in genotyped animals is due to the avail-ability of inexpensive, low-density SNP panels, which typically feature 5,000 to 25,000 SNP dispersed evenly across the genome. These low-density genotypes can be matched with medium-density (50,000 to 100,000 SNP) or high-density (500,000 to 800,000 SNP) genotypes of ancestors, and missing SNP on the low-density panel are filled in with 95 to 99% accuracy using genotype imputation algorithms (Habier et al., 2009; Weigel et al., 2010).
Single-Step GBLUP
Legarra et al. (2009) and Misztal et al. (2009) solved the perplexing challenge of analyzing phenotypes from genotyped and nongenotyped animals simultaneously when computing genomic predictions. Before this de-velopment, direct genomic predictions (direct genomic values, DGV) were derived from associations between SNP genotypes and corresponding phenotypes in the subset of genotyped animals. In a subsequent step, the DGV were combined with pedigree-based EBV of the same selection candidates, using a selection index or weighted average. An initial challenge with single-step GBLUP (ssGBLUP), as proposed by Legarra et al. (2009), was that tricks to enhance its computational efficiency, such as Henderson’s (1976) rapid method to create A−1 from pedigrees, were lacking. In ssGBLUP, one must create the inverse of a matrix (H) that in-cludes blocks for genome-based relationships among genotyped animals, pedigree-based relationships among nongenotyped animals, and pedigree-based relation-ships between genotyped and nongenotyped animals. Legarra et al. (2014) developed an efficient method for building H−1, and ssGBLUP can now be applied to relatively large data sets comprising genotyped and nongenotyped animals.
Bayesian Regression Models
Another set of models for genomic prediction was developed using Bayesian regression. Ordinary least-squares regression cannot accommodate a situation in which the number of explanatory variables (SNP) exceeds the number of data points (animals with phe-

Journal of Dairy Science Vol. 100 No. 12, 2017
100-YEAR REVIEW: METHODS AND IMPACT OF GENETIC SELECTION 10245
notypes), but in Bayesian regression models, the SNP effects are treated as random samples from an under-lying distribution. Bayes A (Meuwissen et al., 2001) assumes SNP effects are sampled from a t-distribution with thick tails, such that most SNP have very small effects but a few SNP (presumably those in linkage disequilibrium with nearby QTL) can have large ef-fects. A similar method, known as Bayes B (Meuwis-sen et al., 2001), assumes that SNP effects represent a mixture of 2 distributions, where a fraction (π) of the markers have zero effect on the phenotype and the remaining fraction (1 − π) have effects that follow a t-distribution. The fractional parameter, π, can be fixed in advance arbitrarily or estimated from the data using a method such as Bayes Cπ (Habier et al., 2011). Erbe et al. (2012) subsequently developed Bayes R, which features a mixture of normal distributions and accom-modates SNP with zero, small, medium, and large ef-fects. Bayesian regression methods tend to outperform GBLUP if QTL with moderate or large effects exist, whereas GBLUP performs very well in situations where inheritance approaches the infinitesimal model. A con-cern for the future is whether these models can provide robust estimates of breeding values for selection can-didates when only a handful of animals are chosen for propagation with advanced reproductive technologies. Can our statistical models function properly with this extreme level of selection intensity?
Machine Learning Methods
Machine learning is a branch of artificial intelligence that focuses on prediction of outcomes for unobserved individuals (unlabeled data) by applying highly flex-ible algorithms to the known attributes (features) and outcomes of observed individuals (labeled data). Outcomes can be continuous, categorical, or binary. In animal breeding, labeled data correspond to the refer-ence population or training set of older animals with genotypes and phenotypes, whereas unlabeled data cor-respond to the validation population or testing set of selection candidates with genotypes only. The features used for prediction are SNP genotypes. Countless ma-chine learning algorithms exist, and no single method provides universally superior predictions—the optimal method and its parameters vary from one application to the next.
As the popularity of machine learning has exploded in other fields, it has gained footing in genomic predic-tion of livestock as well. Machine learning algorithms are widely known for their ability to discover patterns in large, messy data sets, even when data regarding some potential explanatory variables are missing. Long et al. (2007) was among the first animal breeders to
apply machine learning to genomic prediction, using a filter-wrapper method for SNP-based classification of health traits in broiler chickens. A subsequent study by González-Recio et al. (2010) focused on a boosting algorithm for genomic prediction of the lifetime net merit of Holstein sires, whereas Okut et al. (2011) used an artificial neural network to predict the body mass index of mice using dense molecular markers. Yao et al. (2013) showed the tremendous flexibility of machine learning methods by using a random forest algorithm to identify potentially additive and epistatic QTL affect-ing residual feed intake in dairy cattle. More recently, Ehret et al. (2015) used an artificial neural network to predict milk production breeding values of Holstein-Friesian and Fleckvieh sires in Germany.
Machine learning, particularly deep learning algo-rithms for implementation of multi-layer artificial neu-ral networks, has great potential for enhancing genomic selection and dairy herd management. The ability of these algorithms to discover intricate patterns in messy data and predict outcomes more effectively than con-ventional statistical methods has been demonstrated in a variety of fields. Powerful algorithms are readily available in commercial and public domain software, but they are “black box” in nature. The end user must understand basic concepts, such as how to construct training and testing sets that are independent and ap-propriate for the intended use, how to tune the param-eters of a given model or algorithm, and how to avoid over-fitting the training data and making unrealistic conclusions about the model’s predictive ability in future applications. The flexibility of machine learn-ing algorithms may be valuable when incorporating biological knowledge gleaned from designed experi-ments, along with massive quantities of genomic and phenotypic data, for predicting the breeding values of selection candidates.
Inbreeding
Inbreeding coefficients are used to monitor the loss of genetic diversity within a breed over time and to account for the effects of inbreeding depression when comput-ing genetic evaluations. Expected future inbreeding has been calculated by the USDA since 1998, by measur-ing the relationship between each bull and a sample of females from the same breed, and this statistic can be used to identify “outcross” bulls that are lowly related to the breed. Since 2005, USDA genetic evaluations have been adjusted for differences between the inbreed-ing of actual milk-recorded daughters and that of ex-pected future mates, which can occur if a bull’s original mates are not a random sample of the breed. Genomic measures of inbreeding, such as percent heterozygosity

10246 WEIGEL ET AL.
Journal of Dairy Science Vol. 100 No. 12, 2017
or runs of homozygosity, can provide more precise mea-sures of similarity at the genome level. Genome-based predictions of the inbreeding of hypothetical calves from a given cow and her prospective mates can facili-tate mate allocation decisions, and genomic data can provide new insights into the genetic basis of inherited defects and inbreeding depression (VanRaden et al., 2011). Assessment of breed composition using genomic data is now routine, but effective methods for utilizing genomic data in crossbreeding systems are lacking. Loss of within-breed genetic diversity remains a concern, and stewards of the breeds should monitor the balance between rapid genetic progress and maintenance of di-versity. There is no reason for a single Holstein bull to sire >3,000 progeny-tested sons that dominate the bull barns of AI studs on every continent, yet this has hap-pened in practice. And although methods for constrain-ing the rate of change in additive genetic relationships over time are available, based on optimal contribution theory (Meuwissen, 1997), these methods are not used widely in practice. Implementation of farm, region, or production system-specific EBV and selection indices would effectively address the issues of inbreeding and genetic diversity, while also capturing the benefits of G×E associated with local adaptation.
Phenotype Prediction and Management Diagnostics
Animal breeders have focused, almost obsessively, on expected performance of the offspring of selection candidates in the next generation. Performance of ani-mals in the current generation is often an afterthought. They also have a tendency to eliminate, via data ed-iting, exceptions that seem to arise from nongenetic causes. For example, cows that calve with twins are usually removed from dystocia and stillbirth analyses, cows that die in early lactation (before the first DHIA test) are removed from milk yield evaluations, and cows that are culled before the end of the opportunity period for a given disease may be discarded from health trait analyses. However, farmers must manage their busi-nesses based on the income and expenses of all animals in the current generation, including those that animal breeders would consider as exceptions. Equations for predicting future phenotypes, such as estimated rela-tive producing ability (ERPA) or most probable pro-ducing ability (MPPA), can be computed easily from a cow’s EBV and corresponding estimates of permanent environmental effects and other relevant explanatory variables. Predicted future phenotypes can incorpo-rate nonadditive genetic effects, which are ignored in pedigree-based or genomic applications of BLUP, and this could become particularly informative regarding specific mutations and their mode of action. Values of
MPPA, ERPA, and similar metrics have been provided to farmers for decades in reports from dairy records processing centers, but this information is rarely used when making culling and management decisions.
Now that genomic testing is widespread, with tens of thousands of calves tested each month, the utility of predicted future phenotypes has increased dramati-cally. Well-managed herds with modern facilities have excess heifer calves relative to the number of replace-ments needed to maintain herd size, and feed, labor, and housing costs associated with rearing a heifer until first calving often exceed the animal’s market value. Culling inferior heifer calves based on predicted future phenotypes, perhaps by repurposing them for beef production, is a common and economically sensible practice (Weigel et al., 2012). Culling decisions can be carried out using EBV, but genetic predisposition is an incomplete predictor of the future phenotype of a calf with significant lung damage due to respiratory disease, for example. Predicted phenotypes form the basis of genome-guided dairy herd management—the bovine equivalent of personalized medicine—as described by Weigel et al. (2017) when predicting hyperketonemia phenotypes of early postpartum Holstein cows.
An overlooked application of predicted phenotypes is the opportunity to use genomic data for evaluation or benchmarking of herd management practices. Ge-nomic testing can describe the genetic predisposition of the calves, heifers, or cows on a given farm, and this information can be used to quantify the extent to which the farm’s housing, heat abatement, forage quality, ration formulation, breeding program, health protocols, and other management practices allow these animals to fully express their genetic superiority. For example, one might use genomic predictions for early postpartum health disorders (Vukasinovic et al., 2017) to assess a herd’s transition cow management, or one might regress daily milk weights of mid-lactation cows on genomic predictions for milk yield to assess a herd’s nutrition program.
SUMMARY
Over the past 100 years, genetic selection programs evolved from an infancy of pedigree recording, perfor-mance recording, and daughter–dam comparisons, to an adulthood of animal model BLUP, whole-genome prediction, nonlinear models, and machine learning al-gorithms. Grosu et al. (2014) provided a comprehensive review of these developments and their effect on dairy cattle improvement programs worldwide, whereas this review focuses primarily on the United States. Every scientific advancement by a dairy cattle breeder in the past century was built upon the shoulders of his or

Journal of Dairy Science Vol. 100 No. 12, 2017
100-YEAR REVIEW: METHODS AND IMPACT OF GENETIC SELECTION 10247
her predecessors, and collaborations with colleagues in genetics, statistics, and computer science have yielded remarkable returns. Furthermore, virtually every sci-entific advancement by a dairy cattle breeder in the past century was developed to solve a practical problem that affected dairy farmers, address a potential threat that could harm dairy farmers, or capitalize on an op-portunity that might benefit dairy farmers. This was precisely the goal of legislators who conceived the idea of the land-grant university system and a network of federal agricultural research institutes, as well as the expectation of taxpayers who were asked to fund these endeavors. The discoveries of the next 100 years cannot be imagined at present, but we can hope that similar successes will be achieved in producing research results that will lead to healthy animals, vibrant farms, sat-isfied consumers, and a sustainable food production system.
ACKNOWLEDGMENTS
The authors thank Suzanne Hubbard (Animal Ge-nomics and Improvement Laboratory, USDA-ARS, Beltsville, MD) for her assistance in reviewing the manuscript. Data visualization was aided by Daniel’s XL Toolbox add-in for Excel (version 7.2.10; www .xltoolbox .net) by Daniel Kraus (Würzburg, Germany).
REFERENCES
Ali, T. E., and L. R. Schaeffer. 1987. Accounting for covariances among test day milk yields in dairy cows. Can. J. Anim. Sci. 67:637–644.
Allen, N. 1944. A standard for evaluation of dairy sires proved in Dairy Herd Improvement Associations. J. Dairy Sci. 27:835–847.
Bar-Anan, R., and J. M. Sacks. 1974. Sire evaluation and estimation of genetic gain in Israeli dairy herds. Anim. Prod. 18:59–66.
Beavis, W. D. 1998. QTL analysis: Power, precision, and accuracy. Pages 145–162 in Molecular Dissection of Complex Traits. A. H. Paterson, ed. CRC Press, New York, NY.
Bonnier, G. 1936. Progeny tests of dairy sires. Hereditas 22:145–166.Cassell, B. G., S. M. Smith, and R. E. Pearson. 1993. Influence of
herd-life opportunity and characteristics of cows and herds on dif-ferent net income functions. J. Dairy Sci. 76:1182–1190.
Cunningham, E. P. 1965. The evaluation of sires from progeny test data. Anim. Sci. 7:231.
Davidson, F. A. 1925. Measuring the breeding value of dairy sires by the records of their first few advanced registry daughters. Illinois Agric. Expt. Stat. Bull. 270:545–566.
de Los Campos, G., J. M. Hickey, R. Pong-Wong, H. D. Daetwyler, and M. P. L. Calus. 2013. Whole genome regression and prediction methods applied to plant and animal breeding. Genetics 193:327–345.
Dekkers, J. C. 2004. Commercial application of marker- and gene-assisted selection in livestock: Strategies and lessons. J. Anim. Sci. 82(E-Suppl.):E313–E328.
Dempfle, L. 1976. A note on the properties of the cumulative differ-ence method for sire evaluation. Anim. Prod. 23:121–124.
Dickinson, F. N., H. D. Norman, R. L. Powell, L. G. Waite, B. T. McDaniel, and US Department of Agriculture. 1976. Procedures used to calculate the USDA-DHIA Modified Contemporary Com-parison. USDA-ARS Prod. Res. Reprod. 165:18–34.
Ducrocq, V., R. L. Quaas, E. J. Pollak, and G. Casella. 1988. Length of productive life of dairy cows. 1. Justification of a Weibull model. J. Dairy Sci. 71:3061–3070.
Edwards, J. 1932. The progeny test as a method of evaluating the dairy sire. J. Agric. Sci. 22:811–837.
Ehret, A., D. Hochstuhl, D. Gianola, and G. Thaller. 2015. Applica-tion of neural networks with back-propagation to genome-enabled prediction of complex traits in Holstein-Friesian and German Fleckvieh cattle. Genet. Sel. Evol. 47:22–31.
Erbe, M., B. J. Hayes, L. K. Matukumali, S. Goswami, P. J. Bowman, C. M. Reich, B. A. Mason, and M. E. Goddard. 2012. Improving accuracy of genomic predictions within and between dairy cattle breeds with imputed high-density single nucleotide polymorphism panels. J. Dairy Sci. 95:4114–4129.
Fisher, R. A. 1918. The correlation between relatives on the supposi-tion of Mendelian inheritance. Trans. R. Soc. Edinb. 52:399–433.
Fisher, R. A. 1930. The Genetical Theory of Natural Selection. Clar-endon Press, Oxford, UK.
Garner, J. B., M. L. Douglas, S. R. O. Williams, W. J. Wales, L. C. Marett, T. T. T. Nguyen, C. M. Reich, and B. J. Hayes. 2016. Ge-nomic selection improves heat tolerance in dairy cattle. Sci. Rep. 6:34114. https:// doi .org/ 10 .1038/ srep34114.
Gianola, D., and J. L. Foulley. 1983. Sire evaluation for ordered cat-egorical data with a threshold model. Genet. Sel. Evol. 15:201–224.
González-Recio, O., K. A. Weigel, D. Gianola, H. Naya, and G. J. M. Rosa. 2010. L2-boosting algorithm applied to high-dimensional problems in genomic selection. Genet. Res. (Camb.) 92:227–237.
Goodale, H. D. 1927. A sire breeding index with special reference to milk production. Am. Nat. 61:539–544.
Gowen, J. W. 1930. On criteria for breeding capacity in dairy cattle. J. Anim. Sci. 1:47–49.
Graves, R. R. 1925. Improving dairy cattle by the continuous use of the proved sire. J. Dairy Sci. 5:391–404.
Grosu, H., L. R. Schaeffer, P. A. Oltenacu, H. D. Norman, R. L. Pow-ell, V. Kremer, R. Mrode, J. Carvalheira, J. Jamrozik, C. Draga-nescu, and S. Lungu. 2014. History of Genetic Evaluation Methods in Dairy Cattle. The Publishing House of the Romanian Academy, Bucharest, Romania.
Habier, D., R. Fernando, K. Kizilkaya, and D. Garrick. 2011. Exten-sion of the Bayesian alphabet for genomic selection. BMC Bioin-formatics 12:186–197.
Habier, D., R. L. Fernando, and J. C. M. Dekkers. 2009. Genomic selection using low-density marker panels. Genetics 182:343–353.
Haldane, J. B. S. 1932. A mathematical theory of natural and artificial selection, Part IX. Proc. Camb. Philos. Soc. 28:244–248.
Harris, B., and D. Johnson. 1998. Approximate reliability of genetic evaluations under an animal model. J. Dairy Sci. 81:2723–2728.
Harvey, W. R., and J. L. Lush. 1952. Genetic correlation between type and production in Jersey cattle. J. Dairy Sci. 35:199–213.
Harville, D. A. 1977. Maximum likelihood approaches to variance com-ponent estimation and to related problems. J. Am. Stat. Assoc. 72:320–338.
Hazel, L. N. 1943. The genetic basis for constructing selection indexes. Genetics 28:476–490.
Hazel, L. N., and J. L. Lush. 1942. The efficiency of three methods of selection. J. Hered. 33:393–399.
Henderson, C. R. 1952. Specific and general combining ability. Page 352 in Heterosis. J. W. Gowen, ed. Hafner Publishing, New York, NY.
Henderson, C. R. 1953. Estimation of variance and covariance compo-nents. Biometrics 9:226–252.
Henderson, C. R. 1956. Cornell research on methods of selecting dairy sires. Proc. N.Z. Soc. Anim. Prod. 16:69–76.
Henderson, C. R. 1963. Selection index and expected genetic advance. Page 141 in Statistical Genetics and Plant Breeding. Natl. Res. Counc. Publ. 982, Natl. Acad. Press, Washington, DC.
Henderson, C. R. 1975. Inverse of a matrix of relationships due to sires and maternal grandsires. J. Dairy Sci. 58:1917–1921.
Henderson, C. R. 1976. A simple method for computing the inverse of a numerator relationship matrix used for prediction of breeding values. Biometrics 32:69–83.

10248 WEIGEL ET AL.
Journal of Dairy Science Vol. 100 No. 12, 2017
Henderson, C. R., Jr. 1982. Analysis of covariance in the mixed model: Higher-level, nonhomogeneous, and random regressions. Biomet-rics 38:623–640.
Henderson, C. R., H. W. Carter, and J. T. Godfrey. 1954. Use of the contemporary herd average in appraising progeny tests of dairy bulls. J. Anim. Sci. 13:949–959.
Jamrozik, J., L. R. Schaeffer, and J. C. M. Dekkers. 1997. Genetic evaluation of dairy cattle using test day yields and random regres-sion model. J. Dairy Sci. 80:1217–1226.
Kirkpatrick, M., D. Lofsvold, and M. Bulmer. 1990. Analysis of the inheritance, selection and evolution of growth trajectories. Genet-ics 124:979–993.
Lande, R., and R. Thompson. 1990. Efficiency of marker-assisted selection in the improvement of quantitative traits. Genetics 124:743–756.
Legarra, A., I. Aguilar, and I. Misztal. 2009. A relationship matrix including full pedigree and genomic information. J. Dairy Sci. 92:4656–4663.
Legarra, A., O. F. Christensen, I. Aguilar, and I. Misztal. 2014. Sin-gle step, a general approach for genomic selection. Livest. Sci. 166:54–65.
Long, N., D. Gianola, G. J. M. Rosa, K. A. Weigel, and S. Avendaño. 2007. Machine learning procedure for selecting single nucleotide polymorphisms in genomic selection: Application to early mortal-ity in broilers. J. Anim. Breed. Genet. 124:377–389.
Lush, J. L. 1931. The number of daughters necessary to prove a sire. J. Dairy Sci. 14:209–220.
Lush, J. L. 1933. The bull index problem in the light of modern genet-ics. J. Dairy Sci. 16:501–522.
Lush, J. L. 1944. The optimum emphasis on dams’ records when prov-ing dairy sires. J. Dairy Sci. 27:937–951.
Lush, J. L., H. Norton, and F. Arnold. 1941. Effects which selection of dams may have on sire indexes. J. Dairy Sci. 24:695–721.
Matukumalli, L. K., C. T. Lawley, R. D. Schnabel, J. F. Taylor, M. F. Allan, M. P. Heaton, J. O’Connell, S. S. Moore, T. P. L. Smith, T. S. Sonstegard, and C. P. Van Tassell. 2009. Development and characterization of a high density SNP genotyping assay for cattle. PLoS One 4:e5350. https:// doi .org/ 10 .1371/ journal .pone .0005350.
McDaniel, B. T., H. D. Norman, and F. N. Dickinson. 1974. Variation in genetic merit of sires of herdmates of first lactation cows. J. Dairy Sci. 57:1234–1244.
Meuwissen, T. H. E. 1997. Maximizing the response of selection with a predefined rate of inbreeding. J. Anim. Sci. 75:934–940.
Meuwissen, T. H. E., B. J. Hayes, and M. E. Goddard. 2001. Predic-tion of total genetic value using genome-wide dense marker maps. Genetics 157:1819–1829.
Misztal, I., A. Legarra, and I. Aguilar. 2009. Computing procedures for genetic evaluation including phenotypic, full pedigree, and ge-nomic information. J. Dairy Sci. 92:4648–4655.
Nejati-Javaremi, A., C. Smith, and J. P. Gibson. 1997. Effect of total allelic relationship on accuracy of evaluation and response to selec-tion. J. Anim. Sci. 75:1738–1745.
Norman, H. D., B. T. McDaniel, and F. N. Dickinson. 1972. Regres-sion of daughter and herdmate milk yield on genetic value of the herdmates’ sires. J. Dairy Sci. 55:1735–1740.
Norman, H. D., R. L. Powell, and F. N. Dickinson. 1976. Modified con-temporary and herdmate comparisons in sire summary. J. Dairy Sci. 59:2155–2161.
Norman, H. D., R. L. Powell, and J. R. Wright. 1987. Influence of genetic differences in merit of mates on sire evaluation. J. Dairy Sci. 70:141–157.
Okut, H., D. Gianola, G. J. M. Rosa, and K. A. Weigel. 2011. Predic-tion of body mass index in mice using dense molecular markers and a regularized neural network. Genet. Res. (Camb.) 93:189–201.
Plowman, R. D., and B. T. McDaniel. 1968. Changes in USDA sire summary procedures. J. Dairy Sci. 51:306–311.
Pollak, E. J., J. Van der Werf, and R. L. Quaas. 1984. Selection bias and multiple trait evaluation. J. Dairy Sci. 67:1590–1595.
Powell, R. L., and H. D. Norman. 2006. Major advances in genetic evaluation techniques. J. Dairy Sci. 89:1337–1348.
Powell, R. L., H. D. Norman, and F. N. Dickinson. 1975. Analysis of the USDA-DHIA Preliminary Sire Summary. J. Dairy Sci. 58:551–557.
Quaas, R. L., R. W. Everett, and A. C. McClintock. 1979. Maternal grandsire model for dairy sire evaluation. J. Dairy Sci. 62:1648–1654.
Ravagnolo, O., I. Misztal, and G. Hoogenboom. 2000. Genetic com-ponent of heat stress in dairy cattle. J. Dairy Sci. 83:2120–2125.
Robertson, A., and J. M. Rendel. 1954. The performance of heifers got by A.I. J. Agric. Sci. 44:184–192.
Robertson, A., A. Stewart, and E. D. Ashton. 1956. The progeny as-sessment of dairy sires for milk: The use of contemporary compari-sons. Proc. Br. Soc. Anim. Prod. 1956:43–50.
Rothschild, M. F., and S. Newman. 2002. Dairy cattle test day mod-els: A case study. Pages 233–246 in Intellectual Property Rights in Animal Breeding and Genetics. CABI Press, Wallingford, UK.
Schaeffer, L. R. 1994. Multiple-country comparison of dairy sires. J. Dairy Sci. 77:2671–2678.
Searle, S. R. 1964. Review of sire-proving methods in New Zealand, Great Britain, and New York State. J. Dairy Sci. 17:402–413.
Strandberg, E., S. Brotherston, E. Wall, and M. P. Coffey. 2009. Geno-type by environment interaction for first-lactation female fertility traits in UK dairy cattle. J. Dairy Sci. 92:3437–3446.
Sullivan, P. G., and P. M. VanRaden. 2009. Development of genomic GMACE. Pages 157–161 in Proc. 2009 Interbull Mtg., Barcelona, Spain. Interbull Bull. 40. Interbull Centre, Uppsala, Sweden.
Thompson, R. 1976. Relationship between the cumulative difference and best linear unbiased predictor methods of evaluating bulls. Anim. Prod. 23:15–24.
Tier, B. 1990. Computing inbreeding coefficients quickly. Genet. Sel. Evol. 22:419–430.
Ufford, G. R., C. R. Henderson, and L. D. Van Vleck. 1979. Comput-ing algorithms for sire evaluation with all lactation records and natural service sires. J. Dairy Sci. 62:511–513.
VanRaden, P. M. 2008. Efficient methods to compute genomic predic-tions. J. Dairy Sci. 91:4414–4423.
VanRaden, P. M., and E. J. H. Klaaskate. 1993. Genetic evaluation of length of productive life including predicted longevity of live cows. J. Dairy Sci. 76:2758–2764.
VanRaden, P. M., and R. H. Miller. 2008. The USDA Animal Im-provement Programs Laboratory: A century old and just getting started. AIPL Research Report HIST1, October 2008. Animal Im-provement Programs Laboratory, Beltsville, MD.
VanRaden, P. M., K. M. Olson, D. J. Null, and J. L. Hutchison. 2011. Harmful recessive effects on fertility detected by the absence of homozygous haplotypes. J. Dairy Sci. 94:6153–6161.
VanRaden, P. M., C. P. Van Tassell, G. R. Wiggans, T. S. Sonstegard, R. D. Schnabel, J. F. Taylor, and F. S. Schenkel. 2009. Invited review: reliability of genomic predictions for North American Hol-stein bulls. J. Dairy Sci. 92:16–24.
VanRaden, P. M., and G. R. Wiggans. 1991. Derivation, calcula-tion, and use of national animal model information. J. Dairy Sci. 74:2737–2746.
Vukasinovic, N., N. Bacciu, C. Przybyla, P. Boddhireddy, and S. De-Nise. 2017. Development of genetic and genomic evaluation for wellness traits in U.S. Holstein cows. J. Dairy Sci. 100:428–438.
Weigel, K. A., P. C. Hoffman, W. Herring, and T. J. Lawlor Jr.. 2012. Potential gains in lifetime net merit from genomic testing of cows, heifers, and calves on commercial dairy farms. J. Dairy Sci. 95:2215–2225.
Weigel, K. A., T. Kriegl, and A. L. Pohlman. 1999. Genetic analysis of dairy cattle production traits in a management intensive rotational grazing environment. J. Dairy Sci. 82:191–195.
Weigel, K. A., R. S. Pralle, H. Adams, K. Cho, C. Do, and H. M. White. 2017. Prediction of whole genome risk for selection and management of hyperketonemia in Holstein dairy cattle. J. Anim. Breed. Genet. 134:275–285. https:// doi .org/ 10 .1111/ jbg .12259.
Weigel, K. A., C. P. Van Tassell, J. R. O’Connell, P. M. VanRaden, and G. R. Wiggans. 2010. Prediction of unobserved single nu-cleotide polymorphism genotypes of Jersey cattle using reference

Journal of Dairy Science Vol. 100 No. 12, 2017
100-YEAR REVIEW: METHODS AND IMPACT OF GENETIC SELECTION 10249
panels and population-based imputation algorithms. J. Dairy Sci. 93:2229–2238.
Westell, R. A., R. L. Quaas, and L. D. Van Vleck. 1988. Genetic groups in an animal model. J. Dairy Sci. 71:1310–1318.
Wiggans, G. R., J. B. Cole, S. M. Hubbard, and T. S. Sonstegard. 2017. Genomic selection in dairy cattle: The USDA experience. Annu. Rev. Anim. Biosci. 5:309–327.
Wiggans, G. R., and P. M. VanRaden. 1989. USDA-DHIA animal model for genetic evaluations. Natl. Coop. Dairy Herd Improve-ment Program Handbook, Fact Sheet H-2, Washington, DC.
Wright, S. 1932. On the evaluation of dairy sires. J. Anim. Sci. 1932:71–78.
Yao, C., D. Spurlock, K. A. Weigel, L. E. Armentano, and M. Vande-Haar. 2013. Random forests approach for identifying additive and epistatic SNPs associated with residual feed intake in dairy cattle. J. Dairy Sci. 96:6716–6729.
Yapp, W. W. 1925. Transmitting ability of dairy sires. J. Anim. Sci. 1:90–92.
Continued
APPENDIX
Table A1. Timeline of important discoveries and developments in genetic selection
Date Milestone Reference
1868–1917 Growth of pedigree data in herdbooks established by breed societies. VanRaden and Miller, 2008
1905–1917 Expansion of milk recording programs that originated in Michigan. VanRaden and Miller, 2008
1915–1917 USDA begins evaluating dairy bulls by daughter–dam comparison method first proposed in Denmark.
VanRaden and Miller, 2008
1918–1931 R. A. Fisher and J. B. S. Haldane lay the foundations of population and quantitative genetics.
Fisher, 1918; Haldane, 1932
1920s Local bull associations are formed with assistance of USDA Division of Dairy Herd Improvement investigations.
VanRaden and Miller, 2008
1931–1941 S. Wright and J. L. Lush develop the science of animal breeding and statistical methods for sire evaluation.
Lush, 1931; Wright, 1932
1934–1942 L. N. Hazel and J. L. Lush introduce the selection index method for estimating breeding values of dairy sires.
Hazel and Lush, 1942
1940s Artificial insemination (AI) is adopted and regional AI cooperatives are formed.
VanRaden and Miller, 2008
1954–1956 A. Robertson, J. M. Rendel, and C. R. Henderson propose a herdmate comparison, which is soon implemented by Cornell University for sire evaluations.
Henderson et al., 1954; Robertson and Rendel, 1954; Searle, 1964
1961 USDA adopts herdmate comparison for routine genetic evaluation of dairy sires.
VanRaden and Miller, 2008
1964 Publication of high-index (elite) cow lists to facilitate selection of bull dams.
Powell and Norman, 2006
1970s Polish breeding trial by Food and Agriculture Organization of the United Nations stimulates international semen trade.
Grosu et al., 2014

10250 WEIGEL ET AL.
Journal of Dairy Science Vol. 100 No. 12, 2017
Table A1 (Continued). Timeline of important discoveries and developments in genetic selection
Date Milestone Reference
1972 USDA Animal Improvement Programs laboratory formed. Cornell implements BLUP sire model for prediction.
Grosu et al., 2014
1974 USDA introduces the modified contemporary comparison model to compute predicted differences for males and cow indexes for females.
Norman et al., 1976
1976 C. R. Henderson develops a rapid method to construct the inverse of the additive genetic relationship matrix.
Henderson, 1976
1977 D. A. Harville proposes maximum likelihood estimation of variance components.
Harville, 1977
1987–1997 L. R. Schaeffer and colleagues propose random regression for implementation of test-day models.
Ali and Schaeffer, 1987
1989 USDA implements an animal model for computing predicted transmitting abilities of dairy cattle.
Wiggans and VanRaden, 1989
1995 International Bull Evaluation Service provides multiple-trait across-country evaluation of dairy sires.
Schaeffer, 1994
2001 T. H. E. Meuwissen, B. Hayes, and M. E. Goddard propose whole-genome selection with dense molecular markers.
Nejati-Javaremi et al., 1997; Meuwissen et al., 2001
2009 Sequencing of the bovine genome is completed and routine whole-genomic selection is implemented by USDA.
VanRaden, 2008; Matukumalli et al., 2009
2008–2017 D. Gianola and colleagues apply machine learning algorithms to genomic prediction of livestock.
Long et al., 2007; González-Recio et al., 2010
2009–2014 A. Legarra, I. Misztal, and I. Aguilar develop single-step genomic BLUP. Legarra et al., 2009, 2014; Misztal et al., 2009