a [3?n - aei.pitt.eduaei.pitt.edu/88428/1/1982.3.pdf(iii) an approximate 3--4 million tonne decrease...
TRANSCRIPT
I a
[3?n eurostat
I
i
STATISTISCHES TELEGRAMM
STATISTICAL TELEGRAM
TELEGRAMME STATISTIQUE
STATISTICAL ASPECTS OF THE PETROLEUM ECONOMY IN 1981
MAIN TRE~DS
Provisional data for 1981 shows that petroleum consumption for the Community of Ten, as measured by inland deliveries of petroleum products (excluding ship bunkers) declined by about 39 million tonnes to 418 million tonnes - a fall of 8.6% compared to 1980 and over 100 mill ion tonnes less than the parallel figure for 1973.
The Community's supply of petroleum in 1981 was met by increased production {+ 11.5 million tonnes), a 16.6 million tonne stock drawdown and hence a 358 million tonne net import requirement.
The Community's net imports of petroleum were therefore 80 million tonnes less than in 1980.
ANALYSIS OF CONSUMPTION
Total energy consumption in the Community of Ten declined by 3.9% in 1981, the main reason for this being due to the 8.6% decline in petroleum consumption. Every Community country recorded reduced deliveries of petroleum products in 1981, although the rates of decrease ranged from 14.4% in Denmark to 3.9% in Italy. Reduced inland deliveries of 12.1 %, 10.3%, and 7 .6% were recorded for France, the FR Germany and the United Kingdom respectively.
Among the main products, the Community's consumption of motor spirit declined 2.2% the first fall on record, kerosene and jet fuel deliveries were down 6.3% - the second successive year of reduced demand for this product with the 1981 total being marginally less than that registered in 1975. For gas diesel oil deliveries t otalled 148 million tonnes in 1981 , 7.6% less than 1980 and 29 million tonnes less than the peak year of 1979. The largest fall in demand, however, concerned residual fuel-oil - at 108 million tonnes in 1981, deliveries were therefore about 18% less than in 1980 and 38.3% or 67 million tonnes less than the peak year of 1973. The share of these products in total inland deliveries in 1981 gives motor spirit 19.8% (compared to 18.5% in 1980) kerosene and jet fuels 4.1 % (4.0% in 1980), gas diesel oil 35.4% (35% in 1980) and residual fuel oil 25.8% (28.7% in 1980), evidence of a continuing trend towards a 'whiter' Community barrel.
Several different variables are needed to explain this large fall in demand. A more rational and economic use of petroleum products linked with high prices, the continuing economic recession, substitution of petroleum products by other fuels (e.g. in power stations) and evidence of destocking on the part of consumers.
Disaggregating this fall in demand of 39 million tonnes into sectors results in the following pre-liminary conclusions :
(i) The Community consumed 44 million tonnes of petroleum products (almost all residual fuel oil) for the production of electrical energy in public power stations. This was 10 million tonnes less than in 1980.
(ii) Consumption in the transport sector is about 1-1.5% less than in 1980 - a fall of about 1.5 million tonnes.
(iii) An approximate 3--4 million tonne decrease in the non-energy use of petroleum products (pe-trochemical feedstocks, lubricants, bitumen, petroleum coke etc ..... ).
(iv) The se calculations therefore y ield that inland deliveries of petroleum products to the industrial, household and tertiary sectors for energy use were about 24 million tonnes less than in 1980.
EUROSTAT L - 2920 LUXEMBOURG, TEL 43011
31.3.1982
ENERGIESTATISTIK
ENERGY STATISTICS
STATISTIQUES DE L'ENERGIE
ANNUEL
1982
-
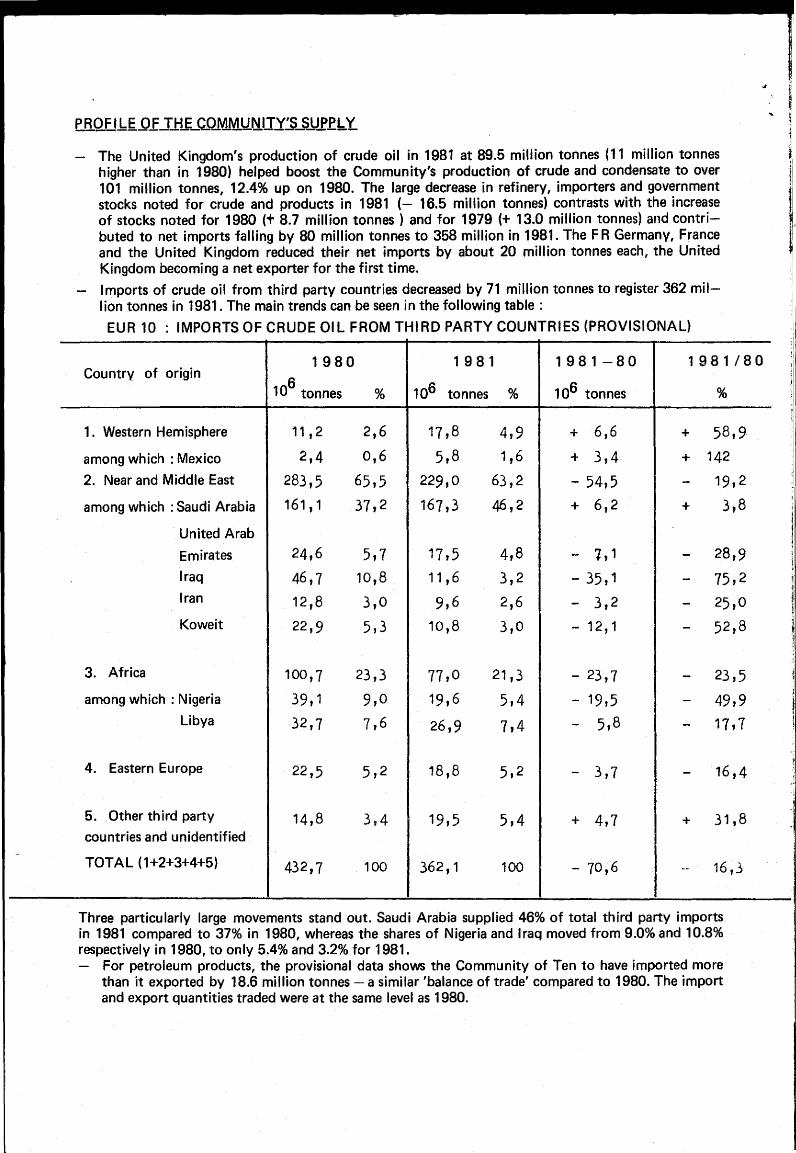
PROFILE OF THE COMMlJf'!IJY:S SUPPLY
The United Kingdom's production of crude oil in 1981 at 89.5 million tonnes (11 million tonnes higher than in 1980) helped boost the Community's production of crude and condensate to over 101 million tonnes, 12.4% up on 1980. The large decrease in refinery, importers and government stocks noted for crude and products in 1981 (- 16.5 million tonnes) contrasts with the increase of stocks noted for 1980 (+ 8.7 million tonnes } and for 1979 (+ 13.0 million tonnes) and contributed to net imports falling by 80 million tonnes to 358 million in 1981. The FR Germany, France and the United Kingdom reduced their net imports by about 20 million tonnes each, the United Kingdom becoming a net exporter for the first time.
Imports of crude oil from third party countries decreased by 71 million tonnes to register 362 million tonnes in 1981 The main trends can be seen in the following table ·
EUR 10 : IMPORTS OF CRUDE OIL FROM THIRD PARTY COUNTRIES (PROVISIONAL)
1980 1 9 8 1 1981-80 1981/80 Country of origin
6 10 tonnes % 106 tonnes % 106 tonnes %
1. Western Hemisphere 11, 2 2,6 17 ,8 4,9 + 6,6 + 58,9
among which : Mexico 2,4 0,6 5,8 1,6 + 3,4 + 142 2. Near and Middle East 283,5 65,5 229,0 63,2 - 54,5 - 19,2
among which : Saudi Arabia 161,1 37,2 167,3 46,2 + 6,2 + 3,8
United Arab
Emirates 24,6 5,7 17,5 4,8 - 'l, 1 - 28,9 Iraq 46,7 10,8 11 , 6 3,2 - 35, 1 - 75,2 Iran 12,8 3,0 9,6 2,6 - 3,2 - 25,0 Koweit 22,9 5,3 10,8 3,0 - 12, 1 - 52,8
3. Africa 100,7 23,3 77 ,o 21,3 - 23,7 - 23,5 among which : Nigeria 39, 1 9,0 19,6 5,4 - 19,5 - 49,9
Libya 32,7 7,6 26,9 7,4 - 5,8 - 17,7
4. Eastern Europe 22,5 5,2 18,8 5,2 - 3,7 - 16,4
5. Other third party 14,8 3,4 19,5 5,4 + 4,7 + 31,8 countries and unidentified
TOTAL (1+2+3+4+5} 432,7 100 362, 1 100 - 70,6 -- 16,3
Three particularly large movements stand out. Saudi Arabia supplied 46% of total third party imports in 1981 compared to 37% in 1980, whereas the shares of Nigeria and Iraq moved from 9.0% and 10.8% respectively in 1980, to only 5.4% and 3.2% for 1981. - For petroleum products, the provisional data shows the Community of Ten to have imported more
than it exported by 18.6 million tonnes - a similar 'balance of trade' compared to 1980. The import and export quantities traded were at the same level as 1980.
'
\ I
f
:
!
. I
,·
l
.,
!
!

ANLAGE
MINERALOL
Vorliufige Angaben 1981
ANNEX
PETROLEUM
Provisional data 1981
ANNEXE
PETROLE
Oonn6es provisoires 1981
----,-l--EU_R_1_0_..,..I __ EU_R_9_ ..... l _o_e_J_rR-SC_H __ .....,1r-F-R·A-~-C-E ~-.-TA-L-IA-,-N-E_O_E~·L-A-N~0-8
E_L_G-,a-~~U-X_E_M-----u-N,-T-ED-~--.-RE-L~-N-D-...D_A_N_M_A,-R-~~E-LL-AS-
------·- -------'-· ----'·'----L_A __ N_o _____ .....__ ____ --- -·-BE-LG_, E e_o_u_RG_....__K_1_No_o_o_M__, ____ -'------l.---·-
Roholforderung (1) Crude oil production ( 1 ) Production de petrole brut ( 1 )
1979 87 234 87 234 4 774 1196 l 714 1 581 - - 77 537 - 432 -1980 88 146 86 146 4 613 1 415 1 825 l 568 - - 78 427 - 298 -1981 99 695 99 499 4 459 l 712 1 480 1 600 - - 89 490 - 758 196
Roholverarbeitung in den Raffinerien Refinery throughput Petrole brut traite dans les raffineries
1979 576 147 560 722 114 119 127 642 116 281 60 489 33 883 - 97 248 2 313 8 747 15 425 198o 512 703 498 435 110 772 113 919 96 519 50 637 33 523 - 84 388 2 028 6 649 14 268 1981 454 615 438 681 96 179 97 600 92 729 40 100 29 257 - 75 850 737 6 229 15 934
1981/SO - 11,3% - 12,o~ -13,~ - 14, JI, - 3,9% - 20,8% - 12,7% - - 10,1% - 63,7% - 6,3% + 11, 7%
Gesamti nlandsl ieferungen Total inland deliveries Livraisons interieures
von Mineralolprodukten of petroleum products totales de produits petroliers
1979 499 184 488 358 134 900 105 188 89 483 27 947 23 512 1 293 84 556 6 105 15 374 10 826 1980 457 18o 446 127 120 636 99 045 88 682 25 825 21181 l 075 71 177 5 549 12 957 11 053 1981 417 729 407 488 108 200 87 058 85 230 24 OOO 20 100 1 032 65 756 5 027 11 085 10 241
1981/80 - 8,6% - 8, 7f, - l0,3% - 12,1% - 3,9% - 7,1% - 5,1% - 4,0~ - 7,6% - 9,4% - 14,4% - 7,3%
darunter : among which : don1.
Motorenbenzin Motor spirit Essences moteur
1979 83 792 82 409 23 761 17 ''35 12 128 3 986 3 137 279 18 729 981 1 673 1 383 1980 84 579 83 198 24 178 17 799 12 280 3 961 2 952 286 19 185 1 019 l 538 1 381 1981 82 721 81 255 22 850 18 180 12 164 3 700 2 840 310 18 747 1 022 1 442 l 466
1981/ao - 2,2% - 2,3% - 5,5% + 2,1% - 0,9% - 6,6% - 3,8% + 8,4% - 2,3% + 0,3% - 6,2% + 6,2%
Dieselkraftstoffe und Oestillatheizole Gas diesel oil Gasoil et fuel--oil fluide
1979 177 208 174 092 63 975 41 073 24 472 6 314 9 818 573 19 861 1 353 6 653 3 116 1980 159 908 156 645 54 745 38 888 23 670 5 920 8 424 528 17 625 1 258 5 587 3 263 1981 147 828 144 851 50 100 33 955 23 450 5 6oo 8 360 495 16 716 1 261 4 914 2 977
1981/ao - 7,6'1, - 7,5% - 8,5% - 12,1% - 0,9% - 5,4% - o,8% - 6,2% - 5,2% + o,2% - 12,0% - 8,8%
Ruckstandsheizole Residual fuel-oil Fuel-oil residue!
1979 146 627 141 984 22 679 28 984 40 586 6 744 6 879 313 27 487 2 881 5 431 4 643 198o 131 119 126 341 20 462 25 665 40 320 7 052 6 568 131 19 157 2 569 4 417 4 778 1981 107 712 103 597 15 945 18 926 35 330 6 200 6 100 100 15 476 2 097 3 423 4 115
1981/80 - 17,9% - 18,0% - 22,1% - 26,"3'!, - 12,4i - 12,1% - 7,1% - 2~, 7% - 19,2% - 18,4~ - 22,5% - 13,9%
(1) einschliesslich Kondensate (1) including condensates (1) y compris condensats fur Oestillation for distillation pour distillation

v'IINERALOL
AUSSENHANDEL
Vorliiufige Angaben 1981
__l EUR10 ___ EUR9
1. Gesamt-Roholeinfuhr (1)
1979 ?35 279l !518 108l 1980 462 990 445 282 1981 (394 511 376 016
1981/80 - 14,8% - 15,6%
darunter (2) : ·
Einfuhr aus Drittli:indern
1979 507 819 490 648 1980 432 805 415 168 1981 362 158 343 663
1981/80 - 16,3% - 17,2%
2. Gesamt·-Roholausfuhr
1979 ( 42 222) ( 40 750l 1980 f 43 444~ f 40 270 1981 55 361 53 071
1981/Bo + 27,4% + 31,8%
3. Gesamteinfuhr von
Mineralolprodukten
1979 (118 100) (113 515) 1980 (133 151) (127 175) 1981 (132 727) (129 175)
1981/80 - o, 3°fo + 1,6%
4 .. Gesamtausfuhr von
Mineralolprodukten
1979 (123 913) (116 620) 1980 (114 694) (107 380) 1981 (114 076) (106 380)
1981/80 - 0,5% - 0,9%
NETTO EINFUHREN VON
MINERALOL UNO -PRODUKTEN
("" 1 + 3 - 2 - 4)
1979 198o 1981
1981/80
487 244 438 003 357 8ol
- 18,~
(1) einschliesslich Feenstocks fur Destillation
l auf11rund von Mon,1tszahlen
-· Unterbrechung der ,1eih0n
474 253 424 807 345 740 - 18,6%
BR DEUTSCH-
LAND
110 874 99 619 82 469
- 17,2%
98 310 84 056 65 101
.. 22,6%
90 70
39 978 38 136 33 510
- 12,1%
6 675 7 241 7 313
+ 1,0%
144 087 130 444 108 666
- 16,7%
FRANCE
127 255 113 534
91 284 - 19,6%
124 281 110 686 88 501
- 20,0%
10 408 12 678 17 476
+ 37,8%
16 386 13 658 15 236
+ 11,&,(
121 277 112 554 93 524
- 16,9%
PETROLEUM
FOREIGN TRADE
Provisional data 1981
BELGIQUE-!TALIA NEDERLAN BELGIE
1. Total imports of crude oil ( 1)
114 947 59 406 34 237 93 263 49 914 33 474 90 954 39 OOO 28 934
- 2,5% - 21,9% - 13,6%
among which (2) :
Imports from third party countries
114 004 54 678 33 141 92 224 46 042 31 488 89 325 36 267 26 274
- 3,1% - 21,2% - 16,6%
2 . Total exports of crude oil
24 23 38
500 100 86
+ 334% + 126%
3. Total imports of
petroleum products
7 481 ~ 9 680 15 263 54 10 008 15 900 32 200 9 300
+ 4,~ + 12,8% - 7,1%
4. Total exports of
petroleum products
22 726 40 208 14 927 11 843 40 913 17 587 14 360 38 500 16 800
+ 21,3% - 5,9% - 4,5%
NET IMPORTS OF
PETROLEUM
( = 1 + 3 - 2 - 4)
99 702 38 206 96 683 37°524 91 994 32 600
28 990 25 857 21 348
- 4,8% - 13,1% - 17,4%
( 1) including feedstocks for distillation
(2) based on monthly data
- break in series
LUXEM-BOURG
1 355 1 132 1 058
- 6,5%
37 49 26
- 46,9%
1 318 1 083 1 032
- 4,1%
PETROLE
COMMERCE EXTER1Et,'f3
Donn6es provisoires 1981
1 OOO t
UNITED KINGDOM
IRELAND DANMARK ELLAS
1. Import. totales de petrole brut ( 1)
60 380 46 717 36 822
- 21,2%
58 351 44 470 34 537
- 22,3%
40 198 39 692 52 134
+ 31,3%
12 035 9 245 9 200
- 0,5%
13 359 14 598 12 789
- 12,4%
18 858 l 672
-18 901
2 333 8 676 2·043 6 718
670 5 883 - 67,2% - 12,4%
dont (2) :
Importations en prov. d~s pays tiers
2 219 5 664 17 171 1 893 4 309 17 637
587 3 071 18 495 - 69,0% - 28, 7% + 4,9%
2. Export. totales de petrole brut
438 1 472 447 3 174 251 2 290
- 43,8% - 27,9%
3. Importations totales
de produits petroliers
4 152 9 394 4 5[35 3 925 8 242 5 '976 4 347 6 184 3 552
+ 10,8% - 25,0% - 40,6%
4. Exportations totales
de produits petroliers
148 2 154 7 293 202 1 289 7 314 93 1 263 7 .696
- 54,0% - 2,0~ + 5,2%
IMPORTATIONS NETTES
6 337 5 766 4 924
- 14,6%
DE PETROLE
( = 1 + 3 - 2 - 4)
15 478 13 224 10 553
- 20,2%
12 991 13 196 12 061
- 8,6%
( 1) y compris feedstocks pour distillation
(21 sur base des donnees mensuelles
- rupture de series