a an e w c e n t u r y, a world st ge - home | morrison ... · science foundation arizona reached...
TRANSCRIPT

A New Century, A World Stage

A New Century, A World Stage
byBill Hart, CJ Eisenbarth Hager, and Joseph Garcia
Morrison Institute for Public Policy, ASU
The contributions and insights of the Morrison Institute team are acknowledged gratefully.
©2010 by the Arizona Board of Regents for and on behalf of Arizona State University and its Morrison Institute for Public Policy.

4 Global Arizona 100 • November 2010

Global Arizona 100 • November 2010 5
Dear Global Arizona 100 participant:
Back in the days when Arizona became a state, it was home to several hundred thousand people—a far cry from its current reality of more than 6.5 million. As we approach our second century of statehood in 2012, we face enormous challenges that may define our state’s prospects for many years to come. While Arizona experienced a population boom that drove much of its growth, it’s now clear that the state was too narrowly based on real estate, tourism and construction—and that we need to diversify.
Arizona is fortunate to possess gifted citizens who care deeply about their state and value can-do problem solving. Do we have the necessary policies, strategic leadership and shared vision needed to achieve a prosperous 21st century future? At a time of intensified global competition, a positive answer to this question has never been more critical.
Science Foundation Arizona reached out to Morrison Institute to help shape a program and a process that can help set an agenda for the state to become more competitive. This report and the website can assist this effort (visit www.globalarizona100.org). But it also will take the con-crete input of smart and committed Arizonans.
In reviewing current trends, we can see that innovation, educational excellence, and dynamic entrepreneurship—backed by strategic leadership—are keys to enhancing the state’s progress and prosperity. To achieve this requires high-performing companies, effective government, and a high-quality education system that can provide a prepared workforce and informed, engaged citizens.
We look forward to your active participation in the Global Arizona 100 conference. This is an opportunity for statewide leaders to put aside partisan differences, engage each other and design an action plan that can advance the Arizona we want. We are excited to begin building that future and the ongoing effort that will continue after December 1.
William C. HarrisPresident and CEO

6 Global Arizona 100 • November 2010
A New Century, A World Stage
The world is exploding with change. Despite the recent eco-
nomic downturn, the pace of technological advance, market
transformation and commercial innovation seems only to
accelerate with each passing year. New economic giants
like China and India loom over the international landscape;
heavyweights like Brazil, Russia, Mexico and South Korea are
building the infrastructure needed for a competitive economy.
The time is long past when the United States—let alone its
individual states—could find comfort in the advantages of
size, wealth and economic dynamism. Instead, it must face a
global future in which winners and losers will be determined
largely by conscious decisions taken today. The winners will
be those who look past the blare of daily headlines and invest
carefully in education, innovation, entrepreneurship and
excellence, thereby seizing the momentum of events and
helping drive the future.
Arizona, on the eve of its 100th birthday, has a choice to
make—as does every state and nation in the expanding global
marketplace. That choice will determine the role it plays on
the international stage.
The choice is not, “Should Arizona go global?”
The question now is: “Will Arizona muddle forward with the
crowd, or will it ready itself for a lengthy marathon?”
First, as for whether Arizona should go global, Arizona has in
fact always had global connections—long
before becoming the 48th state
in 1912. Native Americans
are known to have traveled
and traded over huge
distances. In the 16th
century Arizona be-
came New Spain, a
settlement, military
outpost and com-
mercial station of a
global empire based
thousands of miles away.
Later, as part of the new
Republic of Mexico, and still later as a U.S. territory, Arizona
spent centuries roiled by the international currents of
nationalism, religion, warfare and commerce. Today, Arizona
shares a 370-mile international border, has a population
nearly one-third Latino, welcomes visitors from everywhere
and trades with nations around the world. The choice to
go global has been made.
As for the second question, Arizona does not lack for capac-
ity. It’s the 14th most-populous state in the nation, with an
economy ranked 17th among the 50 states and about the size
of Thailand’s or Finland’s. With an enduring entrepreneurial
spirit, a technology-related industry base of 162,000 jobs
and a university research base of $783 million, Arizona owns
the essential ingredients to fuel a robust global outreach. It
also has the motive: It simply must act. Economic develop-
ment experts are virtually unanimous in urging states and
nations to stake their place in the global marketplace or
lose it. International capital flows surge daily; supply chains
measure in thousands of miles; manufacturers, distributors
and retailers confer across continents; goods in various stages
of manufacture crisscross the globe; marketing decisions
made in Singapore, or Auckland, or Glasgow rattle bottom
lines in Phoenix and Tucson.
But if the need for global expansion is clear, Arizona’s short-
comings are too. The state is among the hardest hit by the
Great Recession and has been slow in recovering. It ranks
among the nation’s worst in bankruptcies, foreclosures,
mortgage meltdowns and state budget deficits. It has long
dwelled at or near the bottom among states in K-12 educa-
tion funding. Its support for higher education falls well short
of the need. The latest U.S. Census Bureau data find Arizona
poorer than any state save Mississippi. Unfortunately, Arizona
is not competing with Mississippi alone. Yet to date, Arizona
has never mounted a truly focused, collaborative, supported
campaign to take its place in the global market.
These are formidable obstacles for a state aspiring to perform
on the world stage. They can only be overcome by concerted
action by public and private leaders who are closely monitoring
the global markets. These markets are suggesting—pointedly
—that Arizonans can no longer sit back and wait for prosper-
Global Arizona 100 • November 2010 7
ity to drive in from Illinois or California, no longer simply
surf the historic boom-bust cycle tethered to housing prices
and population flows. Instead, the imperatives of interna-
tional commerce demand an enthusiastic embrace of global-
ization through a commitment to education, innovation and
entrepreneurship.
Doing so will not guarantee Arizona a worthy place at
the richly-laden global table. But not doing so guarantees
the opposite.
There is a chance to begin.
Now.
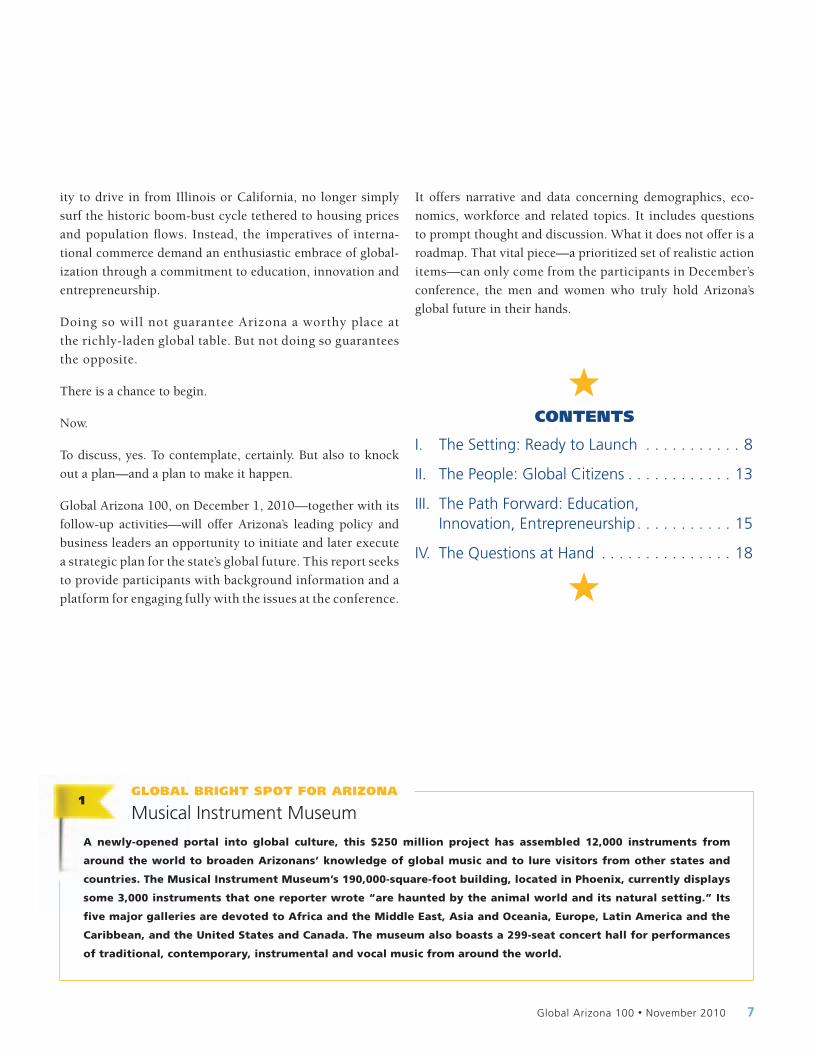
To discuss, yes. To contemplate, certainly. But also to knock
out a plan—and a plan to make it happen.
Global Arizona 100, on December 1, 2010—together with its
follow-up activities—will offer Arizona’s leading policy and
business leaders an opportunity to initiate and later execute
a strategic plan for the state’s global future. This report seeks
to provide participants with background information and a
platform for engaging fully with the issues at the conference.
It offers narrative and data concerning demographics, eco-
nomics, workforce and related topics. It includes questions
to prompt thought and discussion. What it does not offer is a
roadmap. That vital piece—a prioritized set of realistic action
items—can only come from the participants in December’s
conference, the men and women who truly hold Arizona’s
global future in their hands.
contents
I. The Setting: Ready to Launch . . . . . . . . . . . 8
II. The People: Global Citizens . . . . . . . . . . . . 13
III. The Path Forward: Education, Innovation, Entrepreneurship . . . . . . . . . . . 15
IV. The Questions at Hand . . . . . . . . . . . . . . . 18
1Global briGht spot for arizona
Musical Instrument Museum
A newly-opened portal into global culture, this $250 million project has assembled 12,000 instruments from
around the world to broaden Arizonans’ knowledge of global music and to lure visitors from other states and
countries. The Musical Instrument Museum’s 190,000-square-foot building, located in Phoenix, currently displays
some 3,000 instruments that one reporter wrote “are haunted by the animal world and its natural setting.” Its
five major galleries are devoted to Africa and the Middle East, Asia and Oceania, Europe, Latin America and the
Caribbean, and the United States and Canada. The museum also boasts a 299-seat concert hall for performances
of traditional, contemporary, instrumental and vocal music from around the world.

8 Global Arizona 100 • November 2010
A Dynamic Economy
Old images fade slowly. Many people, residents and visitors
alike, may still think of Arizona as a serene Southwestern
outpost celebrated for its sun-swept plains, slow-paced living
and rich selection of healthful pursuits. This view is not wrong.
But it overlooks some of the most salient characteristics of
a state that, at 100 years of age, is poised to leap fully onto
the world stage. In fact, Arizona is a large, dynamic economy
already heavily engaged in international transactions, from
high-tech exports to global tourism. It possesses the 34th
largest economy in the world, according to the International
Monetary Fund. Within the United States, Arizona’s economy
ranks 17th, as measured by state gross domestic product
(GDP). Among the nation’s western and border states, it trails
only the national behemoths California and Texas (Fig. 1).
FIgURE 1: gDP OF WESTERn AnD BORDER STATES*
STATE (2008 RAnk) gDP 2008 PERCEnT gROWTh (2005-2008)
UnITed STATeS $11,523,637 5.6%
CAlIfoRnIA (1) 1,546,125 5.3%
TexAS (3) 925,505 11.7%
ARIzonA (17) 210,235 7.2%
ColoRAdo (20) 203,024 7.8%
nevAdA (31) 103,192 6.1%
UTAh (33) 87,700 12.7%
new MexICo (38) 61,385 6.5%
* Values in millions of 2000 dollars.
Source: U.S. Department of Commerce Bureau of Economic Analysis.
Global TakeawayArizona is well-positioned for the global con-
test. It is a sunny and beautiful place, and it
also possesses an economy ranked among
the top three dozen in the world and a gDP
ranked 17th highest in the United States.
Speaking of states’ gross domestic product, economists say the preferred industry mix for success in the international marketplace emphasizes knowledge-based pursuits that add value primarily through creativity, innovation, design and management rather than muscle power or simple, repetitive operations. It’s also important for global competitors to cultivate “export” industries—manufacturing and financial services are examples—that send goods and services beyond their borders and thus bring in outside revenue.
The Industrial MixFigure 2 shows that the distribution among Arizona’s indus-tries reflects the mix of the United States as a whole, with a few noteworthy exceptions. At the national level, the information, finance and insurance, and professional and technical services sectors made up a notably greater share of output than they did in Arizona. This is not encouraging for the Grand Canyon State, as these sectors are among the most often prized—and rewarded—by the knowledge economy. Arizona’s economy is more focused on construction, real estate and retail trade than the nation as a whole. There is a growing body of opinion that, to prosper in the world economy, Arizona must expand beyond its historic dependence on real estate and construction towards a more diverse economic portfolio.
the settinG:ready to launch
I
2Global briGht spot for arizona
Embry Riddle Aeronautical University
nestled in the pines of northern Arizona, this campus of a global university teaches the science, practice and business
of aviation and aerospace. Its Prescott campus’ 1,700 students choose among 12 bachelor degrees and one master
degree in such fields as aeronautical science, air traffic management, engineering and global security and intelligence
studies. Embry Riddle exerts a worldwide reach.

Global Arizona 100 • November 2010 9
FIgURE 2: SELECTED InDUSTRIES, ARIzOnA AnD ThE nATIOn* (2008) ShARE OF TOTAL
InDUSTRy Az gDP U.S. gDP
PRIvATe IndUSTRIeS 89.2% 89.5%
AgRICUlTURe, foReSTRy, fIShIng 0.8% 1.1%
MInIng 1.2% 1.0%
UTIlITIeS 1.5% 1.0%
ConSTRUCTIon 3.7% 2.9%
MAnUfACTURIng 13.2% 13.7%
wholeSAle TRAde 5.6% 6.0%
ReTAIl TRAde 9.7% 8.0%
TRAnSPoRTATIon And wARehoUSIng 2.9% 3.0%
InfoRMATIon 3.7% 6.2%
fInAnCe And InSURAnCe 6.9% 8.0%
ReAl eSTATe 15.4% 12.5%
PRofeSSIonAl And TeChnICAl SeRvICeS 6.7% 8.5%
MAnAgeMenT 1.0% 1.6%
AdMInISTRATIve And wASTe SeRvICeS 4.1% 2.9%
edUCATIonAl SeRvICeS 0.7% 0.8%
heAlTh CARe And SoCIAl ASSISTAnCe 7.3% 6.9%
ACCoMModATIon And food SeRvICeS 3.1% 2.6%
goveRnMenT 10.9% 10.7%
* Values in millions of 2000 dollars.
Source: U.S. Department of Commerce Bureau of Economic Analysis.
Global TakeawayArizona lags the nation in the percentage of
output devoted to the information and finan-
cial services industries, and is heavily reliant
on retail trade, real estate and construction.
These latter industries tend to cater to domes-
tic rather than global markets.
International ExportsAnother oft-cited hallmark of successful modern economies is specialization, which includes the deliberate development of niches for international transactions. This is frequently expressed by a “location quotient,” also called the industry specialization index. Looking at the location quotient in terms of employment suggests that Arizona’s industries that serve state residents exceed national averages, while those that reach beyond Arizona’s borders tend to lag the nation. The location quotient also confirms Arizona’s relatively high level of specialization in the construction and real estate industries. Agriculture and utilities also fare well. However, manufac-turing, information and management do not.
Yet Arizona does show activity in international exports (Figure 3). In 2009, more than 13% of Arizona’s international exports
were civilian aircraft, engines and parts. Its second-largest export was processors and controllers for integrated circuits, although this declined sharply from 2008 to 2009. Arizona exports also benefit from its manufacturing in the military sector, both in weapons systems and other industrial parts. While this can be affected by the recession, too, it has generally remained more insulated as a result of national defense policy.
Indeed, Figure 3 reflects the volatility of the global market, especially during the past few years of international economic recession. Only five of Arizona’s top exports saw a gain between 2008 and 2009, including natural gas and military ordinance. Meanwhile, the biggest one-year losers were copper ores and molybdenum ores, the latter used in hardening steel.1
FIgURE 3: ARIzOnA’S TOP InTERnATIOnAL ExPORTED gOODS* ShARE OF Az TOTAL ExPORT, ExPORTED gOODS & MATERIALS 2006 2009 2009
Civilian Aircraft, engines, and Parts $1,775 $1,903 13.6%
Processors and Controllers, electronic Integrated Circuits 0 897 6.4%
electronic Integrated Circuits 0 508 3.6%
Bombs, grenades, Torpedoes, Mines, Missiles, other Ammunition and Projectiles 208 406 2.9%
Parts and Accessories of the Automatic data Processing Machines 677 276 2.0%
Parts of Particle Accelerators, Audio Mixers, high frequency Amplifiers 496 243 1.7%
Parts of Switches, Automatic Circuit Breakers, Relays or Connectors 254 213 1.5%
electric Apparatus for line Telephony, Telephone Sets, Parts 0 202 1.4%
Molybdenum ores and Concentrates (Roasted) 519 189 1.3%
other Apparatus for Making Connections to or in electrical Circuits 205 169 1.2%
Copper ores and Concentrates 129 166 1.2%
natural gas, gaseous 0 163 1.2%
Plugs and Sockets, for a voltage not exceeding 1,000v 134 141 1.0%
other Articles of Plastics 182 138 1.0%
oil-cake, Solid Residues Resulting from extraction of Soybean oil 81 134 1.0%
other Automatic Regulating or Controlling Instruments and Apparatus 79 125 0.9%
Parts of Airplanes or helicopters 190 112 0.8%
* In millions of 2009 dollars; not including services.
Source: U.S. Census Foreign Trade Database.
1 Definition from Merriam-Webster Online Dictionary, http://www.merriam-webster.com/dictionary/molybdenum.

10 Global Arizona 100 • November 2010
Global TakeawayArizona exports a wide variety of goods. how-
ever, over half of its top 25 exports are me-
chanical or electrical goods, suggesting a need
for greater diversity for the global market.
Arizona’s Top MarketsWhile Arizona sends goods all over the world, Mexico is our largest trading partner, follwed by Canada and China. Arizona’s exports to Mexico alone comprise nearly one-third of the state’s total international exports; adding Canada raises that percent-age to 45%. Three-fourths of the state’s exports go to its top 10 markets. As the international economic recession worsened, all Arizona export activities declined from 2008 to 2009, except for those to Italy and Switzerland. Figure 4 lists Arizona’s top 15 international export markets, not including services. Interestingly, although India’s economic power is growing, it is not among Arizona’s top 15 trading partners.
FIgURE 4: ARIzOnA’S TOP 15 ExPORT MARkETS*COUnTRy (ShARE OF ARIzOnA’S TOTAL ExPORT ACTIvITy, 2009) 2006 2007 2008 2009
MexICo (32.4%) 5,369 5,235 5,910 4,547
CAnAdA (12.6%) 1,847 2,193 2,319 1,762
ChInA (5.9%) 1,196 1,317 1,255 822
UnITed KIngdoM (4.3%) 803 959 1,013 597
geRMAny (4.2%) 755 1,011 964 587
JAPAn (3.8%) 686 716 732 526
SIngAPoRe (3.7%) 1,243 1,140 1,008 524
fRAnCe (3.5%) 496 512 608 494
MAlAySIA (2.4%) 808 539 382 340
ThAIlAnd (2.2%) 444 493 469 307
BRAzIl (2.2%) 155 278 363 304
ITAly (1.7%) 113 153 215 239
neTheRlAndS (1.6%) 798 482 372 226
SwITzeRlAnd (1.6%) 159 75 106 219
SoUTh KoReA (1.5%) 199 446 262 210
* In millions of 2009 dollars; not including services.
Source: U.S. Census Foreign Trade Database.
Global Stars Are BornSuccess in global competition requires states and nations to constantly review international economic actors in order to pursue the best new opportunities. While opinions vary, many economists and businesspeople expect the so-called
“BRIC countries”—Brazil, Russia, India and China—to be
the most dynamic emerging markets in the next 10 to 20
years. Several years ago, Goldman Sachs economists predicted
that by 2050 the BRIC countries’ economies could rival those
of the six current largest world economies. Some economists
argue that Mexico and South Korea should be added to the list
—BRIMCK. Of the BRIMCK countries, Arizona has a strong,
high-volume export relationship with Mexico, with China
as the state’s third most profitable export market. Arizona
currently has a negligible export relationship with Russia.
In the wake of the BRIC theory, Goldman developed a second-
tier list of emerging economies, called the Next Eleven, whose
growth will also be strong, if less so than the BRIC. Its Next
Eleven includes Bangladesh, Egypt, Indonesia, Iran, Mexico,
Nigeria, Pakistan, the Philippines, South Korea, Turkey and
Vietnam. Of these, Arizona has a trading relationship with
only three—Mexico, South Korea and the Philippines.
Global TakeawayArizona has a trading relationship with only
40% of the emerging world markets and is
heavily dependent on trade with Mexico;
however, in just one year, our exports to Mexico
fell by nearly one-fourth.
3Global briGht spot for arizona
Paragon Expands the FrontierTucson-based Paragon Space Development creates
sophisticated life-support and thermal systems for
the harshest conditions on Earth, in orbit and even
faraway Mars. Founded in 1993 after its president
Jane Poynter and CEO Taber McCallum emerged
from Biosphere 2, Paragon has become an innova-
tive design and engineering firm that works with
many of the world’s leading aerospace companies,
nASA and the U.S. navy. Its hardware has been
employed in more than 70 spaceflight missions.
Earlier this year nASA selected Paragon as one of its
first “space pioneers,” highlighting its emerging
role in the commercialization of space. Among
Paragon’s forward-thinking projects that extend
beyond our own globe: creating a system to grow
a plant on the moon.

Global Arizona 100 • November 2010 11
A successful global competitor needs to know how inter-
national trade affects jobs and incomes on the home front.
Data tying Arizona jobs to international trade are limited—
excluding, for example, jobs in the service industries and
commodities production. However, these data do include
non-manufacturing occupations (such as accountants) that
provide support services.
FIgURE 5: ARIzOnA JOBS DEPEnDEnT On InTERnATIOnAL MAnUFACTURED ExPORTS (2008)
TOTAL PERCEnT PERCEnT EMPLOyMEnT OF ALL OF ALL PRIvATE RELATED TO MAnUFACTURIng SECTOR JOBS MAnUFACTURED JOBS DEPEnDEnT DEPEnDEnT On ExPORTS On ExPORTS MAnUFACTURIng ExPORTS
UnITed STATeS 6,814,000 22.1% 5.9%
CAlIfoRnIA 737,600 23.7% 5.8%
TexAS 731,800 26.3% 8.2%
ColoRAdo 95,000 23.8% 4.8%
ARIzonA 85,100 22.6% 3.9%
UTAh 51,200 15.1% 4.9%
nevAdA 17,600 13.9% 1.6%
new MexICo 16,000 13.3% 2.4%
Source: U.S. Department of Commerce International Trade Administration.
At first glance (Figure 5), the nearly 4% of Arizona’s total
private-sector employment linked to manufactured interna-
tional exports is low compared to other western and border
states. Only New Mexico and Nevada trail. Looking solely at
jobs in the manufacturing sector, however, Arizona’s depen-
dence on exports tracks the national norm at 22.6%. This
points to an important role for manufacturing in promoting
export success.
Investment from Abroad
Actors on the international stage not only exchange goods
and services, they also exchange business start-ups and
investment capital. These are not huge factors for the nation
or for Arizona—at least not yet—but may be areas of potential
growth. MOUSAs (“majority owned United States affiliates”)
account for 4.8% of all private-sector jobs in the United States.
Texas, California and Colorado reflect that percent, while Ari-
zona comes in near the bottom of the western region with only
3.2% of private employees working for foreign companies.
Considering MOUSA employment by industry, manufacturing
takes the lead both nationally and regionally. For Arizona
retail trade follows, with wholesale trade following that. The
comparison states rely less heavily on the retail trade industry.
Another way to examine MOUSAs in the United States is to
look at foreign direct investment (FDI), which is the gross
value of property, plant and equipment. Comparing FDI to
state GDP gives a sense of the importance MOUSAs play in
our economy. Colorado’s estimated ratio exceeds that of all
of the comparison states and U.S. Arizona is at the bottom
of the western region—as is Arizona’s MOUSA employment.
These data raise the question why Arizona has not been
more successful here—and suggest an area of opportunity for
Arizona to attract more foreign businesses and capital.
Global TakeawayForeign-owned firms’ investment in Arizona—
both in people employed and dollars spent on
businesses—is low. Colorado fares better than
Arizona, in spite of a smaller total economy
and employment.
4Global briGht spot for arizona
Angel Focuses on EarthWorld-renowned astronomer Roger P. Angel is a pioneering innovator in the use of optics for telescopes. Based at
the University of Arizona in Tucson, Angel has set his sights on earth. his goal: The creation of a solar technology
that can significantly cut the globe’s dependence on fossil fuels. Angel’s idea for generating electricity involves
concentrating solar rays 1,000 times brighter than natural sunlight with the use of specially designed reflective
mirrors. The concentrated energy then passes through a glass sphere onto photovoltaic cells that are twice as
efficient as traditional ones. Angel and his newly formed firm, REhnu, is aiming to develop and commercialize a
system that can match or better the cost of any other electricity method.

12 Global Arizona 100 • November 2010
Tourism Remains Strong
A longtime global destination—14% of visitors are foreigners—
Arizona is expected to continue to benefit from tourism dollars.
Travel and tourism is one of the most important “export”
industries in Arizona. Spending by visitors generates jobs and
tax revenues for local communities. In recent years the GDP of
the Arizona travel industry has exceeded that of other export
industries such as mining, microelectronics and aerospace.
But there are challenges, including increased competition
from foreign destinations. Indeed, the United States as a
whole has dropped to third place, behind France and Spain,
as the most popular international destination, according to
the Travel Industry Association of America. Excluding visitors
from Canada and Mexico, the number of foreign visitors has
dropped steadily since 1996.
Mexico remains Arizona’s greatest source of foreign visitors,
with more than 25 million visits in 2008, most being day visits
from Sonora. Next is Canada, with more than 500,000 visi-
tors in 2008. Some trends in the tourist industry suggest that
Arizona would be wise to keep its focus southward. Mexico
should only grow in importance as it grows in size. Indeed,
the expected rapid population growth in emerging nations
could hasten the decline of European markets and promote
the emergence of new ones, such as China and India. Arizona
must be ready to adapt its highly important tourism industry
to these new global realities.
Global TakeawayTourism and travel will continue to play major
roles in Arizona’s economy. But international
demographic changes will generate new issues.
And social and economic dislocations at home
may pose challenges to Arizona’s quality of
life that visitors travel here to experience.
5 6Global briGht spot for arizona
Discovery Channel Telescope
After four years at University of Arizona College of
Optical Sciences for finishing work, the Discovery
Channel Telescope (DCT) mirror was delivered to its
Flagstaff-area site in June. The 4.3-meter-aperture
telescope will be the fifth largest in the continental
United States when completed in 2011. The flag-
ship instrument for Lowell Observatory – a private,
non-profit research institution founded in 1894 by
Percival Lowell – the DCT will enhance Arizona’s
global role in the science and technology surround-
ing astronomy. In addition to research, however,
the observatory’s partnership with the Discovery
Channel will produce programming and online
content for an inside look at the DCT and how its
science is done. The telescope, which in its initial
phase will cost some $40 million, will take advan-
tage of Flagstaff’s Dark Skies Initiative.
Global briGht spot for arizona
Heard Museum
One of the Phoenix area’s first cultural attractions
has grown to be one of the world’s finest destina-
tions for learning about American Indian arts and
cultures. Founded in 1929 by prominent Phoenix
residents Dwight B. and Maie Bartlett heard, the
heard Museum of native Cultures and Art collects,
preserves and presents native art, ranging from
ancestral artifacts to contemporary paintings and
jewelry. The museum is recognized internationally
for the quality of its collections, its educational
programming and its festivals. Through these
activities, the museum seeks to set the national
standard for collaborating with native people to
present first-person voices. Partnerships with Amer-
ican Indian artists and tribal communities provide
global visitors with a distinctive perspective about
the art and cultures of native people.

Global Arizona 100 • November 2010 13
Big and Getting Bigger
Arizona is the West’s third most-populous state, a distinction
easily overlooked because of its location between the two giants,
California and Texas. In fact, Arizona, once a remote, sparsely
populated region, today ranks among the nation’s larger states;
at 6.5 million residents, its population ranks 14th nationally.
FigURE 6: PoPUlation, aRizona & nEighboRs
Rank 2009 PoPUlation EstimatE
UnitedStateS 307,006,550
1 California 36,961,664
2 texaS 24,782,302
14 arizona 6,595,778
22 Colorado 5,024,748
34 Utah 2,784,572
35 nevada 2,643,085
36 newMexiCo 2,009,671
Source: U.S. Census Bureau, 2009 estimates.
And it’s still growing. True, the severity of the current reces-
sion renders demographic projections less reliable than usual.
But between 2000 and 2030, Arizona is expected to grow by
a greater percentage than any other state in the region except
Nevada, and add more residents than any except California
and Texas. If projections hold, Arizona, along with Nevada,
will also host a population older than any neighboring state ex-
cept New Mexico. This development could bring both benefits
and disadvantages. Older residents in general may be wealth-
ier, more stable and civically active; however, they also tend
to have higher health care costs and less participation in the
economy. In addition, some recent scholarship links younger
residents with greater economic innovation and vitality.
Economic Challenges Abound
Arizona and New Mexico are projected to lead the western
region in 2030 in the “dependency ratio,” which is based
on the percentage of a state’s population that is either 20 or
younger or 65 or older—and are thus considered “dependent”
on the state’s working-age population, those aged 21-64.
Arizona’s high ratio suggests that a sizeable portion of the
state’s population is not directly engaged in productive activity,
lessening Arizona’s overall ability to compete. Compounding
the dependency issue is the fact that Arizona is a relatively
low-income state compared with most of its neighbors and
to the nation as a whole. This is reflected in the state’s per
capita personal income. This dependency issue forcefully
underscores why innovation and education are so crucial in
strengthing the state’s prospects for attracting and growing
high-paying jobs. FigURE 7: PRojEctEd indicatoRs FoR statEs in 2030
statE 2030 PoPUlation mEdian agE dEPEndEncy Ratio*
UnitedStateS 363,584,000 38.7 83.0
arizona 10,712,397 39.3 96.6
California 46,444,861 37.4 79.5
Colorado 5,792,357 35.6 80.4
nevada 4,282,102 39.4 85.5
newMexiCo 2,099,708 44.8 102.1
texaS 33,317,744 34.6 83.1
Utah 3,485,367 30.4 89.4
* Dependency Ratio = (Age under 20 + Age 65 and over) / (Age 20-64) X 100.
Source: U.S. Census Bureau, Population Division, Interim State Population Projections, 2005.
FigURE 8: statE PER caPita PERsonal incomE*
statE (2009 Rank)** PcPi
UnitedStateS $39,138
California(10) $42,325
Colorado(15) $41,344
nevada(20) $38,578
texaS(29) $36,484
newMexiCo(42) $32,992
arizona(43) $32,935
Utah(49) $30,875
* Preliminary figures.
** Includes District of Columbia.
Source: U.S. Department of Commerce Bureau of Economic Analysis.
The people:global CiTizens
II

14 Global Arizona 100 • November 2010
Residents from Elsewhere
Arizonans are known to remark that, “Everyone in Arizona is
from somewhere else.” As a case in point, the state’s foreign-
born population increased by 42% between 2000 and 2008.
While large, this was substantially less than during the decade
of the 1990s, when the state’s number of foreign-born resi-
dents soared by 136%. Mexico is the leading nation of origin
for most foreign-born Arizonans. Nationally, Arizona ranks
ninth among states in the percent of foreign-born residents,
with 14.3% of Arizona’s population in that category.
Foreign-born Arizonans play a significant role in the state’s
workforce. More than seven in 10 are of working age (18-
54), and in 2007 they comprised 19.5% of Arizona’s civilian
employed workforce, up from 8.4% in 1990. However, these
workers are generally not well-educated. Nearly 60% have not
completed high school, and only 12% hold a college degree.
Undocumented immigrants, whose numbers have dropped in
recent years, are the subject of intense political controversy
in Arizona and throughout the nation. Yet regardless of one’s
positions on the issues involved, this population group remains
a large and important source of economic activity, both posi-
tive and negative. This is especially true given the long-term
expectations that the state will experience a shrinking working-
age population. With an estimated 500,000 undocumented
immigrants, Arizona ranks sixth among states. However,
as a percent of total population and percent of the labor force,
Arizona ranks second and third, respectively. That means that
nearly one of every 10 Arizona workers is undocumented.
FIgURE 9: ESTIMATED UnAUThORIzED IMMIgRAnT POPULATIOnS
UnAUThORIzED PERCEnT PERCEnT IMMIgRAnT TOTAL OF LABOR STATE (RAnk) ESTIMATE, 2008 POPULATIOn FORCE
UnITed STATeS 11,900,000 4.0% 5.4%
CAlIfoRnIA (1) 2,700,000 7.3% 9.9%
TexAS (2) 1,450,000 6.0% 7.9%
ARIzonA (6) 500,000 7.9% 9.8%
ColoRAdo (12) 240,000 4.8% 5.4%
nevAdA (13) 230,000 8.8% 12.2%
UTAh (22) 110,000 4.1% 5.8%
new MexICo (27) 80,000 4.0% 4.5%
Source: Pew Hispanic Center, A Portrait of Unauthorized Immigrants in the United States, April 2009.
Global TakeawayArizona’s population is becoming international
at a faster rate than the national average,
though most foreign-born Arizonans are from
a single country, Mexico. The foreign-born
population is nearly one-fifth of the state’s work-
force, but is poorly educated and low-skilled.
Students from EverywhereAttracting foreign students is another way for Arizona to acquaint potential residents with its many positives, spread the state’s “brand” further around the globe and expand the existing population’s knowledge of international culture. According to the Institute of International Education (IIE), Arizona ranks 19th among states hosting international students in higher education. For the 2008-09 school year, 10,787 foreign students attended an Arizona post-secondary institution.
IIE estimates that these foreign students spent $228 million in Arizona during the 2008-09 school year. By contrast, IIE estimates foreign students spent $2.8 billion in California (the state with the largest foreign student population) during the same time period. Ohio and Pennsylvania have a com-parable total post-secondary student population, but both attract a larger share of international students than Arizona. Pennsylvania ranks seventh and Ohio ranks ninth. With more international students comes more economic impact. Expenditures by international students total $820 million annually in Pennsylvania and $506 million in Ohio.
The leading home country for international students attend-ing Arizona schools is India, followed by China, South Korea, Mexico and Taiwan.
IIE also reports that 3,825 students attending college or uni-versity in Arizona studied abroad during the 2007-08 school year, a decrease of 2.3% from the prior school year. However, Ohio had 11,149 students study abroad in the 2007-08 school year (up by 9.1% from the prior year), and Pennsylvania had 16,326 (up by 7.6%). Nationally, study-abroad students increased by 8.5% over the previous year.
Global TakeawayCompared to other states with similar-sized stu-
dent bodies, Arizona could do more to attract
international university students. The number
of Arizona university students studying abroad
is dropping, contrary to the national trend.
2 Institute of International Education, Open Doors 2009 Fast Facts, 2009.

Global Arizona 100 • November 2010 15
Cultivating Human CapitalHuman capital is vital for success, domestically or interna-tionally. As it surveys the global arena, Arizona should give top priority to growing its current talent base in science, math, computer and engineering to provide a reliable and consistent labor supply for the state’s technology economy. Its current situation is not good. Arizona ranks poorly among the states in terms of science, engineering and computer-related degrees, creating a void in homegrown talent in these key fields. Worse, the negative impact of this limited talent base can feed upon itself, as graduates leave the state for better jobs and high-tech firms bypass Arizona due to lack of local talent.
This is not a new story for Arizona, but the consequences remain severe for its efforts to compete on the world stage. Figure 10 shows that Arizona compares well to several of its neighbors in critical education metrics, but it is substantially behind others in some measures, and is substantially behind the U.S. average in all.
Computers in the ClassroomArizona has lost ground in terms of providing an educated and skilled workforce proficient in math and science. An essential tool in making that possible, however, is currently a clear deficiency: digital education infrastructure. Arizona is not only lagging benchmark states and the national average in com-puter access in classrooms, it ranks near the bottom among
states in overall access to technology in schools. A high ratio of students to computers only exacerbates the problem, as less computer-driven learning is available for each student, further limiting the number of students who might otherwise enter the pipeline leading to a high-tech, skilled labor force that is already competing against increasingly well-educated, well-prepared global rivals.
The Promise of InnovationIf one word can be applied across the board to describe what’s needed to boost Arizona’s global future, it is “innovation”— in designing novel goods and services, in creating robust public-private partnerships, in linking enhanced educational outcomes to workforce quality, in penetrating new international markets, in promoting Arizona’s brand around the world, in attracting foreign businesses and capital, even in spurring new industries. But wise global initiatives must be grounded in reality. At present, Arizona’s standing in key benchmarks is mixed, at best. Still, with a technology-related industry base of 162,000 jobs and a university research base of $783 million, Arizona does possess the building blocks to fuel strong and innovative growth in the global arena.3
Most economists agree that a substantial share of global prosperity will accrue to the owners of intellectual property.
FIgURE 10: EDUCATIOn AnD WORkFORCE MEASURES, 2007
ARIzOnA CALIFORnIA COLORADO nEvADA nEW MExICO TExAS UTAh U.S.
expenditures Per Pupil for elementary & Secondary Public Schools $7,338 $8,952 $8,286 $7,806 $8,849 $7,850 $5,706 $9,683
BA or higher, Ages 25–44 24.5% 30.0% 35.8% 21.0% 22.5% 25.4% 28.3% 29.8%
State expenditures on Student Aid Per full-Time Undergraduate Student $47 $1,229 $488 $906 $1,793 $910 $87 $1,029
Science & engineering occupations as Share of workforce* 3.26% 4.30% 5.38% 1.99% 3.60% 3.96% 3.80% 3.75%
engineers as Share of workforce* 1.14% 1.31% 1.51% 0.57% 1.20% 1.25% 1.04% 1.06%
life and Physical Scientists as Share of workforce* 0.24% 0.50% 0.55% 0.25% 0.72% 0.40% 0.47% 0.40%
Computer Specialists as Share of workforce* 1.74% 2.09% 2.93% 0.94% 1.20% 2.10% 2.22% 2.08%
*2008 data. ** 2006 data.
Source: National Science Foundation, Science and Engineering Indicators 2010, http://www.nsf.gov/statistics/seind10/c8/c8s8.cfm.
the path forward:education, innovation, entrepreneurship
III
3 Battelle Memorial Institute, The First Annual Report Card of Arizona’s Technology & Innovation Registry, February 2009.

16 Global Arizona 100 • November 2010
Patents issued are one key intellectual property metric, and
Arizona is not currently a leader among benchmark states.
For instance, while Arizona is slightly ahead of the national
average in patents issued, it trails most benchmark states. In
addition, Arizona’s severe and enduring economic recession
has taken its toll: 2008 saw nearly zero growth in Arizona
patents, far below the national average of 9.7%.
FigURE 11: PatEnts issUEd*
PatEnts issUEd 2008 PatEnt changE (PER $100 million gdP) (avg. 2006-07 vs. 2008)
UnitedStateS 0.76 9.7%
oregon 1.72 -8.5%
waShington 1.54 9.9%
MinneSota 1.34 -4.8%
wiSConSin 1.06 -3.5%
Colorado 0.98 -11.4%
arizona 0.92 0.6%
northCarolina 0.71 6.1%
georgia 0.51 -1.1%
virginia 0.44 0.8%
* As part of its Report Card, Battelle used eight states for comparison purposes related to the structure and size of the state’s technology-based industries, levels of university and industry funding, and population.
Source: Battelle Memorial Institute, The First Annual Report Card of Arizona’s Technology & Innovation Registry, February 2009.
Paying to LearnArizona ranks in the middle among the benchmark states in
both university and industry research expenditures relative to
the size of its economy. However, the state lags the national average. Arizona’s nearly $800 million in total university research expenditures ranks 20th among all states. The good news is that academic research expenditures in Arizona grew from 2006 to 2007, nearly keeping pace with the national average. The bad news, however, is that, percentage-wise, such growth was well behind seven of the eight comparison states. Dollar amounts alone, of course, do not communicate success; the challenge is to use those resources wisely and strategically.
FigURE 12: UnivERsity REsEaRch ExPEnditUREs
PatEnts issUEd 2008 PatEnt changE (PER $100 million gdP) (avg. 2006-07 vs. 2008)
UnitedStateS $35,968 3.5%
northCarolina $47,203 10.2%
wiSConSin $45,920 2.6%
Colorado $36,923 6.3%
oregon $36,309 3.1%
georgia $35,031 6.6%
arizona $31,683 2.1%
waShington $31,515 -0.7%
virginia $25,378 2.6%
MinneSota $24,980 5.2%
Source: Battelle Memorial Institute, The First Annual Report Card of Arizona’s Technology & Innovation Registry, February 2009.
Prior to the national recession, at least, Arizona’s industrial research base was faring better, growing at more than twice the national average for all states and increasing by more than 20% from 2005 to 2006. The state’s industrial research expen-diture totals ($3.6 billion, 18th among all states) are modest compared with some of the benchmark states; but only Georgia had a similarly large percentage increase over the year.
FigURE 13: indUstRial REsEaRch ExPEnditUREs
changE in indUstRial REsEaRch indUstRial REsEaRch ExPEnditUREs, 2006 ExPEnditUREs, (PER $10 million gdP) 2005-2006
UnitedStateS $180,214 9.5%
waShington $363,671 10.7%
MinneSota $246,931 -0.7%
oregon $216,074 5.1%
Colorado $197,060 8.3%
arizona $145,328 20.5%
northCarolina $137,340 6.4%
wiSConSin $130,008 10.7%
virginia $125,756 10.0%
georgia $70,264 22.1%
Source: Battelle Memorial Institute, The First Annual Report Card of Arizona’s Technology & Innovation Registry, February 2009.
7global brighT spoT for arizona
Human Origins Genotyping Laboratory
Perhaps nothing reminds us how intrinsically closely
we are all related than global dna analysis, which
can trace genetic evolution back to homo sapiens
in africa more than 60,000 years ago. the human
origins genotyping laboratory at the University of
arizona is the only site in the world to analyze dna
samples from the general public. it’s all part of the
national geographic genographic Project, which so
far has used cheek swabs of dna from more than
415,000 individuals around the globe to trace their
global roots. Want to trace your ancient ancestry?
go to http://hogl.arl.arizona.edu/ to find out how.
the project, now in its fifth year, recently expanded
its laboratory to include the dna shoah Project, a
humanitarian forensic effort to reconnect victims
and families who were separated by the holocaust.

Global Arizona 100 • November 2010 17
Global TakeawayPatents are a key measure of innovation. ari-
zona’s performance, ranking near the middle
of benchmark states, could improve through
concerted action or decline through neglect.
the same applies to arizona’s performance
in research and in workforce preparation for
high-tech global competition.
The Entrepreneurial Spirit
Even the most inventive scientists and skilled technicians
will be of limited value in Arizona’s global efforts unless there
is venture capital available to fuel and expand enterprises,
along with business people ready to drive them. Americans
have long had a reputation as risk-takers and Fortune Small
Business, drawing on data from the World Bank and Global
Entrepreneurship Monitor, found that this continues to set the
U.S. apart from other countries. What sets the top countries
apart from those at the bottom are fewer steps and barriers for
entrepreneurs wanting to set up shop.
FigURE 14: lEading EntREPREnEURial nations
1. newzealand 6. hongKong,China
2. UnitedStateS 7. UnitedKingdoM
3. Canada 8. ireland
4. aUStralia 9. denMarK
5. Singapore 10. iCeland
Source: http://money.cnn.com/magazines/fsb/fsb_archive/2007/06/01/100049637/index.htm.
Among the states, Arizona ranks fairly well, according to both
the Milken Institute’s 2008 State Technology and Science
Index and the 2009 Kauffman Index of Entrepreneurial Activity
by State. The Milken report ranks Arizona 17th among all
states, issuing a mixed verdict after reviewing 77 indicators
grouped into five major components:
FigURE 15: comPonEnts oF EntREPREnEURshiP
comPonEnt aRizona Ranking
humanCapitalinvestment 33
researchanddevelopmentinputs 16
riskCapitalandentrepreneurialinfrastructure 10
technologyandScienceworkforce 22
technologyConcentrationanddynamism 6
Source: Milken Institute, 2008 State Technology and Science Index.
These findings suggest that Arizona displays strengths in the formation and growth of high-tech firms, and in its pool of entrepreneurs and the capital to support them. However, the state is experiencing only fair success in attracting research funding and is about average among states in its technology and science workforce. Arizona scores its lowest ranking in human capital investment, which once again highlights the state’s weakness in educational achievement.
A more positive finding comes from the Kauffman Founda-tion’s 2009 ranking of entrepreneurial activity. Arizona ranked third in the nation, behind only Montana and Oklahoma and ahead of Idaho and Texas. The foundation defines entrepre-neurial activity as the percent of individuals ages 20-64 who do not own a business in the first survey month but who start a business in the following month with 15 or more hours worked per week. The foundation also ranks metropolitan areas, and placed the Phoenix area fourth among the nation’s 15 largest MSAs, after Houston, Miami and Atlanta.
Global Takeawayarizona ranks above the middle among states
in entrepreneurship and even higher on start-
ups and activity, which is good news for global
competition. yet it still shows weaknesses in
the critical area of education and workforce
preparation.
8global brighT spoT for arizona
SkySong
skysong is a unique innovation center designed
to help companies grow by providing business
services and programs offered or facilitated by
arizona state University. these services include
access to new technologies, capital networks, busi-
ness education and a skilled workforce. skysong
serves the needs of businesses, research and tech-
nology industry, and academia. it builds vital net-
works between university innovations, regional
progress and the worldwide technology industry.
located in south scottsdale near the asU tempe
campus, the mixed-use project today hosts 43
companies and organizations on site and 19
additional ones working “virtually” with skysong.

18 Global Arizona 100 • November 2010
Facts, figures, traditions, experts. All can help Arizona in
meeting the challenges of globalization, but even together
they are not sufficient. The data and opinion in this report
will hopefully help set the stage for a productive meeting of
the minds on December 1. Only the combined experience,
savvy and will of the participants can inaugurate the vital
process of guiding Arizona more fully onto the world stage.
On that day specific policy recommendations will be raised,
debated and voted upon. To prepare for that task, this report
ends with a few of the key questions that frame the goals and
challenges before us.
• What are Arizona’s major strengths and weaknesses
in global competition?
• Which economic sectors show the most promise for
global competitive success?
• How can Arizona improve its level and diversity of
international exports?
• How can Arizona best address the deficiencies in its
talent base?
• How much of a role should state government play in
Arizona’s global efforts?
• What new partnerships or collaborations can provide
leadership in advancing the state’s global position?
• Should Arizona concentrate on attracting more foreign
firms and investment?
• Is there a smarter way to harness Arizonans’ entrepre-
neurial spirit?
• What lessons can Arizona learn from the global success
of other states and countries?
• Can Arizona dedicate the necessary attention and
resources to increasing its global competitiveness given
its serious challenges on the home front?
• How can Arizona better exploit its geographic location,
cultural history and changing demographics as com-
petitive advantages?
• What is the most effective way to organize a successful
global development movement in Arizona?
the questionsat hand
IV
9 10Global briGht spot for arizona
Biosphere 2
Over the last two decades, Biosphere 2 near Tucson
has provided a fascinating focal point for scientific
study, with a particular emphasis on the earth sci-
ences and global climate change. Managed now by
the University of Arizona and toured by more than 2.3
million visitors, the highly-controlled environments
inside this unique glass-and-steel structure continue
to serve as a cutting-edge hub for multidisciplinary
research and teaching.
Global briGht spot for arizona
Thunderbird School of Global Management
This glendale institution is the nation’s oldest and
largest graduate management school focused
solely on preparing international business leaders.
Thunderbird draws students from dozens of coun-
tries who are striving to become skilled professionals
with global knowledge, awareness, sensitivity and
experience. They are taught to manage effectively
in different social, economic and political environ-
ments to better understand global markets and to
work with individuals from diverse cultures.

411 north Central Avenue, Suite 900, Phoenix, Arizona 85004-0692, 602.496.0900
MorrisonInstitute.asu.edu
400 east van Buren Street, Suite 200, Phoenix, Arizona 85004, 602.682.2800, fax 602.682.2890
www.sfaz.org

www.globalarizona100.org