a-aps mcas report 11.22.13 final
TRANSCRIPT

Acton Public Schools 2012 MCAS Analysis Special Education fourth grade ELA and Math SGP are concerning
February 22, 2013
1
Introduction Background There is no question that the Acton Public School district is a high performing school district that provides a quality education to our aggregate student population. In 2012 the Acton district’s aggregate student population ranked in the 73rd percentile across the state in English Language Arts and 92nd percentile in Math achievement. The district’s special education subgroup ranked in the 75th percentile across the state in English Language Arts and 92nd percentile in Mathematics. However, available MCAS data for both student proficiency and student growth indicate that our fourth grade special education students are not performing to the same high standards as their typical classmates, peer districts, or earlier fourth grade subgroups. The Acton-Boxborough Special Education Parent Advisory Council (AB SpEd PAC) has focused our MCAS analysis on the subgroup of students within the APS school district who don’t seem to be achieving at a level commensurate with the district’s overall academic performance. The PAC believes that MCAS data is a useful objective measure of student academic performance. The ability to compare Acton student performance with peer districts and to follow growth and achievement trends over multiple years provides valuable information. This year our MCAS analysis is informed by both the 2012 test data as well as discussions with the Director of Pupil Services, Liza Huber, and the Director of Curriculum, Deb Bookis. We appreciate the time they spent with us to discuss 2012 MCAS performance across the five Acton elementary schools. Unfortunately, our efforts to meet with the elementary school principals were unsuccessful. After delaying our meeting by a month to accommodate the principals’ schedules, an hour before the scheduled meeting time all five elementary school principals became simultaneously unavailable to attend. We went ahead with the meeting since Deb Bookis and Liza Huber were still available and appreciate their efforts to answer our questions about student performance at each of the elementary schools. This year we have also included a brief summary of best practices for improving outcomes for students with special needs. A Ph.D. student, Kalyani Krishnan, has volunteered some time to the AB SpEd PAC this fall as part of a graduate level class project. She has done a literature search of current best practices and we have included the highlights of her literature search in our report as a complement to the data analysis. Recent Changes in Federal Student Growth and Achievement Standards As a result of Massachusetts’ successful application for a waiver to No Child Left Behind (NCLB) the criteria have changed this year for measuring student progress using MCAS. NCLB used to require that the achievement gap between all students be completely closed by the year 2014, i.e., the goal was that all students achieve MCAS Proficiency by 2014. Because so many schools, states and districts across the country were unable to meet this goal the Obama Administration offered waivers to states who accepted alternate student performance criteria. The Massachusetts NCLB Waiver system has introduced a more complex, multi-factor measurement system, which includes a new metric called “proficiency gap.” The new system continues to use CPI, the Composite Performance Index, as the key measure of student success. A CPI of 100 indicates proficiency or better in any given MCAS subject. The new “proficiency gap” metric is defined as the difference between the 2011 CPI performance of any group of students and a CPI score of 100, which indicates subject proficiency. The new measurement target is for schools

2
to close the existing “proficiency gap” for each group of students by 50% by the year 2017. It is important to note that this system measures the progress of each group of students against itself over that time period not against other groups of students. While the principal test for achieving a “Met Target” status for proficiency in the new system is described above, there are several exemptions that allow schools and districts to pass the “proficiency gap” test without actually doing so.
1. First, there is a modest 1.25-point “grace” amount that results in a school or district earning a “Met Target” grade if the actual CPI is within 1.25 points of the target.
2. Second, there is an exemption to the “proficiency gap” test if the CPI of the group being measured is 90th percentile or better of all students in that group. Basically there is no requirement to demonstrate improvement if a school or district is in the top 10% in the state.
3. Third, there is an exemption to the “performance gap” test if the group being measured is 80th percentile or better of al l students in the relevant grade span. However, the DESE web site does not provide this data on the Accountability reports for each district and school.
The new NCLB Waiver system incorporates a Student Growth Percentile (SGP) test that requires each group of students to achieve a minimum SGP of 51-59 or show at least a ten-point improvement over the prior year to earn a “Met Target” grade. An SGP of 60 or higher or an improved SGP of more than 15 points from the previous year earns an “Above Target” mark. There is also an achievement exemption to the student growth target requirement. Schools that reduce the percentage of non-proficient students by 10% or more from the prior year automatically earn a “Met target” grade. Schools can also earn bonus points by increasing the percentage of students scoring “Advanced” or by reducing the percentage of students scoring “Warning/Failing.” The new NCLB Waiver system also establishes and tracks a new subgroup of students called “High Needs,” which includes students with disabilities, English Language Learners and low-income students. The creation of a High Needs group replaces the previous NCLB requirement to meet achievement targets for each individual subgroup of students. This larger single pool of students allows for the possibility that a subgroup of students could progress at a below target rate as long as students in the other subgroups were making sufficient progress to offset that groups low performance. We believe it will continue to be important for the district to monitor the performance of all subgroups to ensure that no subgroup is inadvertently left behind. Another change as part of the NCLB waiver system is that Annual Yearly Progress (AYP) has been replaced by a new performance measurement called Progress and Performance Index (PPI). Annual PPI is a combined score that takes into account progress towards narrowing proficiency gaps, SGP and bonus points in English Language Arts, Mathematics and Science each year. The previous system tracked Annual Yearly Progress for Math and ELA independently. Cumulative PPI is a four-year average of the combined ELA, Math and Science scores with greater weight given to the more recent years’ performance. For a group to be considered making progress, i.e., to be considered a Level 1 School, its Cumulative PPI must be 75 or higher.

3
2012 MCAS Performance Highlights New Proficiency Gap Data Using the new more complex, multi-factor measurement system defined by the Massachusetts NCLB Waiver system the APS special education subgroup achieved “Met Target” status for Math as a result of the exemption for schools that perform in the top 10% across the state even though the actual proficiency gap widened from 2011 to 2012. Unfortunately, this subgroup of students failed to meet proficiency gap targets in both English Language Arts and Science even with all of the exemptions built into the new assessment system. The proficiency gap actually widened for students with disabilities in all three MCAS subject areas tested, which is a troubling trend. 4th Grade English Language Arts and Mathematics Student Growth Concerns The AB SpEd PAC is most concerned about the weak performance in 2012 of 4th grade special education students in both English Language Arts and Mathematics as measured by MCAS Student Growth Percentiles (SGP). Fourth grade special education students had a median English Language Arts SGP of only 35.5, which is below the state average and more than ten points below Concord and Lexington’s medians. In the three years between 2008 and 2010 the APS special education subgroup’s median SGP ranged from 41-48. The decelerated growth experienced by the special education subgroup corresponds with a similar but less steep decline experienced by all students. This parallel performance trend suggests there may be a common underlying cause for the lower growth over the last two years. However, the trend also corresponds with reduced special education spending over the last two years so it’s possible that reduced services may be a contributing factor in the more dramatic performance decline experienced by special education students. Fourth grade special education students had a median Math SGP of only 32.5 in 2012, which represents an 18-point drop from the prior year’s fourth grade subgroup. This performance is also 7.5 points below the state median for this subgroup, which we don’t believe is acceptable for a district of Acton’s caliber. In prior years the fourth grade’s Math median SGP never fell below 50.5 so this represents a significant drop in student growth. We hope the underlying cause of this sharp decline is temporary but believe it merits thorough district investigation. It appears to us that the steep decline in Math SGP among 4th grade special education students may be due largely to student performance at Douglas where Math SGP for 4th through 6th grade students declined 31 points to a median SGP of 39 in 2012. Student Growth Concerns at Douglas Special education students at Douglas experienced a sharp decline in both ELA and Math SGP scores in 2012. For grades 4 through 6 ELA Student Growth Percentiles dropped 28.5 points to a median SGP of only 25, which is abysmal. In Math students in grades 4 through 6 dropped 31 points to a median SGP of 39. We find these growth percentiles alarming but recognize that the changes are based on a relatively small number of students. That being said we believe this dramatic drop in student growth merits a thorough district investigation to identify the underlying cause(s). English Language Arts Proficiency Trends When you look at the percentage of special education students who achieve MCAS Proficiency in ELA from fourth to sixth grade across our peer districts (Concord, Lexington and Westford) an interesting trend emerges. For Concord 43% of 4th graders scored Proficient, 52% of 5th graders and 66% of 6th graders. Students in Westford and Lexington mirrored this steady upward trajectory in proficiency from 4th to 6th grade. In Westford 30% of 4th graders scored Proficient, 44% of 5th
4
graders and 60% of 6th graders. In Lexington 43% of 4th graders scored Proficient, 46% of 5th graders and 69% of 6th graders. However, in Acton the number of special education students achieving proficiency remained essentially flat from 4th to 6th grade with 47% of 4th graders, 53% of 5th graders and 52% of 6th graders scoring Proficient in 2012. By 6th grade all three of the peer districts reviewed had pulled away from Acton in terms of the percentage of special education students demonstrating proficiency in English Language Arts. This trend continues throughout junior high and high school. In 2012 78% of Acton’s 10th grade special education students demonstrated proficiency compared to Concord, Lexington and Westford where 86%, 94% and 89% of special education students respectively demonstrated ELA proficiency by 10th grade. Summary The Acton Public School district has recently implemented some positive changes to improve student outcomes including:
• Completing an in-depth MCAS analysis by learning strand in Mathematics for special education students.
• Implementing interventions and supports in Math for students at McCarthy-Towne. • Initiating embedding writing across all curriculum areas to meet new Common Core
requirements. • Putting a new emphasis on informational and persuasive writing in addition to narrative
writing. We applaud the initiatives the district has under way to improve student outcomes. However, we think more needs to be done specifically for special education students to ensure the district is on target to close the proficiency gap 50% by 2017. We respectfully submit that it might be beneficial for the district to:
• Do an in-depth MCAS analysis by learning strand in English Language Arts for special education students as well as review individual student performance to identify individual and group areas of weakness as was done in Mathematics so successfully two years ago.
• Establish a SMART Goal and put together an action plan noting explicit interventions and timelines for increasing the growth and achievement of special education students over the next 5 years to ensure all of our students are on track to meet the new NCLB waiver requirements in 2017.
• Increase collaboration and planning time between regular and special education staff to annually review and modify curriculum and teaching strategies based on the incoming class’ special education student needs.
• Introduce mandatory annual special education related professional development for regular education staff to increase teachers’ tool kits of classroom strategies and techniques.
How Have Recent Special Education Budget Cuts Impacted Student Performance? While it is impossible to provide direct evidence that the weaknesses we’re seeing in special education student growth and achievement are due to reduced resources from recent budget cuts, we are not convinced the two trends are unrelated. Our recent Acton Special Education Spending & Population Trends report noted that spending per special education student has decreased from FY 2009 to FY 2011. We note that since FY 2011 the district has made additional special education budget cuts related to special education classroom assistants – in both the overall number of assistants and compensation (i.e. hiring part-time assistants to save health insurance costs). As Dr. Mills has often stated, a “level service budget” requires increased spending to keep up with the cost

5
of inflation. Thus the absolute decrease in special education spending over the last few years reflects a larger decrease in services to special education students than the actual reduction in spending. The spending cuts don’t seem to have translated into noticeable changes in SGP or achievement for the overall special education subgroup. Math SGP has been consistently in the low to mid-50 range while ELA SGP has remained in the high-40 to low-50 range on average. The new NCLB student growth measure requires a median SGP of 51–59 for students to be considered on target to close the proficiency gap 50% by 2017. Although the overall district student growth for special education students has held up reasonably well, we are quite concerned about the unacceptably low 2012 student growth percentiles in both English Language Arts and Mathematics for fourth grade special education students. We also note the substantial volatility in growth over the years for this subgroup of students across all elementary schools. It is not uncommon for special education students to demonstrate “crashes” and “recoveries” of more than ten points from year to year as the table below indicates. We don’t understand why there should be such volatility from year to year and think the underlying cause(s) should be investigated and understood. We note that this pattern of growth volatility is consistent with a reactive “firefighting” model of intervention in which weak performance is only addressed when the “flames” become apparent. A preferable model would be a proactive, “fire prevention” model that emphasizes continual program review and improvement based on routine assessment of student performance, current research and best educational practices.
Analysis of New Proficiency Gap Data The following charts show both historical data and a projected target line to meet the new NCLB waiver system requirement of closing the “proficiency gap” 50% by 2017. This chart represents the combined performance of 4th through 6th graders. As you can see from the chart below APS special education students only achieved “Met Target” status for Math as a result of the exemption for schools that perform in the top 10% across the state even though the actual proficiency gap widened from 2011 and 2012. This is a troubling trend. This subgroup of students unfortunately failed to meet proficiency gap targets in both English Language Arts and Science even with all of the
Special Education SubgroupSGP Change >= 10 points vs. prior year
2009 2010 2011 2012ELA-‐McCarthy -‐12.5 10.5ELA -‐ Gates -‐12.5 11.0ELA -‐ Merriam -‐15.0ELA -‐ Douglas -‐14.0 11.5 -‐28.5ELA -‐ Conant 15.0 -‐27.0
Math -‐ Merriam -‐10.0Math -‐ Douglas 10.0 -‐28.0 31.0 -‐31.0Math -‐ Conant -‐15.5

6
exemptions built into the new assessment system. As you can see from the charts below, the proficiency gap widened for students with disabilities in all three MCAS subject areas tested.
Is APS Narrowing the Proficiency Gap for Special Education Students?
Analysis of English Language Arts MCAS Performance English Language Arts Student Growth Percentiles While Acton students in aggregate demonstrated acceptable progress with ELA Student Growth Percentile medians (SGP) of 54 for 4th grade, 53 for 5thgrade and 59 for 6th grade, each of these scores is the lowest of the academic peer group we reviewed (Concord, Lexington, and Westford) with the exception of Concord’s 6th grade students. Special education students received an ELA Student Growth Percentile of 35.5 for 4th grade, an SGP of 54 for 5th grade and an SGP of 53 for 6th grade. The 4th grade special education ELA SGP of 35.5 is below the state average and 10 or more points below Lexington and Concord’s special education subgroup. In Acton 4th grade ELA special education student growth has consistently lagged behind. SGP for Acton’s 4th grade subgroup has never reached 50 and has languished in the mid-30s for the last two years. We note that the special education subgroup’s ELA SGP trended the
2012 Narrowing Gap? ELA Math ScienceOn Target 50%? No No NoWithin 1.25 points? No No NoPercentile in group 75 92 83Exempt (90+)? No Yes NoPercentile in aggregate n/a n/a n/aExempt (80+)? No No NoMet Target (or better) FAIL PASS FAIL

7
same direction as the aggregate group in all grades – up in fourth and sixth grades, down in fifth grade. English Language Arts Chart The English Language Arts chart below shows Student Growth Percentiles by grade and class year for all students and for the special education subgroup. It also shows achievement and progress information including % Proficient, % Advanced and CPI for both groups. Aggregate student performance data is found on the left side of the chart and special education subgroup performance is found on the right side of the chart.
Special education student SGP scores are not available on a by grade/by school basis because of the small size of the student subgroup. As a result we are unable to directly identify how performance at the individual schools is affecting the low fourth grade ELA SGP for the special education subgroup. However, we would direct attention to Douglas based on (a) the 16-point drop in aggregate fourth grade ELA SGP and (b) the 28.5-point drop in ELA SGP experienced by the Douglas special education students in 4th through 6th grades. We believe the ELA progress demonstrated by fourth grade special education students in Acton is unacceptably low when measured against aggregate student performance and the high educational standards set by our district.

8
We are also deeply concerned about the ELA Student Growth Percentile median of 25 earned by the 27 special education students at Douglas in 2012. Their performance is 15 points below the state average for this subgroup of students, which is the lowest median SGP reported by any school in the Acton Public School system over the five years that SGP data has been available. We understand that subgroup sizes are such that performance volatility is to be expected; that the range of performance among different disabilities is wide; and that students with similar disabilities may be grouped in one school; however, we believe a one-year 28.5-point drop to a median SGP of 25 warrants School Committee attention. The chart below shows the student growth percentile change from 2011 to 2012 for each of the five elementary schools in the Acton Public School system.
We also note that the new NCLB accountability system requires each subgroup of students to achieve an SGP of 51–59 to be considered on target to close the proficiency gap 50% by 2017. The new measurement system combines low income, English language learners and special education students into a single “High Needs” subgroup. Special education students make up about 2/3rds of the new High Needs group. In 2012 the special education subgroup and the larger High Needs subgroup both reported SGP growth in excess of 50. Traditional Achievement Gap Data The following charts present the historical achievement gap trends between the aggregate student population and the special education student subgroup for English Language Arts and Mathematics from 2006 to 20012.
Special Education SubgroupSchool Summary -‐ 2012 ELA
Conant Douglas Gates McCarthy MerriamStudent Growth % 56.0 25.0 54.0 50.0 52.0Change -‐ Prior Year 20.0 -‐28.5 -‐8.0 4.0 7.0
CPI 70.4 73.0 77.9 76.8 82.5Change -‐ Prior Year -‐1.5 -‐15.6 2.2 1.4 0.1
Proficiency % > or = 43.0% 38.0% 49.0% 50.0% 53.0%Change -‐ Prior Year 2.0% -‐26.0% -‐6.0% 4.0% 4.0%
= highest in group.
0.0 = lowest in group.

9
English Language Arts Traditional Achievement Gap Scores* When you look at the traditional achievement gap in English Language Arts between the aggregate student population and students with special needs the achievement gap for the 4th grade has been essentially trendless. The 3rd grade has narrowed the achievement gap by 13 points since peaking in 2009. However, the 5th and 6th grades have increased the achievement gap by 10 and 11 points respectively since a low point in 2007.
* It’s important to note that our achievement gap charts don’t reflect the true gap between regular education students
and special education students. The gap is actually larger than shown because the aggregate student achievement numbers we’ve used include the lower special education subgroup performance. We have used the aggregate numbers because of the additional work it would take to tease out the actual data. We estimate that the actual achievement gap is probably 4-5% higher than shown in our charts.

10
Analysis of Mathematics MCAS Performance Mathematics Student Growth Percentiles In Mathematics we are concerned about the 18-point decline in the special education subgroup’s 4th grade Math SGP, which resulted in a poor median SGP of 32.5, which is 7.5 points below the state average for this student subgroup. We are also concerned about the 5th and 6th grade subgroups median SGP decline of 9 and 7 points respectively. Across the 4th, 5th and 6th grades there was a broad based decline in Math progress for special education students. This decline across all three grades mirrored a more modest aggregate student body Math SGP decline. Notwithstanding the negative trend and problematic fourth grade special education performance, the Acton Public School district’s High Needs subgroup met its NCLB growth goal with an SGP of 52. Mathematics Chart The Mathematics chart below shows Student Growth Percentiles by grade and class year for all students and for the special education subgroup. It also shows achievement and progress information including % Proficient, % Advanced and CPI for both groups. Aggregate student performance data is found on the left side of the chart and special education subgroup performance is found on the right side of the chart.

11
Acton Public School DistrictMATHEMATICS
Student Growth Percentile by Grade and Class Year
All Students Special Education
Class Year Fourth Fifth Sixth Seventh Eighth Tenth Average Class Year Fourth Fifth Sixth Seventh Eighth Tenth Average2011 54.5 54.5 2011 46 46.02012 51 63 57.0 2012 49 49 49.02013 60 44 65 56.3 2013 45 42 61.5 49.52014 63 44 53 73 58.3 2014 53 32 49 74 52.02015 61 67.5 58 53 59.9 2015 55 63.5 50 55 55.92016 65 58 68 73 50 62.8 2016 53.5 47 47 79 38.5 53.02017 66 59 72 63 65.0 2017 51 37.5 65 63 54.12018 60 66 68 64.7 2018 52 57 58 55.72019 64 65.5 64.8 2019 50.5 48 49.32020 59 59.0 2020 32.5 32.5
Average 63.8 61.9 67.7 59.6 50.2 63.9 61.2 Average 51.8 48.9 57.3 53.8 46.7 57.6 52.7
Achievement and Progress Summary
Class Year Fourth Fifth Sixth Third Fourth Fifth Sixth Class Year Fourth Fifth Sixth Third Fourth Fifth SixthActon 59 65.5 68 46% 29% 52% 60% Acton 32.5 48 58 17% 6% 18% 21%Concord 68 69 41 52% 33% 60% 42% Concord 34 63 36 10% 6% 25% 15%Lexington 67 67 50.5 58% 47% 66% 57% Lexington 55 58 49 20% 16% 23% 20%Westford 61.5 69 67 51% 34% 54% 64% Westford 34 60.5 55 11% 7% 5% 18%State 50 50 50 27% 16% 25% 27% State 40 40 41 7% 3% 5% 5%
Class Year Third Fourth Fifth Sixth Third Fourth Fifth Sixth Class Year Third Fourth Fifth Sixth Third Fourth Fifth SixthActon 82% 72% 82% 90% 93.5 89.3 93.7 95.5 Acton 41% 32% 43% 56% 82.1 65.1 75.8 82.3 Concord 86% 78% 68% 93% 94.8 90.6 94.0 93.1 Concord 53% 37% 54% 53% 80.0 70.9 79.3 79.2 Lexington 86% 83% 80% 95% 93.7 93.5 95.9 95.1 Lexington 47% 41% 52% 55% 75.0 75.0 82.1 81.0 Westford 80% 77% 96% 96% 90.9 92.2 93.8 95.9 Westford 33% 35% 43% 38% 62.2 71.8 73.9 69.4 State 61% 51% 57% 60% 80.9 79.2 78.4 80.5 State 26% 18% 20% 21% 60.2 60.0 54.6 55.9
= 2012 MCAS Results * Data for Grades 4, 5, and 6 is Acton district only. Boxborough is not included.
Grade Grade
SGP % Advanced SGP % Advanced
% Proficiency CPI % Proficiency CPI
Special Education SubgroupSchool Summary -‐ 2012 Math
2012 Math Conant Douglas Gates McCarthy MerriamStudent Growth % 49.5 39.0 65.0 53.0 56.0Change -‐ Prior Year 0.0 -‐31.0 -‐3.0 6.0 6.0
CPI 65.6 77.7 72.9 69.8 78.3Change -‐ Prior Year -‐6.8 -‐6.4 -‐3.5 2.4 -‐3.8
Proficiency % > or = 38.0% 54.0% 37.0% 39.0% 57.0%Change -‐ Prior Year -‐5.0% -‐6.0% -‐3.0% 8.0% -‐1.0%
= highest in group.0.0 = lowest in group.

12
The decline in Math SGP among special education students seems to be due to student performance at Douglas where Math SGP declined 31 points to a median SGP of 39 in 2012. Unsurprisingly, Douglas’ special education PPI and proficiency percentage also suffered material year-to-year declines as well. Mathematics Traditional Achievement Gap Scores* When you look at the achievement gap in Mathematics between the aggregate student population and students with special needs since 2006 there is a modest closing of the gap in the fourth grade. Sixth grade is essentially trendless over that period and the achievement gap has increased in third and fifth grade by 8-12 points. Overall the district’s seven-year performance is trending more negatively than positively, which suggests to us that additional Administration attention is necessary to make effective progress on the promise of “no child left behind.” Acton’s sixth grade subgroup showed the highest percentage of students Advanced and overall Proficient among the three peer districts (Concord, Lexington, and Westford) but Acton tended to lag this peer group in the three earlier grades.

13
Summary of Best Practices Literature Search The widespread acceptance of inclusion for special education students has highlighted the importance of creating appropriate learning opportunities for all students in the general education classroom. When a continuum of services, including a pullout model is available, strengthening of instruction in the general education classroom continues to be important to reduce referrals to special education, thus insuring against large caseloads, as well as to avoid fragmentation in the learning experience of special education students. These practices are also consistent with the mandate for placing students in the Least Restrictive Environment, as defined by IDEA and IDIEA. A review of the research literature and ‘best practices’ indicates that this can be done in several ways:
1. Hiring dual certified teachers who are able to address the needs of diverse students in a seamless and integrated fashion.
2. Increasing the regular education teacher’s capacity to reach a wide range of students through professional development that addresses the following:
a. An understanding of diverse learning styles b. Development of a repertoire of effective techniques for differentiating instruction c. Development of appropriate skills and strategies for infusing strategies throughout
the curriculum d. An understanding of effective behavior management techniques and e. An understanding of the link between emotions, behavior and learning
3. Creating collaborative or co-teaching teams among the staff. a. In the short-term, this provides diverse students in a single classroom with a general
education teacher who is the ‘content specialist’ and a special educator who is the ‘process specialist.’

14
b. In the long-term, when properly managed, a well-designed collaborative teaching model results in a staff where each individual teacher has a repertoire of content and process-related strategies so that each individual teacher has the capacity to address multiple needs, almost as if each teacher is ‘dual certified.’
4. Making full use of other resources including: a. Technology b. Para-professionals c. Peer-tutoring d. Home-school communication and collaboration e. Flexible groupings of students and non-categorical supports that allow students to
move between groupings on an as-needed basis 5. Proactively planning for the uniqueness of a particular cohort of students as it moves
through the grades. a. Use interdisciplinary teams including representatives from regular education, special
education, curriculum, and guidance. b. Meet once or twice a year to assess the progress and needs of high-needs and unique
populations as the curriculum progresses. c. Disseminate the information through a succinct report that targets the specific needs
of these populations as they become evident, specifies strategies that are working well, and anticipates the needs of these populations in the future.
d. Use the same interdisciplinary, proactive mindset at team meetings for individual students and when negotiating major transitions within the school system (e.g. entry into upper elementary, middle school, high school, post-secondary education).
e. When a cohort with a ‘bubble population’ is making it’s way through the system, allocate sufficient time to plan proactively for this population so that by the time teachers receive these students, they are thoroughly familiar with their needs and the plan/program for addressing those needs.
References Blednick, J. & Wilson, G.L. (2011). Teaching in Tandem: Effective Co-Teaching in the Inclusive Classroom. Eric Document 527746. Source: ASCD
Dettmer, P., Thurston, L. P., & Dyck, N. (1993). Consultation, collaboration, and teamwork for students with special needs. Boston: Allyn & Bacon Friend, M. (2008). “Co-Teaching: Creating Successful and Sustainable Programs.” Presentation for the National Association of State Directors of Special Education Satellite Conference Hocutt, A.M. (1996) “Effectiveness of Special Education: Is Placement the Critical Factor?” Special Education For Students With Disabilties Vol. 6 •No. 1 – Spring 1996 Killion, J. (2001). What works in elementary schools: Results-based staff development. Oxford, OH: National Staff Development Council.
Murawski, W.W., & Swanson, H.L. (2001) “A Meta-Analysis of Co-Teaching Research: Where

15
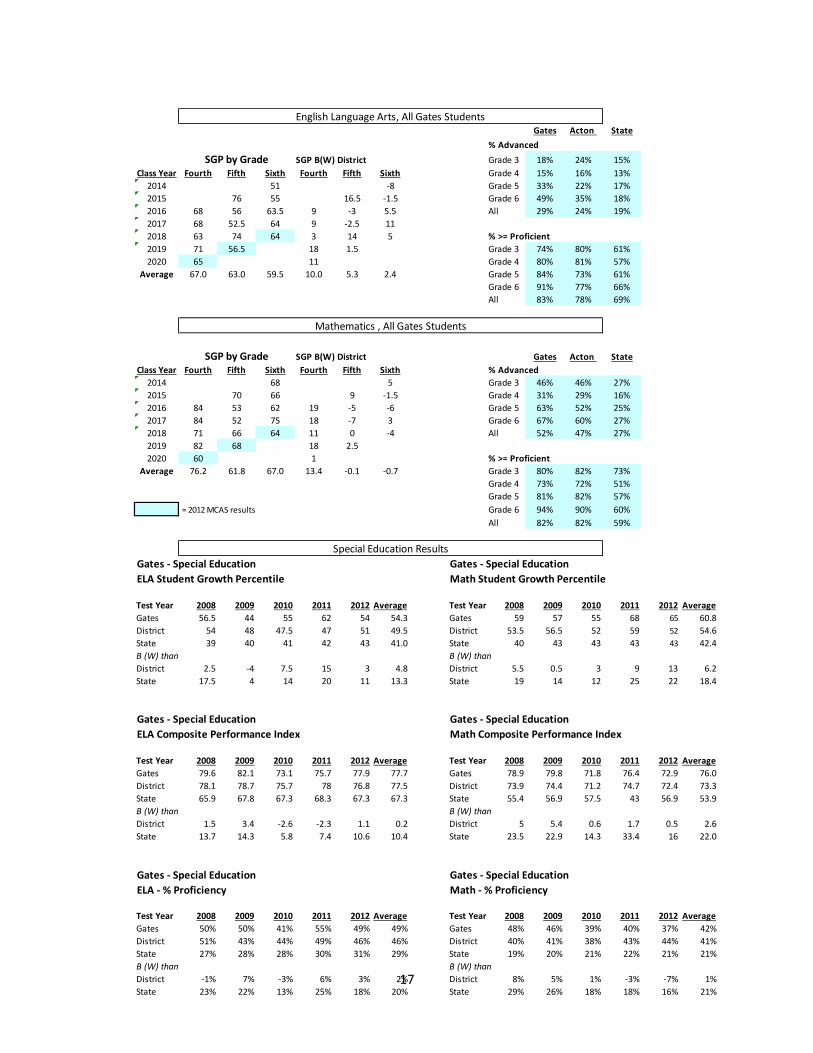
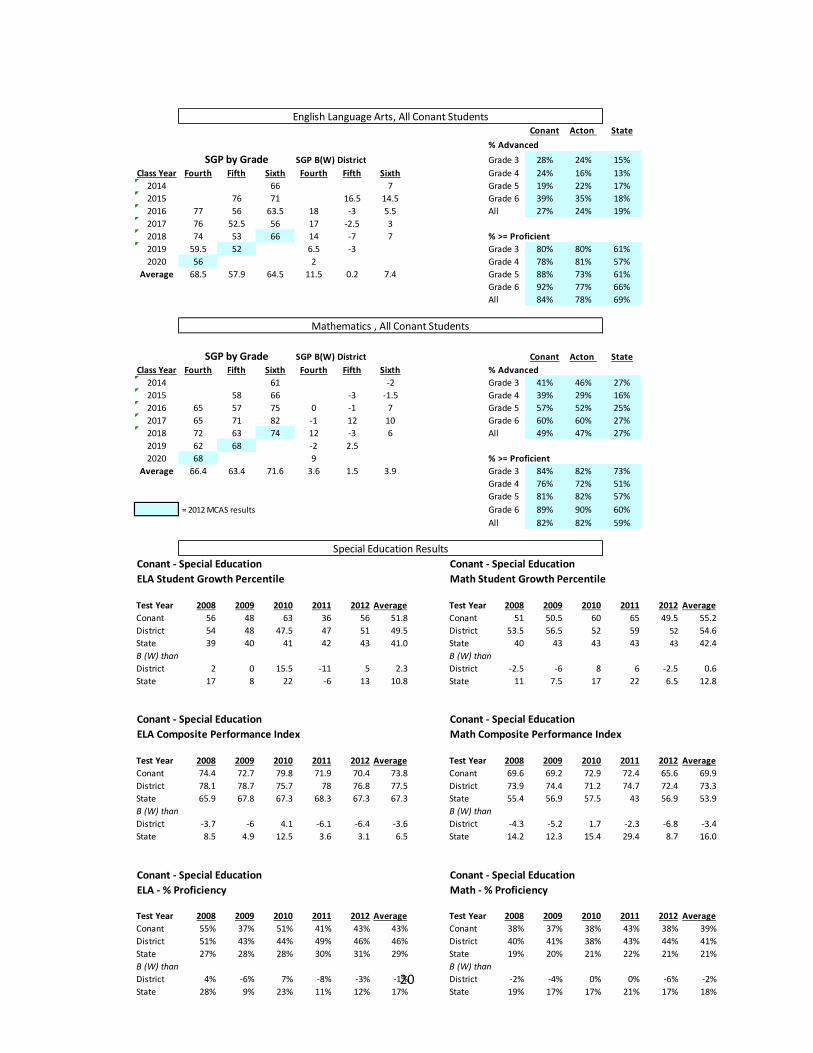
Are the Data?” Remedial and Special Education, 22(5), 258-267. Sadao, K.C., Gonsier-Gerdin, J., & Smith-Stubblefield, S. (2004). “What’s for Lunch? A Helping Professions Faculty Collaborative Model That Works.” Issues in Teacher Education, 13 (1). Scruggs, T. E., Mastropieri, M. A., & McDuffie, K. A. (2007). “Co-teaching in inclusive classrooms: A metasynthesis of qualitative research.” Exceptional Children, 73, 392-416 Addendum Individual School Charts The following charts show Student Growth Percentile data by individual school. The top half of the page shows SGP performance for all students in English Language Arts and Mathematics as well as the percent of students who scored Proficient and Advanced on MCAS. The bottom half of each page shows a more detailed breakdown of special education student performance that includes SGP, Composite Performance Index and percent of students who scored Proficient or better on MCAS. English Language Arts results are shown on the left half of the Special Education Results chart and Mathematics results are shown on the right half of that chart.

16
Douglas Acton State% AdvancedGrade 3 23% 24% 15%
Class Year Fourth Fifth Sixth Fourth Fifth Sixth Grade 4 14% 16% 13%2014 51 -‐8 Grade 5 27% 22% 17%2015 57 48 -‐2.5 -‐8.5 Grade 6 23% 35% 18%2016 57 54 48 -‐2 -‐5 -‐10 All 22% 24% 19%2017 61 57 43 2 2 -‐102018 54 69 44 -‐6 9 -‐15 % >= Proficient2019 53.5 56 0.5 1 Grade 3 81% 80% 61%2020 37.5 -‐16.5 Grade 4 71% 81% 57%
Average 52.6 58.6 46.8 -‐4.4 0.9 -‐10.3 Grade 5 88% 73% 61%Grade 6 85% 77% 66%All 81% 78% 69%
Douglas Acton StateClass Year Fourth Fifth Sixth Fourth Fifth Sixth % Advanced
2014 67 4 Grade 3 58% 46% 27%2015 74 70 13 2.5 Grade 4 22% 29% 16%2016 53 63 68 -‐12 5 0 Grade 5 65% 52% 25%2017 67 59 71.5 1 0 -‐0.5 Grade 6 48% 60% 27%2018 59 73 52 -‐1 7 -‐16 All 49% 47% 27%2019 71 78 7 12.52020 54.5 -‐4.5 % >= Proficient
Average 60.9 69.4 65.7 -‐1.9 7.5 -‐2.0 Grade 3 92% 82% 73%Grade 4 80% 72% 51%Grade 5 93% 82% 57%
= 2012 MCAS results Grade 6 89% 90% 60%All 89% 82% 59%
Douglas -‐ Special Education Douglas -‐ Special Education ELA Student Growth Percentile Math Student Growth Percentile
Test Year 2008 2009 2010 2011 2012 Average Test Year 2008 2009 2010 2011 2012 AverageDouglas 49 56 42 53.5 25 45.1 Douglas 57 67 39 70 39 54.4District 54 48 47.5 47 51 49.5 District 53.5 56.5 52 59 52 54.6State 39 40 41 42 43 41.0 State 40 43 43 43 43 42.4B (W) than B (W) thanDistrict -‐5 8 -‐5.5 6.5 -‐26 -‐4.4 District 3.5 10.5 -‐13 11 -‐13 -‐0.2State 10 16 1 11.5 -‐18 4.1 State 17 24 -‐4 27 -‐4 12
Douglas -‐ Special Education Douglas -‐ Special Education ELA Composite Performance Index Math Composite Performance Index
Test Year 2008 2009 2010 2011 2012 Average Test Year 2008 2009 2010 2011 2012 AverageDouglas 77.1 85.5 85.1 88.6 73 81.9 Douglas 73.4 78.3 70.9 84.1 77.7 76.9District 78.1 78.7 75.7 78 76.8 77.5 District 73.9 74.4 71.2 74.7 72.4 73.3State 65.9 67.8 67.3 68.3 67.3 67.3 State 55.4 56.9 57.5 43 56.9 53.9B (W) than B (W) thanDistrict -‐1 6.8 9.4 10.6 -‐3.8 4.4 District -‐0.5 3.9 -‐0.3 9.4 5.3 3.6State 11.2 17.7 17.8 20.3 5.7 14.5 State 18 21.4 13.4 41.1 20.8 22.9
Douglas -‐ Special Education Douglas -‐ Special Education ELA -‐ % Proficiency Math -‐ % Proficiency
Test Year 2008 2009 2010 2011 2012 Average Test Year 2008 2009 2010 2011 2012 AverageDouglas 45% 53% 62% 64% 38% 54% Douglas 43% 60% 44% 60% 54% 55%District 51% 43% 44% 49% 46% 46% District 40% 41% 38% 43% 44% 41%State 27% 28% 28% 30% 31% 29% State 19% 20% 21% 22% 21% 21%B (W) than B (W) thanDistrict -‐6% 10% 18% 15% -‐8% 6% District 3% 19% 6% 17% 10% 11%State 18% 25% 34% 34% 7% 24% State 24% 40% 23% 38% 33% 32%
SGP by Grade SGP B(W) District
Special Education Results
English Language Arts, All Douglas Students
SGP by Grade SGP B(W) District
Mathematics , All Douglas Students
17
Gates Acton State% AdvancedGrade 3 18% 24% 15%
Class Year Fourth Fifth Sixth Fourth Fifth Sixth Grade 4 15% 16% 13%2014 51 -‐8 Grade 5 33% 22% 17%2015 76 55 16.5 -‐1.5 Grade 6 49% 35% 18%2016 68 56 63.5 9 -‐3 5.5 All 29% 24% 19%2017 68 52.5 64 9 -‐2.5 112018 63 74 64 3 14 5 % >= Proficient2019 71 56.5 18 1.5 Grade 3 74% 80% 61%2020 65 11 Grade 4 80% 81% 57%
Average 67.0 63.0 59.5 10.0 5.3 2.4 Grade 5 84% 73% 61%Grade 6 91% 77% 66%All 83% 78% 69%
Gates Acton StateClass Year Fourth Fifth Sixth Fourth Fifth Sixth % Advanced
2014 68 5 Grade 3 46% 46% 27%2015 70 66 9 -‐1.5 Grade 4 31% 29% 16%2016 84 53 62 19 -‐5 -‐6 Grade 5 63% 52% 25%2017 84 52 75 18 -‐7 3 Grade 6 67% 60% 27%2018 71 66 64 11 0 -‐4 All 52% 47% 27%2019 82 68 18 2.52020 60 1 % >= Proficient
Average 76.2 61.8 67.0 13.4 -‐0.1 -‐0.7 Grade 3 80% 82% 73%Grade 4 73% 72% 51%Grade 5 81% 82% 57%
= 2012 MCAS results Grade 6 94% 90% 60%All 82% 82% 59%
Gates -‐ Special Education Gates -‐ Special Education ELA Student Growth Percentile Math Student Growth Percentile
Test Year 2008 2009 2010 2011 2012 Average Test Year 2008 2009 2010 2011 2012 AverageGates 56.5 44 55 62 54 54.3 Gates 59 57 55 68 65 60.8District 54 48 47.5 47 51 49.5 District 53.5 56.5 52 59 52 54.6State 39 40 41 42 43 41.0 State 40 43 43 43 43 42.4B (W) than B (W) thanDistrict 2.5 -‐4 7.5 15 3 4.8 District 5.5 0.5 3 9 13 6.2State 17.5 4 14 20 11 13.3 State 19 14 12 25 22 18.4
Gates -‐ Special Education Gates -‐ Special Education ELA Composite Performance Index Math Composite Performance Index
Test Year 2008 2009 2010 2011 2012 Average Test Year 2008 2009 2010 2011 2012 AverageGates 79.6 82.1 73.1 75.7 77.9 77.7 Gates 78.9 79.8 71.8 76.4 72.9 76.0District 78.1 78.7 75.7 78 76.8 77.5 District 73.9 74.4 71.2 74.7 72.4 73.3State 65.9 67.8 67.3 68.3 67.3 67.3 State 55.4 56.9 57.5 43 56.9 53.9B (W) than B (W) thanDistrict 1.5 3.4 -‐2.6 -‐2.3 1.1 0.2 District 5 5.4 0.6 1.7 0.5 2.6State 13.7 14.3 5.8 7.4 10.6 10.4 State 23.5 22.9 14.3 33.4 16 22.0
Gates -‐ Special Education Gates -‐ Special Education ELA -‐ % Proficiency Math -‐ % Proficiency
Test Year 2008 2009 2010 2011 2012 Average Test Year 2008 2009 2010 2011 2012 AverageGates 50% 50% 41% 55% 49% 49% Gates 48% 46% 39% 40% 37% 42%District 51% 43% 44% 49% 46% 46% District 40% 41% 38% 43% 44% 41%State 27% 28% 28% 30% 31% 29% State 19% 20% 21% 22% 21% 21%B (W) than B (W) thanDistrict -‐1% 7% -‐3% 6% 3% 2% District 8% 5% 1% -‐3% -‐7% 1%State 23% 22% 13% 25% 18% 20% State 29% 26% 18% 18% 16% 21%
English Language Arts, All Gates Students
SGP by Grade
Mathematics , All Gates Students
SGP by Grade
Special Education Results
SGP B(W) District
SGP B(W) District

18
Merriam Acton State% AdvancedGrade 3 25% 24% 15%
Class Year Fourth Fifth Sixth Fourth Fifth Sixth Grade 4 5% 16% 13%2014 67 8 Grade 5 16% 22% 17%2015 67.5 62 8 5.5 Grade 6 38% 35% 18%2016 47.5 62.5 56 -‐11.5 3.5 -‐2 All 23% 24% 19%2017 28.5 57.5 54 -‐30.5 2.5 12018 57 54 60 -‐3 -‐6 1 % >= Proficient2019 38 57 -‐15 2 Grade 3 81% 80% 61%2020 50 -‐4 Grade 4 64% 81% 57%
Average 44.2 59.7 59.8 -‐12.8 2.0 2.7 Grade 5 80% 73% 61%Grade 6 88% 77% 66%All 80% 78% 69%
Merriam Acton StateClass Year Fourth Fifth Sixth Fourth Fifth Sixth % Advanced
2014 67 4 Grade 3 49% 46% 27%2015 74 70 13 2.5 Grade 4 37% 29% 16%2016 53 63 68 -‐12 5 0 Grade 5 51% 52% 25%2017 67 59 61 1 0 -‐11 Grade 6 68% 60% 27%2018 59 74 63 -‐1 8 -‐5 All 51% 47% 27%2019 61.5 67 -‐2.5 1.52020 61 2 % >= Proficient
Average 60.3 67.4 65.8 -‐2.5 5.5 -‐1.9 Grade 3 84% 82% 73%Grade 4 79% 72% 51%Grade 5 88% 82% 57%
= 2012 MCAS results Grade 6 90% 90% 60%All 85% 82% 59%
Merriam -‐ Special Education Merriam -‐ Special Education ELA Student Growth Percentile Math Student Growth Percentile
Test Year 2008 2009 2010 2011 2012 Average Test Year 2008 2009 2010 2011 2012 AverageMerriam 65 58 43 45 52 52.6 Merriam 60 50 57 50 56 54.6District 54 48 47.5 47 51 49.5 District 53.5 56.5 52 59 52 54.6State 39 40 41 42 43 41.0 State 40 43 43 43 43 42.4B (W) than B (W) thanDistrict 11 10 -‐4.5 -‐2 1 3.1 District 6.5 -‐6.5 5 -‐9 4 0State 26 18 2 3 9 11.6 State 20 7 14 7 13 12.2
Merriam -‐ Special Education Merriam -‐ Special Education ELA Composite Performance Index Math Composite Performance Index
Test Year 2008 2009 2010 2011 2012 Average Test Year 2008 2009 2010 2011 2012 AverageMerriam 85.6 82.3 74.1 82.4 82.5 81.4 Merriam 76.9 80 75.9 82.1 78.3 78.6District 78.1 78.7 75.7 78 76.8 77.5 District 73.9 74.4 71.2 74.7 72.4 73.3State 65.9 67.8 67.3 68.3 67.3 67.3 State 55.4 56.9 57.5 43 56.9 53.9B (W) than B (W) thanDistrict 7.5 3.6 -‐1.6 4.4 5.7 3.9 District 3 5.6 4.7 7.4 5.9 5.3State 19.7 14.5 6.8 14.1 15.2 14.1 State 21.5 23.1 18.4 39.1 21.4 24.7
Merriam -‐ Special Education Merriam -‐ Special Education ELA -‐ % Proficiency Math -‐ % Proficiency
Test Year 2008 2009 2010 2011 2012 Average Test Year 2008 2009 2010 2011 2012 AverageMerriam 60% 49% 44% 49% 53% 49% Merriam 46% 43% 41% 58% 57% 49%District 51% 43% 44% 49% 46% 46% District 40% 41% 38% 43% 44% 41%State 27% 28% 28% 30% 31% 29% State 19% 20% 21% 22% 21% 21%B (W) than B (W) thanDistrict 9% 6% 0% 0% 7% 4% District 6% 2% 3% 15% 13% 8%State 33% 21% 16% 19% 22% 22% State 27% 23% 20% 36% 36% 28%
SGP by Grade SGP B(W) District
Special Education Results
English Language Arts, All Merriam Students
SGP by Grade SGP B(W) District
Mathematics , All Merriam Students

19
McCarthy Acton State% AdvancedGrade 3 26% 24% 15%
Class Year Fourth Fifth Sixth Fourth Fifth Sixth Grade 4 14% 16% 13%2014 58 -‐1 Grade 5 16% 22% 17%2015 34 50 -‐25.5 -‐6.5 Grade 6 27% 35% 18%2016 59 46 44 0 -‐13 -‐14 All 21% 24% 19%2017 60 44 47 1 -‐11 -‐62018 55 45.5 57 -‐5 -‐14.5 -‐2 % >= Proficient2019 49 51 -‐4 -‐4 Grade 3 82% 80% 61%2020 44 -‐10 Grade 4 71% 81% 57%
Average 53.4 44.1 51.2 -‐3.6 -‐13.6 -‐5.9 Grade 5 75% 73% 61%Grade 6 87% 77% 66%All 79% 78% 69%
McCarthy Acton StateClass Year Fourth Fifth Sixth Fourth Fifth Sixth % Advanced
2014 70 7 Grade 3 33% 46% 27%2015 74 73 13 5.5 Grade 4 18% 29% 16%2016 53 63 75 -‐12 5 7 Grade 5 22% 52% 25%2017 67 59 76 1 0 4 Grade 6 59% 60% 27%2018 59 47.5 77 -‐1 -‐18.5 9 All 34% 47% 27%2019 38 40 -‐26 -‐25.52020 47.5 -‐11.5 % >= Proficient
Average 52.9 56.7 74.2 -‐9.9 -‐5.2 6.5 Grade 3 73% 82% 73%Grade 4 50% 72% 51%Grade 5 69% 82% 57%
= 2012 MCAS results Grade 6 90% 90% 60%All 71% 82% 59%
McCarthy Towne -‐ Special Education McCarthy Towne -‐ Special Education ELA Student Growth Percentile Math Student Growth Percentile
Test Year 2008 2009 2010 2011 2012 Average Test Year 2008 2009 2010 2011 2012 AverageMcCarthy 39.5 27 35.5 46 50 39.6 McCarthy 50 51 48 47 53 49.8District 54 48 47.5 47 51 49.5 District 53.5 56.5 52 59 52 54.6State 39 40 41 42 43 41.0 State 40 43 43 43 43 42.4B (W) than B (W) thanDistrict -‐14.5 -‐21 -‐12 -‐1 -‐1 -‐9.9 District -‐3.5 -‐5.5 -‐4 -‐12 1 -‐4.8State 0.5 -‐13 -‐5.5 4 7 -‐1.4 State 10 8 5 4 10 7.4
McCarthy Towne -‐ Special Education McCarthy Towne -‐ Special Education ELA Composite Performance Index Math Composite Performance Index
Test Year 2008 2009 2010 2011 2012 Average Test Year 2008 2009 2010 2011 2012 AverageMcCarthy 73.2 76 73.4 75.4 76.8 75.0 McCarthy 73.2 68.3 67.6 67.4 69.8 69.3District 78.1 78.7 75.7 78 76.8 77.5 District 73.9 74.4 71.2 74.7 72.4 73.3State 65.9 67.8 67.3 68.3 67.3 67.3 State 55.4 56.9 57.5 43 56.9 53.9B (W) than B (W) thanDistrict -‐4.9 -‐2.7 -‐2.3 -‐2.6 0 -‐2.5 District -‐0.7 -‐6.1 -‐3.6 -‐7.3 -‐2.6 -‐4.1State 7.3 8.2 6.1 7.1 9.5 7.6 State 17.8 11.4 10.1 24.4 12.9 15.3
McCarthy Towne -‐ Special Education McCarthy Towne -‐ Special Education ELA -‐ % Proficiency Math -‐ % Proficiency
Test Year 2008 2009 2010 2011 2012 Average Test Year 2008 2009 2010 2011 2012 AverageMcCarthy 51% 39% 39% 46% 50% 44% McCarthy 42% 31% 39% 31% 39% 35%District 51% 43% 44% 49% 46% 46% District 40% 41% 38% 43% 44% 41%State 27% 28% 28% 30% 31% 29% State 19% 20% 21% 22% 21% 21%B (W) than B (W) thanDistrict 0% -‐4% -‐5% -‐3% 4% -‐2% District 2% -‐10% 1% -‐12% -‐5% -‐5%State 24% 11% 11% 16% 19% 16% State 23% 11% 18% 9% 18% 16%
SGP by Grade SGP B(W) District
Special Education Results
English Language Arts, All McCarthy Towne Students
SGP by Grade SGP B(W) District
Mathematics , All McCarthy Towne Students
20
Conant Acton State% AdvancedGrade 3 28% 24% 15%
Class Year Fourth Fifth Sixth Fourth Fifth Sixth Grade 4 24% 16% 13%2014 66 7 Grade 5 19% 22% 17%2015 76 71 16.5 14.5 Grade 6 39% 35% 18%2016 77 56 63.5 18 -‐3 5.5 All 27% 24% 19%2017 76 52.5 56 17 -‐2.5 32018 74 53 66 14 -‐7 7 % >= Proficient2019 59.5 52 6.5 -‐3 Grade 3 80% 80% 61%2020 56 2 Grade 4 78% 81% 57%
Average 68.5 57.9 64.5 11.5 0.2 7.4 Grade 5 88% 73% 61%Grade 6 92% 77% 66%All 84% 78% 69%
Conant Acton StateClass Year Fourth Fifth Sixth Fourth Fifth Sixth % Advanced
2014 61 -‐2 Grade 3 41% 46% 27%2015 58 66 -‐3 -‐1.5 Grade 4 39% 29% 16%2016 65 57 75 0 -‐1 7 Grade 5 57% 52% 25%2017 65 71 82 -‐1 12 10 Grade 6 60% 60% 27%2018 72 63 74 12 -‐3 6 All 49% 47% 27%2019 62 68 -‐2 2.52020 68 9 % >= Proficient
Average 66.4 63.4 71.6 3.6 1.5 3.9 Grade 3 84% 82% 73%Grade 4 76% 72% 51%Grade 5 81% 82% 57%
= 2012 MCAS results Grade 6 89% 90% 60%All 82% 82% 59%
Conant -‐ Special Education Conant -‐ Special Education ELA Student Growth Percentile Math Student Growth Percentile
Test Year 2008 2009 2010 2011 2012 Average Test Year 2008 2009 2010 2011 2012 AverageConant 56 48 63 36 56 51.8 Conant 51 50.5 60 65 49.5 55.2District 54 48 47.5 47 51 49.5 District 53.5 56.5 52 59 52 54.6State 39 40 41 42 43 41.0 State 40 43 43 43 43 42.4B (W) than B (W) thanDistrict 2 0 15.5 -‐11 5 2.3 District -‐2.5 -‐6 8 6 -‐2.5 0.6State 17 8 22 -‐6 13 10.8 State 11 7.5 17 22 6.5 12.8
Conant -‐ Special Education Conant -‐ Special Education ELA Composite Performance Index Math Composite Performance Index
Test Year 2008 2009 2010 2011 2012 Average Test Year 2008 2009 2010 2011 2012 AverageConant 74.4 72.7 79.8 71.9 70.4 73.8 Conant 69.6 69.2 72.9 72.4 65.6 69.9District 78.1 78.7 75.7 78 76.8 77.5 District 73.9 74.4 71.2 74.7 72.4 73.3State 65.9 67.8 67.3 68.3 67.3 67.3 State 55.4 56.9 57.5 43 56.9 53.9B (W) than B (W) thanDistrict -‐3.7 -‐6 4.1 -‐6.1 -‐6.4 -‐3.6 District -‐4.3 -‐5.2 1.7 -‐2.3 -‐6.8 -‐3.4State 8.5 4.9 12.5 3.6 3.1 6.5 State 14.2 12.3 15.4 29.4 8.7 16.0
Conant -‐ Special Education Conant -‐ Special Education ELA -‐ % Proficiency Math -‐ % Proficiency
Test Year 2008 2009 2010 2011 2012 Average Test Year 2008 2009 2010 2011 2012 AverageConant 55% 37% 51% 41% 43% 43% Conant 38% 37% 38% 43% 38% 39%District 51% 43% 44% 49% 46% 46% District 40% 41% 38% 43% 44% 41%State 27% 28% 28% 30% 31% 29% State 19% 20% 21% 22% 21% 21%B (W) than B (W) thanDistrict 4% -‐6% 7% -‐8% -‐3% -‐1% District -‐2% -‐4% 0% 0% -‐6% -‐2%State 28% 9% 23% 11% 12% 17% State 19% 17% 17% 21% 17% 18%
SGP by Grade SGP B(W) District
Special Education Results
English Language Arts, All Conant Students
SGP by Grade SGP B(W) District
Mathematics , All Conant Students