a flat-panel detector based micro-ct system:...
TRANSCRIPT

INSTITUTE OF PHYSICS PUBLISHING PHYSICS IN MEDICINE AND BIOLOGY
Phys. Med. Biol. 48 (2003) 4173–4185 PII: S0031-9155(03)67430-0
A flat-panel detector based micro-CT system:performance evaluation for small-animal imaging
Sang Chul Lee, Ho Kyung Kim, In Kon Chun, Myung Hye Cho,Soo Yeol Lee and Min Hyoung Cho
Graduate School of East–West Medical Science, Kyung Hee University, 1 Seochun, Kiheung,Yongin, Kyungki 449-701, Korea
E-mail: [email protected]
Received 12 August 2003, in final form 20 October 2003Published 5 December 2003Online at stacks.iop.org/PMB/48/4173
AbstractA dedicated small-animal x-ray micro computed tomography (micro-CT)system has been developed to screen laboratory small animals such as mice andrats. The micro-CT system consists of an indirect-detection flat-panel x-raydetector with a field-of-view of 120 × 120 mm2, a microfocus x-ray source, arotational subject holder and a parallel data processing system. The flat-paneldetector is based on a matrix-addressed photodiode array fabricated by a CMOS(complementary metal-oxide semiconductor) process coupled to a CsI:Tl(thallium-doped caesium iodide) scintillator as an x-ray-to-light converter.Principal imaging performances of the micro-CT system have been evaluatedin terms of image uniformity, voxel noise and spatial resolution. It has beenfound that the image non-uniformity mainly comes from the structural non-uniform sensitivity pattern of the flat-panel detector and the voxel noise is about48 CT numbers at the voxel size of 100 × 100 × 200 µm3 and the air kermaof 286 mGy. When the magnification ratio is 2, the spatial resolution of themicro-CT system is about 14 lp/mm (line pairs per millimetre) that is almostdetermined by the flat-panel detector showing about 7 lp/mm resolving power.Through low-contrast phantom imaging studies, the minimum resolvablecontrast has been found to be less than 36 CT numbers at the air kerma of95 mGy. Some laboratory rat imaging results are presented.
1. Introduction
Recently, there have been rapid developments in small-animal imaging technology to screengenetically engineered small animals in developing new drugs or new diagnosis/therapymethods (Massoud and Gambhir 2003, Pomper 2001, Weissleder and Mahmood 2001).Among the newly developed small-animal imaging modalities, micro computed tomography
0031-9155/03/244173+13$30.00 © 2003 IOP Publishing Ltd Printed in the UK 4173

4174 S C Lee et al
(micro-CT) is believed to have great potential for accurate measurement of organ anatomyin a minimally invasive way (Jorgensen et al 1998, Paulus et al 1999, Wan et al 2000). It isof paramount importance in genomics to screen genetically engineered small animals in aminimally invasive way since longitudinal studies through the lifetime of the small animalsare essential in the investigation of new drug/therapy effects with human disease models(Paulus et al 2000, Ritman 2002). Although micro-CTs have inherent limitation in signal-to-noise ratio (SNR) performance due to their small voxel size and low x-ray exposure level, amicro-CT can be effectively used to scan the bony structures of a small animal. If motionartefact reduction technologies can be incorporated to tackle the problems caused by the longscan time of a micro-CT, soft tissue and micro vessel imaging seems to be possible with theaid of contrast agents. On the other hand, a micro-CT can be combined with a mini-PET toprovide attenuation correction information as well as anatomical details.
In early micro-CT systems, x-ray image intensifiers (XRIIs) were frequently used forx-ray detection (Holdsworth et al 1993). A cooled CCD coupled to a scintillating plate viaan optical taper is now known to be the most sensitive among the currently available x-raydetection methods (Wang and Vannier 2001). However, it is very difficult to make a large-areadetector using cooled CCD technology aside from its high cost. To enlarge the detection area,multiple CCD technology with a scintillating plate coupled to them through multiple opticaltapers has also been introduced (Ouandji et al 2002). Although the multiple CCD technologyis capable of highly sensitive x-ray detection, it seems that the technology may not be widelyadopted until the high cost problem is mitigated to some extent.
A large-area flat-panel detector, based on an amorphous silicon (a-Si) photodiode arrayin conjunction with a scintillating plate, has been used in a cone-beam x-ray CT systemdesigned for image-guided radiotherapy (Jaffray and Siewerdsen 2000) and angiographyimaging (Ning et al 2000). Although a-Si flat-panel detectors have many advantages suchas large-area detection, thin structure, no geometrical distortions and veiling glares (Kim et al2003, Ning et al 2000), there are still some technical problems including large pixel size andimage lag in applying a-Si flat-panel detectors to a micro-CT for small-animal imaging. Ana-Si flat-panel detector having a pixel pitch down to 97 µm has been reported, but the pixel fillfactor is only ∼45% giving rise to large signal loss (Jee et al 2003). In addition, a-Si flat-paneldetectors have image lag in some degree because of the heavy density of charge traps (e.g.,dangling bonds in amorphous structures) although the effects of the image lag may not beserious in typical applications (Siewerdsen and Jaffray 1999a, 1999b).
In the development of micro-CT for small-animal imaging, we have used a flat-paneldetector in which a matrix-addressed CMOS photodiode array is used to read optical photonsemitted from the overlaid CsI:Tl scintillator. The detector has a pixel pitch of 50 µm with afill factor as high as ∼80% and a field-of-view (FOV) of 120 × 120 mm2. In this paper, wedescribe the design of a micro-CT system and the evaluation of its imaging performance interms of image uniformity, voxel noise, contrast-to-noise behaviour and spatial resolution. Inaddition, some postmortem laboratory rat imaging and extracted rat organ imaging results arepresented.
2. The prototype micro-CT system
2.1. Overview of the prototype micro-CT system
A schematic diagram of the developed cone-beam micro-CT system is shown in figure 1.The micro-CT system consists of a microfocus x-ray source, a rotational subject holder, an

Flat-panel detector based micro-CT system 4175
Figure 1. Schematic diagram of the developed micro-CT system. The microfocus x-ray sourcecontinuously irradiates a subject, which is rotated in a constant angular velocity, and the flat-paneldetector acquires 2D projection data at a given integration time. The angular velocity and theintegration time are computer controlled. The source-to-object distance (SOD) and source-to-detector distance (SDD) determine the system geometric parameters such as magnification ratio,cone-beam angle (φ1 and φ2) and field-of-view (FOV) of a subject.
indirect-detection CMOS flat-panel detector and a parallel data processing system. All thecomponents except the data processing system are mounted on an optical bench. The source-to-subject (or object) and source-to-detector distances, shortly SOD and SDD respectively, arevariables determining the imaging parameters such as magnification ratio, cone-beam angles(φ1 and φ2) and FOV. In this study, the SDD was set to 492 mm, and we controlled theSOD with a computer-controlled translation system with an accuracy of 10 µm to change theimaging parameters. A computer-controlled rotation system was also adopted in the subjectholder to achieve a cone-beam mode scan in the micro-CT system. The precision of therotational motion is 0.083◦. The axis-of-rotation (AOR) was positioned on the line connectingthe x-ray focal spot and the centre of the detector plane in two steps. In the first step, twoprojection data of a thin wire were acquired at two opposing view angles and the AOR was soadjusted that the two projection data coincided with each other. In the second step, the AORwas adjusted in the image reconstruction procedure in sub-pixel level. That is, the projectiondata were shifted by one-tenth of a pixel width until the shifted projection data made the mostclear-cut wire images. In the simulation studies, we have found that the angle-offset errorcaused by misadjustment of less than one-fifth of the pixel width (0.2 × 10⁻⁴ rad when SDD is492 mm) gives no notable resolution degradation.
The microfocus x-ray source (L8121-01, Hamamatsu, Japan) is a sealed tube with a fixedtungsten anode having an angle of 25◦ with the electron beam and with a 200 µm thickberyllium exit window. The emitted x-ray beam angle is approximately 43◦. The sourcehas a variable focal spot size from 5 µm to 50 µm depending on the applied tube power(Watt or kVp × mA). The maximum tube voltage and tube current are 150 kVp and 500 µA,respectively. Although the dominant L-edge lines around 10 keV emitted by the tungsten

4176 S C Lee et al
Table 1. Specification of the flat-panel detector. The detector consists of a scintillating plate anda readout photodiode array.
CMOS photodiode arrayArray format 2400 × 2400Pixel pitch 50 µmActive area 120 ×120 mm2
Pixel fill factor 79%Maximum frame speed 2 frames per secondADC bit depth 12 bitAmplifier gain 8.6 ×10⁻¹⁷ C/ADUSaturation charge 2.2 ×10⁶ electronsNoise 1100 electronsDynamic range 66 dB
ScintillatorMaterial Columnar structured CsI:TlThickness 200 µmPacking density ∼80%
target may give a better contrast in soft tissues of small animals, an additional filtration with a1 mm thick aluminium plate has been employed in order to reduce the radiation dose inside asmall-animal subject (Paulus et al 2000). The microfocus x-ray source has been operated incontinuous mode without any shutters. Since the x-ray source continuously irradiates and theflat-panel detector is periodically read out line-by-line in a given frame time, the deviation inthe integration time of every line in the detector is negligibly small.
2.2. CMOS flat-panel detector
A commercially available flat-panel detector (C7942, Hamamatsu, Japan) has been used asthe 2D digital x-ray imager in the micro-CT system. The flat-panel detector consists of a2400 × 2400 active matrix of transistors and photodiodes with a pixel pitch of 50 µm and aCsI:Tl scintillator. The optical photons, emitted from CsI:Tl when irradiated by x-rays, havea peak spectrum at about 560 nm (or ∼2.2 eV in equivalent energy), and they are convertedto electrical charges in the readout photodiode array. The detector was fabricated with theCMOS process capable of a submicron line width resolution (Mori et al 2001). The pixel fillfactor is 79%, in spite of the small pixel size of 50 µm, which would be hardly achievablewith a-Si technology. The CsI:Tl has a columnar structure with a typical diameter of about10 µm and the thickness of 200 µm. The detailed specification of the detector is givenin table 1.
Among the characteristics of flat-panel detectors, spatial resolution and image lag ofdetectors are very important in the development of a micro-CT. Image lag means a carryoverof the image signal at a frame to the next frame. Through the measurement of modulationtransfer function (MTF) based on the slant-slit method (Fujita et al 1992), it has been foundthat the detector has about 7 lp/mm resolving power at 10% of MTF as shown in figure 2. Atthe MTF measurement, an image of a 10 µm wide slit (IIE GmbH, Aachen, Germany) slantedby 2.2◦ to the horizontal axis was obtained with the x-ray source operating at 60 kVp and 1 mmthick aluminium filtration. It has been found that the detector MTF is mainly governed by theoptical photon spreading in the CsI:Tl layer. By observing residual image signals appearing atthe detector after a single-shot x-ray exposure, we have measured the image lag characteristics

Flat-panel detector based micro-CT system 4177
Figure 2. The measured MTF curve (square) and the estimated MTF curve at a magnificationratio of two (dotted line) of the detector. The MTF curve of the micro-CT system measured withthe thin aluminium foil phantom (circle). The predicted MTF curve of the micro-CT (solid line) isalso shown to account for the physical parameters affecting the system MTF such as the focal spotsize, the magnification ratio, the detector MTF and the reconstruction algorithm.
Figure 3. The image lags with respect to the elapsed time for three different frame integrationtimes.
of the detector at three different frame times (or integration times). The nth frame image lagsignal was defined as the ratio of the average image signal value at the nth frame after thesingle-shot exposure to the one during the exposure. Each average pixel signal value wascorrected by the detector offset-signal. The first frame image lag is about 0.25% even inthe very long frame time, Tframe = 5 s, as shown in figure 3. This is less than one-tenth of thereported data of 2–10% in the a-Si flat-panel detector (Siewerdsen and Jaffray 1999a). TheMTF and image lag measurement results suggest that the CMOS flat-panel detector is verypromising for a small-animal imaging micro-CT.

4178 S C Lee et al
2.3. Image reconstruction
Since the cone-beam image reconstruction algorithm is computationally intensive (Carlsson1999) and a micro-CT with a flat-panel detector makes massive projection data, it is desirableto use a parallel data processing system to speed up image reconstructions. To realize a paralleldata processing system, we have linked four personal computers, each one equipped with dualCPUs (Athlon MP 2200+, AMD, USA), by 100 Mbps Ethernet and assigned evenly dividedtasks to each of the eight CPUs. One of the four computers was chosen as a host computerand the host computer controls the whole micro-CT system. The host computer also acquiresx-ray projection data through a frame grabber and sends the data to the other computers. Theoperating system of the computers is Microsoft Windows 2000 supporting dual CPUs andmulti-thread processing. The projection data are sent to each computer every four views.During the scan, each computer performs pre-processing, such as base-line removal and badpixel corrections and projection data filtering. Each computer also performs back-projectionof one-fourth of the whole projection data. After back-projections are completed, the partlyreconstructed images are combined to form final images in the host computer.
3. Performance evaluation methods in micro-CT imaging
Most measurements for the performance evaluation were performed with the x-ray sourceoperating at 60 kVp and 1 mm Al filtration. Spatial resolution was measured in the smallfocal spot mode (5 µm) and other performances were measured in the large focal spot mode(50 µm) of the x-ray source. Typical magnification ratio was about 2. Radiation doses,addressed in the study, are based on the exposure measurement in air at the AOR with acalibrated ion chamber (Victoreen 6000-528, Inovision, USA). To take into account the dose,the measured exposure has been converted to the air kerma with the exposure-to-air kermaconversion factor 8.767 mGy/R at the x-ray spectrum of 60 kVp (Boone 2000). The frametime of the flat-panel detector to acquire a view of projection data has been kept constant atabout 250 ms all over the CT scans. The number of views then determines the total scantime and dose level as well as angular spatial resolution. The minimum number of views wasdetermined not to have any noticeable streak artefact in the reconstructed image. To get betterSNR in the reconstructed images, we used a larger number of views keeping the integrationtime constant. Typical voxel volume and image format of the reconstructed images are100 × 100 × 200 µm3 and 512 × 512, respectively. For all the image reconstructions in thisstudy, the Ram–Lak filter was used for filtering the projection data before backprojections(Ramachandran and Lakshiminnarayanan 1971). The Ram–Lak filter function is given by |ω|within the bandwidth and zero elsewhere where ω is the spatial frequency in the directionperpendicular to the projection rays. The Ram–Lak filter is known to be suitable for highresolution imaging since it tends to keep the high spatial frequency components.
3.1. Image uniformity and noise characteristics
Image uniformity in a micro-CT is largely dependent on the detector uniformity and the beamhardening effect. Even though the detector non-uniformity can be corrected in principleby using the pre-scan data obtained without any subjects between the x-ray source and thedetector (Tang et al 2001), the detector noise and the time-dependent nature of the detectorsensitivity could cause non-uniform intensity distribution in the reconstructed image. Toevaluate the image uniformity, we have used a cylindrical phantom filled with water asshown in figure 4(a). After reconstructing three-dimensional (3D) images, we evaluated the

Flat-panel detector based micro-CT system 4179
Figure 4. The phantoms used in the performance evaluation of the developed micro-CT system.(a) The uniformity phantom: a water-filled cylindrical acrylic vessel for evaluating uniformity aswell as noise characteristics. (b) The contrast phantom: six low-contrast inserts are immersed inwater inside a cylindrical acrylic vessel. The physical properties of the inserts are summarized intable 2. (c) The resolution phantom: an 18 µm thick aluminium foil overlaid on an acrylic plate.The line spread response of the micro-CT system is obtained from the cross-sectional images ofthe foil at the channel region.
uniformity response by examining the radial and z-directional profiles of the reconstructedvolume image. Characteristics of the voxel noise were analysed by investigating the standarddeviation of the 3D images of the uniformity phantom. The radiation dose dependence of thevoxel noise was also investigated.
3.2. Contrast
Based on the noise characteristics of the uniformity phantom, we have tested low-contrastvisibility using a contrast phantom shown in figure 4(b). The contrast phantom consists ofsix inserts whose physical densities are similar to that of water. The six inserts with 5 mmdiameter were immersed in a water bath made of a 40 mm diameter acrylic cylinder. The insertswere made of commercial electron density phantoms (Model 76-430, Nuclear Associates, NY,USA). Physical properties of the six inserts are shown in table 2. The contrast phantom wasimaged in various dose levels at the tube voltage 60 kVp, and the minimum dose level todifferentiate the low-contrast inserts was determined. In order to quantify the contrast-relatedperformance of the micro-CT, the contrast-to-noise ratio (CNR), defined by
CNR = CT #
σ(1)
has been used where CT # and σ are the CT-number and the standard deviation of the pixelvalues, respectively, in a given area.

4180 S C Lee et al
Table 2. Properties of the inserts in the contrast phantom. Measured mean CT numbers wereobtained with the developed micro-CT system operating at 60 kVp.
Physical density Mean CT #Index Material (g cm−3) at 60 kVp
A Plastic water 1.030 383.2B Nylon 1.150 −47.7C Polyethylene 0.950 −203.8D Acrylic 1.180 −2.6E Polystyrene 1.110 −166.6F Polycarbonate 1.180 −35.5
3.3. Spatial resolution
We have evaluated the spatial resolving power of the micro-CT system using the phantomshown in figure 4(c). The phantom is made of an 18 µm thick aluminium foil attached to anacrylic plate. The acrylic plate has a rectangular channel on which the foil is laid. The imageswere acquired with the voxel size of 25 × 25 × 25 µm3 and the focal spot size of 5 µm.We used the slant-slit method in calculating the MTF curve (Boone 2001). In the slant-slitmethod, the slit (the cross-section of the foil in this study) is slightly tilted with respect to thehorizontal or vertical axis in the image plane. By tilting the slit, the line profile of the slit inthe image domain can be sampled in sub-pixel level. With the sampled line profile, we havecalculated the MTF by taking the Fourier transformation on the line profile.
The total MTF of a micro-CT system is affected by various physical parameters suchas the focal spot size, the magnification ratio, the reconstruction algorithm and the detectorresolving power (Holdsworth et al 1993). Since these parameters are independent of eachother, total system MTF can be expressed as
MTFtot(f ) = MTFfoc(f ) × MTFdet(f ) × MTFalg(f ) (2)
where the subscripts foc, det and alg denote the focal spot, the detector resolving powerand the reconstruction algorithm, respectively. f indicates the spatial frequency. As derivedby Holdsworth et al (1993), each MTF component was calculated and the total MTF wasestimated to compare with the measured one.
3.4. Small-animal imaging
Soft tissue and bony structure visibility tests have been performed by imaging a rat that waseuthanized just before the scan. The weight of the rat was about 300 g. The abdomen andhead imagings were performed at 40 kVp and 500 µA and at 70 kVp and 500 µA, respectivelyand the extracted femur imaging at 70 kVp and 500 µA.
4. Experimental results
4.1. Image uniformity and noise characteristics
In figure 5, we have shown transaxial and sagittal images of the uniformity phantom, andthe corresponding signal profiles in the radial and z-directions. The dose at the AOR is∼286 mGy. As noted from figure 5(a), ring artefacts are apparent (Tang et al 2001). Inthe CMOS flat-panel detector in this study, the signal charges accumulated in each pixelphotodiode are read out in the column direction and they are converted into voltage signals

Flat-panel detector based micro-CT system 4181
Figure 5. (a) and (b) A transaxial image and a sagittal image, respectively, of the uniformityphantom. The image voxel size is 100 × 100 × 200 µm3 and the dose at the AOR is ∼286 mGy.(c) A signal profile of the transaxial image in a radial direction. The standard deviation in the waterregion is about 48 CT numbers. (d) A signal profile of the sagittal image in the z-direction.
by the eight columns of charge-sensitive amplifiers (CSA) (Mori et al 2001). Therefore, acolumnar non-uniform sensitivity pattern has always appeared in the projection image dueto the non-identical sensitivities of the CSAs. It is also observed that the non-uniformitypattern drifts to some extent with time. Due to the time-variant nature of the non-uniformitypattern, it has been impossible to correct the non-uniformity pattern completely by the flat-field correction method. The remnant non-uniformity pattern after the flat-field correctionhas caused the ring artefacts in the images as shown in figure 5(a). However, the amplitudeof the ring artefacts is usually smaller than the random noise in the reconstructed images.It seems that image non-uniformity is a matter of statistical photon noise in the micro-CT.It is well known that the Feldkamp 3D reconstruction algorithm causes non-uniform imageintensity along the longitudinal direction due to its approximation nature (Feldkamp et al1984). However, as can be noted from the sagittal image shown in figure 5(b), no particularnon-uniformity pattern appears in the z-direction because of the small cone angle adopted inthis study. If a large cone angle is to be adopted, the image non-uniformity can be avoidedby using the exact 3D reconstruction algorithms in which much longer computation time is

4182 S C Lee et al
Figure 6. Transaxial images of the contrast phantom obtained with doses of (a) 95 mGy,(b) 143 mGy and (c) 286 mGy at the AOR. The voxel size is 100 × 100 × 200 µm3 and theimage matrix size is 512 × 512.
unavoidable (Smith 1990). Voxel noise of the developed micro-CT system is about 48 CT-numbers when the dose level is 286 mGy and the voxel size is 100 × 100 × 200 µm3. In orderto reduce voxel noise further without increasing radiation dose, enhancement of the detectorquantum efficiency is essential.
4.2. Contrast
Figure 6 shows transaxial images of the contrast phantom obtained with three different doses.We have applied narrow threshold windows to the images for clear differentiation of contrastmaterial areas. From the acquired images we have calculated the CNR at different dose levels.The contrasts in the insert regions with respect to the background water region are given intable 2. The CNR has been found to be proportional to the square root of dose as expected(Barrett et al 1976). For example, the CNR of the plastic water at the dose of 286 mGy (about4.6) was about 1.7 times as high as that at the dose of 95 mGy (about 2.7). From figure 6 andtable 2, we can note that the developed micro-CT can differentiate less than 36 CT numbersat the dose of 95 mGy.
4.3. Spatial resolution
Figure 2 shows both the measured total MTF of the micro-CT system at the magnificationratio of 2 and the total MTF calculated from equation (2). From the results, we cannote that the system MTF is almost determined by the detector resolving power, i.e.,MTFtot(f ) ≈ MTFdet(f ). If we assume that the limiting spatial resolution correspondsto the point when the MTF drops to 10%, then we can infer that the spatial resolution limit ofthe micro-CT system is about 14 lp/mm at a magnification ratio of 2. It is expected that thespatial resolution of the micro-CT can reach up to 10–20 µm if we increase the magnificationratio.
4.4. Small-animal imaging
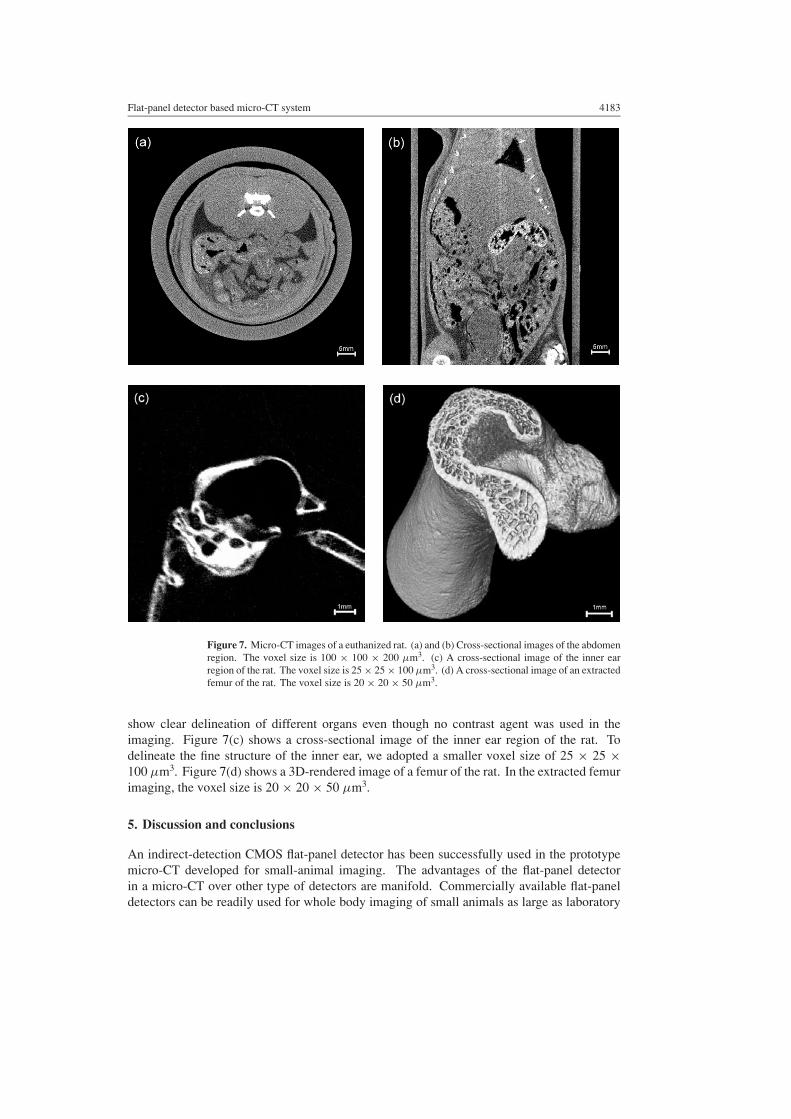
The overall performance of the micro-CT system is demonstrated in cross-sectionalpostmortem images of a rat as shown in figure 7. Figures 7(a) and (b) show transaxialand coronal images of the abdomen region, respectively, with the image matrix size of 512 ×512. The voxel size in figures 7(a) and (b) is 100 × 100 × 200 µm3. Figures 7(a) and (b)
Flat-panel detector based micro-CT system 4183
Figure 7. Micro-CT images of a euthanized rat. (a) and (b) Cross-sectional images of the abdomenregion. The voxel size is 100 × 100 × 200 µm3. (c) A cross-sectional image of the inner earregion of the rat. The voxel size is 25 × 25 × 100 µm3. (d) A cross-sectional image of an extractedfemur of the rat. The voxel size is 20 × 20 × 50 µm3.
show clear delineation of different organs even though no contrast agent was used in theimaging. Figure 7(c) shows a cross-sectional image of the inner ear region of the rat. Todelineate the fine structure of the inner ear, we adopted a smaller voxel size of 25 × 25 ×100 µm3. Figure 7(d) shows a 3D-rendered image of a femur of the rat. In the extracted femurimaging, the voxel size is 20 × 20 × 50 µm3.
5. Discussion and conclusions
An indirect-detection CMOS flat-panel detector has been successfully used in the prototypemicro-CT developed for small-animal imaging. The advantages of the flat-panel detectorin a micro-CT over other type of detectors are manifold. Commercially available flat-paneldetectors can be readily used for whole body imaging of small animals as large as laboratory

4184 S C Lee et al
rats. If cooled CCD technology is employed for this purpose, multiple CCDs and optical tapersshould be combined to get a proper field of view. However, combining multiple CCDs andoptical tapers is known to be very susceptible to fabrication errors. The flat-panel detectorsare free from geometrical distortion. Although geometrical distortions, appearing in an imageintensifier or a CCD coupled to an optical taper, can be corrected in principle by proper imageprocessing technique, those detection technologies could suffer from remnant distortion errorsin practice. Since the flat-panel-detector technology is fast growing by the needs of massproduction, availability and low cost are other merits in a micro-CT. However, flat-paneldetectors have some technical problems to be tackled. Large-area flat-panel detectors havemore bad pixels and bad lines than small area CCDs. Some of the bad pixels and bad linesshow a time varying nature hampering accurate corrections. The time varying nature of badpixels or bad lines makes streak artefacts in the reconstructed images (Tang et al 2001). Theslow data rate of typical flat-panel detectors is also troublesome in a micro-CT. It is, however,expected that large-area flat-panel detectors with a data rate as fast as that of fluoroscopyshould be commercially available in the near future.
In small-animal imaging with a micro-CT, long scan time to ensure soft tissue visibilityseems to be most troublesome. With a micro-CT consisting of a flat-panel detector, a scantime of at least several minutes is inevitable to differentiate organs in the abdomen region.Due to the long scan time, in vivo rat or mouse images suffer from cardiac and respiratorymotion artefacts. To the authors’ knowledge, most small animal studies reported so far havebeen performed on postmortem animals with a micro-CT. It seems that soft tissue visibilityin a micro-CT cannot be ensured with a scan time shorter than a respiration period of smallanimals whatever detector types are used. The typical respiration period of small mice is lessthan 1 s. For the micro-CT to be useful in small-animal imaging, we think that respiratorymotion artefact reduction techniques should be incorporated.
In conclusions, flat-panel detectors can be used in a micro-CT aiming at small-animalimaging. If a long scan time can be accepted, the flat-panel detector can give good contrastimages with a spatial resolution of the order of 10–20 µm.
References
Barrett H H, Gordon S K and Hershel R S 1976 Statistical limitation in transaxial tomography Comput. Biol. Med.6 307–23
Boone J M 2000 X-ray production, interaction, and detection in diagnostic imaging Handbook of Medical Imagingvol 1 ed J Beutel, H L Kundel and R L Van Metter (Bellingham: SPIE Press) chapter 1, pp 1–78
Boone J M 2001 Determination of the presampled MTF in computed tomography Med. Phys. 28 356–60Carlsson C A 1999 Imaging modality in x-ray computerized tomography and in selected volume tomography Phys.
Med. Biol. 44 R23–56Feldkamp L A, Davis L C and Kress J W 1984 Practical cone-beam algorithm J. Opt. Soc. Am. A 1 612–9Fujita H, Tsai D Y, Itoh T, Doi K, Morishita J, Ueda K and Ohtsuka A 1992 A simple method for determining the
modulation transfer function in digital radiography IEEE Trans. Med. Imaging 11 34–9Holdsworth D W, Drangova M and Fenster A 1993 A high-resolution XRII-based quantitative volume CT scanner
Med. Phys. 20 449–62Jaffray D A and Siewerdsen J H 2000 Cone-beam computed tomography with a flat-panel imager: initial performance
characterization Med. Phys. 27 1311–23Jee K-W, Antonuk L E, El-Mohri Y and Zaho Q 2003 System performance of a prototype flat-panel imager operated
under mammographic conditions Med. Phys. 30 1874–90Jorgensen S M, Demirkaya O and Ritman E L 1998 Three-dimensional imaging of vasculature and parenchyma in
intact rodent organs with x-ray micro-CT Am. J. Physiol. 275 H1103–14Kim H J, Kim H K, Cho G and Choi J 2003 Construction and characterization of an amorphous silicon flat-panel
detector based on ion-shower doping process Nucl. Instrum. Methods A 505 155–8
Flat-panel detector based micro-CT system 4185
Massoud T F and Gambhir S S 2003 Molecular imaging in living subject: seeing fundamental biological processesin a new light Genes Dev. 17 545–80
Mori H, Kyuushima R, Fujita K and Honda M 2001 High resolution and high sensitivity CMOS panel sensors forx-ray IEEE Nucl. Sci. Sym. Med. Imaging Conf. (Conference Record in CD-ROM)
Ning R, Chen B, Yu R, Conover D, Tang X and Ning Y 2000 Flat panel detector-based cone-beam volume CTangiography imaging: system evaluation IEEE Trans. Med. Imaging 19 949–63
Ouandji F, Potter E, Chen W R, Li Y, Tang D and Liu H 2002 Characterization of a CCD-based digital x-ray imagingsystem for small-animal studies: properties of spatial resolution Appl. Opt. 41 2420–7
Pomper M G 2001 Molecular imaging: an overview Acad. Radiol. 8 1141–53Paulus M J, Sari-Sarraf H, Gleason S S, Bobrek M, Hicks J S, Johnson D K, Behel J K, Thompson L H and
Allen W C 1999 A new x-ray computed tomography system for laboratory mouse imaging IEEE Trans. Nucl.Sci. 46 558–64
Paulus M J, Gleason S S, Sari-Sarraf H, Johnson D K, Foltz C J, Austin D W, Easterly M E, Michaud E J,Dhar M S, Hunsicker P R, Wall J W and Schell M 2000 High-resolution x-ray CT screening of mutant mouse
models Proc. Soc. Photo-Opt. Instrum. Eng. 3921 270–9Ramachandran G N and Lakshminarayanan A V 1971 Three dimensional reconstructions from radiographs and
electron micrographs: application of convolution instead of Fourier transforms Proc. Natl Acad. Sci. 682236–40
Ritman E L 2002 Molecular imaging in small animals—roles for micro-CT J. Cell. Biochem. Supp. 39 116–24Siewerdsen J H and Jaffray D A 1999a A ghost story: spatio-temporal response characteristics of an indirect-detection
flat-panel imager Med. Phys. 26 1624–41Siewerdsen J H and Jaffray D A 1999b Cone-beam computed tomography with a flat-panel imager: effects of image
lag Med. Phys. 26 2635–47Smith B 1990 Cone-beam tomography: recent advances and a tutorial review Opt. Eng. 29 524–34Tang X, Ning R, Yu R and Conover D 2001 Cone beam volume CT image artefacts caused by defective cells in x-ray
flat panel imagers and the artefact removal using a wavelet-analysis-based algorithm Med. Phys. 28 812–25Wan S Y, Kiraly A P, Ritman E L and Higgins W E 2000 Extraction of the hepatic vasculature in rats using 3-D
micro-CT images IEEE Trans. Med. Imaging 19 964–71Wang G and Vannier M 2001 Micro-CT scanners for biomedical applications: an overview Adv. Imaging 16 18–27Weissleder R and Mahmood U 2001 Molecular imaging Radiology 219 316–33