a baseline study of labor issues and trends in u.s. …
TRANSCRIPT

August 2021
A BASELINE STUDY OF LABOR ISSUES AND TRENDS IN U.S. PORK PRODUCTION
Project Researchers:
Christian Boessen, Georgeanne Artz, and Lee Schulz
Originally completed in March 2018
Updated by:
Holly Cook
Research Commissioned by the:
National Pork Producers Council
Acknowledgements We gratefully acknowledge the National Pork Producers Council Labor Security Task Force for providing observations relevant to labor issues and trends in U.S. pork production. Their valuable input led to the important findings presented here.

About the Principle Investigators Christian Boessen, PhD, is a Senior Lecturer in the Department of Economics at Iowa State University. He previously worked as a Swine Economist in the Commercial Agriculture Extension program and as an Associate Teaching Professor at the University of Missouri. He earned a B.S. in Agriculture, as well as M.S. and Ph.D. degrees in Agricultural Economics from the University of Missouri. His extension, research and consulting work related to the swine industry has included work on contracting, environmental practices, financial stress and disease economics. He has taught courses in finance, marketing, international agribusiness, farm management, and macroeconomics. Boessen has also worked in university outreach capacities with farmers and agricultural investors pursuing value-added projects and collective actions. He’s been involved in projects in South America, Africa, South Asia and East Asia. Prior to his academic career, Boessen worked in the agribusiness finance field, with positions in corporate finance, and agricultural debt and equity investing. He has worked across the United States with experience in all the major agricultural regions and sectors of agriculture. Georgeanne Artz, PhD, is an Assistant Professor in the Department of Economics at Iowa State University. Her current position focuses on research and teaching in the field of agribusiness. She earned her Ph.D. in agricultural economics from ISU in 2005. She holds a B.A. in economics from Yale University and a M.S. in resource economics and policy from the University of Maine at Orono. From 2005 to 2011 she was an assistant professor at the University of Missouri in the Department of Agricultural and Applied Economics with a joint appointment in the Truman School for Public Affairs. Dr. Artz teaches courses in intermediate microeconomics and farm business management. Her research explores the performance of agricultural and non-agricultural businesses in rural areas, as well as the policy, resource and management issues that affect them. She has published specifically on trends in rural labor markets, rural business performance, rural entrepreneurship, and the financial and human capital needs of rural firms. Lee Schulz, PhD, is an Assistant Professor in the Department of Economics at Iowa State University. He has served as the state extension livestock economist since joining Iowa State University in 2012. Lee grew up on a diversified crop and livestock farm in Wisconsin. He obtained a B.S. in Agricultural Business from the University of Wisconsin‐River Falls, a M.S. in Agricultural Economics from Michigan State University, and a Ph.D. in Agricultural Economics from Kansas State University. His integrated research, teaching, and extension program provides leadership in the study of, and educational programming for, critical problems facing the livestock and meat industry, including marketing and risk management, contracting, market concentration and performance, agricultural and trade policies, new technologies, animal health and biosecurity, and regulatory issues. Schulz has published in professional journals, extension publications, and the farm press and has spoken at numerous professional and agricultural conferences.
Table of Contents
EXECUTIVE SUMMARY ....................................................................................................................... 1
CHAPTER 1: INTRODUCTION AND OBJECTIVE..................................................................................... 3
CHAPTER 2: AGRICULTURAL LABOR MARKET TRENDS ....................................................................... 4
2.1 Trends in the General Economy ................................................................................................. 6
2.2 Trends in the Rural Population ................................................................................................... 9
2.3 Trends in Immigration and the Labor Supply ............................................................................ 15
2.4 Trends in Immigration and the Rural Labor Markets ................................................................ 18
2.5 Possible Economic Implications of Changes in Immigration Laws or Policies ............................ 20
2.6 Future Trends in Immigration .................................................................................................. 23
CHAPTER 3: LABOR MARKET SITUATION IN LEADING HOG PRODUCTION STATES ........................... 25
CHAPTER 4: INDUSTRY OUTREACH AND FINDINGS .......................................................................... 32
4.1 Organizational Structure .......................................................................................................... 32
4.2 Hiring Employees in the Local Labor Market ............................................................................ 34
4.3 Hiring Immigrant or Temporary Foreign Employees ................................................................. 35
4.4 Impact of New Regulations, Technologies, and Practices on Labor Requirements .................... 37
4.5. Future Work ........................................................................................................................... 38
REFERENCES ..................................................................................................................................... 39

1 | P a g e
EXECUTIVE SUMMARY In 2017, hog and pig farmers in the U.S. spent over $1.03 billion on hired labor, a 23 percent increase from the previous Census of Agriculture in 2012. The labor expense was even greater, at $1.7 billion and a 46 percent increase, when contract and custom labor was included. Nearly 37 percent of hog and pig farms reported having hired labor in 2017 and the average per farm hired labor expense was $122,504, a 54 percent increase from 2012. Almost 1,700 farms reported having a hired labor expense over $100,000 in 2017. Recruiting, retaining, and managing labor is therefore very important for an individual farm operations’ success as well as the broader industry’s success. The purpose of this study is to deliver a baseline on the labor issues and trends in U.S. pork production. This study provides information regarding current challenges, opportunities, and future labor needs in pork production that may influence management programs and direct policy initiatives going forward. Several approaches were used to assess the labor situation and outlook. Existing literature and public information were collected, reviewed, and a comprehensive summary provided to establish a baseline understanding of the agricultural labor market situation with particular focus on the pork industry. Data from the Bureau of Labor Statistics, USDA’s Economic Research Service, the U.S. Census Bureau, and the Census of Agriculture were used to examine trends in farm wages, the size and trends in labor pools, competition with other employers, and forces in the general economy which all affect farms’ ability to hire and retain employees. We conducted interviews with pork industry participants to gain insight into evolving labor trends and implications for the industry. Key Findings
• Agriculture in general and particularly the hog industry has changed dramatically in recent decades, from an industry largely utilizing family labor to an increasingly capital intensive, technology, and science driven one with a significant demand for hired full-time skilled and unskilled workers. From 2001 to 2020, employment in the swine industry grew by an annual rate of 1.5 percent, a rate nearly four times faster than employment growth in all U.S. industries. Total and weekly wages in hog production jobs have also grown faster than the average of all U.S. industries over this 20-year span.
• The robust demand for labor in the hog industry is against a backdrop of increasingly threatening macroeconomic and demographic trends. The most immediate challenge to hog production firms in the industry has been the strengthening of the broader U.S. labor market with the U.S. unemployment rate falling from 10 percent in 2009 to 3.5 percent in early 2020. Unemployment rates spiked in mid-2020 in the wake of national shutdowns but have shown a steep decline in early 2021 as many returned to work. These national unemployment trends still understate the tight labor supply in most of the largest hog production states where unemployment is below the national level, even during the March 2020 – April 2021 period of COVID-19 shocks. During this period, the nation’s top 8 hog producing states averaged an unemployment rate 1.3 percent lower than the national rate. Furthermore, in the largest hog production states the labor force participation rates are generally well above the national average, indicating little or no slack in these local labor markets.
• The most threatening trend facing hog producing firms in the longer term are the demographic realities in non-metropolitan counties where hog producing firms are overwhelmingly located. Population growth has been slowing in U.S. non-metro counties for decades and large swaths of rural America have had negative growth or loss. From 2010 to 2016, the overall non-metro population
2 | P a g e
growth rate became negative for the first time, and although growth has been slightly positive or neutral from 2017 to 2019, non-metro populations in agricultural regions continue to see population loss. The aging rural workforce that remains is increasingly unable and unwilling to do the strenuous labor that agricultural work demands. As more rural residents age beyond their childbearing years, this negative trend in population and labor force will likely accelerate. From 2014 to 2019, the rural labor force shrank in five of the eight largest hog producing states.
• A final, and important, trend that is exacerbating the ever-tightening rural labor market is the declining flow of immigrants into rural labor markets. Over the last 30 years, the immigration of foreign-born workers offset some of the decline in rural native-born population and labor force. That trend had likely already reversed even before the recent emergence of political sentiment toward stricter immigration controls and increased enforcement. Furthermore, an increasing proportion of the large influx of immigrant workers that came to the U.S. in the 1980s and 1990s are aging beyond their prime working years. Ever improving economies and rapidly falling population growth in immigrant sending countries are increasingly changing the calculus of potential immigrants. There are more and better jobs in many immigrant sending countries and the baby-booms in those countries that fed the immigration waves in recent decades are past. These trends, in an environment of tighter immigration rules and enforcement, combined with the negative growth in native-born rural populations almost certainly portend decades of increasingly difficult labor market conditions for all rural firms including hog producing firms.
• This study included interviews of pork industry participants. Key themes and responses included: o The importance of being able to hire workers into companies at the right stage or level and in
a way to develop both pig skills and people skills for leadership development and growth and promotion within a company.
o The increasing difficulty of hiring dependable employees in the local labor market. The biggest challenge with native-born local workers was work schedules that require work on weekends and holidays more so than physical demands of the job.
o Foreign-born workers have performed well but current guest worker programs are less than ideal and create additional management challenges.
o Changes in farm specific procedures, auditing, Pork Quality Assurance, antibiotic-use guidelines, and other regulations and protocols have created strong demand for employees with higher levels of education and training.
o A final noteworthy sentiment expressed at different points in the interviews was an attitude that the industry and the employers therein simply have to adapt and attract people to their businesses—which is particularly insightful given the external nature of the macroeconomic, demographic, and political forces affecting the supply side of local labor markets.
• This study provides information from which to assess the pork production labor market situation and outlook. Conclusions will have much greater leveraged value if they are used as foundational information as management and policy initiatives go forward. That is, the information from this study can be used to determine where the most fruitful efforts might be spent in workable options for workforce needs and where those efforts may be less productive without other external developments.

3 | P a g e
CHAPTER 1: INTRODUCTION AND OBJECTIVE Background There is increasing concern across all sectors of agriculture that the market for farm labor has become extremely challenging due to a combination of factors. For pork production, increased scale of production and the adoption of new technologies (and practices) has required changes in the industry’s labor needs. Some new technologies require little if any additional labor while others are much more labor intensive. Furthermore, many new technologies require more highly skilled labor, altering the mix of employees needed on farm. Thus, changes in the structure of the industry and technology developments continue to be accompanied by large changes in the demand for employees and skills. On the supply side, actual and proposed changes in wages, safety, and immigration policies are also impacting the market for farm labor. Pork production relies on labor for year-round animal care and technical support, distinguishing this sector from some other sectors of agriculture which rely more heavily on seasonal labor. This broad situation highlights the need for this project. A better understanding of the nature and extent of pork production labor market issues and trends can inform management and policy solutions. Objectives and Procedures The purpose of this study is to identify and document changes occurring in the pork labor market that may impact the industry now and in the future. The objective is to determine current challenges, opportunities, and future labor needs in pork production that may influence management programs and direct policy initiatives going forward. To complete the study, three major sources of information were analyzed. First, existing literature and public information was used to establish a baseline understanding of the current agricultural labor market situation with particular focus on pork production. Second, public data from the Bureau of Labor Statistics, USDA’s Economic Research Service, the U.S. Census Bureau, and the Census of Agriculture were used to examine trends in farm wages, the size and trends in labor pools, competition with other employers, and forces in the general economy which all can affect managers’ ability to hire and retain employees. Third, the project researchers conducted interviews with representatives from the pork industry. To ensure confidentiality of those providing comments, the names of individuals and organizations are not reported. Although it is impossible to capture comments from every participant, the report reflects sentiments from a broad array of these industry stakeholders. Every industry participant we interviewed applauded NPPC for taking the initiative to commission this study. Participants thanked us for providing them with the opportunity to provide input. In many ways the active discussions we had with participants were viewed as the first in a multi-step process towards assessing pork production labor market issues and carefully assessing ways to inform management and policy solutions.
4 | P a g e
CHAPTER 2: AGRICULTURAL LABOR MARKET TRENDS Conditions in the agricultural labor market have been challenging for decades. The agricultural industry in the U.S. has progressed from a fairly large labor-intensive sector where family members supplied the majority of the farm labor, to one of much larger, more capital-intensive farms requiring a larger workforce comprised of skilled farm operators supplemented by a pool of unskilled labor, which is often seasonal and migrant. As a result of this evolution in both the number and the skill level required of employees in agriculture, many farmers have struggled with labor hiring and retention challenges. Nevertheless, at the national level, the labor market in agriculture in general, and in animal agriculture in particular, looks strong. Since 2001, employment in the agricultural industry has grown from 1,178,302 to 1,247,580 jobs, or about 6 percent. Between 2001 and 2011, employment remained relatively steady in the industry, with a more rapid increase after 2011, when agricultural industry employment added nearly 100,000 jobs by 2016 and peaked in 2018. Average agricultural employment took a dip in 2020 after the COVID-19 pandemic caused economic shocks across the country. However, it is important to note that agricultural employment reinstated over 200,000 jobs from the first to the third quarter of 2020. Average weekly wages (in nominal dollars) consistently rose over this time period; 97 percent over the 20-year period and up 20 percent in the last five years. This translates to a 4.9 percent average annual growth rate in average weekly wages over the entire time period, higher than the 3.8 percent increase for total U.S. employment over the same time. During the last five years, average weekly wages in agriculture have grown at a similar pace to the rest of U.S. industries, with an average of 3.9 percent per year. Table 1 presents detailed information on labor market measures at the national level for all industries combined, all industries in non-metropolitan areas combined, the agricultural industry (NAICS 11)1, the hog production industry (NAICS 1122), construction (NAICS 23), manufacturing (NAICS 31-33), and mining, quarrying, and oil and gas extraction (NAICS 21), which we label energy production. The latter three industries are ones that tend to compete with hog production for workers in many local labor markets. One thing to note from the numbers in the table is that employment growth in non-metropolitan areas has been negative. This suggests that agriculture, which is located primarily in non-metropolitan areas, has often been a source of job growth, while other industries in these areas have been declining.
1 NAICS is an acronym for the North American Industry Classification System. It is the standard used by Federal statistical
agencies to classify business establishments for the purpose of collecting, analyzing, and publishing statistical data related to the U.S. business economy (https://www.census.gov/eos/www/naics/).

5 | P a g e
Table 1. Average Annual Growth Rates in Labor Market Measures for Selected Industries
Employ-
ment Establish-
ments Total
Wages
Average Weekly Wages
Average Annual Wages
Average Annual Growth Rate, 2001-2020 U.S., All Industries 0.4% 1.6% 4.5% 3.8% 3.8% U.S. Non-Metro, All Industries -0.3% 1.0% 3.8% 4.4% 4.4% All Agriculture (NAICS 11) 0.3% 0.3% 5.4% 4.9% 4.9% Hog Production (NAICS 1122) 1.5% 1.4% 6.5% 3.9% 3.9% Construction (NAICS 23) 0.3% 0.5% 4.3% 3.8% 3.8% Manufacturing (NAICS 31-33) -1.3% -0.5% 1.3% 3.6% 3.5% Energy Production (NAICS 21) 0.5% 1.2% 4.3% 4.2% 4.2% Average Annual Growth Rate, 2011-2020 U.S., All Industries 0.8% 1.6% 4.3% 3.3% 3.3% U.S. Non-Metro, All Industries -0.4% 1.0% 3.0% 3.6% 3.6% All Agriculture (NAICS 11) 0.7% 1.4% 5.4% 4.4% 4.4% Hog Production (NAICS 1122) 0.7% 0.7% 4.5% 3.5% 3.5% Construction (NAICS 23) 3.1% 1.1% 7.3% 3.3% 3.3% Manufacturing (NAICS 31-33) 0.3% 0.6% 2.8% 2.4% 2.4% Energy Production (NAICS 21) -2.6% -0.2% -1.4% 1.6% 1.6% Average Annual Growth Rate, 2016-2020 U.S., All Industries -0.4% 1.6% 3.4% 3.9% 3.9% U.S. Non-Metro, All Industries -0.4% 1.7% 3.4% 3.9% 3.9% All Agriculture (NAICS 11) -0.3% 1.0% 3.6% 3.9% 3.9% Hog Production (NAICS 1122) -1.0% 0.4% 2.0% 3.1% 3.1% Construction (NAICS 23) 1.5% 1.9% 4.7% 3.0% 3.0% Manufacturing (NAICS 31-33) -0.3% 0.9% 2.2% 2.6% 2.6% Energy Production (NAICS 21) -2.4% -1.3% -1.1% 1.4% 1.4%
Note: Authors’ calculations using data from Bureau of Labor Statistics Quarterly Census of Employment and Wages (2001-2020)
The hog production industry, like the agricultural industry as a whole, has been growing. In 2020, the U.S. hog production industry (NAICS 1122) employed 30,886 workers and paid more than $1.3 billion in wages, accounting for 2.5 percent of U.S. agricultural employment and 2.7 percent of agricultural wages. Over the past 20 years, hog production industry employment has increased 30.0 percent, total wages 130.7 percent (in nominal $) and average weekly wages 77.5 percent. This is slightly higher than the increase in average weekly wages for all U.S. industries, which was 76.6 percent over the same period. The annual growth rate in average weekly wages was lower than the agricultural industry as a whole, 3.9 percent versus 4.9 percent over the 20-year period and 3.1 percent versus 3.9 percent over the last 5 years. The 2001-2020 period spans the worst U.S. recession since the Great Depression and over this
period the hog industry created jobs faster than every other sector outlined in Table 1. The 30.0
percent increase in hog industry employment over the 20-year period is large in comparison with
6 | P a g e
industries which compete with agriculture for workers. Energy production sector employment rose
1.0 percent, while construction employment rose 5.9 percent and manufacturing employed 26.2
percent fewer workers in 2020 than it had in 2001.
In the most recent 5-year period, hog industry employment has declined at an average annual rate of 1.0 percent, while construction employment outpaced this with 1.5 percent growth, likely due to the housing recovery. Employment in the energy production sector also fell by 2.4 percent. Manufacturing employment fell, but at a slower rate, an average of 0.3 percent per year. All of these measures include 2020 data and economic shocks related to COVID-19. Despite the COVID-19 effects on employment, the general trend of growth in these other sectors, which provide job opportunities for similarly skilled workers, has likely put additional pressure on hog industry employers to raise wages or offer other non-monetary benefits in order to attract new employees and retain existing workers. Note that although hog industry employment growth turned negative over the 5-year period, growth in average annual and weekly wages was greater in the hog industry than in competing industries. Hiring and retaining quality workers on swine farms is and will continue to be a major challenge for management. As Swan (2010) suggests, "Modern-day pig production is less about managing pigs than it is about managing people." Given that the pork production industry is largely rural-based, the extent to which this particular challenge can threaten the long-term viability of operations depends on the larger demographic and macroeconomic forces that are shaping rural labor markets and the policy responses to these forces. Management can best deal with the internal business realities but mostly can only react to the external threats. The following sections address the forces that are shaping rural labor markets and that are largely out of the control of managers. These include trends in the general economy, population, and immigration.
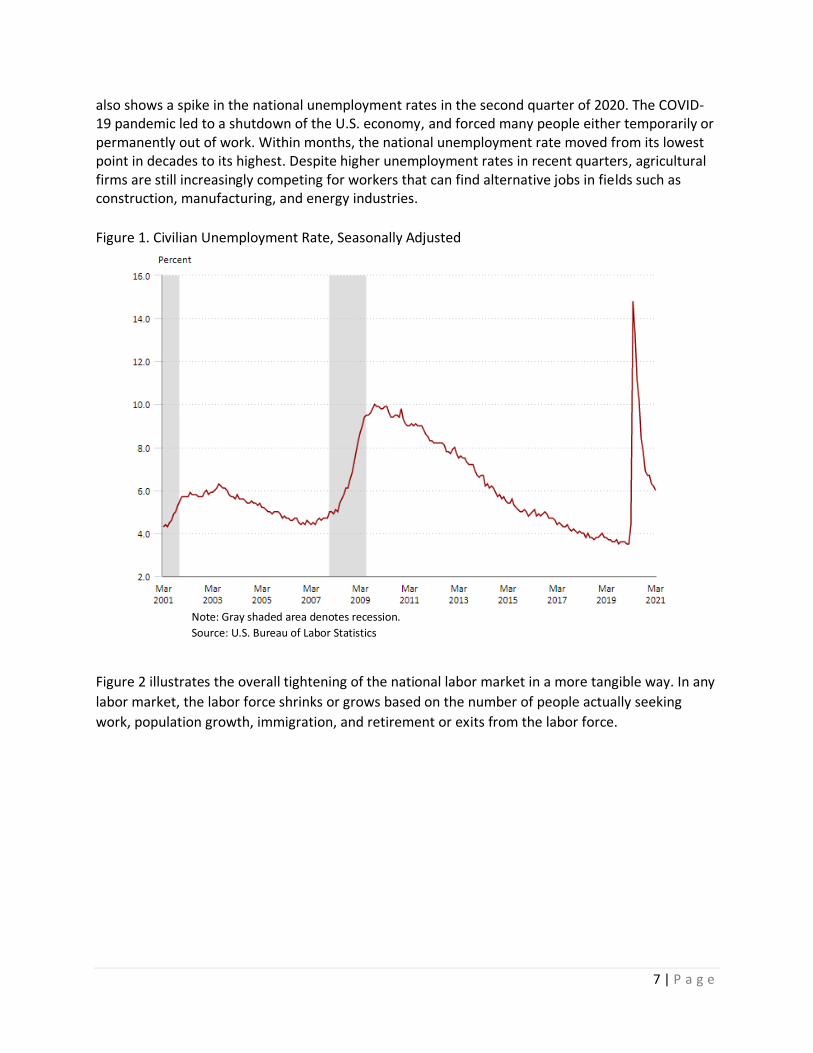
2.1 Trends in the General Economy The strength or weakness of the general economy affect rural labor markets in that increasing opportunity and demand for workers outside local labor markets can reduce the supply of workers locally. For example, if local economic activity remains constant while the general economy strengthens, eventually workers will likely exit the local labor market to seek jobs in other labor markets. While many economists have commented on the relatively slow pace of economic recovery since the 2007-2009 recession, the positive economic growth since the recession was steady leading up to 2020 and is one of the longest on record. Shocks related to the COVID-19 pandemic caused a spike in unemployment after the second quarter of 2020, but due to the nature of the shocks, recovery of the unemployment rate has been much more rapid than in the years following the recession. Figure 1 details the significant drop in unemployment since the last recession when unemployment peaked at 10 percent. At the beginning of 2020, with the national unemployment rate below 4 percent, many economists suggested that the national economy was at or near full employment, which is the point at which further reduction in unemployment is likely to trigger inflation. Figure 1
7 | P a g e
also shows a spike in the national unemployment rates in the second quarter of 2020. The COVID-19 pandemic led to a shutdown of the U.S. economy, and forced many people either temporarily or permanently out of work. Within months, the national unemployment rate moved from its lowest point in decades to its highest. Despite higher unemployment rates in recent quarters, agricultural firms are still increasingly competing for workers that can find alternative jobs in fields such as construction, manufacturing, and energy industries.
Figure 1. Civilian Unemployment Rate, Seasonally Adjusted
Note: Gray shaded area denotes recession.
Source: U.S. Bureau of Labor Statistics
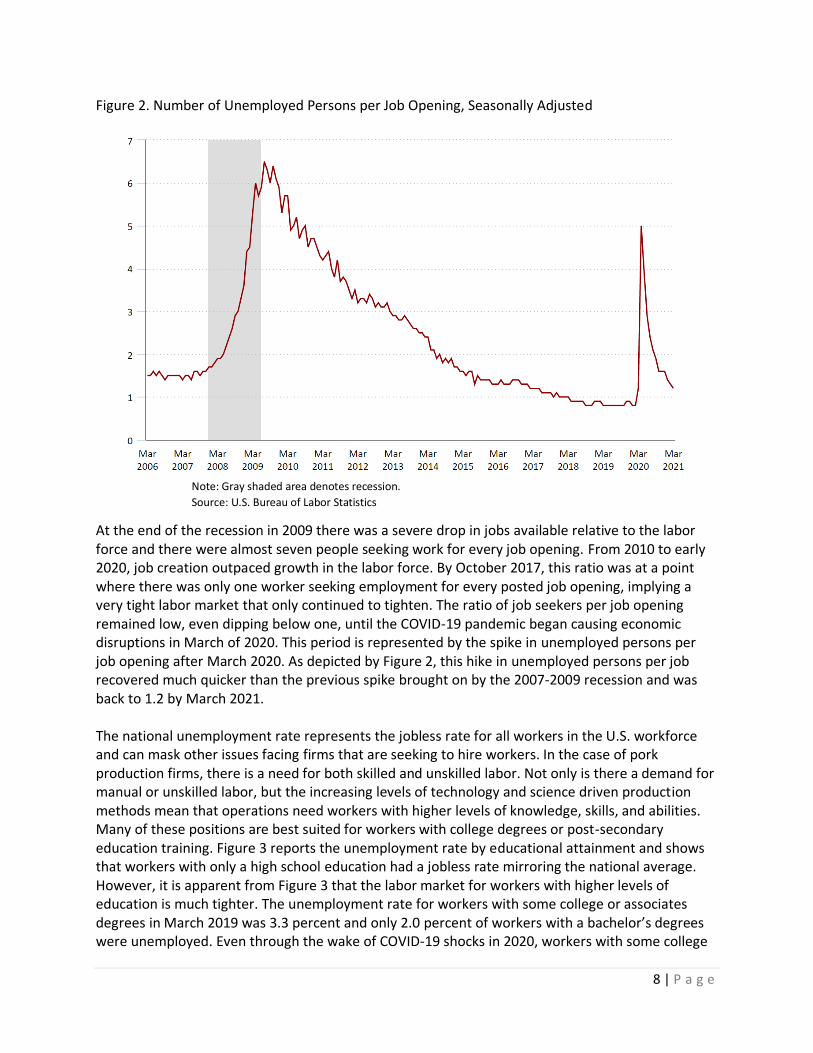
Figure 2 illustrates the overall tightening of the national labor market in a more tangible way. In any
labor market, the labor force shrinks or grows based on the number of people actually seeking
work, population growth, immigration, and retirement or exits from the labor force.
8 | P a g e
Figure 2. Number of Unemployed Persons per Job Opening, Seasonally Adjusted
Note: Gray shaded area denotes recession.
Source: U.S. Bureau of Labor Statistics
At the end of the recession in 2009 there was a severe drop in jobs available relative to the labor force and there were almost seven people seeking work for every job opening. From 2010 to early 2020, job creation outpaced growth in the labor force. By October 2017, this ratio was at a point where there was only one worker seeking employment for every posted job opening, implying a very tight labor market that only continued to tighten. The ratio of job seekers per job opening remained low, even dipping below one, until the COVID-19 pandemic began causing economic disruptions in March of 2020. This period is represented by the spike in unemployed persons per job opening after March 2020. As depicted by Figure 2, this hike in unemployed persons per job recovered much quicker than the previous spike brought on by the 2007-2009 recession and was back to 1.2 by March 2021. The national unemployment rate represents the jobless rate for all workers in the U.S. workforce and can mask other issues facing firms that are seeking to hire workers. In the case of pork production firms, there is a need for both skilled and unskilled labor. Not only is there a demand for manual or unskilled labor, but the increasing levels of technology and science driven production methods mean that operations need workers with higher levels of knowledge, skills, and abilities. Many of these positions are best suited for workers with college degrees or post-secondary education training. Figure 3 reports the unemployment rate by educational attainment and shows that workers with only a high school education had a jobless rate mirroring the national average. However, it is apparent from Figure 3 that the labor market for workers with higher levels of education is much tighter. The unemployment rate for workers with some college or associates degrees in March 2019 was 3.3 percent and only 2.0 percent of workers with a bachelor’s degrees were unemployed. Even through the wake of COVID-19 shocks in 2020, workers with some college

9 | P a g e
or a bachelor’s degree experienced much lower unemployment rates than those with a high school degree or less.
Figure 3. Unemployment Rates for Persons over 25, by Educational Attainment
Source: U.S. Bureau of Labor Statistics
2.2 Trends in the Rural Population
The most fundamental determinant of local labor supply is local population. Population and thus labor supply are driven by natural growth (births minus deaths) and migration (domestic relocation and foreign immigration). Population and demographic trends in much of rural America pose a strategic threat not only to pork production firms but also a long-term threat to the rural economy and communities in general. Local population in the short run is fairly fixed. Over years and more likely decades, however, conditions in the local labor market to a large extent affect local populations. If economic activity in the local labor market is sufficient, more workers stay and have children that may in turn stay and enter the local labor force. In addition, sustained economic activity and worker demand can induce workers from outside the local labor market to move in. A lack of local economic growth and employment combined with increased educational attainment and better opportunities in other labor markets increases the opportunity cost for workers to stay in a local market. This leads to workers moving away and seeking better opportunities elsewhere. The former can create a positive feedback loop resulting in increased population and labor demand and thus leading to more economic activity and jobs. The latter can lead to a negative feedback loop, with declining labor demand and economic activity, fewer jobs and declining population.
10 | P a g e
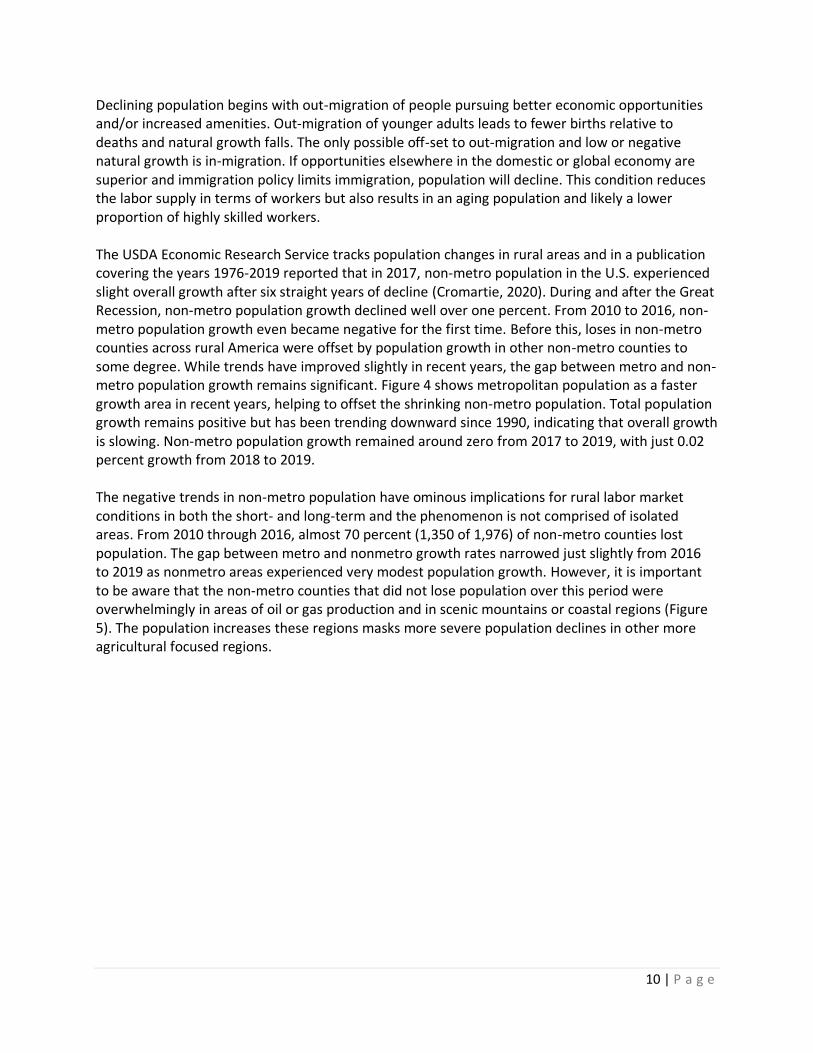
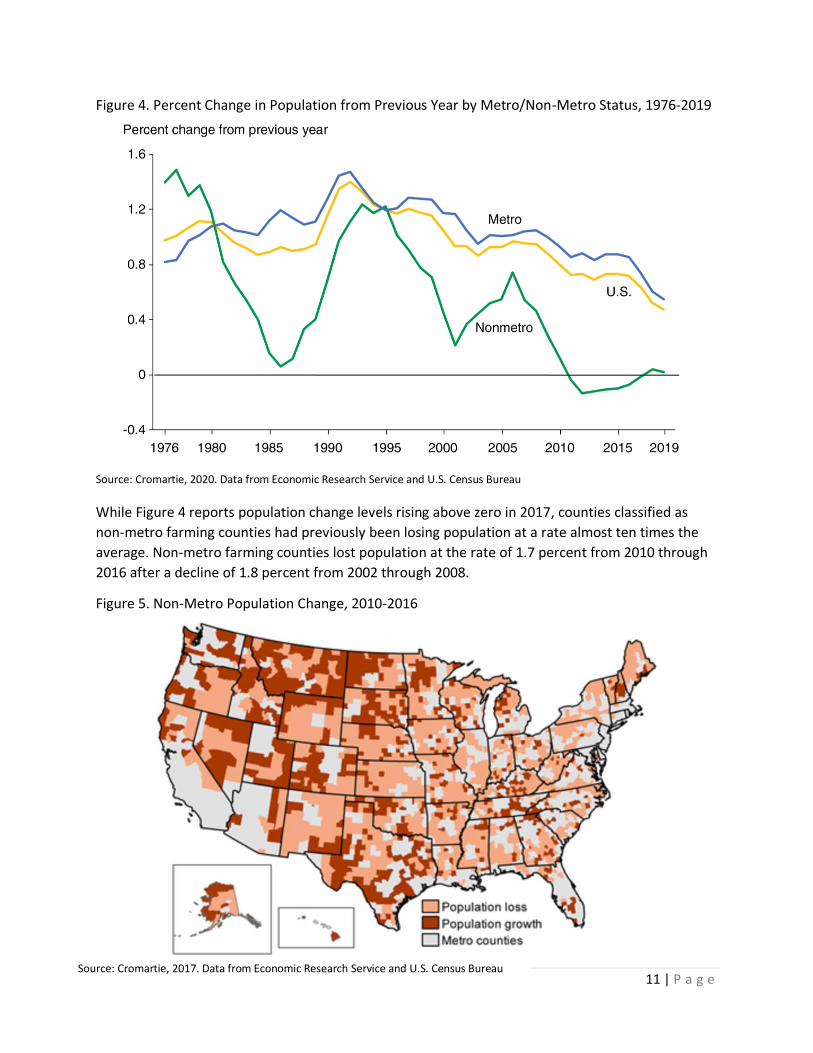
Declining population begins with out-migration of people pursuing better economic opportunities and/or increased amenities. Out-migration of younger adults leads to fewer births relative to deaths and natural growth falls. The only possible off-set to out-migration and low or negative natural growth is in-migration. If opportunities elsewhere in the domestic or global economy are superior and immigration policy limits immigration, population will decline. This condition reduces the labor supply in terms of workers but also results in an aging population and likely a lower proportion of highly skilled workers. The USDA Economic Research Service tracks population changes in rural areas and in a publication covering the years 1976-2019 reported that in 2017, non-metro population in the U.S. experienced slight overall growth after six straight years of decline (Cromartie, 2020). During and after the Great Recession, non-metro population growth declined well over one percent. From 2010 to 2016, non-metro population growth even became negative for the first time. Before this, loses in non-metro counties across rural America were offset by population growth in other non-metro counties to some degree. While trends have improved slightly in recent years, the gap between metro and non-metro population growth remains significant. Figure 4 shows metropolitan population as a faster growth area in recent years, helping to offset the shrinking non-metro population. Total population growth remains positive but has been trending downward since 1990, indicating that overall growth is slowing. Non-metro population growth remained around zero from 2017 to 2019, with just 0.02 percent growth from 2018 to 2019. The negative trends in non-metro population have ominous implications for rural labor market conditions in both the short- and long-term and the phenomenon is not comprised of isolated areas. From 2010 through 2016, almost 70 percent (1,350 of 1,976) of non-metro counties lost population. The gap between metro and nonmetro growth rates narrowed just slightly from 2016 to 2019 as nonmetro areas experienced very modest population growth. However, it is important to be aware that the non-metro counties that did not lose population over this period were overwhelmingly in areas of oil or gas production and in scenic mountains or coastal regions (Figure 5). The population increases these regions masks more severe population declines in other more agricultural focused regions.
11 | P a g e
Figure 4. Percent Change in Population from Previous Year by Metro/Non-Metro Status, 1976-2019
Source: Cromartie, 2020. Data from Economic Research Service and U.S. Census Bureau
While Figure 4 reports population change levels rising above zero in 2017, counties classified as
non-metro farming counties had previously been losing population at a rate almost ten times the
average. Non-metro farming counties lost population at the rate of 1.7 percent from 2010 through
2016 after a decline of 1.8 percent from 2002 through 2008.
Figure 5. Non-Metro Population Change, 2010-2016
Source: Cromartie, 2017. Data from Economic Research Service and U.S. Census Bureau

12 | P a g e
Figure 6 provides a decomposition of the negative trends in rural population growth. As mentioned previously, natural change and migration drive overall population change. Net migration from non-metro counties has been negative since the start of the last recession indicating that more people are leaving rural areas than are moving in. The effect of out-migration would have been worse over the period if not for natural change (births exceeding deaths). However, the natural change is approaching zero and this may portend a tipping point for many rural labor markets. The declining natural change is a function of people of child-bearing age migrating away but is also driven by the aging of the people that stay. The combination of out-migration and aging means that natural change will turn negative in more and more rural counties in the coming years, accelerating the negative trends in population. Note that this chart is based on 2010 census numbers projected forward and does not yet account for mortalities associated with the COVID-19 pandemic. Increased mortality associated with the virus is likely to have a significant impact on rural
communities and will contribute to the ongoing decline in population growth from natural change (Cromartie, 2020) Figure 6. Non-metro Population Change and Components of Change, Percent Change from the Previous Year
Source: Cromartie, 2020. Data from Economic Research Service and U.S. Census Bureau
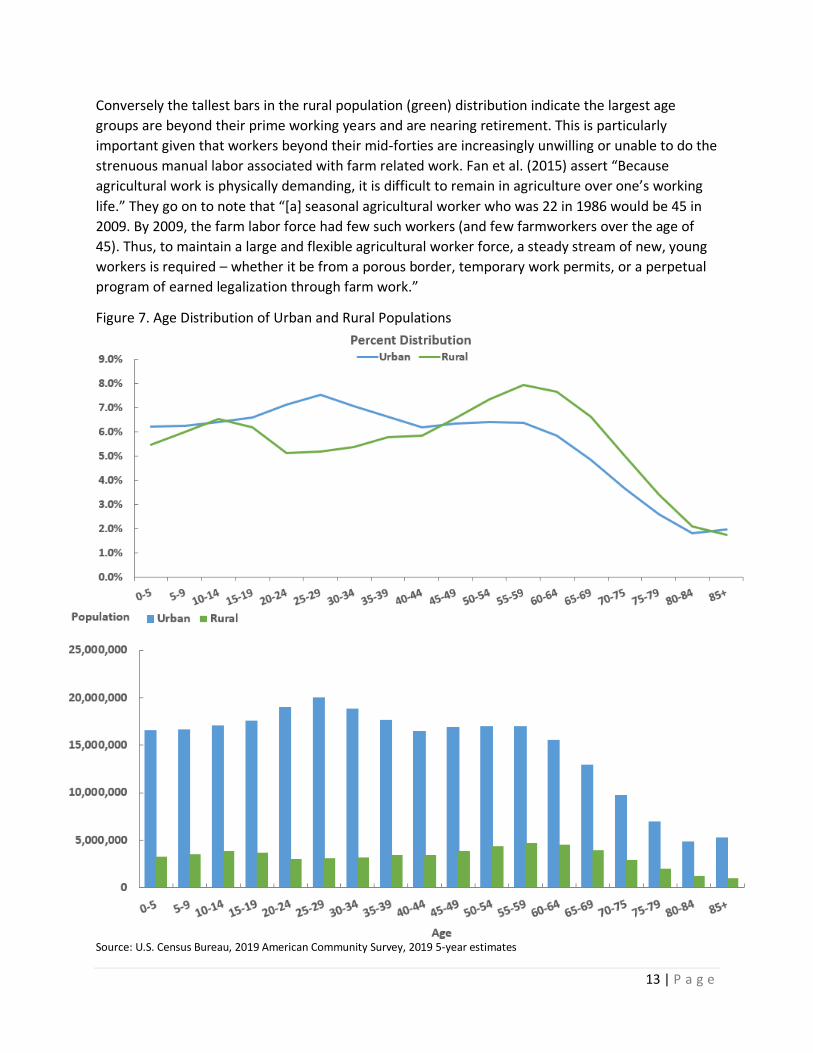
Population decline in much of rural America is only part of the labor supply challenge facing rural employers such as pork production firms. Not only are such firms facing the threat of a shrinking labor force, but the demographic composition of the existing labor supply also exacerbates the problem. The median age of rural population is 42 years versus 37 years in urban areas. The peaks in lines in Figure 7 illustrate the differences in median age and the accompanying bar
graph shows the age distribution. The tallest bars in the urban population (blue) distribution
indicate that the largest population age groups are in the prime working years of 18-44 years of age.
13 | P a g e
Conversely the tallest bars in the rural population (green) distribution indicate the largest age
groups are beyond their prime working years and are nearing retirement. This is particularly
important given that workers beyond their mid-forties are increasingly unwilling or unable to do the
strenuous manual labor associated with farm related work. Fan et al. (2015) assert “Because
agricultural work is physically demanding, it is difficult to remain in agriculture over one’s working
life.” They go on to note that “[a] seasonal agricultural worker who was 22 in 1986 would be 45 in
2009. By 2009, the farm labor force had few such workers (and few farmworkers over the age of
45). Thus, to maintain a large and flexible agricultural worker force, a steady stream of new, young
workers is required – whether it be from a porous border, temporary work permits, or a perpetual
program of earned legalization through farm work.”
Figure 7. Age Distribution of Urban and Rural Populations
Source: U.S. Census Bureau, 2019 American Community Survey, 2019 5-year estimates
14 | P a g e
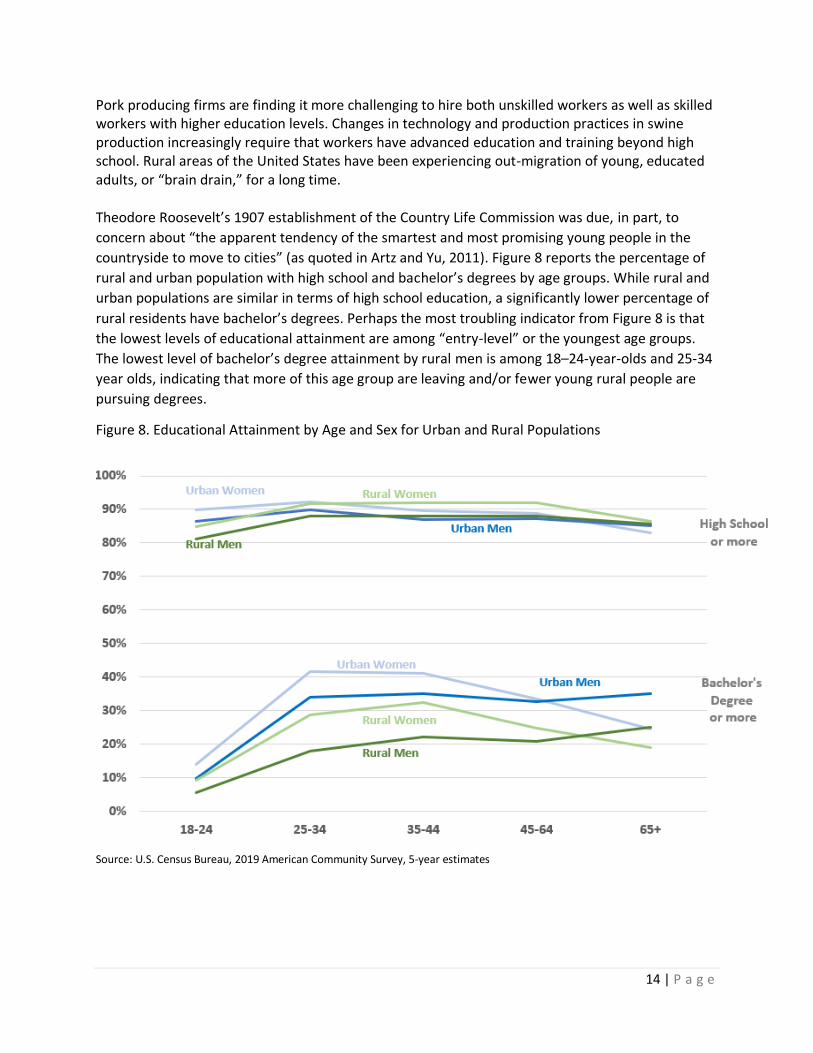
Pork producing firms are finding it more challenging to hire both unskilled workers as well as skilled workers with higher education levels. Changes in technology and production practices in swine production increasingly require that workers have advanced education and training beyond high school. Rural areas of the United States have been experiencing out-migration of young, educated adults, or “brain drain,” for a long time.
Theodore Roosevelt’s 1907 establishment of the Country Life Commission was due, in part, to
concern about “the apparent tendency of the smartest and most promising young people in the
countryside to move to cities” (as quoted in Artz and Yu, 2011). Figure 8 reports the percentage of
rural and urban population with high school and bachelor’s degrees by age groups. While rural and
urban populations are similar in terms of high school education, a significantly lower percentage of
rural residents have bachelor’s degrees. Perhaps the most troubling indicator from Figure 8 is that
the lowest levels of educational attainment are among “entry-level” or the youngest age groups.
The lowest level of bachelor’s degree attainment by rural men is among 18–24-year-olds and 25-34
year olds, indicating that more of this age group are leaving and/or fewer young rural people are
pursuing degrees.
Figure 8. Educational Attainment by Age and Sex for Urban and Rural Populations
Source: U.S. Census Bureau, 2019 American Community Survey, 5-year estimates
15 | P a g e
2.3 Trends in Immigration and the Labor Supply
Immigration, the movement of people from other countries into the U.S. has been central to the growth and development of the U.S. economy throughout history. Throughout this same history of development, immigration and the presence of immigrants in communities has always been a contentious issue. However, few economists would dispute the importance and central role of immigration to U.S. economic development. Two forces drive the growth of any economy: 1) the number of workers or labor force producing goods and services, and 2) the productivity or the quantity each worker can produce. In recent decades, as the native-born workforce has aged rapidly and birth rates have fallen, skilled and unskilled immigrants have been crucial to maintaining and growing the workforce and increasing productivity. Given the declining rural population and aging rural workforce detailed previously, immigrants have been an especially important factor in maintaining rural labor supplies.
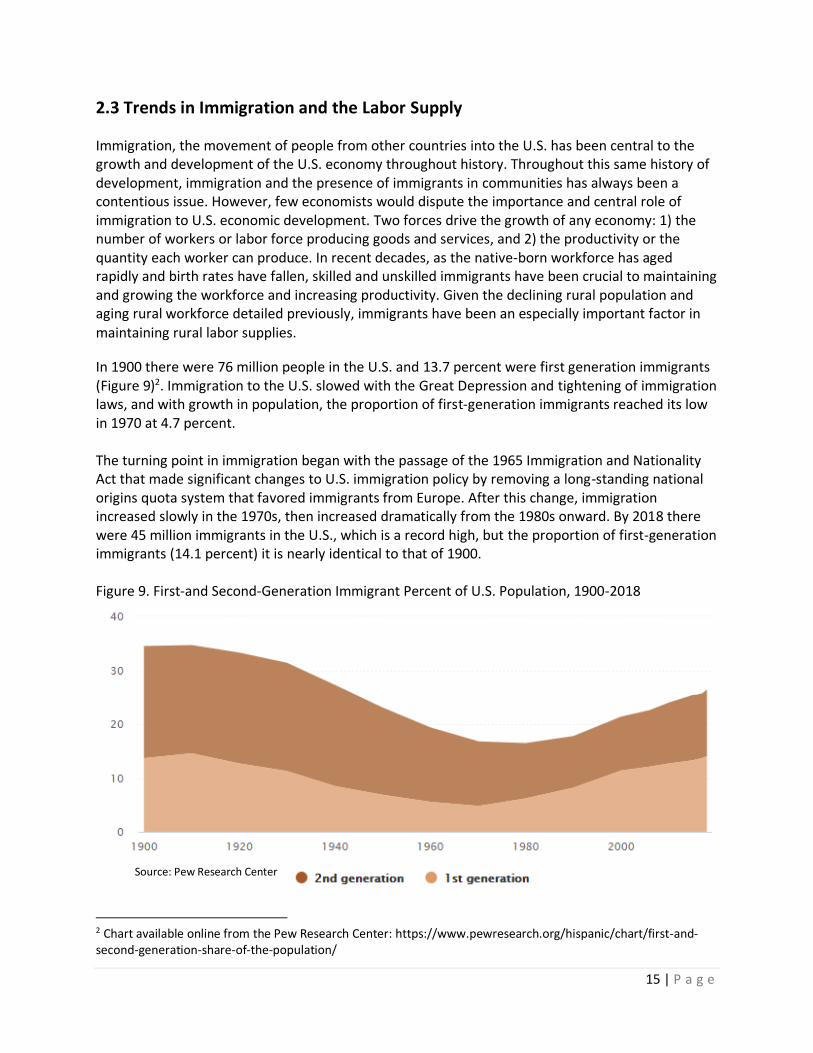
In 1900 there were 76 million people in the U.S. and 13.7 percent were first generation immigrants (Figure 9)2. Immigration to the U.S. slowed with the Great Depression and tightening of immigration laws, and with growth in population, the proportion of first-generation immigrants reached its low in 1970 at 4.7 percent. The turning point in immigration began with the passage of the 1965 Immigration and Nationality Act that made significant changes to U.S. immigration policy by removing a long-standing national origins quota system that favored immigrants from Europe. After this change, immigration increased slowly in the 1970s, then increased dramatically from the 1980s onward. By 2018 there were 45 million immigrants in the U.S., which is a record high, but the proportion of first-generation immigrants (14.1 percent) it is nearly identical to that of 1900. Figure 9. First-and Second-Generation Immigrant Percent of U.S. Population, 1900-2018
2 Chart available online from the Pew Research Center: https://www.pewresearch.org/hispanic/chart/first-and-second-generation-share-of-the-population/
Source: Pew Research Center
16 | P a g e
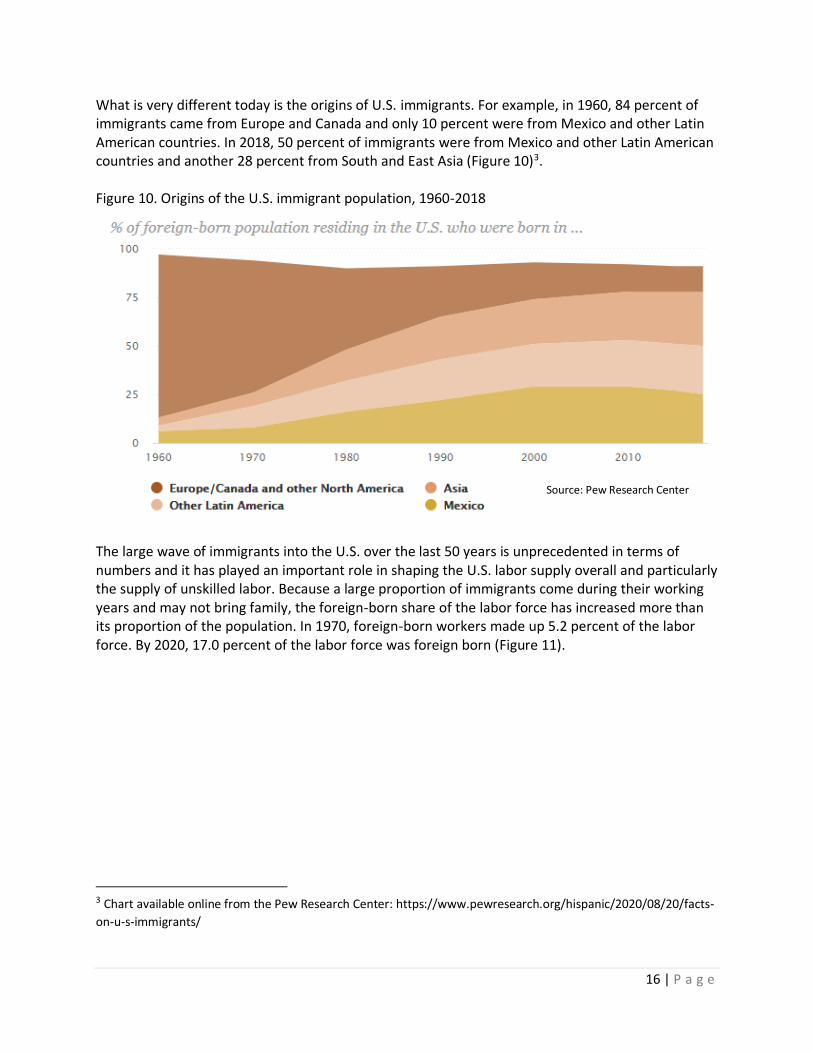
What is very different today is the origins of U.S. immigrants. For example, in 1960, 84 percent of immigrants came from Europe and Canada and only 10 percent were from Mexico and other Latin American countries. In 2018, 50 percent of immigrants were from Mexico and other Latin American countries and another 28 percent from South and East Asia (Figure 10)3. Figure 10. Origins of the U.S. immigrant population, 1960-2018
The large wave of immigrants into the U.S. over the last 50 years is unprecedented in terms of numbers and it has played an important role in shaping the U.S. labor supply overall and particularly the supply of unskilled labor. Because a large proportion of immigrants come during their working years and may not bring family, the foreign-born share of the labor force has increased more than its proportion of the population. In 1970, foreign-born workers made up 5.2 percent of the labor force. By 2020, 17.0 percent of the labor force was foreign born (Figure 11).
3 Chart available online from the Pew Research Center: https://www.pewresearch.org/hispanic/2020/08/20/facts-
on-u-s-immigrants/
Source: Pew Research Center

17 | P a g e
Figure 11. Percent Foreign Born in US. Labor Force
Source: Bureau of Labor Statistics, U.S. Census Bureau
It would be easy to presume that immigration disrupted U.S. labor markets from 1970 to 2020, but that was not the case. Over the same period factors such as aging, the peak of women joining the workforce, a declining labor force participation rate, and other cyclical forces caused a significant slowing in labor force growth from the native-born population. In Figure 12, the actual growth in the labor force over this period is presented on the backdrop of the level of foreign workers in the labor force. Figure 12. Number of Foreign-Born in Labor Force and Percent Change in U.S. Civilian Labor Force
Source: Bureau of Labor Statistics, U.S. Census Bureau
20.3% 20.5%
18.6%
15.2%
11.0%
8.1%
5.9%5.2%
6.7%
9.3%
12.5%
15.6%16.7%
17.0%
1900 1910 1920 1930 1940 1950 1960 1970 1980 1990 2000 2007 2015 2020
0.0%
0.5%
1.0%
1.5%
2.0%
2.5%
3.0%
0.0
5.0
10.0
15.0
20.0
25.0
30.0
1960-70 1970-80 1980-90 1990-2000 2000-10 2010-20
Foreign-Born in Civilian Labor Force (millions)
% Change in Civilian Labor Force
18 | P a g e
The initial influx of immigrants came while American baby-boomers were young and entering the work force, a combination that contributed to a relatively high, 2.6 percent growth rate in the labor force from 1970 to 1980 (orange line). However, after 1980, growth in the native-born working age population slowed dramatically and total labor force has increased at less than one-half percent over the last decade. During the last decade, the entry of foreign-born workers accounted for 60 percent of the one-half percent growth, illustrating the importance of immigration for U.S. labor markets. Without immigration, the U.S. labor force would likely have shrunk from 2010 to 2020.
2.4 Trends in Immigration and the Rural Labor Markets For a century, immigrant labor from various countries has been crucial for the production of high value vegetable, fruit, and nut crops in the United States. Immigrant labor in animal agriculture is a more recent phenomenon, becoming increasingly important as demand for workers increased dramatically as the scale of livestock and poultry production increased. In many rural labor markets, large scale livestock and poultry operations created jobs and demand for unskilled labor that did not exist in the local labor market prior to the emergence of these firms. This evolution of modern animal agriculture production and the associated increased labor demand occurred over the same time that large portions of rural America were losing population. Economists often debate if jobs follow workers, implying businesses start where there is an ample labor resource, or if the reverse is true, that workers follow jobs. In the case of large scale animal agriculture, there is surely little doubt that land, feed and open space, and processing facilities largely determined where large livestock farms located. In many regions of populous animal agriculture, foreign-born workers willing to move into shrinking rural labor markets have likely been critical to development of today’s efficient meat, poultry and dairy value chains. In the early decades of the immigration wave, from 1970 to 1980, newly arrived immigrant workers in general were largely concentrated in metropolitan areas. Outside of the metro areas during this decade, new immigrants from Mexico and other Latin American countries were concentrated in the three Southwestern states (TX, NM, AZ) and California, primarily harvesting seasonal crops, often returning to their country of origin after the harvest. However, as the immigration wave continued, immigrant workers settled in labor markets across the country and by 1990, Mexico was the top country of origin for immigrants in 18 U.S. states. By 2016 Mexican immigrants were the largest groups in 34 U.S. states. As can be seen from Figure 13, immigrant workers more frequently settle in urban counties, making up almost 7.4 percent of urban residents. By comparison, the average immigrant populations as a percent of rural counties' populations is low. According to U.S. Census Bureau estimates, in mostly rural counties, foreign born residents are just over 4 percent of the population and only 3.5 percent in completely rural counties. The median percentage foreign born in completely rural counties is estimated to be 2.4 percent, meaning that in half of completely rural counties, foreign born residents comprise less than 2.4 percent of the population. However, given that the labor force participation rate for immigrant workers is higher than for native-born workers, the proportion of immigrants in the rural labor force is higher than the 3.5 to 4.2 percent of population.

19 | P a g e
Figure 13. Percentage Foreign-Born by Urban/Rural Status of County 2014-2019 5-year estimates
Source: Author’s calculations using data based on sample, 2014 and 2019 American Community Survey 5-year estimates, U.S. Census Bureau
Figure 14 displays the geographic distribution of foreign-born population in mostly rural counties. In the Midwest, Great Plains and Southeast regions, the counties around meat processing centers had the highest percentages of foreign-born residents. Figure 14. Percent Foreign Born for Mostly Rural Counties: 2014-2019
Source: Author’s calculations using data based on sample, 2014 and 2019 American Community Survey 5-year estimates, U.S. Census Bureau
20 | P a g e
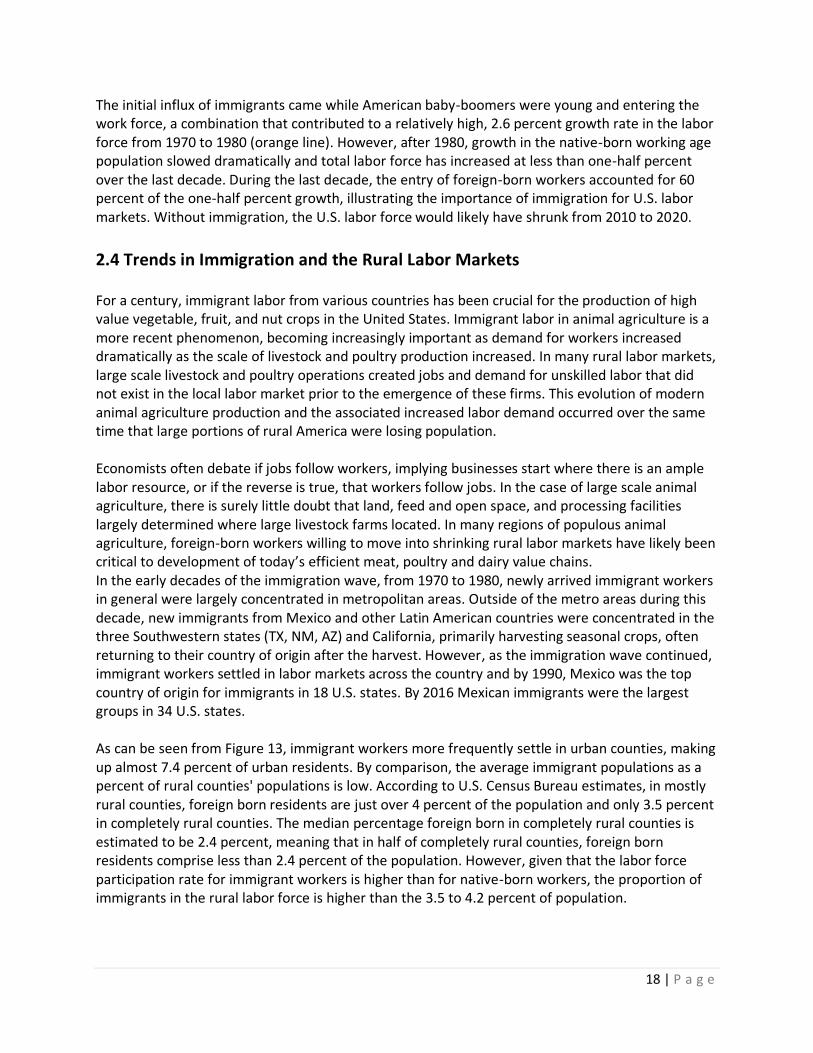
Figure 15 indicates the contribution of foreign-born workers to the rural labor force. Outside of the completely rural counties of the Southern Plains, foreign-born residents account for just over 2 percent of the population in most completely rural counties. As mentioned previously, unskilled and skilled immigrant workers have been critical to economic growth in the U.S. through maintaining growth in the labor force and contributing to productivity gains. In many rural labor markets, immigrant workers have lessened the negative effect of net out-migration, helping to keep rural communities in these markets economically viable. Figure 15. Percent Foreign Born for Completely Rural Counties: 2014-2019
Source: Author’s calculations using data based on sample, 2014 and 2019 American Community Survey 5-year estimates, U.S. Census Bureau
2.5 Possible Economic Implications of Changes in Immigration Laws or Policies
Given the political straws in the wind today, many agricultural stakeholders are concerned about the economic effects of possible tightened immigration and large-scale deportations of unauthorized workers. Because such policy shifts would affect the overall economy broadly, and would ripple out well beyond the agricultural sectors, an analysis of such policy changes are beyond the scope of this study. However, during previous national immigration debates, there was research into economic effects of tightening immigration. The 112th Congress (2011-2013) considered multiple policy measures that would have restricted immigration and to support those debates, the U.S. Department of Agriculture’s Economic Research Service conducted extensive research into the effects of various immigration reform scenarios. An ERS 2012 study analyzed the effects of dramatic immigration policy changes because overall, labor costs make up approximately 17% of the variable
21 | P a g e
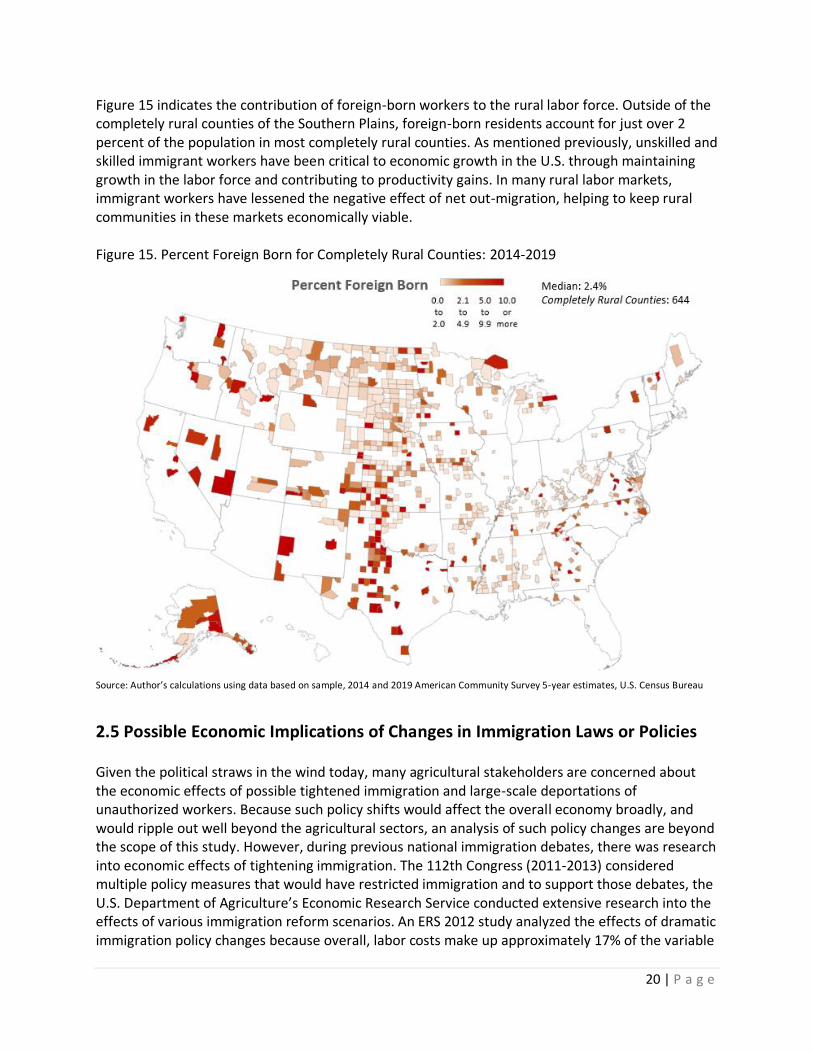
costs of production in U.S. agriculture as a whole. The Agricultural Resource Management survey in 2018 indicated that labor costs make up 13% of total farm expenses, and for some agricultural production sectors, labor costs approach 40% of total costs (see Figure 16). Figure 16. Hired Labor Costs as a Percent of Total Expenses in U.S. Agriculture, by Production Specialization, 2018.
Source: USDA, Economic Research Service using data from USDA’s 2018 Agricultural Resource Management Survey
The 2012 study used a simulation analysis to estimate the impact of a 5.8-million-person reduction in the number of unauthorized workers—agricultural and nonagricultural. This was compared to a base forecast which simulated how the economy would evolve under current laws and policies at the time of the study. Using simulation models to analyze the policy proposals was appropriate as the question pertained to the future or “what if?” and thus no actual data or results existed. The study made a 15-year projection of the results in agriculture and the overall U.S. economy. In the study, the unauthorized workforce was assumed to decrease by 2.1 million over the first 5 years. In year 5, the unauthorized workforce in the U.S. economy as a whole would be 4.0 million people smaller than in the base forecast. Growth in the unauthorized workforce was assumed to resume thereafter but at a slower pace than in the base forecast. By year 15, the projected size of the unauthorized workforce was 8.5 million, compared with 14.3 million in the base forecast, a difference of 5.8 million, or 40%. The long-run results from the decreased unauthorized labor supply showed a reduction in the labor supply to agriculture with effects on agricultural output and exports. Fruit, tree nuts, vegetables, and nursery production were among the most affected sectors with long-run relative declines of 2.0% to 5.4% in output and 2.5% to 9.3% in exports. These effects were smaller in other, less labor-
22 | P a g e
intensive, parts of agriculture—a 1.6% to 4.9% decrease in output and a 0.3% to 7.4% decrease in exports. The number of unauthorized workers employed as farmworkers fell by between 34.1% and 38.8%, relative to the base forecast for year 15. The number of farmworkers who were either U.S.-born or foreign-born, permanent residents increased by about 2.4% to 4.0% in the long run, compared with the base forecast, and their wage rate increased by 3.3% to 7.5%. However, the increased farm employment of U.S.-born and other permanent resident workers was not sufficient to offset the decrease in unauthorized farmworkers. As a result, the total number of farmworkers decreased by 3.4% to 5.5%. Model results suggested that wages would rise for U.S.-born and other permanent resident workers, relative to the base forecast, in some lower paying occupations where unauthorized workers are common. Wages would decrease slightly in many higher paying occupations, and decrease on average. Several factors accounted for the slight decrease in earnings. First, the decrease in the supply of unauthorized labor would lead to a long-run relative decrease in production, not just in agriculture but in all sectors of the economy. This, in turn, reduces incomes to many complementary factors of production, including U.S.-born and foreign-born, permanent resident workers in higher paying occupations. Second, with the departure of so many unauthorized workers, the occupational distribution of U.S.-born and other permanent resident workers necessarily shifts in the direction of more hired farm work and other lower paying occupations, such as food service, child care, and housekeeping, and away from higher paying occupations which is a much larger category. The effect of this compositional change was to reduce the average real wage for U.S.-born and foreign-born, permanent resident workers in all sectors of the economy, even as real wages in many lower paying occupations rose. In the long term, overall gross national product accruing to U.S.-born and foreign-born, permanent residents would fall by about 1%, compared with the base forecast. This result indicated that the negative economic effects generated by the departure of a significant portion of the labor force outweighed the positive effects on the wages of U.S.-born workers and other permanent residents employed in lower paying occupations. The results and conclusions of the study are broadly consistent with previous research related to immigration and labor markets pertaining to agriculture. A key assumption in this study is that the elasticity of labor supply is significantly less than infinite, which as is supported by most of the research on the topic (Zhaniser, et. al.). The implication of this assumption is that native-born workers would not simply replace a large reduction in in foreign-born workforce at the same wage level. Figure 12 which reports growth in the U.S. labor force, shows that growth in the labor force from native-born workers is trending toward zero, which begs the question— where would the native-born workers come from? Given the assumption that labor supply is less than infinite, researchers generally conclude or predict the following outcomes given a reduction in the supply of foreign-born workers:
23 | P a g e
• Real wages increase in response to the decreased supply of workers
• Increased wages result in a reduction in the demand for workers and agricultural employment falls
• Agricultural output declines as farmers abandon labor intensive enterprises
• Mechanization and technological advances replace labor in the long run Huffman (2007) and Martin (2009) emphasize that the response to rising wages is more dramatic on the demand for labor as compared to the supply. Martin and Calvin (2010) comment that “most analysts conclude that farmers will mechanize or reduce production before raising wages high enough to induce U.S. farmworkers into the fields.”
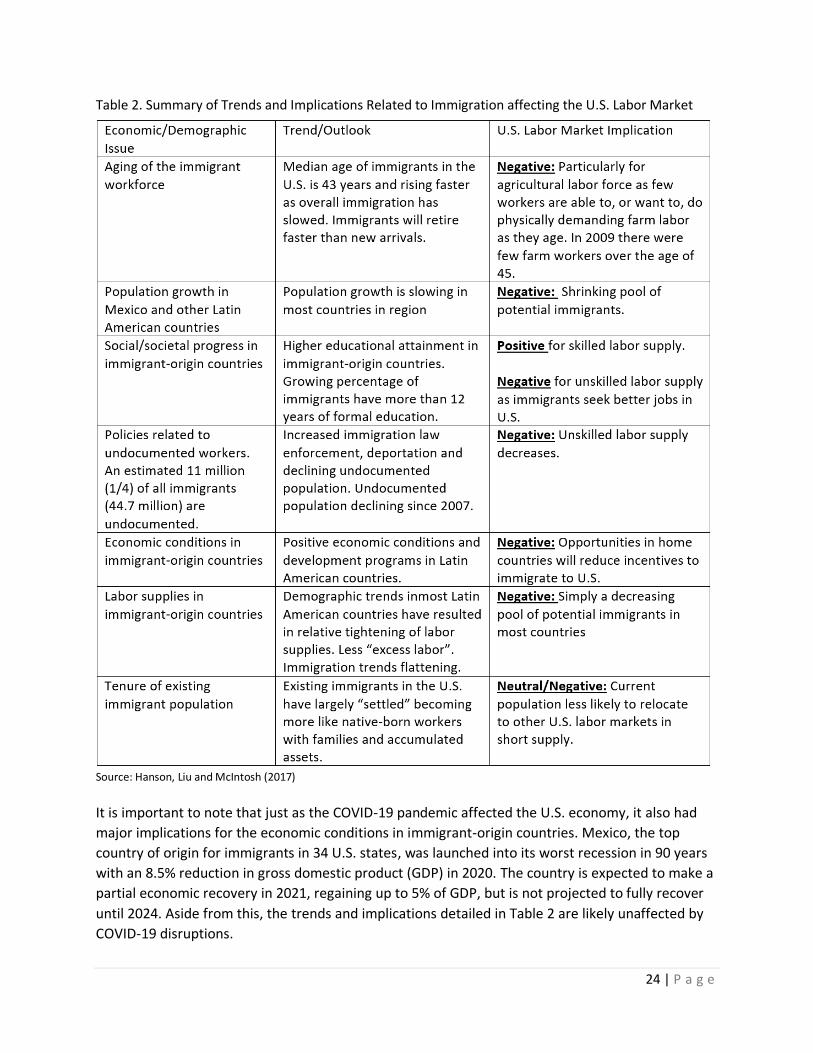
2.6 Future Trends in Immigration An apparent growing consensus among immigration researchers is that legal and illegal low-skilled immigration into the U.S. has peaked and will decline in the coming decades, even if U.S. policies do not put tighter controls on immigration. Hanson, Liu and McIntosh (2017) expressed the following sentiment in a recent article—“The policy dilemma facing the United States is thus not so much how to arrest massive increases in the supply of foreign labor, but rather how to prepare for a lower-immigration future”. Table 2 summarizes issues identified by Hanson, Liu and McIntosh (2017) with added trends and implications for the U.S. labor market.
24 | P a g e
Table 2. Summary of Trends and Implications Related to Immigration affecting the U.S. Labor Market
Source: Hanson, Liu and McIntosh (2017)
It is important to note that just as the COVID-19 pandemic affected the U.S. economy, it also had
major implications for the economic conditions in immigrant-origin countries. Mexico, the top
country of origin for immigrants in 34 U.S. states, was launched into its worst recession in 90 years
with an 8.5% reduction in gross domestic product (GDP) in 2020. The country is expected to make a
partial economic recovery in 2021, regaining up to 5% of GDP, but is not projected to fully recover
until 2024. Aside from this, the trends and implications detailed in Table 2 are likely unaffected by
COVID-19 disruptions.
25 | P a g e
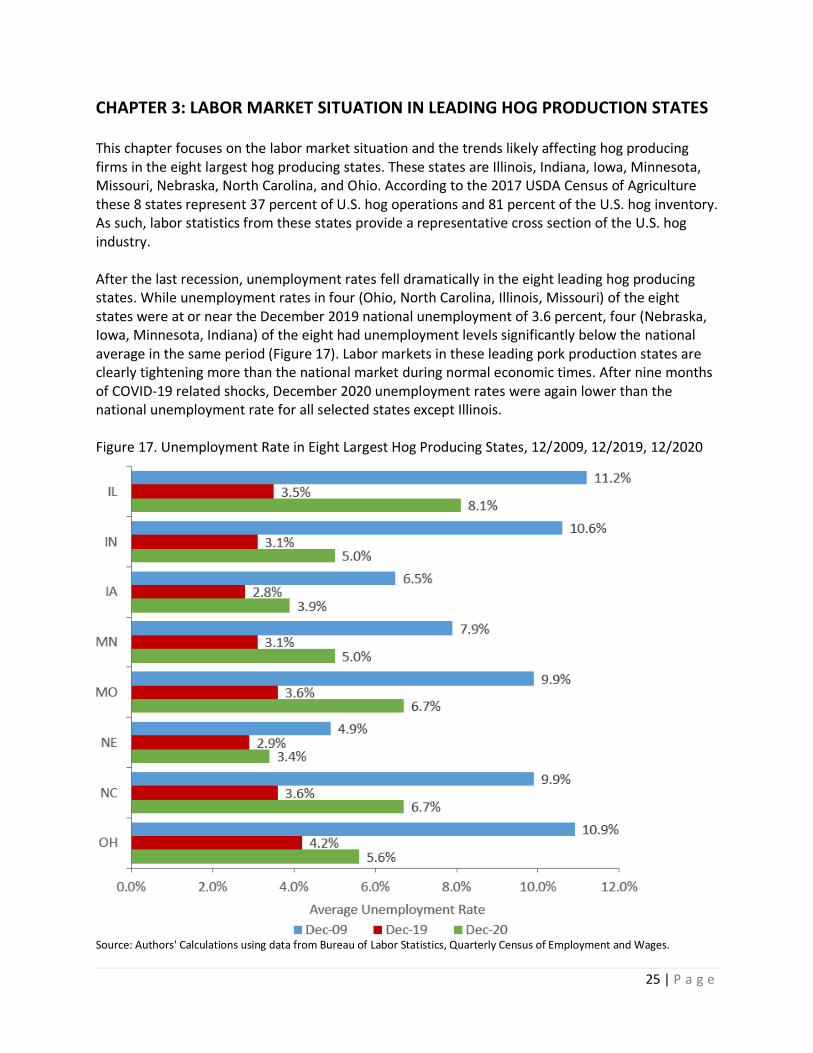
CHAPTER 3: LABOR MARKET SITUATION IN LEADING HOG PRODUCTION STATES This chapter focuses on the labor market situation and the trends likely affecting hog producing firms in the eight largest hog producing states. These states are Illinois, Indiana, Iowa, Minnesota, Missouri, Nebraska, North Carolina, and Ohio. According to the 2017 USDA Census of Agriculture these 8 states represent 37 percent of U.S. hog operations and 81 percent of the U.S. hog inventory. As such, labor statistics from these states provide a representative cross section of the U.S. hog industry. After the last recession, unemployment rates fell dramatically in the eight leading hog producing states. While unemployment rates in four (Ohio, North Carolina, Illinois, Missouri) of the eight states were at or near the December 2019 national unemployment of 3.6 percent, four (Nebraska, Iowa, Minnesota, Indiana) of the eight had unemployment levels significantly below the national average in the same period (Figure 17). Labor markets in these leading pork production states are clearly tightening more than the national market during normal economic times. After nine months of COVID-19 related shocks, December 2020 unemployment rates were again lower than the national unemployment rate for all selected states except Illinois. Figure 17. Unemployment Rate in Eight Largest Hog Producing States, 12/2009, 12/2019, 12/2020
Source: Authors' Calculations using data from Bureau of Labor Statistics, Quarterly Census of Employment and Wages.

26 | P a g e
One of the fundamental indicators of the ease or difficulty firms may have in hiring workers are trends in the overall labor force. The labor force in a given market is the number of working age individuals either employed or seeking employment. The labor force can change because workers migrate out of the market, retire or die, or no longer choose to work or seek employment for whatever reason. A growing labor force would be desirable for hiring firms and would mitigate the competition for workers from other firms and industries, especially during times of economic growth and increasing labor demand as the U.S. is experiencing now. A shrinking or stagnant labor pool makes it difficult for hiring firms as employers increasingly compete for the same workers. Figure 18 reflects a compilation of trends in the labor force in rural counties in the eight largest hog producing states. The time period covered includes the end of the most recent recession and the subsequent recovery years. For five of the top eight hog producing states, the labor force in rural counties has shrunk from the 2014 5-year estimates to the 2019 5-year estimate period. A shrinking labor pool means that existing and new firms in the labor market are competing for a shrinking pool of workers. Figure 18. Change in Rural County Labor Force 2014-2019 Estimates, Top Hog Producing States
Source: Authors' Calculations using American Community Survey 2014 and 2019 5-year estimates, U.S. Census Bureau.

27 | P a g e
With workers leaving the labor force (as shown in Figure 18), the impact on hiring firms might be moderated if there are individual workers in the market that might enter the labor force at some point in the future. The potential for workers on the sidelines of rural labor markets to enter or re-enter the labor market appears to be very limited in the eight leading hog states. Figure 19 reports the labor force participation rates for 20-44 year-old workers in rural counties. Labor force participation rate measures the rate that individuals are either employed or seeking work, as a percentage of the working population in question. Workers drop out of the labor force for numerous reasons—a worker may retire or go back to school full-time, a discouraged unemployed worker may quit seeking work, a parent may choose to quit work to stay home with a child. Given the strenuous and physically demanding nature often required of farm labor, we chose to examine the labor force changes in the 20-44 year old subset of workers in the overall rural labor force in the eight largest hog states. As can be seen from Figure 19, the labor force participation rates of prime working age rural residents in the leading hog states are already relatively high. The labor force participation rates in Nebraska, Minnesota, and Iowa are very high and the rates in the other leading hog states are well above the average of the total work force. As a reference point the overall labor force participation rate in the U.S. in January 2020 was 63.4 percent and has been declining in recent decades. Figure 19. Labor Force Participation Rates, Population Age 20-44, Rural Counties
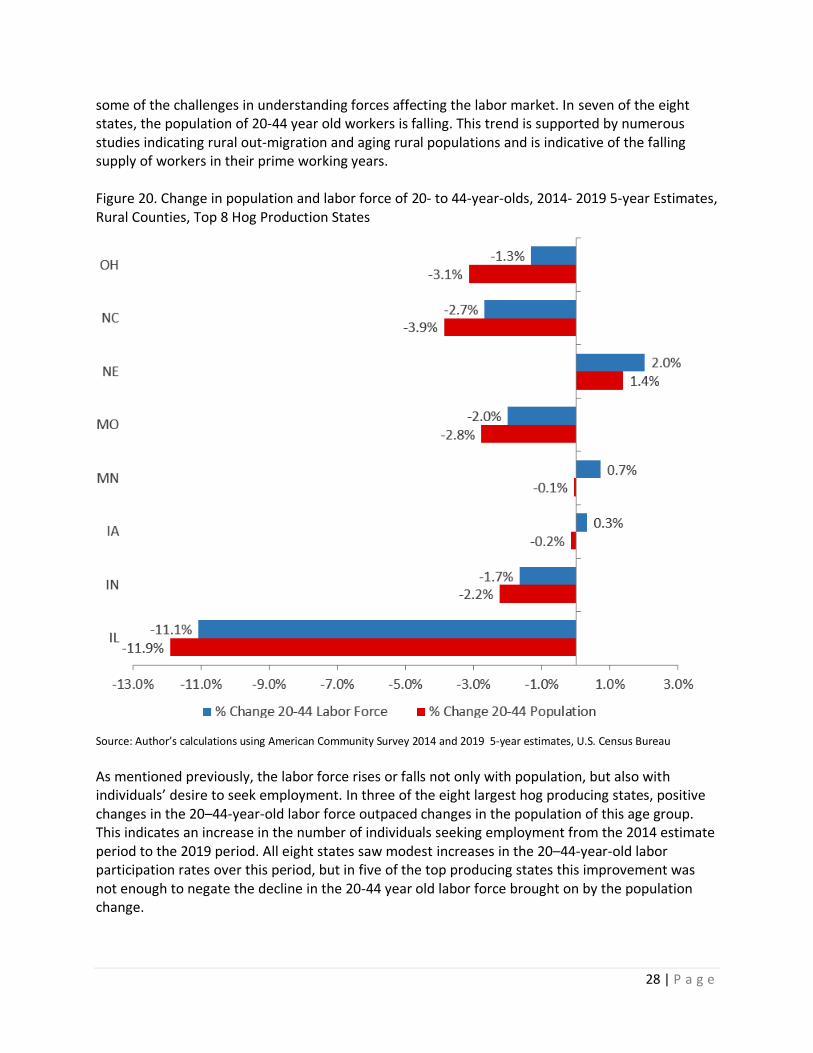
Source: Author’s calculations using American Community Survey 2014 and 2019 5-year estimates, U.S. Census Bureau Figure 20 provides additional insights into the shrinking labor force in the eight largest hog producing states by reporting changes in both population and the labor force. The figure highlights
28 | P a g e
some of the challenges in understanding forces affecting the labor market. In seven of the eight states, the population of 20-44 year old workers is falling. This trend is supported by numerous studies indicating rural out-migration and aging rural populations and is indicative of the falling supply of workers in their prime working years. Figure 20. Change in population and labor force of 20- to 44-year-olds, 2014- 2019 5-year Estimates, Rural Counties, Top 8 Hog Production States
Source: Author’s calculations using American Community Survey 2014 and 2019 5-year estimates, U.S. Census Bureau
As mentioned previously, the labor force rises or falls not only with population, but also with individuals’ desire to seek employment. In three of the eight largest hog producing states, positive changes in the 20–44-year-old labor force outpaced changes in the population of this age group. This indicates an increase in the number of individuals seeking employment from the 2014 estimate period to the 2019 period. All eight states saw modest increases in the 20–44-year-old labor participation rates over this period, but in five of the top producing states this improvement was not enough to negate the decline in the 20-44 year old labor force brought on by the population change.
29 | P a g e
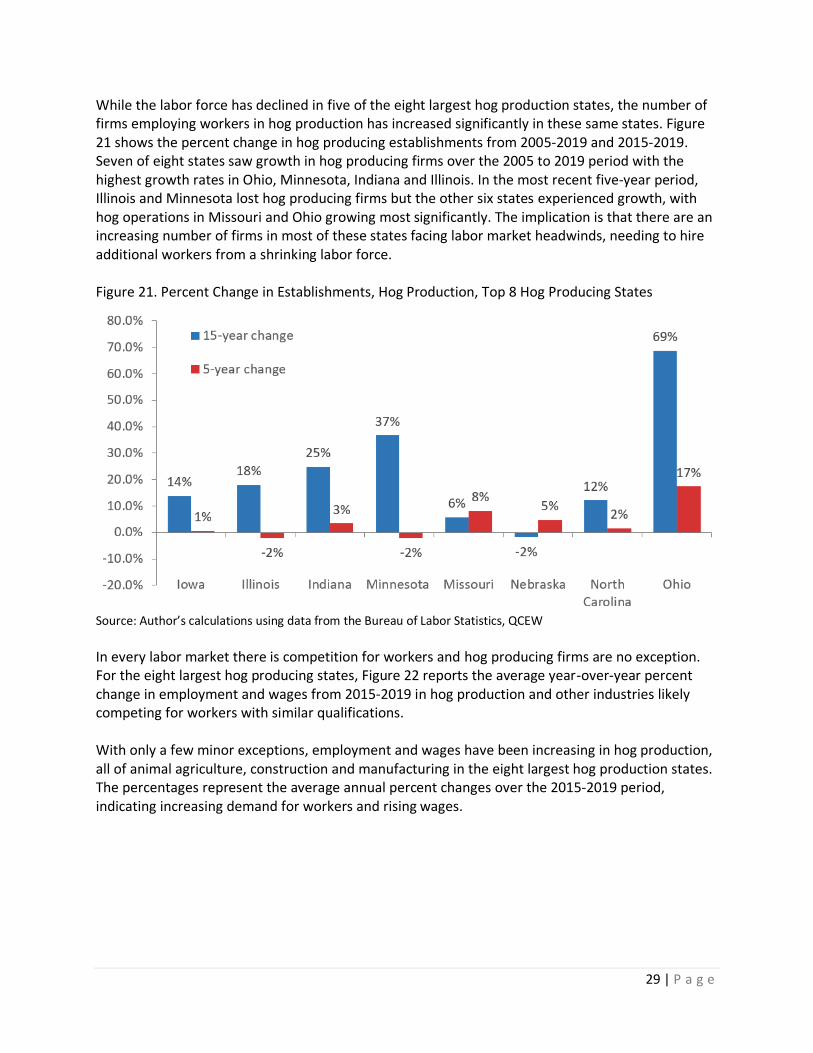
While the labor force has declined in five of the eight largest hog production states, the number of firms employing workers in hog production has increased significantly in these same states. Figure 21 shows the percent change in hog producing establishments from 2005-2019 and 2015-2019. Seven of eight states saw growth in hog producing firms over the 2005 to 2019 period with the highest growth rates in Ohio, Minnesota, Indiana and Illinois. In the most recent five-year period, Illinois and Minnesota lost hog producing firms but the other six states experienced growth, with hog operations in Missouri and Ohio growing most significantly. The implication is that there are an increasing number of firms in most of these states facing labor market headwinds, needing to hire additional workers from a shrinking labor force. Figure 21. Percent Change in Establishments, Hog Production, Top 8 Hog Producing States
Source: Author’s calculations using data from the Bureau of Labor Statistics, QCEW
In every labor market there is competition for workers and hog producing firms are no exception. For the eight largest hog producing states, Figure 22 reports the average year-over-year percent change in employment and wages from 2015-2019 in hog production and other industries likely competing for workers with similar qualifications. With only a few minor exceptions, employment and wages have been increasing in hog production, all of animal agriculture, construction and manufacturing in the eight largest hog production states. The percentages represent the average annual percent changes over the 2015-2019 period, indicating increasing demand for workers and rising wages.

30 | P a g e
Figure 22. Average Year-Over-Year Change in Employment and Average Annual Pay, 2015-2019 Source: Authors’ calculations using data from the Bureau of Labor Statistics, QCEW.

31 | P a g e
The red bars indicate growth in number of employees and the blue bars indicate growth in annual wages. For hog production jobs, in seven of the eight states (Iowa, Minnesota, Missouri, Nebraska, North Carolina, Indiana and Oklahoma), annual wages are increasing faster than employment. This is a potential indication that employers are having difficulty attracting more workers with higher wages and perhaps fighting harder to retain workers on the payroll. It is also noteworthy that hog production wages are rising faster than the state total employee wages in six of the eight states. Except for North Carolina, there has been significant employment and wage growth in all of animal agriculture. It is important to note the data reflected in Figure 22 are state level data and that the industries of construction and manufacturing are significantly larger than hog production in terms of labor demand and workers employed. For example, in most of the eight states, construction employment rebounded strongly over the period and a given percentage increase in construction employment represents a much larger draw out of the labor force compared to a similar change in hog production employment. In each state panel, the bottom bars are overall state level changes in employment and wages, and it is noteworthy that hog production employment and wages have been growing faster than overall employment in many states.
32 | P a g e
CHAPTER 4: INDUSTRY OUTREACH AND FINDINGS This chapter provides an overview of the insights and feedback gathered via an industry outreach effort. The goal of this effort was to illuminate the general perspective of pork industry participants and their respective views on labor market opportunities and challenges within the industry and ways to potentially meet labor needs through management and policy solutions. Every interview we conducted pointed to the immense importance of hired labor to farm success and this importance can be summarized as follows. Farms that have good performance achieve it because of their people. It is not an accident when a farm is staffed, over a long time horizon, with motivated people who work together to achieve a common goal of production excellence. Pigs do not achieve excellence; people achieve excellence through their pigs (Swan, 2010). Given the amount of detail respondents were asked to provide and the time commitment required, it was deemed appropriate to conduct interviews with targeted questions. This provided for semi-structured interviews where respondents provided insight regarding particular questions but also garnered ample opportunity to expand upon, redirect, or add anything that was needed. There were several considerations shared by interview participants that came out during discussions which are summarized below.
4.1 Organizational Structure Organizational hierarchies remain the most used and, arguably, the most effective way of staffing on hog production farms. Although titles vary across employers and farm types and sizes, Table 3 generally defines the labor positions and nature of skills currently employed on farms. By design, farms typically have four levels of responsibility. These include, in descending hierarchy, farm manager, department manager, senior technician, and technician. At times, and differing across farm types and sizes, contract and/or custom labor are utilized to perform specialized tasks that can eliminate machinery and equipment costs, the need for specialized training, and reduce labor requirements.

33 | P a g e
Table 3. Generalized Hog Farm Organizational Model
Source: Extracted from Swan (2010) and confirmed by interview participants
Participants were asked to describe the typical path for growth and promotion of farm labor within a company. The resounding answer was that employers typically, and preferably, promote from within. For example, department managers and even farm managers often begin as technicians. One respondent summarized the promotion within their company as follows, “We rarely hire someone from another job/career and put them into a farm leadership position, and it is not overly common to ‘steal’ an experienced manager or department head from another company—the people in these positions rarely uproot their families to go work for another company, we are 90% homegrown growth from within starting at either the bottom or our Production Leadership Program.” Companies have implemented manager training programs as a way to attract employees as well as promote the correct employees. “With larger farms we need leaders who have developed good people skills along with sound pig skills. Too many times we have promoted good pig people as opposed to people with both good pig and people skills,” shared one respondent. A natural outcome of the manager training programs has been companies are hiring more college graduates. This trend is expected to continue as manager training programs have been designed to
34 | P a g e
complement targeted college degree programs in the local or regional area. Significant resources have been devoted to developing relationships with university faculty, staff, and administrators and presence at universities through summer internship opportunities and career fairs have all helped to develop a pipeline to employment with companies. This was all viewed as a positive step in the direction of recruiting employees to leadership positions, however, the need for technicians remains strong. “It’s an industry problem, everyone is struggling for truck drivers and mechanics are in high demand,” shared one respondent. “We seem to be operating with about 10 percent of our positions unfilled most of the time,” said another respondent. “We do not have many people leave but we do have 25 percent turnover because J-1 visa holders leave every year. It is planned turnover,” shared a third interviewee.
4.2 Hiring Employees in the Local Labor Market One point of consensus among the interview participants is the difficulty hiring farm employees in the local labor market. One interviewee stated, “People who do not work are not applying for jobs with us, we have a large group of unemployed people within 30 minutes of three of our farms and they are not interested in helping us.” Many participants indicated that wages and benefits are very competitive with other local businesses and bonus and incentives are available that help to enhance earnings. One interviewee pointed to state labor laws potentially impacting the labor market. For example, hourly agricultural employees in Minnesota must be paid overtime at the rate of time and a half the employee’s regular rate of pay for all hours worked in excess of 48 hours in a workweek (Minnesota Department of Labor & Industry). This compares to paid overtime in many other business after 40 hours in a work week in Minnesota. It was suggested some agricultural companies have begun paying overtime after 40 hours because it has been a hiring issue for them. One interviewee shared “It’s a disadvantage in Minnesota that we have to pay overtime after 48 hours because most of the country doesn’t have to pay overtime at all in agriculture.” Organizational conditions of work were held to be much more constraining on the ability to hire in the local labor market than were the physical conditions of the work. Specifically, farm hours, including weekend and holiday work were more of a barrier as opposed to the physically demanding nature of the work. One interviewee stated, “For local employees, the biggest problem is they just don’t show up for work. Local employees tend to call in sick on the weekends or do not want to work on weekends. With foreign-born workers we have to tell them you can’t work so many hours. Or, you have to take every other weekend off. Or, you have to take lunch hour. Or, you have to be done at 5pm.” Competition for workers in the local labor market is forcing the adoption of work schedules more appealing to today’s workers. Employers have become more cognizant of worker time off and have implemented rotation schemes to provide flexibility in scheduling, if possible and at times have overstaffed to ensure a sufficient number of employees, manageable workloads, and to prevent crisis.
35 | P a g e
4.3 Hiring Immigrant or Temporary Foreign Employees One of the key principles guiding the U.S. immigration system has been admitting foreign workers with skills that are valuable to the U.S. economy. Several interview participants highlighted positive attributes of these employees including a willing and able workforce, high level of commitment to the job and strong work ethic, accepting of working conditions, respectful of employers, managers and other employees, and ability to provide referrals of other potential employees. Labor laws regarding temporary foreign workers were perceived as challenging by some interviewed participants. The visa classifications vary in terms of their eligibility requirements, duration, whether they permit workers to bring dependents, and other factors. Table 4 includes information on several of the most common temporary employment-based visa classifications that were cited by interview participants. One interviewee stated, “The TN visa program is great for us, but we do have to plug them in at lead positions, which we need for sure, but we need technicians more. There is need for H-2A reform that helps us get technicians.” At the time of the interviews, there was wide support for the House Appropriations Committee amendment, approved as part of the Fiscal Year 2018 Homeland Security Appropriations Act, which would extend the H-2A guest worker visa program to all of agriculture. Under this amendment the H-2A program would remain a temporary source of agriculture labor and there would still be time limits for how long workers can stay in the U.S., but it would allow H-2A workers to be admitted for purposes of performing labor as a year-round livestock worker. More recently, H-2A reform has been proposed through the Farm Workforce Modernization Act of 2021. This bill would streamline several processes associated with the H-2A program and would open it up to agricultural work that is not temporary or seasonal, although these visas would be capped with a large portion reserved for the dairy industry. The Farm Workforce Modernization Act would also establish a certified agricultural worker (CAW) status, allowing alien farmworkers to earn legal status and a 5.5-year renewable visa for seasonal or non-seasonal agricultural work. Matching of temporary foreign employees and suitable jobs or tasks on a farm was brought up as a potential point of debate. Participants expressed varying degrees of experience with employees not necessarily performing the tasks they were recruited to the U.S. and hired to do, which was in part caused by the need for certain tasks to be performed on the farm and the rather rigid nature of the eligibility requirements for temporary employment-based visa classifications. For example, some temporary employees who are eligible under a professional, trainee, or intern designation, were instead being tasked with entry-level work. However, as was pointed out by interviewees, promotion from within is the typical and preferred model of growth within a company.
While there are always improvements that can be made to existing programs, a primary concern among industry participants was not losing the tools currently available to recruit and hire foreign-born labor. One interview participant shared their stance as, “Limited access to people from overseas would seriously pose a threat to our ability to operate our farms successfully and would also impair our commitment to caring for our pigs with a high level of animal welfare practices. We

36 | P a g e
have plenty of opportunities for both American and international people to participate and be successful in our industry.” Table 4: Characteristics of Temporary Employment-Based Visa Classifications Commonly Used in Swine Production
Source: United States Department of Labor, Employment & Training Administration
Hiring foreign-born employees does not come without challenges. Language and cultural differences were cited as a challenge at times. Several methods for overcoming the language barrier were highlighted by participants, including translation of operating procedures to aid employees in their daily tasks, hiring a translator to attend meetings and facilitate open communication, having a bilingual employee act as a translator, and utilizing companies who assist farms in bridging language and cultural gaps.

37 | P a g e
Cultural backgrounds and expectations of employees were also discussed as factors that need to be considered when hiring foreign-born employees. “Historically, there were fewer nonimmigrants as part of the workforce and there was an easier ability to communicate with the workforce. Today, a larger nonimmigrant population as part of the workforce necessitates an even greater need for better interpersonal skills and leadership to build a common purpose.” Social environment was acknowledged as important to overcoming many of these challenges if they existed. Discussion of social environment centered on matching employees to their managers and teams, flexibility in team assignments, informal meetings with employees, and support in personal matters.
4.4 Impact of New Regulations, Technologies, and Practices on Labor
Requirements There are a lot of staffing variables in the swine industry and there are a wide range of phases and new ways to do things. However, a recurring theme shared across interviews was the importance of animal care and recognition of an appropriate employee to pig ratio. “I would rather pay one person too many than have one person too few,” was a sentiment shared. Staffing a farm at the optimal level is difficult but may be accomplished through stockpiling workers. Chronic shortfalls in employment results in labor costs being under budget. During times when candidates are more available, additional employees can be hired without exceeding labor budgets, if labor costs are analyzed over an extended period of time. Stockpiled workers can be placed in temporary positions at other farms until they can be placed where they are needed. Producers and their farm employees are missioned to provide the best animal care to set up their farms’ success. With that in mind, respondents indicated it is imperative to provide employees the resources necessary to do their jobs effectively. One interviewee shared, and was echoed by many others, “Formal education and training is now more important as we are mandated to follow programs such as the Common Industry Audit.” It was viewed as important to have the entire staff fully trained in the farm’s specific procedures, as well as for employees to go through Pork Quality Assurance training, and Transport Quality Assurance training for those individuals responsible for the movement of pigs. One interviewee stressed that industry changes may have the most impact on managers. “As the industry has changed with respect to new regulations and practices, managers have struggled with it the most. The antibiotic issue would be number one. The auditing and the paper work too. Getting managers to recognize the importance of these policies and processes can be an ongoing challenge but also an opportunity for education. If they don’t buy in, the rest of the employees do not buy in,” were some views shared. Raising swine is more than human-pig interaction, and equipment used in and around farm makes the day-in and day-out processes go more smoothly. It is important for employees to have the right equipment to do their jobs properly. A follow-up to providing the proper equipment is to make sure that employees are properly trained in the use of that equipment.

38 | P a g e
On the extent to which capital investments could increase or decrease labor needs, several views were shared. One interviewee suggested, “Newer technology and improved layouts of farms could result in operating with more sows per person, but I think at this time it will be a subtle change if any in regard to demand as we are always operating understaffed. If we were not operating understaffed then yes, it could change demand.” The substitution of capital and technologies for labor and management is a primary advantage that large, specialized hog production units have over smaller, diversified operations. However, one respondent cautioned that, “Yes, labor is a challenge and some fix it with capital but at the end of the day you still need people to implement it.” The pork industry is currently in a period of growth. This begs the question of whether concerns and current trends in the labor market have or would affect a firm’s decision to expand operations or invest in the pork production sector. The response by one industry participant was rather optimistic and motivating, “No it wouldn’t, we simply have to find ways to attract people to our business.”
4.5. Future Work In many ways the active discussions we had with participants was viewed as the first in a multi-step process towards assessing labor market issues and carefully assessing ways to keep management practices and policies concurrent with industry needs and trends. Future efforts, informed by this study, could utilize more comprehensive producer and industry stakeholder surveys to provide a more comprehensive picture of labor market issues and trends. The benefits of this would be a deeper and likely more wide‐ranging assessment.
39 | P a g e
REFERENCES Artz, G. and L. Yu. 2011. How ya Gonna Keep ‘em Down on the Farm: Which Land Grant Graduates Live in Rural Areas? Economic Development Quarterly 25:341-352. Boucher, S.R., A. Smith, J.E. Taylor, and A. Yúnez-Naude. 2007. Impacts of Policy Reforms on the Supply of Mexican Labor to U.S. Farms: New Evidence from Mexico. Review of Agricultural Economics 29(1): 4-16. Boucher, S.R. and J.E. Taylor. 2007. Policy Shocks and the Supply of Mexican Labor to U.S. Farms. Choices 22(1): 37–42. Charlton, D. and J.E. Taylor. 2016. A Declining Farm Workforce: Analysis of Panel Data from Rural Mexico. American Journal of Agricultural Economics 98(4): 1158-1180. Cromartie, J. 2017. Rural Areas Show Overall Population Decline and Shifting Regional Patterns of Population Change. Amber Waves. Available online at https://www.ers.usda.gov/amber-waves/2017/september/rural-areas-show-overall-population-decline-and-shifting-regional-patterns-of-population-change/. Cromartie, J. 2020. Modest Improvement in Nonmetro Population Change During the Decade Masks Larger Geographical Shifts. Amber Waves. Available online at https://www.ers.usda.gov/amber-waves/2020/july/modest-improvement-in-nonmetro-population-change-during-the-decade-masks-larger-geographic-shifts/#:~:text=The%20nonmetro%20growth%20rate%20has,widened%20considerably%20in%20recent%20years.&text=By%20comparison%2C%20between%20July%202016,population%20grew%20by%20nearly%2019%2C000. Espey, M. and D.D. Thilmany. 2000. Farm Labor Demand: A Meta-Regression Analysis of Wage Elasticities. Journal of Agricultural and Resource Economics 25(1): 252-266. Fan, M., S. Gabbard, A.A. Pena, and J. Perloff. 2015. Why Do Fewer Agricultural Workers Migrate Now? American Journal of Agricultural Economics 97(3): 665-679. Fisher, D.U. and R.D. Knutson. 2013. Uniqueness of Agricultural Labor Markets. American Journal of Agricultural Economics 95(2): 463-469. Gryn, T. 2016. The Foreign-Born by Urban-Rural Status of Counties: 2011-2015. Census Blogs, December 8. Available online at https://census.gov/newsroom/blogs/random-samplings/2016/12/the_foreign-bornby.html. Hanson, G., C. Liu, and C. McIntosh. 2017. The Rise and Fall of U.S. Low-Skilled Immigration. No. w23753. National Bureau of Economic Research. Hertz, T. and S. Zahniser. 2013. Is There a Farm Labor Shortage? American Journal of Agricultural Economics 95(2): 476-481.
40 | P a g e
Hess, A. 2020. Wanted: A viable workforce. National Hog Farmer. Available online at https://www.nationalhogfarmer.com/business/wanted-viable-workforce. Hill, A. “The Labor Supply of U.S. Agricultural Workers.” UC-Davis Migration Research Center. Available online at https://arefiles.ucdavis.edu/uploads/filer_public/ac/59/ac592f0a-39c4-44b2-ac13-c3cc11ad28eb/hillfarmworkersfinal.pdf. Hurley, T.M., Kliebenstein, J., Orazem, P.F. 1999. The Structure of Wages and Benefits in the U.S. Pork Industry. American Journal of Agricultural Economics 81(1): 144-163. Hurley, T.M., Kliebenstein, J., Orazem, P.F., Miller, D. Employee Rosters Rise: Wages on The Upswing. National Hog Farmer. June 15, 2005. Available online at http://www.nationalhogfarmer.com/mag/farming_employee_rosters_rise_2. Lattice Publishing. 2017. States with the most immigrants. Available online at https://www.latticepublishing.com/blog/states-with-the-most-immigrants. Martin, P., Calvin, L. 2010. Immigration Reform: What Does It Mean for Agriculture and Rural America? Applied Economic Perspectives and Policy 32(2): 232–253. Minnesota Department of Labor & Industry. Fact sheet –Agricultural workers. Available online at https://www.dli.mn.gov/LS/Pdf/ag_workers_fact_sheet.pdf. Esposito, A., Graham, D., Barrera, A., Garrison, C. 2021. Mexico’s economy could easily grow over 5% in 2021: finance ministry. Reuters. Available online at https://www.reuters.com/article/us-mexico-economy/mexicos-economy-could-easily-grow-over-5-in-2021-finance-ministry-idUSKBN2BE344. Rosson, C. 2012. Regional Views on the Role of Immigrant Labor on U.S. and Southern Dairies. Journal of Agricultural and Applied Economics 44(3): 269-277. Subedi, D. 2020. Labor costs on specialty crop farms accounted for 3 times as much of their total cash expenses as the average for all U.S. farms. Economic Research Service. Available online at https://www.ers.usda.gov/data-products/chart-gallery/gallery/chart-detail/?chartId=98569. Swan, M.K. Swine Human Resources: Managing Employees. Extension. April 8, 2010. Available online at http://articles.extension.org/pages/27276/swine-human-resources:-managing-employees#Staffing_Farms. Taylor, J.E., Charlton, D., Yúnez-Naude, A. 2012. The End of Farm Labor Abundance. Applied Economic Perspectives and Policy 34(4): 587-598. Zahniser, S., Hertz, T., Dixon, P., Rimmer, M. “The Potential Impact of Changes in Immigration Policy on U.S. Agriculture and the Market for Hired Farm Labor: A Simulation Analysis.” ERR-135, U.S. Department of Agriculture, Economic Research Service. May 2012. Available online at https://www.ers.usda.gov/webdocs/publications/44981/err-135.pdf?v=7679.9