a bayesian random split to build ensembles of classification trees
TRANSCRIPT

A Bayesian Random Split to BuildEnsembles of Classification Trees
Andrés Cano and Andrés R. Masegosa and Serafín Moral
Department of Computer Science and Artificial Intelligence
University of Granada
Verona, July 2009
10th European Conference on Symbolic and Quantitative Approaches to Reasoning with Uncertainty
ECSQARU 2009 Verona (Italy) 1/22

Introduction
Part I
Introduction
ECSQARU 2009 Verona (Italy) 2/22

Introduction
Introduction
Ensembles of Randomized Decision Trees I
Features
Randomized decision trees were first proposed by Minger [2].
Ensembles of decision trees exploited this idea: several DT were generatedwith random differences among them.
They take advantage of their inherent instability to ease the introduction ofrandomness.
ECSQARU 2009 Verona (Italy) 3/22

Introduction
Introduction
Ensembles of Randomized Decision Trees II
Randomized Training Datasets
Bagging: Boostrapping Aggregating.
Each DT is built with different replicas of the training data set generated byrandom sampling with replacement.Randomness is introduced by the random variations of the bootstrappeddatasets.
Random Split Operators
Diettrich et al. [4] built ensembles where the split node was randomly selectedfrom among the K best splits attributes.
Breiman’s Random Forests [1] combined a Bagging scheme with random splitnode selection.
Performance of ensembles of DT
Notion of bias-variance error decomposition [7,8].
Ensembles of DT maintain bias while reduce variance component when thesize of the ensemble increases.
ECSQARU 2009 Verona (Italy) 4/22

Introduction
Introduction
Motivation of this study
Description
Propose a new random split method inspired in a Bayesian approach forbuilding ensembles of trees.
It is similar to the random split operator of Random Forests.
It is less sensitive to the selection of a parameter and have a competitiveaverage error, bias and variance.
Outline
A Bayesian account to Classification Trees.
Experimental Results.
Conclusions and Future Works.
ECSQARU 2009 Verona (Italy) 5/22

A Bayesian Account to Classification Trees
Part II
A Bayesian Account to Classification Trees
ECSQARU 2009 Verona (Italy) 6/22

A Bayesian Account to Classification Trees
Basic Framework
Classification Trees
Example Description
Tree T and parameters ΦT
ΦT = {(0.9, 0.1), ..., (0.8, 0.2)}P(c2|(x2, y2),T ,ΦT ) = 0.95
Notation
Data set D = (~x ,~c), ~x is set of multino-mial attributes and ~c are the class values.
ΦT = {φk,l : k = 1, ...,K ; l ∈ leaves(T )}P(C = ck |x ,T ,ΦT ) = φk,l , if x falls inleaf l .
Bayesian Approach to Classification Trees
T and ΦT are considered random variables [9].
A prior distribution is defined.
Posterior distributions of T and ΦT given the data D are computed.
ECSQARU 2009 Verona (Italy) 7/22
A Bayesian Account to Classification Trees
Basic Framework
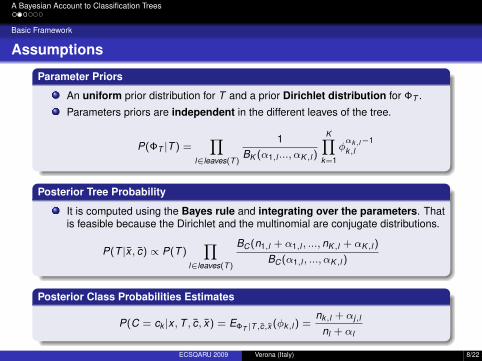
Assumptions
Parameter Priors
An uniform prior distribution for T and a prior Dirichlet distribution for ΦT .
Parameters priors are independent in the different leaves of the tree.
P(ΦT |T ) =∏
l∈leaves(T )
1BK (α1,l ..., αK ,l )
K∏k=1
φαk,l−1k,l
Posterior Tree Probability
It is computed using the Bayes rule and integrating over the parameters. Thatis feasible because the Dirichlet and the multinomial are conjugate distributions.
P(T |x̄ , c̄) ∝ P(T )∏
l∈leaves(T )
BC(n1,l + α1,l , ..., nK ,l + αK ,l )
BC(α1,l , ..., αK ,l )
Posterior Class Probabilities Estimates
P(C = ck |x ,T , c̄, x̄) = EΦT |T ,c̄,x̄ (φk,l ) =nk,l + αj,l
nl + αl
ECSQARU 2009 Verona (Italy) 8/22

A Bayesian Account to Classification Trees
Basic Framework
Ensembles of Classification Trees
Bayesian Solution: Model Averaging [9]
Consider all possible models with the corresponding posterior probability.
Final prediction is composed by a set of weighted predictions.
P(C = ck |x , c̄, x̄) =∑
T
∫ΦT
P(C = ck |x ,T ,ΦT )P(T ,ΦT |c̄, x̄)dΦT (1)
Implementation Issues
Equation (1) can be approximated by Monte-Carlo methodsProblem: If model space is huge, it would lead to a very computationallyexpensive approach.
Hybrid Solution: Bayesian Random Split
Tree structures are generated in an approximate proportion to their posteriorprobabilities (similar to Monte-Carlo methods).
We employ an efficient technique very similar to random forests.
ECSQARU 2009 Verona (Italy) 9/22

A Bayesian Account to Classification Trees
Ensembles of Classification Trees
Random Forests: Random Split Node Selection
Scheme Steps
1 K attributes (Xi1 , ...,XiK ) are randomlyselected from the set of available splitattributes.
2 Compute an split score for each of theselected nodes.
3 Select the attribute with the highest score.
If maximum score is negative, repeatthe procedure.
Comments
Different scores can be used: GIx, IG or IGR.
Trees are not prunned.
Suggested value: K = ln N.
ECSQARU 2009 Verona (Italy) 10/22
A Bayesian Account to Classification Trees
Ensembles of Classification Trees
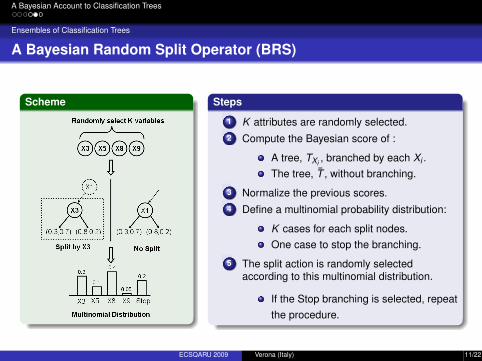
A Bayesian Random Split Operator (BRS)
Scheme Steps
1 K attributes are randomly selected.2 Compute the Bayesian score of :
A tree, TXi , branched by each Xi .The tree, T̄ , without branching.
3 Normalize the previous scores.4 Define a multinomial probability distribution:
K cases for each split nodes.One case to stop the branching.
5 The split action is randomly selectedaccording to this multinomial distribution.
If the Stop branching is selected, repeatthe procedure.
ECSQARU 2009 Verona (Italy) 11/22

A Bayesian Account to Classification Trees
Ensembles of Classification Trees
A Bayesian Random Split Operator (BRS)
Comments
Splits scores are probabilities, so random split node selection can properlycarried out.
Informative scores does not allow this process.
Bayesian scores have an inherent penalty to complexity.
Stop branching is probabilistically managed.
Random Forests fully grows the trees.
A heuristic which tries to recover the classification trees in a approximateproportion to their posterior probability.
Random Forests justifies its performance with the notion of strength andcorrelation among trees.
ECSQARU 2009 Verona (Italy) 12/22

Experimental Evaluation
Part III
Experimental Evaluation
ECSQARU 2009 Verona (Italy) 13/22

Experimental Evaluation
Experimental Evaluation
Experimental Evaluation Set-up
Data Sets Benchmark
23 UCI datasets with very different features.
Missing values were replaced with mean and mode values for continuous anddiscrete attributes respectively.
Continuous attributes were discretized with Fayyad & Irani’s method [15].
Preprocessing was only carried out considering information for training data sets.
Bias-Variance error decomposition analysis [8,16]
Error can be seen as the sum of bias and variance components.
Bias measures the component of the error resulting from the incapacity of thepredictor to model the underlying distribution.
Variance represents the component of the error that stems from theparticularities of the training sample.
Evaluation
Friedman test and the Bonferroni post-hoc test [17].
ECSQARU 2009 Verona (Italy) 14/22

Experimental Evaluation
Experimental Evaluation
The role of K in Randon Forests
The ranks assessed by Friedman Test are depicted at 0.05 level.As lower the rank, better classification error.Ranks in bold face indicates a statistically significant difference respect to BRSwith 10 Trees and K=1 with Bonferroni Test.
RF Trees1050
100200
?BRS (10 trees) RFK=1 K=1 K=3 K=5 K=Log N2.0 3.9 3.1 2.9 3.13.4 3.5 2.6 2.9 2.73.7 3.2 2.3 2.8 2.93.8 3.1 2.7 2.8 2.6
Analysis
RF 10 Trees is statistically worst for K=1 and K=3.
Only RF 100 Trees and K=3 is statistically better than BRS 10 Trees.
Random Forests seem very sensitive to the specific K value.
ECSQARU 2009 Verona (Italy) 15/22

Experimental Evaluation
Experimental Evaluation
The role of K in BRS
The ranks assessed by Friedman Test are depicted.As lower the rank, better classification error.Ranks in bold face indicates a statistically significant difference respect to RFwith 10 Trees and K=Log N with Bonferroni Test.
BRS Trees1050100200
?RF (10 trees) BRSK=Log N K=1 K=3 K=5 K=Log N
4.3 3.2 2.1 2.6 2.84.9 2.7 2.3 2.5 2.65.0 2.3 2.5 2.7 2.65.0 2.4 2.4 2.7 2.5
Analysis
BRS 10 Trees is statistically better than RF 10 Trees with different K values.
Our approach with a higher number of trees is always better with any K value.
BRS seems to be much less sensible to the specific K value.
ECSQARU 2009 Verona (Italy) 16/22

Experimental Evaluation
Bias-Variance error decomposition
Average Classification Error
The ranks assessed by Friedman Test are depicted.As lower the rank, better the performance.Ranks in bold face indicates a statistically significant difference respect to BRSK=1 with Bonferroni Test.
Trees1050
100200
?BRS RFK=1 K=1 K=3 K=5 K=Log N2.01 3.9 3.1 2.9 3.12.41 3.7 2.9 3.1 2.92.51 3.6 2.7 3.1 3.22.41 3.5 3.1 3.1 2.9
Conclusions
BRS clearly has a better ranking across the different sizes of ensembles and thedifferent K values employed by RF.
The K value with best ranking for RF changes with the size of the ensemble.
There is no statistical significant differences with non parametric tests.
ECSQARU 2009 Verona (Italy) 17/22

Experimental Evaluation
Bias-Variance error decomposition
Average Classification Bias
The ranks assessed by Friedman Test are depicted.As lower the rank, better the performance.Ranks in bold face indicates a statistically significant difference respect to BRSK=1 with Bonferroni Test.
Trees1050
100200
?BRS RFK=1 K=1 K=3 K=5 K=Log N2.51 3.8 2.9 3.0 2.92.21 3.8 3.0 3.1 2.92.11 3.8 2.8 3.0 3.22.31 3.9 3.0 3.0 2.7
Conclusions
BRS clearly has a better ranking across the different sizes of ensembles and thedifferent K values employed by RF.
The K value with best ranking for RF changes with the size of the ensemble.
There is statistical significant differences for RF with K=1.
ECSQARU 2009 Verona (Italy) 18/22

Experimental Evaluation
Bias-Variance error decomposition
Average Classification Variance
The ranks assessed by Friedman Test are depicted.As lower the rank, better the performance.Ranks in bold face indicates a statistically significant difference respect to BRSK=1 with Bonferroni Test.
Trees1050
100200
?BRS RFK=1 K=1 K=3 K=5 K=Log N2.31 3.5 3.2 3.0 3.02.81 2.9 3.0 3.2 3.02.9 3.0 2.9 3.3 2.81
2.8 2.41 3.0 3.5 3.2
Conclusions
BRS has a better ranking for ensembles with 10 and 50 trees.
For ensembles with 100 trees and 200 trees RF has better ranking but dependswith the K value.
There is no statistical significant differences with non parametric tests.
ECSQARU 2009 Verona (Italy) 19/22

Conclusions and Future Works
Part IV
Conclusions and Future Works
ECSQARU 2009 Verona (Italy) 20/22

Conclusions and Future Works
Conclusions and Future Works
Conclusions and Future Works
Conclusions
We have proposed a new random split operator inspired by Bayesian methods tobuild ensemble of classification trees.
This operator has some nice features such as:Allows a proper random selection of the split node.The stop branching criteria is probabilistically managed.
It seems to be less sensitive to the K value than Random Forests.
Although this method does not statistically outperform Random Forests, itconsistently has better average error, bias and variance for the differentevaluated number of trees.
Future Works
Apply Markov-Chain Monte Carlo methods to generate the trees.
Introduce some Bayesian method to assign a weight to each classification rule.
ECSQARU 2009 Verona (Italy) 21/22

Thanks for your attention!!
Questions?
ECSQARU 2009 Verona (Italy) 22/22