a bibliometric analysis of the intelligent transportation systems research based on science mapping
TRANSCRIPT
IEEE TRANSACTIONS ON INTELLIGENT TRANSPORTATION SYSTEMS, VOL. 15, NO. 2, APRIL 2014 901
used in our analysis, and strong assumptions (but standard) havebeen made concerning the arrival and the departure processes. It isimportant to emphasize that all of these have been made to facilitatethe mathematical analysis and do not limit the basic ideas presentedin this paper. Furthermore, we also assumed honesty and complianceon the part of drivers and charging stations and that the cell, withinwhich balancing is taking place, is of small size. The relaxation ofthese assumptions and the city-partitioning problem is the subject ofongoing work. In this context, the initial insights and the results can befound in [15].
ACKNOWLEDGMENT
The authors would like to thank the reviewers for their helpfulcomments and all the partners within TEAM for their cooperation andvaluable contribution.
REFERENCES
[1] M. Duvall, E. Knipping, M. Alexander, L. Tonachel, and C. Clark, “En-vironmental assessment of plug-in hybrid electric vehicles volume 1:Nationwide greenhouse gas emissions,” Electric Power Research Instituteand Natural Resources Defense Council, Palo Alto, CA, USA, 2007.
[2] K. Qian, C. Zhou, M. Allan, and Y. Yuan, “Modeling of load demand dueto EV battery charging in distribution systems,” IEEE Trans. Power Syst.,vol. 26, no. 2, pp. 802–810, May 2011.
[3] A. Harris, “Charge of the electric car,” Eng. Technol., vol. 4, no. 10,pp. 52–53, 2009.
[4] P. Richardson, D. Flynn, and A. Keane, “Optimal charging of electricvehicles in low voltage distribution systems,” IEEE Trans. Power Syst.,vol. 27, no. 1, pp. 268–279, Feb. 2012.
[5] E. D. Tate, M. O. Harpster, and P. J. Savagian, “The electrification of theautomobile: From conventional hybrid, to plug-in hybrids, to extended-range electric vehicles,” presented at the SAE World Congr. Exhibi-tion, Detroit, MI, USA, 2008, Reprinted from: Advanced Hybrid VehiclePowertrain.
[6] ecars Fast Charge Point Rollout Plan Announced, ESB, Dublin,Ireland, (Accessed 13/3/2013). [Online]. Available: http://www.esb.ie/electric-cars/electric-car-news-and-events/electric-car-press-releases/ESB-electric-cars-Fast-Charge-Point-Rollout-Plan-Announced.jsp
[7] H. Qin and W. Zhang, “Charging scheduling with minimal waiting in anetwork of electric vehicles and charging stations,” in Proc. 8th ACMVANET , Las Vegas, NV, USA, 2011, pp. 1–10.
[8] O. Worley, D. Klabjan, and T. M. Sweda, “Simultaneous vehicle routingand charging station siting for commercial electric vehicles,” in Proc.IEEE Elect. Veh. Conf., Greenville, SC, USA, 2012, pp. 1–3.
[9] A. Schlote, C. King, E. Crisostomi, and R. Shorten, “Stochastic algo-rithms for parking space assignment,” in Proc. EU ITS Congr., Dublin,Ireland, 2013, pp. 1–12.
[10] J. R. Norris, “Markov chains,” in Cambridge Series in Statistical andProbabilistic Mathematics. Cambridge, U.K.: Cambridge Univ. Press,1998.
[11] Y. Geng and C. G. Cassandras, “Dynamic resource allocation in urbansettings: A “smart parking” approach,” in Proc. IEEE Int. Symp. CACSD,2011, pp. 1–6.
[12] F. Häusler, E. Crisostomi, A. Schlote, I. Radusch, and R. Shorten,“Stochastically balanced parking and charging for fully electric and plug-in hybrid vehicles,” in Proc. ACM/IEEE/IFAC/TRB Int. Conf. ConnectedVeh. Expo., Beijing, China, 2012, pp. 341–342.
[13] A. Klappenecker, H. Lee, and J. Welch, “Finding available parking spacesmade easy,” in Ad Hoc Netw., to be published. [Online]. Available: http://www.sciencedirect.com/science/article/pii/S157087051200042X
[14] D. Teodorovic and P. Lucic, “Intelligent parking systems,” Eur. J. Oper.Res., vol. 175, no. 3, pp. 1666–1681, 2006.
[15] A. Schlote, C. King, E. Crisostomi, and R. Shorten, “Stochastic algo-rithms for parking space assignment,” IEEE Trans. Intell. Transp. Syst.,submitted for publication.
[16] M. D. Mitzenmacher, “The power of two choices in randomized loadbalancing,” Ph.D. dissertation, UC Berkeley, Berkeley, CA, USA, 1996.
[17] S. Shenker and A. Weinrib, “The optimal control of heterogeneous queue-ing systems: A paradigm for load-sharing and routing,” IEEE Trans.Comput., vol. 38, no. 12, pp. 1724–1735, Dec. 1989.
[18] R. Mirchandaney, D. Towsley, and J. A. Stankovic, “Adaptive load sharingin heterogeneous systems,” in Proc. 9th Int. Conf. Distrib. Comput. Syst.,1989, pp. 298–306.
[19] B. Awerbuch, Y. Azar, A. Fiat, and T. Leighton, “Making com-mitments in the face of uncertainty: How to pick a winner almostevery time,” in Proc. 28th Annu. ACM Symp. Theory Comput., 1996,pp. 519–530.
[20] M. Pavone, E. Frazzoli, and F. Bullo, “Adaptive and distributed algorithmsfor vehicle routing in a stochastic and dynamic environment,” IEEE Trans.Autom. Control, vol. 56, no. 6, pp. 1259–1274, Jun. 2011.
[21] E. Kokolaki, M. Karaliopoulos, and I. Stavrakakis, “Value of infor-mation exposed: Wireless networking solutions to the parking searchproblem,” in Proc. 8th Int. Conf. Wireless On-Demand Netw. Syst. Serv.,2011, pp. 187–194.
A Bibliometric Analysis of the Intelligent TransportationSystems Research Based on Science Mapping
M. J. Cobo, F. Chiclana, A. Collop, J. de Oña, and E. Herrera-Viedma
Abstract—In this paper, we highlight the conceptual structure ofthe intelligent transportation systems (ITS) research field in the period1992–2011. To do that, an automatic approach for detecting and visualizinghidden themes and their evolution across a consecutive span of years isapplied. This automatic approach, which is based on co-word analysis,combines performance analysis and science mapping. To show theconceptual evolution of ITS, three consecutive periods have been defined,i.e., 1992–2001, 2002–2006, and 2007–2011. We have identified that the ITSresearch has been focused on six main thematic areas, i.e., VEHICLE-AND-ROAD-TRACKING, DRIVER-BEHAVIOR-AND-SAFETY, SCENARIOS-SIMULATION, TRAFFIC-FLOW-AND-TRAFFIC-MANAGEMENT,VEHICLE-CONTROL, and VEHICLE-NAVIGATION.
Index Terms—Co-word analysis, h-index, intelligent transportationsystems (ITS), science mapping analysis.
I. INTRODUCTION
According to the IEEE Intelligent Transportation Systems (ITS)Society (http://sites.ieee.org/itss/), ITS can be described as systemsthat utilize “synergistic technologies and systems engineering conceptsto develop and improve transportation systems of all kinds.”
Manuscript received January 2, 2013; revised April 15, 2013 and June 19,2013; accepted October 1, 2013. Date of publication November 1, 2013; dateof current version March 28, 2014. This work was supported in part by theExcellence Andalusian Projects TIC-5299 and TIC-5991 and in part by theNational Project TIN2010-17876. The Associate Editor for this paper wasF.-Y. Wang.
M. J. Cobo is with the Department of Computer Science, University of Cádiz,11002 Cádiz, Spain (e-mail: [email protected]).
F. Chiclana and A. Collop are with the School of Computer Science andInformatics, Faculty of Technology, De Montfort University, Leicester LE19BH, U.K. (e-mail: [email protected]; [email protected]).
J. de Oña is with the TRYSE Research Group, Department of Civil Engi-neering, University of Granada, 18071 Granada, Spain (e-mail: [email protected]).
E. Herrera-Viedma is with the Department of Computer Science and Artifi-cial Intelligence (CITIC-UGR), University of Granada, 18071 Granada, Spain(e-mail: [email protected]).
Color versions of one or more of the figures in this paper are available onlineat http://ieeexplore.ieee.org.
Digital Object Identifier 10.1109/TITS.2013.2284756
1524-9050 © 2013 IEEE. Personal use is permitted, but republication/redistribution requires IEEE permission.See http://www.ieee.org/publications_standards/publications/rights/index.html for more information.
902 IEEE TRANSACTIONS ON INTELLIGENT TRANSPORTATION SYSTEMS, VOL. 15, NO. 2, APRIL 2014
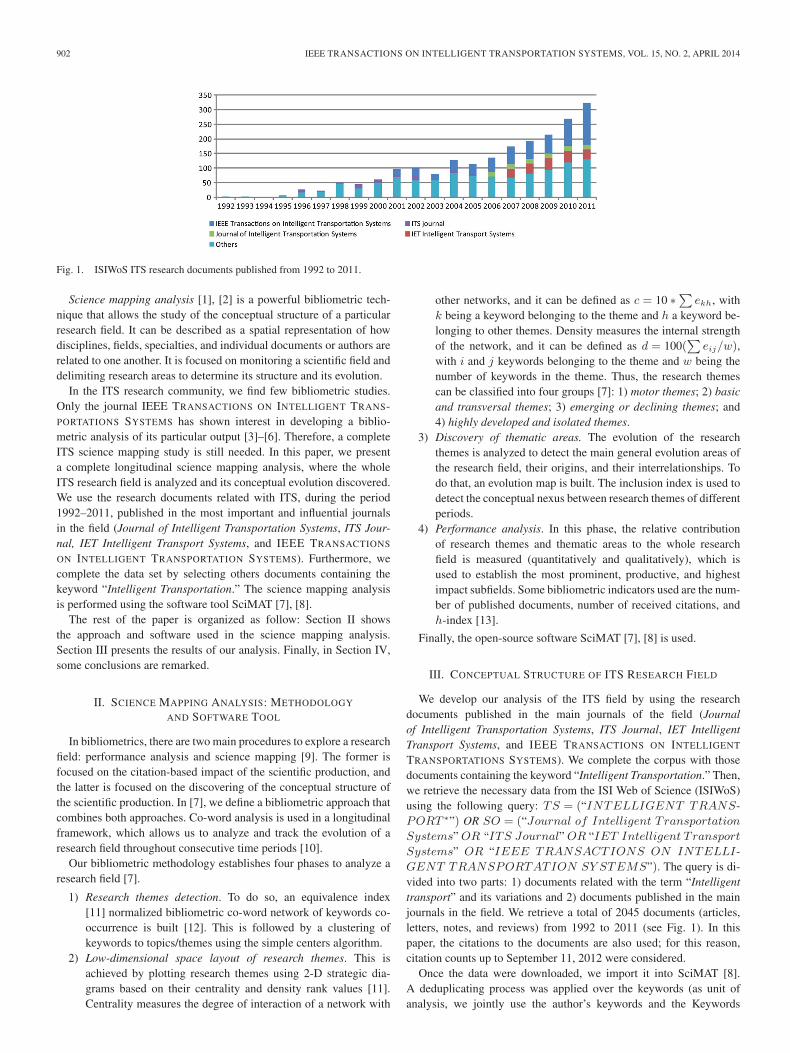
Fig. 1. ISIWoS ITS research documents published from 1992 to 2011.
Science mapping analysis [1], [2] is a powerful bibliometric tech-nique that allows the study of the conceptual structure of a particularresearch field. It can be described as a spatial representation of howdisciplines, fields, specialties, and individual documents or authors arerelated to one another. It is focused on monitoring a scientific field anddelimiting research areas to determine its structure and its evolution.
In the ITS research community, we find few bibliometric studies.Only the journal IEEE TRANSACTIONS ON INTELLIGENT TRANS-PORTATIONS SYSTEMS has shown interest in developing a biblio-metric analysis of its particular output [3]–[6]. Therefore, a completeITS science mapping study is still needed. In this paper, we presenta complete longitudinal science mapping analysis, where the wholeITS research field is analyzed and its conceptual evolution discovered.We use the research documents related with ITS, during the period1992–2011, published in the most important and influential journalsin the field (Journal of Intelligent Transportation Systems, ITS Jour-nal, IET Intelligent Transport Systems, and IEEE TRANSACTIONS
ON INTELLIGENT TRANSPORTATION SYSTEMS). Furthermore, wecomplete the data set by selecting others documents containing thekeyword “Intelligent Transportation.” The science mapping analysisis performed using the software tool SciMAT [7], [8].
The rest of the paper is organized as follow: Section II showsthe approach and software used in the science mapping analysis.Section III presents the results of our analysis. Finally, in Section IV,some conclusions are remarked.
II. SCIENCE MAPPING ANALYSIS: METHODOLOGY
AND SOFTWARE TOOL
In bibliometrics, there are two main procedures to explore a researchfield: performance analysis and science mapping [9]. The former isfocused on the citation-based impact of the scientific production, andthe latter is focused on the discovering of the conceptual structure ofthe scientific production. In [7], we define a bibliometric approach thatcombines both approaches. Co-word analysis is used in a longitudinalframework, which allows us to analyze and track the evolution of aresearch field throughout consecutive time periods [10].
Our bibliometric methodology establishes four phases to analyze aresearch field [7].
1) Research themes detection. To do so, an equivalence index[11] normalized bibliometric co-word network of keywords co-occurrence is built [12]. This is followed by a clustering ofkeywords to topics/themes using the simple centers algorithm.
2) Low-dimensional space layout of research themes. This isachieved by plotting research themes using 2-D strategic dia-grams based on their centrality and density rank values [11].Centrality measures the degree of interaction of a network with
other networks, and it can be defined as c = 10 ∗∑
ekh, withk being a keyword belonging to the theme and h a keyword be-longing to other themes. Density measures the internal strengthof the network, and it can be defined as d = 100(
∑eij/w),
with i and j keywords belonging to the theme and w being thenumber of keywords in the theme. Thus, the research themescan be classified into four groups [7]: 1) motor themes; 2) basicand transversal themes; 3) emerging or declining themes; and4) highly developed and isolated themes.
3) Discovery of thematic areas. The evolution of the researchthemes is analyzed to detect the main general evolution areas ofthe research field, their origins, and their interrelationships. Todo that, an evolution map is built. The inclusion index is used todetect the conceptual nexus between research themes of differentperiods.
4) Performance analysis. In this phase, the relative contributionof research themes and thematic areas to the whole researchfield is measured (quantitatively and qualitatively), which isused to establish the most prominent, productive, and highestimpact subfields. Some bibliometric indicators used are the num-ber of published documents, number of received citations, andh-index [13].
Finally, the open-source software SciMAT [7], [8] is used.
III. CONCEPTUAL STRUCTURE OF ITS RESEARCH FIELD
We develop our analysis of the ITS field by using the researchdocuments published in the main journals of the field (Journalof Intelligent Transportation Systems, ITS Journal, IET IntelligentTransport Systems, and IEEE TRANSACTIONS ON INTELLIGENT
TRANSPORTATIONS SYSTEMS). We complete the corpus with thosedocuments containing the keyword “Intelligent Transportation.” Then,we retrieve the necessary data from the ISI Web of Science (ISIWoS)using the following query: TS = (“INTELLIGENT TRANS-PORT ∗”) OR SO = (“Journal of Intelligent Transportation
Systems” OR “ITS Journal” OR “IET Intelligent Transport
Systems” OR “IEEE TRANSACTIONS ON INTELLI-GENT TRANSPORTATION SY STEMS”). The query is di-vided into two parts: 1) documents related with the term “Intelligenttransport” and its variations and 2) documents published in the mainjournals in the field. We retrieve a total of 2045 documents (articles,letters, notes, and reviews) from 1992 to 2011 (see Fig. 1). In thispaper, the citations to the documents are also used; for this reason,citation counts up to September 11, 2012 were considered.
Once the data were downloaded, we import it into SciMAT [8].A deduplicating process was applied over the keywords (as unit ofanalysis, we jointly use the author’s keywords and the Keywords

IEEE TRANSACTIONS ON INTELLIGENT TRANSPORTATION SYSTEMS, VOL. 15, NO. 2, APRIL 2014 903
Fig. 2. Strategic diagrams. (a) Period 1992–2001. (b) Period 2002–2006. (c) Period 2007–2011.
TABLE IPERFORMANCE MEASURES FOR THE THEMES (1992–2001)
TABLE IIPERFORMANCE MEASURES FOR THE THEMES (2002–2006)
Plus) in order to group those words representing the same concept.Furthermore, since some documents did not contain any keywords, amanual addition of descriptive keywords matching title words with thekeywords present in the knowledge base was done for completenesspurposes. Finally, some keywords that are meaningless in this context,such as stop words, or words with a very broad and general meaning,such as Intelligent Transportation Systems, were removed.
To develop our study, the whole time period (1992–2011) is dividedinto three consecutive periods of time, i.e., 1992–2001, 2002–2006,and 2007–2011, with 793, 1565, and 3249 keywords, respectively.
In what follows, we identify the ITS research themes for each periodand analyze the thematic evolution of the ITS field.
A. Identifying the ITS Research Themes
In order to analyze the most highlighted themes of the ITS fieldfor each period, several strategic diagrams are shown. In addition,the sphere size is proportional to the number of published documents
associated with each research theme. Furthermore, the number ofcitations achieved by each theme is shown in parenthesis.
During the period 1992–2001 (see Fig. 2(a) and Table I), the ITSresearch field was focused in three main themes [see Fig. 2(a)]:1) VEHICLES, which is dedicated to vehicle surveillance, traffic, andincidents detection; 2) TRAVELER-INFORMATION-SYSTEMS, whichis focused on assisting and guiding the traveler in the choice of routeand also related with the management of traffic; 3) SHORTEST-PATH,which is centered on finding the best path, both in time and distance,in a traffic network.
From 2002 to 2006, we obtain the strategic diagrams shown inFig. 2(b) and bibliometric indicators shown in Table II.
• The number of themes is increased.• The majority of the basic and transversal themes are focused on
vehicles, safety, and traffic management.• The theme TRACKING emerges as an important motor theme,
and it achieves the highest impact index.

904 IEEE TRANSACTIONS ON INTELLIGENT TRANSPORTATION SYSTEMS, VOL. 15, NO. 2, APRIL 2014
TABLE IIIPERFORMANCE MEASURES FOR THE THEMES (2007–2011)
• The theme BEHAVIOR appears as a motor theme with highdensity and centrality values. It is focused on the behavior of thedrivers and how they choose their travel routes.
• The research themes TRAVELER-INFORMATION-SYSTEMSand NEURAL-NETWORKS related with traffic management,which previously were considered trend and emergent themes,respectively, have been consolidated as a basic theme.
• DECISION-MAKING, which is focused on safety and risk man-agement, appears as a new basic and transversal theme.
• The highly developed and isolated themes are mainly focusedon themes related with vehicle navigation, such as GPS andVEHICLE-ROUTING.
From 2007 to 2011, we obtain the strategic diagrams shown inFig. 2(c) and bibliometric indicators shown in Table III.
• There are a higher number of motor themes than in the previousperiod. Indeed, there is an adequate number of emerging themes,which indicates that the ITS research field is still developing andgrowing.
• The ITS research field increments its interest in themes relatedwith vehicle tracking, such as TRACKING, CLASSIFICATION,and RECOGNITION.
• The themes NEURAL-NETWORKS and TRACKING consolidateas basic and transversal themes.
• BEHAVIOR develops into an important basic and transversaltheme.
• The theme GPS gains strong interest and becomes one of themajor motor themes.
• FUZZY-CONTROL, which is related with vehicle control,emerges as a motor theme.
• The themes TRAFFIC-CONTROL and RECOGNITION appear asemerging themes, and they obtain a great interest.
• The highest density value is achieved by the motor themeCONFLICT-RESOLUTION related with air traffic control.
B. Thematic Evolution of the ITS Field
An analysis of the themes detected in each one of the three timeperiods evaluated, their keyword compositions, and their evolutionacross the consecutive defined periods of time leads to the detectionof the following six main thematic areas (see Fig. 3): 1) VEHICLE-AND-ROAD-TRACKING; 2) DRIVER-BEHAVIOR-AND-SAFETY;3) SCENARIOS-SIMULATION; 4) TRAFFIC-FLOW-AND-
TRAFFIC-MANAGEMENT;5)VEHICLE-CONTROL;6)VEHICLE-NAVIGATION.
The solid lines mean a thematic nexus: both themes have the samename, or the name of one of them is part of the other theme. Adotted line means that the linked themes share keywords differentto the name of the themes. The thickness of the edge is propor-tional to the inclusion index, and the sphere size is proportional tothe number of published documents in each theme. The differentcolor shadows group the themes that belong to the same thematicarea.
Analyzing Fig. 3 and Table IV, several conclusions regarding dif-ferent structural and performance aspects are noted.
1) With regard to the thematic composition, the following shouldbe pointed out:
• The thematic areas VEHICLE-AND-ROAD-TRACKINGandTRAFFIC-FLOW-AND-TRAFFIC-MANAGEMENTaremainly composed by motor and basic themes. The for-mer includes just one basic theme in its origin, and itbecomes the thematic area with the most number of themes.The latter counts one motor theme and one emergencetheme in its origin, and both evolve as basic and/or motorthemes.
• The thematic area VEHICLE-NAVIGATION starts as an iso-lated theme, and it develops into one of the most importantmotor themes in the last period.
• DRIVER-BEHAVIOR-AND-SAFETY arises comprised bymotor and basic themes and one isolated theme. Thisthematic area positively evolves, and their themes becomeimportant basic themes.
• SCENARIOS-SIMULATION is mainly composed by highlydeveloped but isolated themes.
• VEHICLE-CONTROL starts from two isolated themes, andit converges into an important motor theme.
• The theme DECISION-MAKING is shared by twothematic areas: DRIVER-BEHAVIOR-AND-SAFETY andSCENARIOS-SIMULATION. Similarly, the theme GPSbelongs to two thematic areas: GPS and VEHICLE-CONTROL.
2) With regard to the structural evolution, the following should bepointed out:
• The ITS field presents great cohesion, due to the factthat the majority of detected themes are grouped under a

IEEE TRANSACTIONS ON INTELLIGENT TRANSPORTATION SYSTEMS, VOL. 15, NO. 2, APRIL 2014 905
Fig. 3. Thematic evolution of the ITS research field (1992–2011).
TABLE IVPERFORMANCE MEASURES FOR THE DETECTED THEMATIC AREAS
thematic area and originate from a theme identified in aprevious period. Furthermore, most of the evolutions arepart of a thematic nexus.
• Three thematic areas start in the first period: VEHICLE-AND-ROAD-TRACKING, TRAFFIC-FLOW-AND-TRAFFIC-MANAGEMENT, and VEHICLE-NAVIGATION.
906 IEEE TRANSACTIONS ON INTELLIGENT TRANSPORTATION SYSTEMS, VOL. 15, NO. 2, APRIL 2014
The second period also includes the start of the followingthree themes: DRIVER-BEHAVIOR-AND-SAFETY,SCENARIOS-SIMULATION, and VEHICLE-CONTROL.
• We find some very recent themes (for example,VEHICULAR-NETWORKS and TRAFFIC-CONTROL)that could not be identified with any thematic area. Theycould be considered as the beginning of a new thematicarea.
• There are no gaps in the evolution of the majority ofthematic areas.
• The thematic areas VEHICLE-AND-ROAD-TRACKINGand TRAFFIC-FLOW-AND-TRAFFIC-MANAGEMENTpresent a growing pattern. On the other hand, SCENARIOS-SIMULATION, VEHICLE-NAVIGATION, and VEHICLE-CONTROL shrink in the last period.
• We should point out that, although a shrinking patternis identified for VEHICLE-NAVIGATION and VEHICLE-CONTROL, they evolve as important thematic areas in thelast period, merging together into one motor theme. In fact,VEHICLE-CONTROL appears as a bifurcation of GPS.
3) With regard to the performance and impact indicators, the fol-lowing should be pointed out:
• The thematic area VEHICLE-AND-ROAD-TRACKING isthe most important in the number of documents and cita-tions and with the highest h-index. In addition, TRAFFIC-FLOW-AND-TRAFFIC-MANAGEMENT reaches goodbibliometric indicators, as it is shown in Table IV.
• All thematic areas show a growing pattern in the numberof documents. The case of VEHICLE-NAVIGATION andVEHICLE-CONTROL is particularly significant, which,despite reducing the number of themes across the periods,increase in number of documents.
• Only TRAFFIC-FLOW-AND-TRAFFIC-MANAGEMENTpresents a descending pattern in both number of citationsreceived and h-index. This suggests that, although theresearch community is still interested in this thematic (itgets an adequate number of documents in the last period),the publication impact seems to be decreasing.
Once the thematic areas have been analyzed according to theirstructural, thematic, and performance aspects, we provide a moredetailed analysis of the conceptual evolution of each thematic areathrough the different time spans. In what follows, we describe howeach thematic area evolves.
The thematic area VEHICLE-AND-ROAD-TRACKING started in theperiod 1992–2001. In those years, the thematic area was not welldeveloped being a transversal topic. In the next period (2002–2006),the thematic area broadened, covering topics related with the extrac-tion of the visual information present in the streets and roads [14],detection and recognition of different objects [15], [16], road detection[17], vehicle tracking [18], etc. Finally, in the last period, the thematicarea focused on object detection in complex situations, such as lanecurvature [19] or night vision [20], as well as in advance problems,such as prediction of driver intentions [21] and object detection in realtime [22].
DRIVER-BEHAVIOR-AND-SAFETY was mainly related with theimprovement in the safety of the driver in the vehicle. To do that,techniques such as the driver’s stress level detection [23], speed adap-tation systems [24], and driver’s behavior control [25] were developed.This thematic area also covers topics such as the behavior of drivers intraffic congestion [26].
SCENARIOS-SIMULATION started in the period 2002–2006, with afocus on the simulation of different aspects such as motorway networkand traffic flow model [27]. Finally, in the period 2007–2001, thethematic area focused on the same topics, but using intelligent agentssystems to develop simulations [28].
In the early years of the thematic area TRAFFIC-FLOW-AND-TRAFFIC-MANAGEMENT, we locate the first papers describing trav-eler information systems [29] and their use to reduce travel time andtraffic congestion [30]. In the next period (2002–2006), the thematicarea goes further in the development of advance traveler informationsystems [31]. Finally, in the last period, it evolves to focus on theprediction of traffic flow [32] in real-time environments [33].
In the period 2002–2006, the thematic area VEHICLE-CONTROLfocused on several issues related to autonomous vehicle control [34],[35]. In the last period, i.e., 2007–2011, several advance developmentson specific topics of autonomous vehicle control were carried out: lanechange [36], unintended lane departure [37], etc.
In the period 1992–2001, the thematic area VEHICLE-NAVIGATION focused on solving the shortest route problem,both in distance [38] and time [39]. In the next period, the thematicarea developed, and it was divided into two main topics: GPS [40] andvehicle routing in real time [41]. Finally, in the period 2007–2011, thethematic area focused on the topic GPS, as well as in improving itsaccuracy, availability, and continuity of service [42].
IV. CONCLUDING REMARKS
In this paper, we have analyzed the conceptual structure of theITS research area by means of science mapping analysis and co-word networks. Three consecutive time periods have been studied,i.e., 1992–2001, 2002–2006, and 2007–2011. We have considered theresearch documents developed in the following ITS journals: Journalof Intelligent Transportation Systems, ITS Journal, IET IntelligentTransport Systems, and IEEE TRANSACTIONS ON INTELLIGENT
TRANSPORTATIONS SYSTEMS. Moreover, we completed the dataset by selecting others documents containing the keyword IntelligentTransportation Systems.
The presented analysis has provided a complete view of the concep-tual structure of the ITS research field, giving us the ability to uncoverthe different topics researched by the ITS community from 1992to 2011.
We have detected six different main thematic areas: 1) VEHICLE-AND-ROAD-TRACKING, which evolves from topics related with ve-hicle surveillance, traffic, and incidents detection to the tracking anddetection of vehicles, pedestrian, etc.; 2) DRIVER-BEHAVIOR-AND-SAFETY related with accident avoidance, conflict resolution, and thebehavior and safety of the driver; 3) SCENARIOS-SIMULATION asso-ciated with the simulations and test of traffic scenarios; 4) TRAFFIC-FLOW-AND-TRAFFIC-MANAGEMENT related with different aspectsof the traffic management using intelligent techniques such as neu-ral networks; 5) VEHICLE-CONTROL focused on the research ofautonomous vehicles; and 6) VEHICLE-NAVIGATION related withdifferent aspects of traffic networks and route guidance.
Taking into account the detected themes and thematic areas, thefollowing findings can be highlighted:
• The thematic area VEHICLE-AND-ROAD-TRACKING is themost important in all the three criteria used in the analysis. It is agrowing research area and presents a good rate of published doc-uments. Furthermore, the research developed under this thematic

IEEE TRANSACTIONS ON INTELLIGENT TRANSPORTATION SYSTEMS, VOL. 15, NO. 2, APRIL 2014 907
TABLE VJOURNALS PER THEMATIC AREA (DOCUMENTS/CITATIONS)
area captures the attention of the ITS field, as it is illustrated bythe citations that it attracts.
• The thematic area VEHICLE-NAVIGATION and VEHICLE-CONTROL started as isolated themes with poor productive andimpact rates, but in the last period, they got more attention fromthe community and became two of its most important researchtopics.
• The thematic area TRAFFIC-FLOW-AND-TRAFFIC-MANAGEMENT seems a mature research topic, and probably, inthe near future, it might evolve following different directions.
• The thematic area DRIVER-BEHAVIOR-AND-SAFETY presentsa constant growth.
Interestingly, the thematic areas are covered by the ITS journals indifferent ways, as it is shown in Table V. We can observe that the jour-nal IEEE TRANSACTIONS ON INTELLIGENT TRANSPORTATIONS
SYSTEMS is the most important journal of the research developed inITS because it covers all the top ranked and most cited thematic areas.In particular, it is the core journal in both thematic areas VEHICLE-AND-ROAD-TRACKING and VEHICLE-CONTROL. The journal IETIntelligent Transport Systems is centered on DRIVER-BEHAVIOR-AND-SAFETY and VEHICLE-AND-ROAD-TRACKING. The ITS Jour-nal and Journal of Intelligent Transportation Systems are mainlyfocused on TRAFFIC-FLOW-AND-TRAFFIC-MANAGEMENT.
Finally, we should note that the ITS research field is developingat a fast pace. Some of the recent scientific documents are publishedin conferences or special issues. Although a bibliometric analysis ofthose documents could be interesting, the amount of documents is notenough to develop a science mapping analysis based solely on them.
REFERENCES
[1] S. Morris and B. Van Der Veer Martens, “Mapping research specialties,”Annu. Rev. Inf. Sci. Technol., vol. 42, no. 1, pp. 213–295, 2008.
[2] M. J. Cobo, A. G. López-Herrera, E. Herrera-Viedma, and F. Herrera,“Science mapping software tools: Review, analysis and cooperative studyamong tools,” J. Amer. Soc. Inf. Sci. Technol., vol. 62, no. 7, pp. 1382–1402, Jul. 2011.
[3] F.-Y. Wang, “Building an intellectual highway for ITS research and de-velopment,” IEEE Trans. Intell. Transp. Syst., vol. 11, no. 1, pp. 2–3,Mar. 2010.
[4] F.-Y. Wang, “Publication and impact: A bibliographic analysis,” IEEETrans. Intell. Transp. Syst., vol. 11, no. 2, p. 250, Mar. 2010.
[5] F.-Y. Wang, A. Broggi, and C. White, “Road to transactions on intelligenttransportation systems: A decade’s success,” IEEE Trans. Intell. Transp.Syst., vol. 10, no. 4, pp. 553–556, Dec. 2009.
[6] M. J. Cobo, A. G. López-Herrera, F. Herrera, and E. Herrera-Viedma, “Anote on the ITS topic evolution in the period 2000–2009 at T-ITS,” IEEETrans. Intell. Transp. Syst., vol. 13, no. 1, pp. 413–420, Mar. 2012.
[7] M. J. Cobo, A. G. López-Herrera, E. Herrera-Viedma, and F. Herrera,“An approach for detecting, quantifying, and visualizing the evolution ofa research field: A practical application to the fuzzy sets theory field,” J.Informetr., vol. 5, no. 1, pp. 146–166, Jan. 2011.
[8] M. J. Cobo, A. G. López-Herrera, E. Herrera-Viedma, and F. Herrera,“SciMAT: A new science mapping analysis software tool,” J. Amer. Soc.Inf. Sci. Technol., vol. 63, no. 8, pp. 1609–1630, Aug. 2012.
[9] A. F. J. van Raan, “Measuring science,” in Handbook of QuantitativeScience and Technology Research. Berlin, Germany: Springer-Verlag,2005, pp. 19–50.
[10] E. Garfield, “Scientography: Mapping the tracks of science,” Curr. Con-tents, Soc. Behav. Sci., vol. 7, no. 45, pp. 5–10, Nov. 1994.
[11] M. Callon, J. Courtial, and F. Laville, “Co-word analysis as a tool fordescribing the network of interactions between basic and technologicalresearch—The case of polymer chemistry,” Scientometrics, vol. 22, no. 1,pp. 155–205, Sep. 1991.
[12] M. Callon, J. P. Courtial, W. A. Turner, and S. Bauin, “From translationsto problematic networks: An introduction to co-word analysis,” Soc. Sci.Inf. Sci. Soc., vol. 22, no. 2, pp. 191–235, Mar. 1983.
[13] S. Alonso, F. Cabrerizo, E. Herrera-Viedma, and F. Herrera, “h-index:A review focused in its variants, computation and standardization fordifferent scientific fields,” J. Informetr., vol. 3, no. 4, pp. 273–289,Oct. 2009.
[14] A. de la Escalera, J. Armingol, J. Pastor, and F. Rodriguez, “Visual signinformation extraction and identification by deformable models for intel-ligent vehicles,” IEEE Trans. Intell. Transp. Syst., vol. 5, no. 2, pp. 57–68,Jun. 2004.
[15] C. Pai, H. Tyan, Y. Liang, H. Liao, and S. Chen, “Pedestrian detection andtracking at crossroads,” Pattern Recognit., vol. 37, no. 5, pp. 1025–1034,May 2004.
[16] I. Alonso, D. Llorca, M. Sotelo, L. Bergasa, P. de Toro, J. Nuevo,M. Ocana, and M. Garrido, “Combination of feature extraction methodsfor SVM pedestrian detection,” IEEE Trans. Intell. Transp. Syst., vol. 8,no. 2, pp. 292–307, Jun. 2007.
[17] Y. He, H. Wang, and B. Zhang, “Color-based road detection in urbantraffic scenes,” IEEE Trans. Intell. Transp. Syst., vol. 5, no. 4, pp. 309–318, Dec. 2004.
[18] H. Veeraraghavan, O. Masoud, and N. Papanikolopoulos, “Computer vi-sion algorithms for intersection monitoring,” IEEE Trans. Intell. Transp.Syst., vol. 4, no. 2, pp. 78–89, Jun. 2003.
[19] Z. Kim, “Robust lane detection and tracking in challenging sce-narios,” IEEE Trans. Intell. Transp. Syst., vol. 9, no. 1, pp. 16–26,Mar. 2008.
[20] X. Cao, H. Qiao, and J. Keane, “A low-cost pedestrian-detection systemwith a single optical camera,” IEEE Trans. Intell. Transp. Syst., vol. 9,no. 1, pp. 58–67, Mar. 2008.
[21] M. Trivedi, T. Gandhi, and J. McCall, “Looking-in and looking-out ofa vehicle: Computer-vision-based enhanced vehicle safety,” IEEE Trans.Intell. Transp. Syst., vol. 8, no. 1, pp. 108–120, Mar. 2007.
[22] S. Sivaraman and M. Trivedi, “A general active-learning framework foron-road vehicle recognition and tracking,” IEEE Trans. Intell. Transp.Syst., vol. 11, no. 2, pp. 267–276, Jun. 2010.
[23] J. Healey and R. Picard, “Detecting stress during real-world driving tasksusing physiological sensors,” IEEE Trans. Intell. Transp. Syst., vol. 6,no. 2, pp. 156–166, Jun. 2005.
[24] N. Agerholm, R. Waagepetersen, N. Tradisauskas, L. Harms, andH. Lahrmann, “Preliminary results from the Danish intelligent speedadaptation project pay as you speed,” IET Intell. Transp. Syst., vol. 2,no. 2, pp. 143–153, Jun. 2008.
[25] I. Spyropoulou, M. Penttinen, M. Karlaftis, T. Vaa, and J. Golias, “ITSsolutions and accident risks: Prospective and limitations,” Transp. Rev.,vol. 28, no. 5, pp. 549–572, Sep. 2008.
[26] P. Bonsall, “Traveller behavior: Decision-making in an unpredictableworld,” J. Intell. Transp. Syst., vol. 8, no. 1, pp. 45–60, Jan. 2004.
[27] B. Hellinga and L. Fu, “Reducing bias in probe-based arterial link traveltime estimates,” Transp. Res. C, Emerging Technol., vol. 10, no. 4,pp. 257–273, Aug. 2002.
[28] B. Gokulan and D. Srinivasan, “Distributed geometric fuzzy multiagenturban traffic signal control,” IEEE Trans. Intell. Transp. Syst., vol. 11,no. 3, pp. 714–727, Sep. 2010.
[29] L. Ng, R. Wessels, D. Do, F. Mannering, and W. Barfield, “Statisticalanalysis of commercial driver and dispatcher requirements for advancedtraveler information systems,” Transp. Res. C, Emerging Technol., vol. 3,no. 6, pp. 353–369, Dec. 1995.
[30] R. Hall, “Route choice and advanced traveler information systems on acapacitated and dynamic network,” Transp. Res. C, Emerging Technol.,vol. 4, no. 5, pp. 289–306, Oct. 1996.

908 IEEE TRANSACTIONS ON INTELLIGENT TRANSPORTATION SYSTEMS, VOL. 15, NO. 2, APRIL 2014
[31] K. Rehrl, S. Bruntsch, and H. Mentz, “Assisting multimodal travel-ers: Design and prototypical implementation of a personal travel com-panion,” IEEE Trans. Intell. Transp. Syst., vol. 8, no. 1, pp. 31–42,Mar. 2007.
[32] M. Tan, S. Wong, J. Xu, Z. Guan, and P. Zhang, “An aggregation approachto short-term traffic flow prediction,” IEEE Trans. Intell. Transp. Syst.,vol. 10, no. 1, pp. 60–69, Mar. 2009.
[33] A. Skabardonis and N. Geroliminis, “Real-time monitoring and controlon signalized arterials,” J. Intell. Transp. Syst., vol. 12, no. 2, pp. 64–74,May 2008.
[34] H. Tan and J. Huang, “DGPS-based vehicle-to-vehicle cooperative col-lision warning: Engineering feasibility viewpoints,” IEEE Trans. Intell.Transp. Syst., vol. 7, no. 4, pp. 415–428, Dec. 2006.
[35] B. van Arem, C. van Driel, and R. Visser, “The impact of cooperativeadaptive cruise control on traffic-flow characteristics,” IEEE Trans. Intell.Transp. Syst., vol. 7, no. 4, pp. 429–436, Dec. 2006.
[36] J. Naranjo, C. Gonzalez, R. Garcia, and T. de Pedro, “Lane-changefuzzy control in autonomous vehicles for the overtaking maneuver,” IEEETrans. Intell. Transp. Syst., vol. 9, no. 3, pp. 438–450, Sep. 2008.
[37] N. Enache, S. Mammar, M. Netto, and B. Lusetti, “Driver steering assis-tance for lane-departure avoidance based on hybrid automata and compos-ite Lyapunov function,” IEEE Trans. Intell. Transp. Syst., vol. 11, no. 1,pp. 28–39, Mar. 2010.
[38] Z. Peng and R. Huang, “Design and development of interactive tripplanning for web-based transit information systems,” Transp. Res. C,Emerging Technol., vol. 8, no. 1–6, pp. 409–425, Feb.–Dec. 2000.
[39] I. Chabini, “Discrete dynamic shortest path problems in transportationapplications—Complexity and algorithms with optimal run time,” Transp.Res. Rec., vol. 1645, no. 1, pp. 170–175, 1998.
[40] M. Quddus, R. Noland, and W. Ochieng, “A high accuracy fuzzy logicbased map matching algorithm for road transport,” J. Intell. Transp. Syst.,vol. 10, no. 3, pp. 103–115, Sep. 2006.
[41] S. Kim, M. Lewis, and C. White, “Optimal vehicle routing with real-time traffic information,” IEEE Trans. Intell. Transp. Syst., vol. 6, no. 2,pp. 178–188, Jun. 2005.
[42] M. Abdel-Aty, A. Pande, A. Das, and W. Knibbe, “Assessing safety onDutch freeways with data from infrastructure-based intelligent transporta-tion systems,” Transp. Res. Rec., vol. 2083, pp. 153–161, 2008.