a bio-energy roadmap for south australia€¦ · chp combine heat and power cng compressed natural...
TRANSCRIPT
A Bio-energy Roadmap for South Australia
RENEWABLES SA
Jacobs Report
141211 RFT
5 August 2015
Jacobs Report
i
A Bioenergy Roadmap for South Australia
Project no: IW085700
Document title: Jacobs Report
Revision: 1
Date: 5 August 2015
Client name: Renewables SA
Client ref: 141211 RFT
Project manager: Tim Johnson
Authors: Tim Johnson, Wayne Brown, Jason Brown, David Harridge, Chris Johnson
File name: \\Jacobs.com\adeprojects\IE\Projects\IW085700\Deliverables\Reports\A Bioenergy
Roadmap for South Australia - Report - Version 1.docx
Jacobs Group (Australia) Pty Limited
ABN 37 001 024 095
Level 6, 30 Flinders Street
Adelaide SA 5000 Australia
T +61 8 8113 5400
F +61 8 8113 5440
www.jacobs.com
COPYRIGHT: The concepts and information contained in this document are the property of Jacobs Group (Australia) Pty Limited. Use or copying
of this document in whole or in part without the written permission of Jacobs constitutes an infringement of copyright.
Document history and status
Revision Date Description By Review Approved
A 18.06.15 Draft for client and internal Jacobs review JEB et al TDJ TDJ
B 15/07/2015 Complete draft for client and internal Jacobs review JEB et al TDJ TDJ
1 5 August
2015
For issue, following incorporation of feedback JEB DH, RZ, TDJ TDJ
Jacobs Report
ii
Contents
Abbreviations ......................................................................................................................................................... 4
Executive Summary ............................................................................................................................................... 6
1. The Current Landscape .......................................................................................................................... 10
1.1 Introduction ................................................................................................................................................................................... 10
1.2 Solid Biomass ............................................................................................................................................................................... 10
1.2.1 Common Solid Biomass Feedstocks ............................................................................................................................................ 10
1.2.2 Utilisation of Solid Biomass........................................................................................................................................................... 11
1.3 Gaseous Bio-fuels......................................................................................................................................................................... 21
1.3.1 Common Gaseous Bio-fuel Feedstocks ....................................................................................................................................... 21
1.3.2 Utilisation of Gaseous Bio-fuels .................................................................................................................................................... 22
1.4 Liquid Bio-fuels ............................................................................................................................................................................. 28
1.4.1 Common Liquid Bio-fuels .............................................................................................................................................................. 28
1.4.2 Utilisation of Liquid Bio-fuels ......................................................................................................................................................... 29
1.5 Global Bio-energy Landscape....................................................................................................................................................... 35
1.6 Australian and South Australian Bio-energy Landscape............................................................................................................... 35
1.6.1 South Australian Bio-energy Political Landscape ......................................................................................................................... 35
2. Bio-energy Material Sources in South Australia .................................................................................. 37
2.1 Relevant Materials ........................................................................................................................................................................ 37
2.1.1 Existing Feedstocks ...................................................................................................................................................................... 37
2.1.2 Purpose Grown Biomass Feedstocks ........................................................................................................................................... 41
2.2 Quantities and Geographical Origins ............................................................................................................................................ 47
3. Bio-energy Demand Sources in South Australia ................................................................................. 57
4. Logistical Factors Influencing Bio-energy Projects in South Australia ............................................ 68
5. Technological Factors Influencing Bio-energy Projects in South Australia ..................................... 69
5.1 Introduction ................................................................................................................................................................................... 69
5.2 Council Green Waste .................................................................................................................................................................... 69
5.3 Residual Municipal Solid Waste.................................................................................................................................................... 71
5.4 Forestry and Sawmill Residues Project ........................................................................................................................................ 73
5.5 High Moisture Content Organic Feedstock Project ....................................................................................................................... 74
5.6 Straw Feedstock Project ............................................................................................................................................................... 76
5.7 Indicative Small Scale Heating Project ......................................................................................................................................... 78
5.8 Indicative Bio-methane Upgrading Project ................................................................................................................................... 80
5.9 Algae Production for Bio-fuels ...................................................................................................................................................... 81
6. Areas of Opportunity for South Australia ............................................................................................. 83
6.1 Existing Feedstocks ...................................................................................................................................................................... 83
6.2 Purpose Grown Biomass Crops.................................................................................................................................................... 88
7. Conclusions and Recommendations .................................................................................................... 92

Jacobs Report
iii
Appendix A. GIS User Guide
Appendix B. References
B.1 GIS Maps
B.2 Report
Jacobs Report
Filename: A Bioenergy Roadmap for South Australia - Report - Version 1.docx 4
Abbreviations
Abbreviation Full name
A$ Australian dollars
AD Anaerobic digestion
Bn Billion
Bxx Xx% blend of biodiesel and mineral diesel
C&I Commercial and industrial
CAPEX Capital expenditure
CGGW Council generated green waste
CH4 Methane
CHP Combine heat and power
CNG Compressed natural gas
CO2 Carbon dioxide
COD Chemical oxygen demand
Cogen Cogeneration
EfW Energy from waste
EPC Engineer, procure, construct contract
EU European Union
Exx Xx% blend of ethanol and petrol
GJ Gigajoule
GWh Gigawatt hours
h Hour
HHV Higher heating value
Jacobs Jacobs Group (Australia) Ltd
k Kilo
Kraft Kraft pulping process
kT Kilo tonnes
kW Kilowatt
kWh Kilowatt hours
L Litre
LHV Lower heating value
LNG Liquefied natural gas
LPG Liquefied petroleum gas

Jacobs Report
Filename: A Bioenergy Roadmap for South Australia - Report - Version 1.docx 5
Abbreviation Full name
m3 Cubic metre
M Million
MBT Mechanical biological treatment
MJ/kg Megajoules per kilogram
MJ/Nm3 Megajoules per normalise cubic metre
ML Megalitre
MSW Municipal solid waste
MW, MWe,
MWth
Megawatt, megawatt electrical, megawatt thermal
NG Natural gas
Nm3/h Normalised cubic meter per hour
NSW New South Wales
º C Degree Celsius
OPEX Operational expenditure
ORC Organic Rankine cycle
QLD Queensland
RDF Refuse derived fuel
RE Renewable energy
RET Renewable energy target
SA South Australia
SRF Solid recovered fuel
t Tonne
Tas Tasmania
tpa Tonnes per annum
tph Tonnes per hour
Vic Victoria
WA Western Australia
y Year

Jacobs Report
Filename: A Bioenergy Roadmap for South Australia - Report - Version 1.docx 6
Executive Summary
Objective
South Australia is actively seeking ways to reduce its greenhouse gas emissions and dependence
on fossil fuels. It is widely seen that achieving this will require exploitation of a diverse range of
technologies and fuels, rather than relying on one or two technologies such as wind and solar.
Although wind and solar already make a significant contribution to achieving these goals, it is
likely that further contributions will be limited by their intermittency (unless storage becomes
commercially viable).
Bio-energy could play a significant role in coming years by supplying a dispatchable source of
energy from localised and regional waste resource streams and purpose grown feedstock's. Bio-
energy enables a supply of energy in circumstances when solar or wind relies on energy storage
during low input periods making it less reliable during peak demands.
The rapid expansion of bio-energy systems in Europe and may other parts of the world provides
an insight into the potential for exploiting local possibilities.
Energy cost (electricity and gas) in South Australia have continued to rise over the past 10 years
making local industry, processing and manufacturing more uncompetitive. There is good potential
for greater use of existing and new feedstock's and technologies, which could lead to an
increased contribution from bio-energy across energy generation, industry, transport, utility and
domestic energy sectors. This improved uptake will allow bio-energy to make a more valuable
contribution to South Australia’s low carbon future and localised energy demands.
In early 2015, Renewables SA commissioned Jacobs Group (Australia) Ltd (Jacobs) to undertake
targeted research and the initial stages of development of a ‘roadmap’ to identify and support
viable opportunities to further develop the bio-energy industry in SA.
Bio-energy
Biomass resources are a sustainable and environmentally friendly feedstock that can contribute
significantly to a diverse energy portfolio. Electricity, transportation fuels, chemicals, and
materials currently produced from petroleum and natural gas can instead be produced from
biomass.
Bio-energy can be produced from organic matter derived from plants, animals or manufactured
food waste. Specific types of organic matter that are used to produce bio-energy are called
biomass or bio-fuel feedstocks.
Bio-energy feedstocks and fuel products can be stored and are transportable allowing provision of
a controllable supply of energy. Bio-energy systems often use organic material that would have
otherwise been disposed in landfill, burnt without energy recovery or left to decay in situ adding to
greenhouse gas emissions however they can also be produced by purpose grown energy crops,
as is now the practice in many overseas countries.
The supporting technologies are generally well established, and there are already numerous ways
of converting biomass into bio-energy on a commercial basis. These technologies are often
referred to as “mature” technologies. Additionally, new forms of the technology are being
investigated that make better use of ‘residue’ materials from other agricultural or industrial
processes. These emerging second or third generation technologies are progressing through pilot
and demonstration phases and may present future opportunities for Australian businesses. In
the Australian context, some of the mature technologies have not reached their resource potential

Jacobs Report
Filename: A Bioenergy Roadmap for South Australia - Report - Version 1.docx 7
due to commercial and other market barriers. In that sense they are technologically mature but
commercially emerging.
Bio-energy is produced by a range of processes including combustion, pyrolysis, anaerobic
digestion, gasification, esterification, fermentation and other microbial process which is the subject
of considerable interest and research activity globally, and in Australia.
There are a number of key drivers for the increased usage of bio-energy feedstocks:
Utilisation of waste streams (avoiding the cost of disposing of those waste streams);
A reduction in CO2 emissions due to the substitution of fossil fuels and avoidance of
methane emissions;
Enhancing energy security through the development of low cost alternative energy supplies;
Provision of dispatchable power to complement wind and solar technologies;
Securing regional development and employment through new industry activity, and
Environmental improvement.
The industry is currently worth approximately $0.5B to Australia; and the potential to grow this
contribution significantly is considered high.
The current state of play
There is considerable investment in bio-energy plants worldwide. In essence these form a
number of major streams including:
Combustion of waste crop material (eg straw) to produce heat and electricity
Combustion of purpose grown crop material (eg coppiced wood) to produce heat and
electricity
Combustion of municipal and commercial wastes to produce heat and electricity
Digestion of wastes to produce gas for heating, conversion to electricity or injection into gas
reticulation systems
Conversion of biomass to produce bio-fuels; and
Capture of gas from decomposing wastes (landfill gas) to convert to electricity.
In Australia the capture of gas from decomposing wastes and the combustion of waste crop
material are the more typical applications.
Within SA bio-energy plants have been installed at;
SA Water – various Adelaide wastewater treatment plants anaerobic digestion for power
generation
Landfill gas – various small scale electricity generation facilities
Thomas Food International - Murray Bridge anaerobic digestion
Tarac Technologies – Nuriootpa anaerobic digestion
AR Fuels – Largs Bay
Forestry processing - Mt Gambier heat and power generation
Swimming pool heating - Mt Gambier
Sita-Resource Co. – Wingfield anaerobic digestion
Jacobs Report
Filename: A Bioenergy Roadmap for South Australia - Report - Version 1.docx 8
South Australia maintains excellent engineering skills and the practical bio-energy consulting
services required to implement bio-energy opportunities.
South Australian supply and demand
Local investigations indicate numerous potential supply and demand opportunities, mostly
revolving around localised waste materials available and "end of line" demands. In addition too
existing biomass potential supplies there is opportunity to grow alternative vegetative crops.
Whilst requiring additional research this approach appears to be promising and could provide a
good use of non-productive cleared landscapes.
There is a regional demand for and potential to supply additional energy. Industries that could
benefit or expand from the opportunity include:
Horticulture - heating
Intensive industries (e.g. chickens and pigs) - process heating and electricity generation
Processing plants - heating and power generation
Processing hubs –heating
Forestry processing –heating and power generation
Technologies, logistics and costs
Australian made versions of anaerobic digestion and pyrolysis technologies already exist as do
suppliers of technology who represent international suppliers.
As in all countries, the need to capture local waste streams or grow complementary plants
species locally is an advantage to delivering cheap energy alternatives.
Logistically the shorter the collection and delivery distances of waste streams or purpose grown
crops to the energy plant the lower the costs of the energy produced. As a typical rule a
production distance of no more than 40 - 50km radius from the energy plant is preferred.
Typical investment costs (excluding the costs of supplying biomass) have been derived for some
of the more promising fuel sources.
Opportunities for further investigation
Our investigation has shown that there are both untapped existing and potential sources of
biomass. These sources have been identified on a geographic basis that has led to the
identification of potential bio-energy nodes across SA.
The feasibility of utilising these sources has not been investigated and further work including
consultation with stakeholders is a logical next step to determine:
If the sources have been adequately characterised – and do, in fact, exist
The barriers to use of the sources
What other uses of the land / products would be displaced if the biomass was produced and
used for bio-energy
The environmental and social impacts of growing and utilising these sources
The economics of bio-energy projects including the value of the unconverted biomass and
hence the likelihood of landowners using their land to grow additional biomass or to divert
wastes from existing uses.

Jacobs Report
Filename: A Bioenergy Roadmap for South Australia - Report - Version 1.docx 9
Important note about your report
The sole purpose of this report and the associated services performed by Jacobs is to investigate
and collate in a GIS database available data and knowledge and report this to help initiate the
development of a roadmap to support improved bio-energy industry development in South
Australia, in accordance with the scope of services set out in the contract between Jacobs and the
Client. That scope of services, as described in this report, was developed with the Client.
In preparing this report, Jacobs has relied upon, and presumed accurate, any information (or
confirmation of the absence thereof) provided by the Client and/or from other sources. Except as
otherwise stated in the report, Jacobs has not attempted to verify the accuracy or completeness of
any such information. If the information is subsequently determined to be false, inaccurate or
incomplete then it is possible that our observations and conclusions as expressed in this report
may change.
Jacobs derived the data in this report from information sourced from the Client and/or available in
the public domain at the time or times outlined in this report. The passage of time, manifestation
of latent conditions or impacts of future events may require further examination of the project and
subsequent data analysis, and re-evaluation of the data, findings, observations and conclusions
expressed in this report. Jacobs has prepared this report in accordance with the usual care and
thoroughness of the consulting profession, for the sole purpose described above and by reference
to applicable standards, guidelines, procedures and practices at the date of issue of this report.
For the reasons outlined above, however, no other warranty or guarantee, whether expressed or
implied, is made as to the data, observations and findings expressed in this report, to the extent
permitted by law.
This report should be read in full and no excerpts are to be taken as representative of the findings.
No responsibility is accepted by Jacobs for use of any part of this report in any other context.
While Jacobs has been provided access to several SA Government databases it has not
consulted with other stakeholders. The report should be considered in the context of the limited
time available and budget.
This report has been prepared on behalf of, and for the exclusive use of, Jacobs’s Client, and is
subject to, and issued in accordance with, the provisions of the contract between Jacobs and the
Client. Jacobs accepts no liability or responsibility whatsoever for, or in respect of, any use of, or
reliance upon, this report by any third party
Jacobs Report
Filename: A Bioenergy Roadmap for South Australia - Report - Version 1.docx 10
1. The Current Landscape
1.1 Introduction
This chapter of the report provides an initial broad and high level review of the current state of
play within the bio-energy industry nationally and worldwide. In particular the chapter addresses
the following key points as per Jacobs’s proposal scope for this task:
Establish what technologies and project types are in operation or near to market
development in Australia
Establish what technologies and project types are in operation or near to market
development globally, with an emphasis on regions with similar climatic conditions to South
Australia
Compare with the situation in SA.
This section of the report is broken down into the three main broad categories of bio-energy as
follows:
Solid biomass
Gaseous bio-fuels
Liquid bio-fuels.
1.2 Solid Biomass
1.2.1 Common Solid Biomass Feedstocks
Solid biomass is material originally produced from biogenic matter of recent origin. The source of
the biomass may encompass many forms including the following categories, for which in some
cases there is a degree of overlap from one category to the next:
Woody Biomass – A well-established form of biomass proven for energy applications, usually
utilised in log, chip or pellet form, and which may include:
Forestry or timber product residues or bi-products such as sawmill residues or
forestry/arboriculture arisings and brash. These are generally sourced as a by-product from
an existing supply chain of forestry production primarily for timber production
Purpose grown woody energy crops such as short rotation coppice or tree plant woody crops
(e.g. fast growing species such as eucalyptus, acacia, casuarina or leucena)
Waste wood material such as recycled wood from municipal waste, commercial waste (e.g.
pallets) and construction and demolition sources.
Agricultural Biomass – An area of biomass production which is established and proven in some
overseas countries but which in some agricultural sectors in Australia may be considered as
having potential for increased utilisation:
Straws from cereals such as wheat, corn, rice
Bagasse which is the organic residual fibre following extraction of sugar from sugar cane
Seeds, husks, skins, pulp, shells and pits such as oil seeds, rice, almond, olive or grape
marc, generated as bi-products during the processing of agricultural products
Purpose grown whole crops for bio-energy purposes such as miscanthus, energy cane, king
grass, switch grass and arundo donax native reeds and mallee. However some of these
Jacobs Report
Filename: A Bioenergy Roadmap for South Australia - Report - Version 1.docx 11
crops e.g. energy cane, king grass, switch grass require higher rainfall and are not suitable
for the South Australian climate
Waste Derived Biomass – produced and potentially segregated as organic rich wastes from
municipal, commercial and industrial sources:
Green waste (e.g. kitchen and garden waste, or council generated green waste (CGGW))
Biomass derived from municipal solid waste (MSW) or municipal like commercial and
industrial (C&I) waste (e.g. derived from some sort of source segregation or post collection
mechanical, heat or biological treatment process). Sometimes waste derived fuel products
produced from these sources are called refuse derived fuel (RDF) or solid recovered fuel
(SRF)
Paper waste (recycled from municipal or commercial collections or sludge from paper
recycling processes)
Sewage sludge (also a feedstock for the production of bio-gas) either from municipal or food
processing plant waste water treatment processes
Animal waste (chicken litter, animal carcasses, or meat and bone meal)
Woody perennial weeds.
1.2.2 Utilisation of Solid Biomass
Solid biomass can be used for power and heating applications from domestic scale up, for
industrial applications and up to power utility scale. The following technologies are considered to
be those most commonly currently applied to biomass for useful energy production.
Biomass combustion - the most common form of biomass conversion technology is combustion
with heat recovery in a boiler. Boiler types depend on the fuel combusted and scale but can often
be grates or bubbling fluidised bed boilers. The boiler can be used to produce hot water or steam,
with larger scale boilers producing high pressure and temperature steam being suitable for the
generation of power in a steam turbine. Boilers with thermal oil as the working fluid are also
common in some industries like timber processing and fibreboard production although using
hydrocarbon working fluids introduces some risks relating to safety with boiler tube failures. The
heat from such boilers can also sometimes be used in smaller scale power applications coupled
with organic Rankine cycles (ORC), which can deliver higher electrical efficiencies than steam
turbines when the gross power output is less than around 2 MWe. Combined heat and power or
cogeneration is possible with either steam or ORCs with a range of possible methods of delivering
heat for an industrial or community energy demand.
Gasification of solid biomass feedstocks is the thermal degradation of the biomass to a gas
called syngas or, in some countries, producer gas in a process where there is insufficient oxygen
present for complete combustion of the material (sub stoichiometric conditions), but enough
oxygen to generate a heat of combustion from biomass carbon to keep the process self-
sustaining. The temperature can vary from process to process (600 to 1,300 ºC) depending on
the feedstock and the desired end use application of the syngas and by-products such as char
and ash. The syngas produced is a mixture of the combustible elements carbon monoxide,
hydrogen and methane, and non-combustible carbon dioxide, water and nitrogen. The syngas
also contains other trace undesirable components like tars but can generally be reliably used for
direct combustion in an industrial application or in a boiler. When applying the gas to potentially
higher conversion efficiency applications like gas engines or gas turbines, there are some
technical challenges remaining to be resolved in delivering high quality syngas following gas
treatment that can be used without operational and maintenance issues.

Jacobs Report
Filename: A Bioenergy Roadmap for South Australia - Report - Version 1.docx 12
Gasification variants include plasma gasification and oxygen blown gasification which are
sometimes applied to waste derived biomass feedstocks that present challenges to achieving a
quality gas and ash products using more standard gasification means. Plasma gasification
involves the exposure of the syngas produced in the gasifier to a very high temperature plasma
arc for a short period of time, which helps to convert tars and other problematic volatile organic
compounds to safer inert gas compounds, making the gas cleaner for downstream energy
conversion technologies. The plasma can also be used to melt ashes to form when cooled a slag
or frit which is a more inert form of ash for disposal or reuse from waste feedstocks that might
contain undesirable constituents. Oxygen blown gasification works on a principle similar to a blast
furnace to achieve high temperatures in the gasifier. This produces both a cleaner gas product
and a molten ash which forms an inert slag when cooled. Both these methods have considerable
electricity demands for either plasma torches or for air separation into oxygen.
Pyrolysis of biomass is another thermal degradation technology, but which is undertaken in the
absence of or with low levels of oxygen, and as such requires an external heat source to be self-
sustaining. Pyrolysis of biomass produces a bio-oil, char and syngas. There are two main types
of pyrolysis, fast and slow processes, with the relative proportions of the liquid, solid and gas
products changing considerably depending on the rate of heating. A fast or flash pyrolysis
process will produce more oil product and a slow process more gas and solid char. As with
gasification, there can be technical challenges with gas quality for its use in high conversion
efficiency electrical generation applications, and it is often instead consumed for raising process
heat.
Torrefaction is another technology emerging commercially with the capability of producing a
coal-like solid fuel from biomass. The torrified wood product has a low moisture and high calorific
value and can be stored, transported and used directly in coal fuel applications. The production
process involves slow heating to around 280 ºC to drive off moisture and volatiles and to
transform the residual carbon molecular structure to a more coal like matrix.
Some solid biomass feed stocks can also be considered as having potential for feed stocks for
second and third generation conversion technologies for the production of liquid or gaseous bio-
fuels which are covered in Sections 1.3 and 1.4 below.
The following tables list and comment on various solid bio-fuel technology types which are
considered commercially mature or are near to commercial deployment. One table presents
international technologies whilst the other focuses on specific national and South Australian
projects. The two tables present commentary on a range of high level considerations including:
Feedstock types applicable with reference to the above list of biomass types
Status of technology, whether the technology is considered fully commercial or more of an
emerging technology
Typical ranges in scale of the technology in terms of energy output or tonnes of feedstock
input
Indicative capital costs per unit of energy produced, where this can be provided
Key conversion factors or thermal efficiencies of the technologies
Any by-products produced and comments on their use or disposal requirements.

Jacobs Report
Filename: A Bioenergy Roadmap for South Australia - Report - Version 1.docx 13
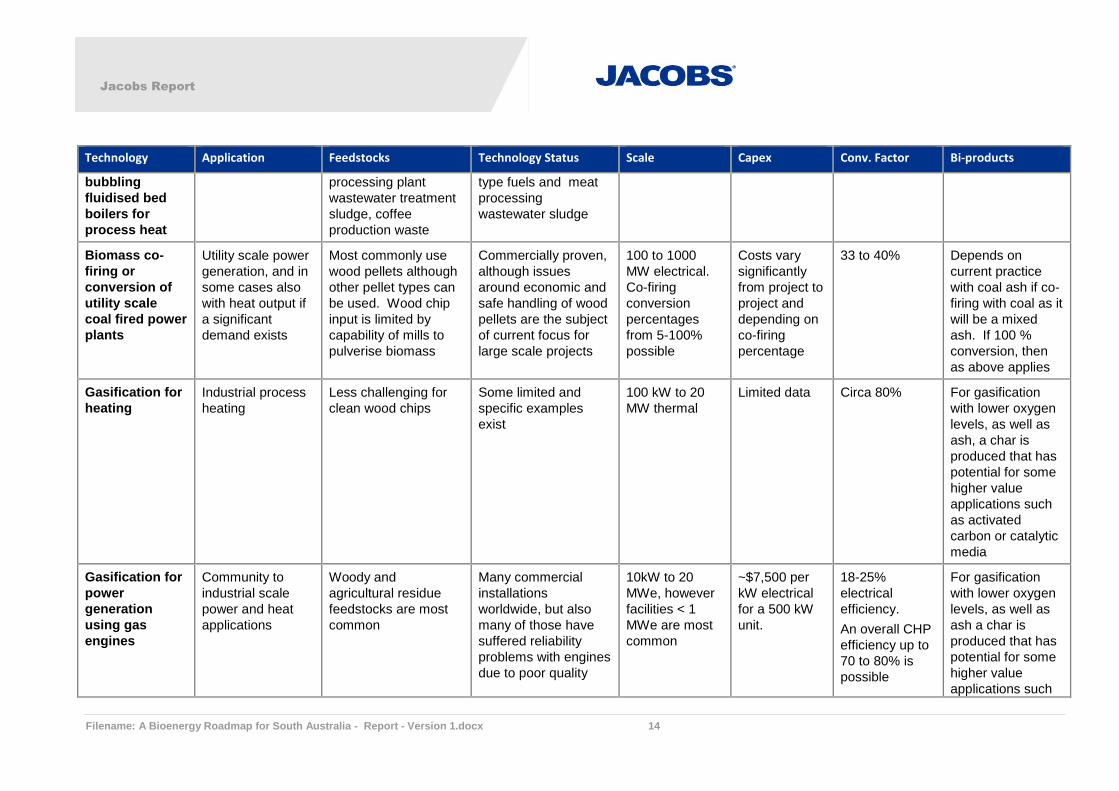
Table 1.1: International solid biomass technologies considered commercially mature or nearing commercial deployment
Technology Application Feedstocks Technology Status Scale Capex Conv. Factor Bi-products
Biomass
combustion
Domestic heating
to industrial scale
heating
Wood logs, chips and
pellets and some
selected agricultural
residues
Mature and common
place
5 kW to 50 MW
thermal
0.5-1 MWth =>
~$550/kW
80-90 %
thermal
Boiler ash which,
depending on fuel
types can be of
benefit as a soil
improver due to
Nitrogen,
Phosphorus and
Potassium content
Biomass
combustion
with steam
boiler and
steam turbine
for power or
combined heat
and power
(CHP)
Industrial or utility
scale power or
cogeneration
Woody biomass of all
types, many varieties
of agricultural residues
(with straws being the
most common form),
many varieties of
waste derived
biomass although
these feedstocks are
more challenging
technically
Mature and common
place, however more
care is needed for the
design and equipment
selection for
agricultural residues
and waste derived
biomass fuels due to
their specific physical
and chemical
properties
500 kW to 300
MW electrical
10 MWth =>
~$200/kW
10-35 %
electrical.
An overall CHP
efficiency up to
70 to 80 % is
possible
Boiler ash which,
depending on fuel
types can be of
benefit as a soil
improver due to
Nitrogen,
Phosphorus and
Potassium content
Biomass
combustion
with organic
fluid boiler for
power and
combined heat
and power
(CHP) by ORC
Industrial or
community scale
heat and power
provision
Woody biomass of all
types, not
recommended for
some waste or
agricultural residues
due to tube failure risk
Commercially proven
for clean wood chip
type fuels. Higher
technical risk for
agricultural and waste
fuels
50 kW to 5 MW
electrical
15 to 20 %
electrical.
An overall CHP
efficiency up to
70 to 80% is
possible
Boiler ash which,
depending on fuel
types can be of
benefit as a soil
improver due to
Nitrogen,
Phosphorus and
Potassium content
Biomass co-
firing using
Industrial scale Woody biomass co
firing e.g. food
Commercially proven
for clean wood chip
0 – 10 MW No information
available
No information
available
No information
available
Jacobs Report
Filename: A Bioenergy Roadmap for South Australia - Report - Version 1.docx 14
Technology Application Feedstocks Technology Status Scale Capex Conv. Factor Bi-products
bubbling
fluidised bed
boilers for
process heat
processing plant
wastewater treatment
sludge, coffee
production waste
type fuels and meat
processing
wastewater sludge
Biomass co-
firing or
conversion of
utility scale
coal fired power
plants
Utility scale power
generation, and in
some cases also
with heat output if
a significant
demand exists
Most commonly use
wood pellets although
other pellet types can
be used. Wood chip
input is limited by
capability of mills to
pulverise biomass
Commercially proven,
although issues
around economic and
safe handling of wood
pellets are the subject
of current focus for
large scale projects
100 to 1000
MW electrical.
Co-firing
conversion
percentages
from 5-100%
possible
Costs vary
significantly
from project to
project and
depending on
co-firing
percentage
33 to 40% Depends on
current practice
with coal ash if co-
firing with coal as it
will be a mixed
ash. If 100 %
conversion, then
as above applies
Gasification for
heating
Industrial process
heating
Less challenging for
clean wood chips
Some limited and
specific examples
exist
100 kW to 20
MW thermal
Limited data Circa 80% For gasification
with lower oxygen
levels, as well as
ash, a char is
produced that has
potential for some
higher value
applications such
as activated
carbon or catalytic
media
Gasification for
power
generation
using gas
engines
Community to
industrial scale
power and heat
applications
Woody and
agricultural residue
feedstocks are most
common
Many commercial
installations
worldwide, but also
many of those have
suffered reliability
problems with engines
due to poor quality
10kW to 20
MWe, however
facilities < 1
MWe are most
common
~$7,500 per
kW electrical
for a 500 kW
unit.
18-25%
electrical
efficiency.
An overall CHP
efficiency up to
70 to 80% is
possible
For gasification
with lower oxygen
levels, as well as
ash a char is
produced that has
potential for some
higher value
applications such

Jacobs Report
Filename: A Bioenergy Roadmap for South Australia - Report - Version 1.docx 15
Technology Application Feedstocks Technology Status Scale Capex Conv. Factor Bi-products
gas as activated
carbon or catalytic
media
Plasma
gasification
with syngas
cleaned and
used in gas
engines or gas
turbines
Industrial scale Generally applied to
waste derived fuels
A very limited number
of demonstration type
plants are operating,
but it is not considered
well proven
technology
Circa 100 to
1,0001,2 tonnes
per day of
waste feedstock
$0.22-0.29
million
AUD$/TPD2
Some report
around 30%
gross electric
efficiency3,4.
Note that
parasitic
demand is high
due to plasma
torches (20-
25%)
Produces fused
slag from
solidification of
molten ash. Has
some potential for
use as a
construction
material
Oxygen blown
gasification
(blast furnace
type)
Industrial Scale Generally applied to
process waste derived
fuels
Some examples
operating
commercially in
markets with very high
waste disposal gate
fees e.g. Japan, which
can justify it
economically
50,000 -100,000
tonnes per
annum waste
feedstock
Little
published
data, expected
to be high
Little published
data, expected
to have high
parasitic loads
to run process
Produces fused
slag from
solidification of
molten ash. Has
some potential for
use as a
construction
material
Pyrolysis for
heating
Small to medium
industrial heating
applications
All feedstocks are
possible in theory, but
this technology in
practice is often
applied to waste
derived fuels
Limited number of
examples known
where this has been
proven as successful
40,000 -100,000
tonnes per
annum waste
feedstock
Little
published data
Circa 80% on
heat output
Depending on
feedstock types
and process type,
process can
produce a coke or
oil which may have
some potential for
higher value
applications

Jacobs Report
Filename: A Bioenergy Roadmap for South Australia - Report - Version 1.docx 16
Technology Application Feedstocks Technology Status Scale Capex Conv. Factor Bi-products
Pyrolysis for
power
generation with
a gas engine or
boiler and
steam turbine
Community to
industrial scale for
power generation
All feedstocks are
possible in theory, but
this technology in
practice is often
applied to waste
derived fuels
Few well proven
examples with
engines running
successfully due to
gas quality issues.
Some commercial
examples exist where
pyrolysis gas is burnt
in a steam boiler
feeding a steam
turbine
500 kW to 20
MW electrical
~$5,000 / kWe
@ 10 MWe
scale
9 - 26% Depending on
feedstock types
and process type,
process can
produce a coke or
oil which may have
some potential for
higher value
applications
Torrefaction
(low
temperature
heating to dry
and devolatilise
solid biomass)
Production of a dry
low volatile bio-
coal type high
calorific value (e.g.
~20-21 MJ/kg) and
energy density
transportable fuel
product that can
replace coal
Wood chips have
been the main fuel
attempted to date. In
theory, agricultural
residues may also be
possible feedstocks
Some pilot scale and
commercial
demonstration
facilities exist for this
technology
20,0005 to
60,0006 tonnes
per annum of
bio-coal product
(current plants),
250,000 tpa
marketed by
vendors
~$400 per
annual tonne
of product7
94 to 96% of
original
biomass energy
content is
retained.
A volatile
combustible gas is
produced during
torrefaction which
is used as an
energy source to
heat the
torrefaction
process to around
2800 ºC
Table 1.2: Examples of Australian and South Australian solid biomass projects that are commercial installations or demonstrated in deployment
Project / Location Tech. / Application Feedstocks Technology Status Scale Capex Conv. Factor Bi-products
Various NSW and QLD
sugar industry
biomass cogeneration
projects: e.g. Mackay
(38 MW), Broadwater
Cogeneration with
steam boiler and
turbine for
industrial process
heat, and site and
Bagasse
(sometimes with
secondary fuel
for the non-crush
season, such as
Mature with at least
4 30MW or greater
projects operating,
and a number of
smaller scale cogen
500kW to 40
MW electrical
Most recent
Racecourse
Cogen, Mackay
is $120 M8 for 38
MW in 2013
20-25% Bagasse ash is
generally
returned to cane
fields for use as
a soil improver

Jacobs Report
Filename: A Bioenergy Roadmap for South Australia - Report - Version 1.docx 17
Project / Location Tech. / Application Feedstocks Technology Status Scale Capex Conv. Factor Bi-products
(30 MW), Condong (30
MW) and Rocky Point
(30 MW)
export power green waste or
wood chips)
projects at various
sugar mills
Project Harvest
Biomass Plant,
Carwarp, Victoria
Combustion with
steam turbine for
power generation
for grid export and
food industry use
(almond
processing plant)
Almond shells
and spent grape
mark
The technology is
well proven but this
would be the first
use with these
particular
feedstocks. This
project is at an
advanced stage of
development
35 MWe gross Approx. $140 M9 Circa 27% The ash product
is proposed to
be used as a
compost additive
due to valuable
nutrient content
Phoenix Energy Waste
to Energy Plant
Kwinana, WA
Martin stoker grate
combustion system
with a steam
turbine for power
generation
Municipal solid
waste (MSW)
including some
commercial and
industrial
feedstocks
Mature, hundreds of
this type of facility
operating worldwide.
This project is
currently at the
planning stage
400,000
tonnes per
annum. 32
MW electricity
export
capacity10
$380 M11 Sufficient to be
deemed a
recovery
operation under
the EU R1
efficiency criteria
Bottom ash has
some potential
for re-use as
construction
aggregate
New Energy East
Rockingham and
Pilbara Waste to
Energy Projects, WA
Entech low
temperature
gasification with
syngas burner,
boiler and steam
turbine
Residual
municipal solid
waste after a
front end
treatment
process
A number of
reference plants for
the Entech
technology are
claimed (46 in total)12
Each project is
up to 130,000
tonnes of post
treatment
SRF, up to 18
MWe
Approx. $200 M
for East
Rockingham13
Not stated It is understood
that ashes from
the process will
be inert and
landfilled12
Select Harvest,
Robinvale, Vic
Boiler / Steam
Turbine
Almond shell
and hull
Contract placed with
Vyncke
2.5 MWe, and
supplying 700
kW heat to
almond dryer
$12.9 M EPC
price
Not stated It is understood
ash will be
returned to the
almond orchards
Western Australian Boiler / steam Saw mill waste Development 40 MWe $150 M 23% Ash

Jacobs Report
Filename: A Bioenergy Roadmap for South Australia - Report - Version 1.docx 18
Project / Location Tech. / Application Feedstocks Technology Status Scale Capex Conv. Factor Bi-products
Biomass, Manjimup
WA
turbine and forest
residuals
consent approved,
but awaiting RET
certainty
Carter Holt Sawmill, Mt
Gambier, SA
Boiler / steam
turbine
Wood waste In operation since
1995
10MWe Not known Expected to be
cica 22%
Ash
Regen Australia,
various states
Boiler / steam
turbine
Waste wood
fired
Various projects
under development
10 - 15 MWe $50 M 22% Ash
Southwood
Huon Valley, Tas
Boiler / steam
turbine
Forest residue In development 30 - 50 MWe Not stated 25% Ash
South East Fibre
Exports, Eden, NSW
Boiler / steam
turbine
Sawmill residues In development 5 MWe $20 M 23% Ash
Dial A Dump
Industries Waste to
Energy, Eastern
Creek, NSW
Moving grate boiler
and steam turbine
Municipal waste In development 140 MWe, 1.2
million tonnes
per year of
waste
$800 M Not stated Bottom ash has
some potential
for re-use as
construction
aggregate
Select Harvest
Robinvale, Vic
Boiler / Steam
Turbine
Almond shell
and hull
Contract placed with
Vyncke
2.5 MWe, and
supplying 700
kW heat to
almond dryer
$12.9 M EPC
price
Not stated It is understood
ash will be
returned to the
almond orchards
Visy, Tumut, NSW14 No information
available
Degraded paper
fibre from a
paper /
cardboard
recycling plant
Operating No information
available.
No information
available
No information
available
No information
available
Visy, Campbellfield,
Vic15
No information
available
Degraded paper
fibre from a
Operating 30 MWth and
3 MWe
$50 M No information
available
No information
available
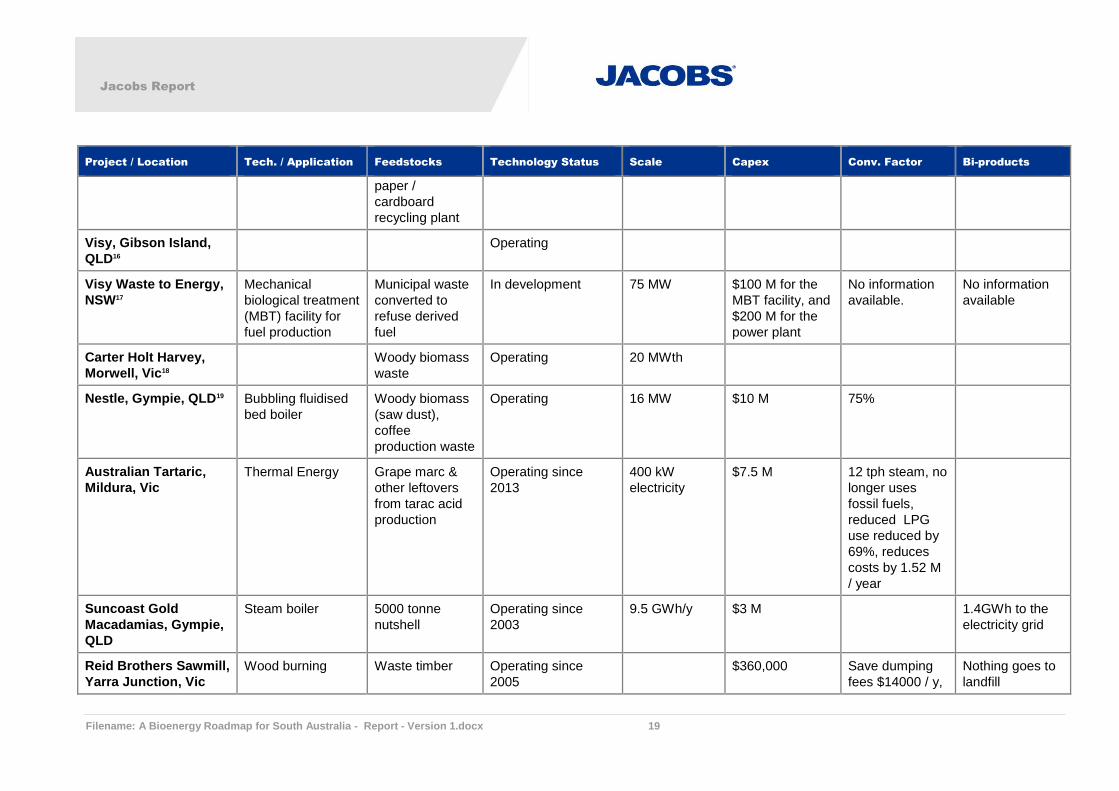
Jacobs Report
Filename: A Bioenergy Roadmap for South Australia - Report - Version 1.docx 19
Project / Location Tech. / Application Feedstocks Technology Status Scale Capex Conv. Factor Bi-products
paper /
cardboard
recycling plant
Visy, Gibson Island,
QLD16
Operating
Visy Waste to Energy,
NSW17
Mechanical
biological treatment
(MBT) facility for
fuel production
Municipal waste
converted to
refuse derived
fuel
In development 75 MW $100 M for the
MBT facility, and
$200 M for the
power plant
No information
available.
No information
available
Carter Holt Harvey,
Morwell, Vic18
Woody biomass
waste
Operating 20 MWth
Nestle, Gympie, QLD19
Bubbling fluidised
bed boiler
Woody biomass
(saw dust),
coffee
production waste
Operating 16 MW $10 M 75%
Australian Tartaric,
Mildura, Vic
Thermal Energy Grape marc &
other leftovers
from tarac acid
production
Operating since
2013
400 kW
electricity
$7.5 M 12 tph steam, no
longer uses
fossil fuels,
reduced LPG
use reduced by
69%, reduces
costs by 1.52 M
/ year
Suncoast Gold
Macadamias, Gympie,
QLD
Steam boiler 5000 tonne
nutshell
Operating since
2003
9.5 GWh/y $3 M 1.4GWh to the
electricity grid
Reid Brothers Sawmill,
Yarra Junction, Vic
Wood burning Waste timber Operating since
2005
$360,000 Save dumping
fees $14000 / y,
Nothing goes to
landfill

Jacobs Report
Filename: A Bioenergy Roadmap for South Australia - Report - Version 1.docx 20
Project / Location Tech. / Application Feedstocks Technology Status Scale Capex Conv. Factor Bi-products
save LPG
$270,000 / y
Gelliondale Nursery,
Alberton, Vic
Hydronic thermal
generator
Wet sawdust
and olive pips
Operating since
2010
1.5 MW $500,000 Save $170,000 /
y
Mt Gambier Aquatic
Centre, Mt Gambier SA
Biomass boiler Forestry wood Operating since
2013
520 kW Save $40,000 / y
compared to
LPG
Beaufort Hospital,
Beaufort, Victoria
Wood fired boiler Waste wood
chips
Operating since
2013
110 kW $430,000 Save $34,000 /
y compared to
LPG
Murphy Fresh
Hydroponics,
Mansfield, Vic
Thermal generator Waste hardwood Operating 6 MW $600,000 Save $1.65 M / y
over LPG
Jacobs Report
Filename: A Bioenergy Roadmap for South Australia - Report - Version 1.docx 21
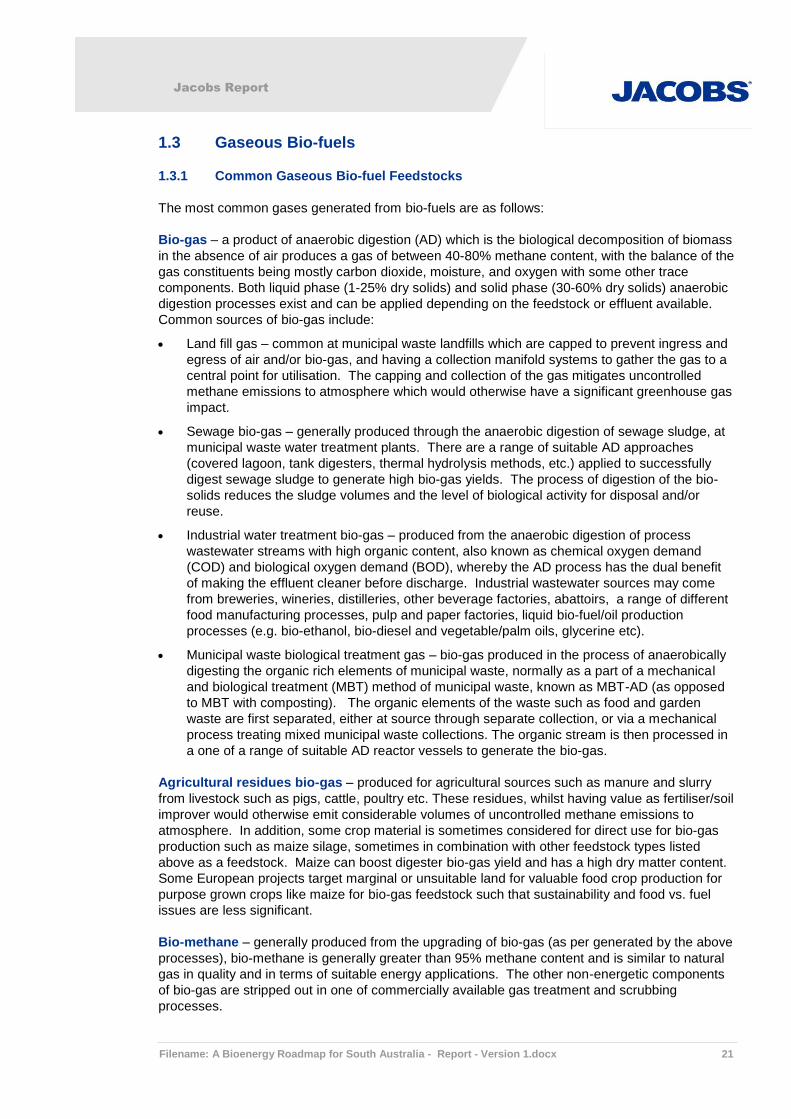
1.3 Gaseous Bio-fuels
1.3.1 Common Gaseous Bio-fuel Feedstocks
The most common gases generated from bio-fuels are as follows:
Bio-gas – a product of anaerobic digestion (AD) which is the biological decomposition of biomass
in the absence of air produces a gas of between 40-80% methane content, with the balance of the
gas constituents being mostly carbon dioxide, moisture, and oxygen with some other trace
components. Both liquid phase (1-25% dry solids) and solid phase (30-60% dry solids) anaerobic
digestion processes exist and can be applied depending on the feedstock or effluent available.
Common sources of bio-gas include:
Land fill gas – common at municipal waste landfills which are capped to prevent ingress and
egress of air and/or bio-gas, and having a collection manifold systems to gather the gas to a
central point for utilisation. The capping and collection of the gas mitigates uncontrolled
methane emissions to atmosphere which would otherwise have a significant greenhouse gas
impact.
Sewage bio-gas – generally produced through the anaerobic digestion of sewage sludge, at
municipal waste water treatment plants. There are a range of suitable AD approaches
(covered lagoon, tank digesters, thermal hydrolysis methods, etc.) applied to successfully
digest sewage sludge to generate high bio-gas yields. The process of digestion of the bio-
solids reduces the sludge volumes and the level of biological activity for disposal and/or
reuse.
Industrial water treatment bio-gas – produced from the anaerobic digestion of process
wastewater streams with high organic content, also known as chemical oxygen demand
(COD) and biological oxygen demand (BOD), whereby the AD process has the dual benefit
of making the effluent cleaner before discharge. Industrial wastewater sources may come
from breweries, wineries, distilleries, other beverage factories, abattoirs, a range of different
food manufacturing processes, pulp and paper factories, liquid bio-fuel/oil production
processes (e.g. bio-ethanol, bio-diesel and vegetable/palm oils, glycerine etc).
Municipal waste biological treatment gas – bio-gas produced in the process of anaerobically
digesting the organic rich elements of municipal waste, normally as a part of a mechanical
and biological treatment (MBT) method of municipal waste, known as MBT-AD (as opposed
to MBT with composting). The organic elements of the waste such as food and garden
waste are first separated, either at source through separate collection, or via a mechanical
process treating mixed municipal waste collections. The organic stream is then processed in
a one of a range of suitable AD reactor vessels to generate the bio-gas.
Agricultural residues bio-gas – produced for agricultural sources such as manure and slurry
from livestock such as pigs, cattle, poultry etc. These residues, whilst having value as fertiliser/soil
improver would otherwise emit considerable volumes of uncontrolled methane emissions to
atmosphere. In addition, some crop material is sometimes considered for direct use for bio-gas
production such as maize silage, sometimes in combination with other feedstock types listed
above as a feedstock. Maize can boost digester bio-gas yield and has a high dry matter content.
Some European projects target marginal or unsuitable land for valuable food crop production for
purpose grown crops like maize for bio-gas feedstock such that sustainability and food vs. fuel
issues are less significant.
Bio-methane – generally produced from the upgrading of bio-gas (as per generated by the above
processes), bio-methane is generally greater than 95% methane content and is similar to natural
gas in quality and in terms of suitable energy applications. The other non-energetic components
of bio-gas are stripped out in one of commercially available gas treatment and scrubbing
processes.

Jacobs Report
Filename: A Bioenergy Roadmap for South Australia - Report - Version 1.docx 22
Producer gas and syngas – these gas types are produced from gasification and pyrolysis of
biomass as described in Section 1.2 above.
1.3.2 Utilisation of Gaseous Bio-fuels
Gaseous bio-fuels are readily usable fuels in a range of energy applications which generate lower
local environmental emissions issues at the end use point than solid biomass fuels, as there is no
significant particulate matter emitted. The following dot-points highlight some of the most
comment current practices.
Bio-gas is the most widely used and produced form of gaseous bio-fuel. Common current
utilisation practice includes:
Stationary reciprocating spark ignition engines – the most common application of bio-gas use
is gas engines which are not dissimilar to engines used for locomotion of automotive vehicles, but
are connected to an electrical generator rather than a driveshaft. These engines can also
produce low or high temperature useful heat from the engine cooling water circuit or through
exhaust heat recovery boilers. Most bio-gases required some form of gas pre-treatment before
they can be combusted reliably in gas engines.
Gas fired boilers – a common application of bio-gas energy at locations where there exists a
significant demand for process heat in the form of hot water or steam (e.g. distilleries or
wastewater treatment works for digester heating etc). There are some installations where bio-gas
is also fired with solid fuels such as biomass in a boiler, particularly at installations co-located
where solid biomass residues are also generated from a production process (e.g. food and drink
sector). There are also examples where the boilers run in parallel and inter-linked with engine
exhaust heat recovery systems.
Gas turbines and micro-turbines – a less common alternative for power and steam production,
however there are some examples of bio-gases being use as the sole fuel or co-fired fuel with
natural gas. Whilst efficiency levels of small gas turbines when operated in open cycle which
might be expected with bio-gas applications, a greater proportion of the exhaust energy can be
recovered as medium to high pressure steam for process use, which is sometimes of interest to
large industrial processes. In some cases gas turbines can also offer longer lifecycles between
major maintenance than gas engines, and lower maintenance costs. A high standard of gas pre-
treatment is required for gas turbines however.
Fuel cells - A more niche or emerging application for the use of bio-gas is the use in fuel cells,
which, whilst much more expensive, can offer higher electrical conversion efficiencies. This
approach is not considered current standard commercial practice.
Stirling engines – Another emerging option for very small scale bio-gas applications, Stirling
engines are heat driven engines but are not widely adopted commercially at this time.
Bio-methane for vehicle fuel - Bio-methane can be suitable for use as a vehicle fuel, via
compression to compressed natural gas (CNG) or liquefied to liquefied natural gas (LNG). Fairly
stringent quality standards of gas treatment are required from the gas upgrading process to
satisfy vehicle engine manufacturer standards. There are a number of examples of vehicle fuels
(e.g. buses, council vehicle fleets or refuse collection vehicles) reliably running on bio-methane in
Europe, some of which have developed with grant funding as technology demonstrator projects.
Bio-methane for gas grid injection - It is also possible and is coming into commercial practice in
some parts of Europe to compress and inject the gas into the natural gas network for wider
distribution. Grid gas injection will likely require various regulatory gas quality requirements to
need to be met, which might include adding odorants to the gas for safety reasons, and potentially

Jacobs Report
Filename: A Bioenergy Roadmap for South Australia - Report - Version 1.docx 23
adding other gaseous hydrocarbon elements such as propane etc., to make the gas more
comparable to network natural gas in terms of Wobbe Index, which is an international standard
measure of comparable combustibility for natural gas consuming appliances.
Producer gases and syngases - Generally these gases are consumed for use for heating and
power applications as described in that section, but other ‘2nd and 3rd generation’ reforming and
upgrading options to natural gas like quality and into other useful fuel or higher value chemical
products. These upgrading/reforming technologies are considered to be mostly either the subject
of research and development or installed as demonstration facilities or prototypes, and thus are
not considered further in this review of current commercial practice.
The following tables list and comment on various gaseous bio-fuel technology types which are
considered commercially mature or are near to commercial deployment. One table presents
international technologies whilst the other focuses on specific national and South Australian
projects. The two tables present commentary on a range of high level considerations including:
Feedstock types applicable with reference to the above list of biomass types
Status of technology, whether the technology is considered fully commercial or more of an
emerging technology
Typical ranges in scale of the technology in terms of energy output or tonnes of feedstock
input
Indicative capital costs per unit of energy produced, where this can be provided
Key conversion factors or thermal efficiencies of the technologies
Any by-products produced and comments on their use or disposal requirements.

Jacobs Report
Filename: A Bioenergy Roadmap for South Australia - Report - Version 1.docx 24
Table 1.3: International gaseous bio-fuel technologies considered commercially mature or nearing commercial deployment
Technology Application Feedstocks Technology Status Scale Capex Conv. Factor Bi-products
Anaerobic
digestion
with bio-gas
burnt in a
boiler
Industrial
heating
applications
Sewage sludge,
food production
effluents,
distilleries and
breweries
Established in niche
industrial examples,
i.e. at sites where
feedstocks are
produced and where
a heat demand exists
0.1 - 10
MWth
Whole system including
digester ~$4,500/kWth20,
but depends on feedstock
type and capacity
~90% (boiler
efficiency)
In some low chemical risk
feedstock cases (e.g.
uncontaminated food
waste) if local regulations
allow, the digestate which
is the undigested residual
biomass or sludge, can be
used as a fertiliser or soil
improver
Anaerobic
digestion
with bio-gas
used in a
CHP gas
engine
Site and export
power and
heat for
industrial and
community
scale demands
Most feedstock
types can be
coupled with a
bio-gas CHP
engine
Well proven and
established,
assuming appropriate
gas treatment is
employed where
required
0.1 - 10
MWe
Whole system including
digester ~$12,000/kWe20
but depends on feedstock
type and capacity.
34 - 43%
engine
efficiency,
CHP efficiency
up to 70 - 80%
possible
As above
Landfill gas
with gas
engine
generator
Power
production for
grid export and
site use.
Landfill gas Proven at many
installations
worldwide
0.2 - 15
MWe
Engines only
~$2,500/kWe20
34 - 43%
engine
efficiency
None
Bio-gas
burnt in a
micro
turbine or
gas turbine
Site and export
power and
heat for
industrial scale
demands
Could potentially
be any form of
bio-gas. Some
examples known
to exist are
sewage sludge
and landfill gas
Proven in a small
number of
installations
internationally,
assuming appropriate
gas treatment is
employed where
required
Micro
turbines
0.3 - 1
MWe, gas
turbines 1
- 5 MWe
Whole system including
digester
~$15,000/kWe22,20 but
depends on feedstock
type and capacity
2521 to 35%,
CHP efficiency
up to 70-80%
possible
In some low chemical risk
feedstock cases (e.g.
uncontaminated food
waste) if local regulations
allow, the digestate which
is the undigested residual
biomass or sludge, can be
used as a fertiliser or soil

Jacobs Report
Filename: A Bioenergy Roadmap for South Australia - Report - Version 1.docx 25
Technology Application Feedstocks Technology Status Scale Capex Conv. Factor Bi-products
improver
Bio-gas fuel
cells
Base load high
efficiency
power
generation
Could potentially
be any form of
bio-gas. Some
examples known
to exist are
sewage sludge,
food processing
effluent and
landfill gas.
Proven in a small
number of
installations
internationally,
assuming appropriate
gas treatment is
employed where
required.
0.3 - 3
MWe22
~16,000/kWe20,22
but depends on feedstock
type and capacity
35 to 60%
electrical
As above for digestate.
Some fuel cells can also
alternately produce
hydrogen gas such as to
fuel vehicles, at the
expense of sacrificing a
proportionate amount of
power output
Anaerobic
digestion
with bio-gas
upgraded to
bio-methane
Vehicle fuel
use or gas grid
injection
Could potentially
be any form of
bio-gas. Some
examples known
to exist are
sewage sludge,
landfill gas and
brewery effluent.
Proven in a low
number of
installations
internationally. Gas
upgrading
technologies are
similar to existing
fossil gas and bio-gas
processing equipment
30024 –
540023
Nm3/h
bio-gas
Excluding AD costs,
upgrading is $1.4 M per
300 Nm3/h of raw bio-
gas24. Bio-gas volume
equivalent to around 0.75
MWe of generation by
gas engine.
Not applicable,
can be used
equivalent to
natural gas
applications
As above for digestate.
CO2 for industrial use
could also be potentially
produced at some facilities
from the upgrading
process
Table 1.4: Examples of Australian and South Australian gaseous bio-fuel projects that are commercial installations or demonstrated in deployment
Project / Location Tech. / Application Feedstocks Technology Status Scale Capex Conv. Factor Bi-products
Multiple landfill sites Landfill gas /
reciprocating engines
In situ
degradation of
municipal
waste
Commercial and well
developed
100s
MWe
Unknown Unknown None
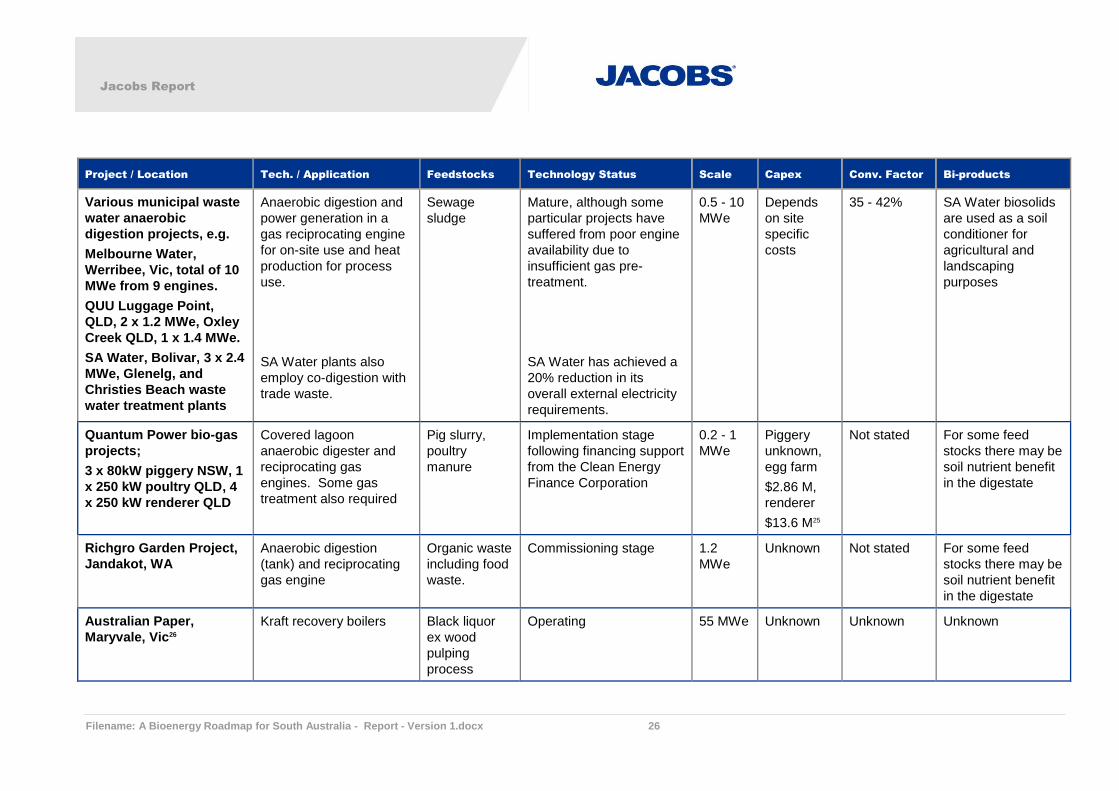
Jacobs Report
Filename: A Bioenergy Roadmap for South Australia - Report - Version 1.docx 26
Project / Location Tech. / Application Feedstocks Technology Status Scale Capex Conv. Factor Bi-products
Various municipal waste
water anaerobic
digestion projects, e.g.
Melbourne Water,
Werribee, Vic, total of 10
MWe from 9 engines.
QUU Luggage Point,
QLD, 2 x 1.2 MWe, Oxley
Creek QLD, 1 x 1.4 MWe.
SA Water, Bolivar, 3 x 2.4
MWe, Glenelg, and
Christies Beach waste
water treatment plants
Anaerobic digestion and
power generation in a
gas reciprocating engine
for on-site use and heat
production for process
use.
SA Water plants also
employ co-digestion with
trade waste.
Sewage
sludge
Mature, although some
particular projects have
suffered from poor engine
availability due to
insufficient gas pre-
treatment.
SA Water has achieved a
20% reduction in its
overall external electricity
requirements.
0.5 - 10
MWe
Depends
on site
specific
costs
35 - 42% SA Water biosolids
are used as a soil
conditioner for
agricultural and
landscaping
purposes
Quantum Power bio-gas
projects;
3 x 80kW piggery NSW, 1
x 250 kW poultry QLD, 4
x 250 kW renderer QLD
Covered lagoon
anaerobic digester and
reciprocating gas
engines. Some gas
treatment also required
Pig slurry,
poultry
manure
Implementation stage
following financing support
from the Clean Energy
Finance Corporation
0.2 - 1
MWe
Piggery
unknown,
egg farm
$2.86 M,
renderer
$13.6 M25
Not stated For some feed
stocks there may be
soil nutrient benefit
in the digestate
Richgro Garden Project,
Jandakot, WA
Anaerobic digestion
(tank) and reciprocating
gas engine
Organic waste
including food
waste.
Commissioning stage 1.2
MWe
Unknown Not stated For some feed
stocks there may be
soil nutrient benefit
in the digestate
Australian Paper,
Maryvale, Vic26
Kraft recovery boilers Black liquor
ex wood
pulping
process
Operating 55 MWe Unknown Unknown Unknown
Jacobs Report
Filename: A Bioenergy Roadmap for South Australia - Report - Version 1.docx 27
Project / Location Tech. / Application Feedstocks Technology Status Scale Capex Conv. Factor Bi-products
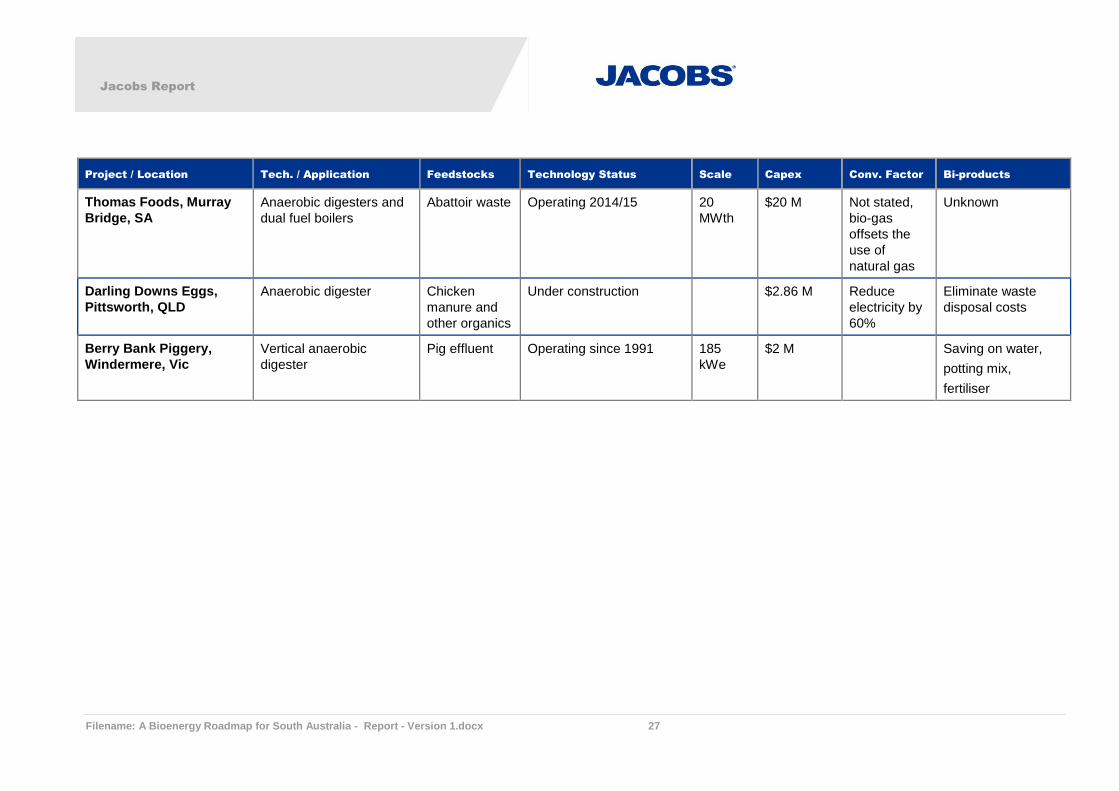
Thomas Foods, Murray
Bridge, SA
Anaerobic digesters and
dual fuel boilers
Abattoir waste Operating 2014/15 20
MWth
$20 M Not stated,
bio-gas
offsets the
use of
natural gas
Unknown
Darling Downs Eggs,
Pittsworth, QLD
Anaerobic digester Chicken
manure and
other organics
Under construction $2.86 M Reduce
electricity by
60%
Eliminate waste
disposal costs
Berry Bank Piggery,
Windermere, Vic
Vertical anaerobic
digester
Pig effluent Operating since 1991 185
kWe
$2 M Saving on water,
potting mix,
fertiliser

Jacobs Report
Filename: A Bioenergy Roadmap for South Australia - Report - Version 1.docx 28
1.4 Liquid Bio-fuels
1.4.1 Common Liquid Bio-fuels
There are many pathways for the production of bio-fuels from biomass sources, and these are
sometimes broadly classified in terms of first, second and third generation bio-fuels, on the basis
of the feedstock used and its potential for alternately producing food if not used for bio-fuels. A
further generalisation could be made that in many cases first generation fuels are less complex to
produce and also tend to have a higher degree of commercial proving than second and third
generation fuels. The challenge faced by many bio-fuels projects worldwide is to produce fuels
without displacing valuable food production activities or resulting in land clearing for bio-fuel
crops, which is the rationale behind this classification method, however it is noted that the
classifications below do not provide a complete picture of the overall sustainability of any
particular bio-fuel project.
1st Generation Fuels - Traditional bio-fuel production methods are known as 1st generation
which includes bio-fuels bio-ethanol and bio-diesel. These are produced from biomass materials
where the precursors (e.g. wheat, corn, oil crops etc.) required for production such as sugars for
fermentation into ethanol, and oils for trans-esterification into bio-diesel, are readily available in
the feedstock. The feedstocks for these fuels generally could potentially be otherwise used for
human or animal food production. There are also some vegetable, animal and wood derived bio-
oils that are usable for energy production without refining to bio-diesel in some energy conversion
technologies.
2nd Generation Fuels - The production of bio-fuels from more difficult feed stocks are known as
2nd generation methods, which are generally speaking use feedstocks which could not be used
as a food source such as wastes and residues. The complexity of production from these
feedstocks is generally higher, and the technologies are less commercially developed and the
subject of continuing development and proving in demonstration plants. 2nd generation bio-fuels
include production of bio-ethanol from cellulosic feedstocks such as wood which requires
additional processing steps (e.g. more complex size reduction/milling and acid/alkali/heat etc pre-
treatment to enhance hydrolysis) to break down the cellulose to useable sugars before
fermentation to alcohol. Some differences in the fermentation step are also required so that C5
molecules can also be fermented with the C6 sugars. It would also include the production of bio-
diesel from waste vegetable oils (such as used food frying oils). Another technology sometimes
defined as 2nd generation is the production of bio-diesel from solid biomass using the Fischer-
Tropsch process following gasification of the biomass. Pyrolysis of biomass to a bio-oil (as
described above) could also be considered a 2nd generation method.
3rd Generation Fuels - Bio-fuels produced by aquatic autotrophic organisms such as algae are
sometimes classified as 3rd generation bio-fuels. The algae feedstocks can potentially be
produced from land or water bodies that do not compete with food production. There are algae
technologies that rely primarily on sunlight, water and atmospheric carbon dioxide to grow a
biomass which can become a feedstock for bio-fuels production. There are also some algae
technologies that rely on a source of carbon dioxide rich gas such as flue gas from a combustion
process (using fossil fuel or biomass) to grow the algae biomass. Some algae are high in lipid or
oil content which make suitable bio-diesel feedstocks. The non-lipid (carbohydrate/cellulose) part
of the algae can also become a bio-ethanol feedstock, and there are some algae species that can
directly produce ethanol in an anaerobic fermentation process. Algae technologies for bio-diesel
and bio-ethanol are generally speaking at the research and development stage with some small
scale pilot facilities existing, but to our knowledge no commercial plants currently exist. There
are algae plants in production however targeting higher value pharmaceutical and health food
applications for the biomass produced from the process27.
Jacobs Report
Filename: A Bioenergy Roadmap for South Australia - Report - Version 1.docx 29
The most common fuels and their feedstocks are described briefly below (this list is not
exhaustive):
Bio-ethanol (ethyl alcohol)
First generation – from the fermentation, distillation and molecular sieving using feedstocks
such as sugars or starch extracted from (in some cases with enzyme hydrolysis) from wheat,
sorghum, corn, cassava, beet and molasses (cane sugar by-product) etc.
Second generation - from cellulosic and lignin feedstocks such as wood, straw (e.g. wheat
and rice straw and corn stover), bagasse (sugar cane fibre), and some grasses.
Third generation – from the cellulosic part of algae or with algae species that can directly
produce bio-ethanol.
Bio-diesel (fatty acid methyl ester)
First generation - from trans-esterification process using oil seed rape, palm oil, canola,
jatropha or other crops which produce an oily seed.
Second generation – from waste bio-oils such as tallow and used cooking oil from food
factories and restaurants/takeaways. Tall Oil can also be refined to bio-diesel and is a by-
product of the KRAFT process for wood pulping of coniferous trees.
Third generation – trans-esterification of lipids extracted from algae.
Bio-butanol (butyl alcohol)
This product has a higher octane number than bio-ethanol and is derived from a different
type of fermentation process of sugars to produce the larger alcoholic molecule from first
generation feedstocks (with potential to be produced from second generation feedstocks in
the future)28.
Pyrolysis oil
Second generation - from the fast or flash pyrolysis of solid biomass feedstocks such as
wood and agricultural residues.
Biomass to liquid fuels from Fischer-Tropsch or Mobil processes
Second generation technology which is at the pilot scale demonstration stage using various
solid biomass feedstocks such as short rotation trees, perennial grasses, straw, forest
thinnings, bark from paper-pulp production, bagasse, waste paper or reclaimed wood or fibre
based-composites29.
Glycerine
A by-product of the production of bio-diesel by trans-esterification, which has reasonably high
calorific value if impurities are removed.
1.4.2 Utilisation of Liquid Bio-fuels
Liquid bio-fuels present higher value opportunities for utilisation as they can substitute petroleum
based fuels such as petrol and diesel. The following are the main potential applications for liquid
bio-fuels:
Transport fuels
Bio-ethanol is a substitute for petrol in transport vehicle applications and is a higher octane
number fuel than normal petrol blends. For normal petrol engines, the substitution rate in
petrol is typically limited to around 10% (E1027), such that the blended product can be used
Jacobs Report
Filename: A Bioenergy Roadmap for South Australia - Report - Version 1.docx 30
in engines requiring no modifications with minimal risk. Blends up to around 85 to 100%
(E85 to E100) can be utilised in petrol engines with some modifications (optimally with
engines with increased compression ratios) and bio-ethanol is utilised at these high blend
rates commercially in Brazil on a large scale and also in some specific outlets in Australia
and the US.
Bio-diesel is a substitute for petroleum based diesel. There are some differing chemical
properties with bio-diesel in terms of handling and storage which need to be considered
when substituting bio-diesel, such as bacterial degradation. Blends up to 20% (B20) bio-
diesel are possible to use in most conventional vehicle engines without modifications,
although B5 is more commonly sold. Higher blend rates to 100% are possible with modified
engines.
Bio-butanol is another petrol substitute and can be more readily substituted with petrol
because it is a larger molecule and has a more similar octane number to regular petrol. Bio-
butanol is not yet commonly available for vehicle fuel.
Stationary reciprocating diesel engines
Bio-diesel and some unrefined bio oils (palm oil, soy bean oil, rape seed oil, used vegetable
and animal oils, pyrolysis oil etc)30 can be used directly or in blends with relatively high
efficiency power generation diesel engines. Diesel engines provide specifications for bio oil
and bio-diesel fuels that must be met to minimise technical issues with these fuels. Such
engines can also be run as combined heat and power plants.
Burners and boilers
Considered a lower value application for quality fuels of this type, unless they are unrefined
or contain problematic constituents. Glycerine is one bio-fuel by-product that is sometimes
burned because the production of bio-diesel has resulted in a glut of glycerine available for
higher value applications. Pure glycerine has a high calorific value if the other impurities are
removed. Pyrolysis oil is another oil that could be used in this way if not subject to further in
a bio refining.
Anaerobic digestion
Glycerine is one bio liquid that is considered as a potential high value feedstock for anaerobic
digestion. Other bio-oil by-product wastes can also be considered as feedstock for anaerobic
digestion.
The following tables list and comment on various liquid bio-fuel technology types which are
considered commercially mature or are near to commercial deployment. One table presents
international technologies whilst the other focuses on specific national and South Australian
projects. The two tables present commentary on a range of high level considerations including:
Feedstock types applicable with reference to the above list of biomass types.
Status of technology, whether the technology is considered fully commercial or more of an
emerging technology.
Typical ranges in scale of the technology in terms of energy output or tonnes of feedstock
input.
Indicative capital costs per unit of energy produced, where this can be provided.
Key conversion factors or thermal efficiencies of the technologies.
Any by-products produced and comments on their use or disposal requirements.
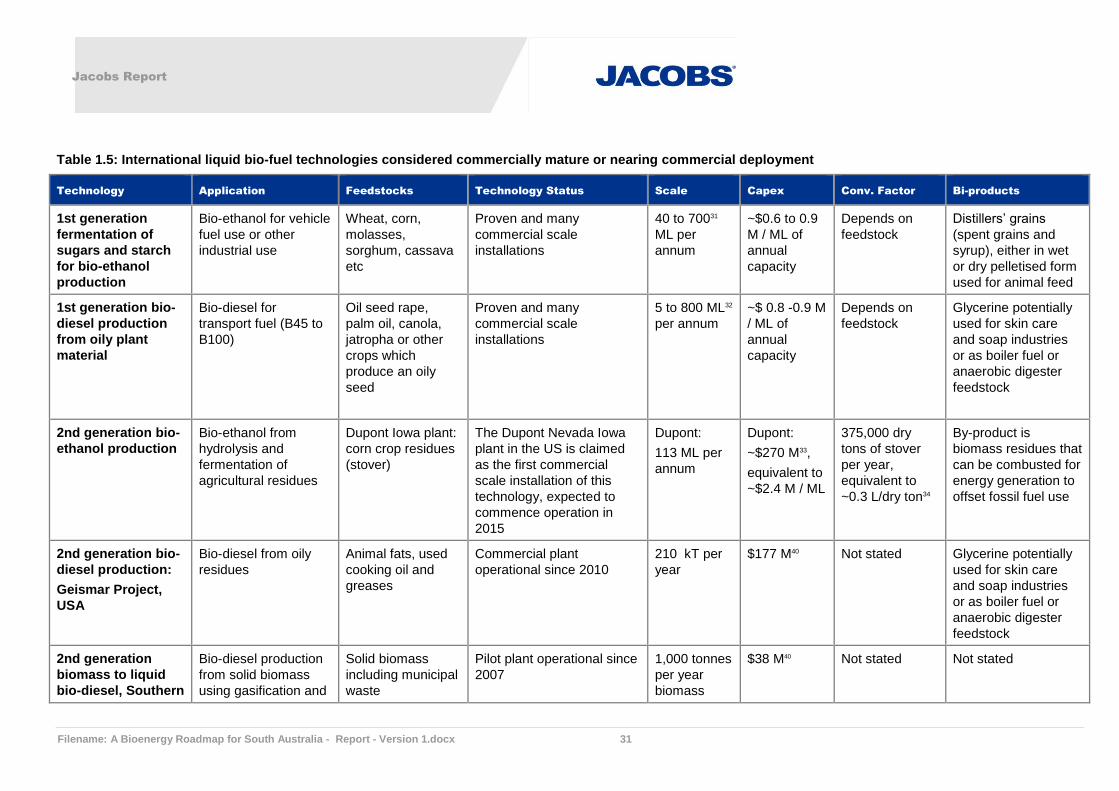
Jacobs Report
Filename: A Bioenergy Roadmap for South Australia - Report - Version 1.docx 31
Table 1.5: International liquid bio-fuel technologies considered commercially mature or nearing commercial deployment
Technology Application Feedstocks Technology Status Scale Capex Conv. Factor Bi-products
1st generation
fermentation of
sugars and starch
for bio-ethanol
production
Bio-ethanol for vehicle
fuel use or other
industrial use
Wheat, corn,
molasses,
sorghum, cassava
etc
Proven and many
commercial scale
installations
40 to 70031
ML per
annum
~$0.6 to 0.9
M / ML of
annual
capacity
Depends on
feedstock
Distillers’ grains
(spent grains and
syrup), either in wet
or dry pelletised form
used for animal feed
1st generation bio-
diesel production
from oily plant
material
Bio-diesel for
transport fuel (B45 to
B100)
Oil seed rape,
palm oil, canola,
jatropha or other
crops which
produce an oily
seed
Proven and many
commercial scale
installations
5 to 800 ML32
per annum
~$ 0.8 -0.9 M
/ ML of
annual
capacity
Depends on
feedstock
Glycerine potentially
used for skin care
and soap industries
or as boiler fuel or
anaerobic digester
feedstock
2nd generation bio-
ethanol production
Bio-ethanol from
hydrolysis and
fermentation of
agricultural residues
Dupont Iowa plant:
corn crop residues
(stover)
The Dupont Nevada Iowa
plant in the US is claimed
as the first commercial
scale installation of this
technology, expected to
commence operation in
2015
Dupont:
113 ML per
annum
Dupont:
~$270 M33,
equivalent to
~$2.4 M / ML
375,000 dry
tons of stover
per year,
equivalent to
~0.3 L/dry ton34
By-product is
biomass residues that
can be combusted for
energy generation to
offset fossil fuel use
2nd generation bio-
diesel production:
Geismar Project,
USA
Bio-diesel from oily
residues
Animal fats, used
cooking oil and
greases
Commercial plant
operational since 2010
210 kT per
year
$177 M40 Not stated Glycerine potentially
used for skin care
and soap industries
or as boiler fuel or
anaerobic digester
feedstock
2nd generation
biomass to liquid
bio-diesel, Southern
Bio-diesel production
from solid biomass
using gasification and
Solid biomass
including municipal
waste
Pilot plant operational since
2007
1,000 tonnes
per year
biomass
$38 M40 Not stated Not stated
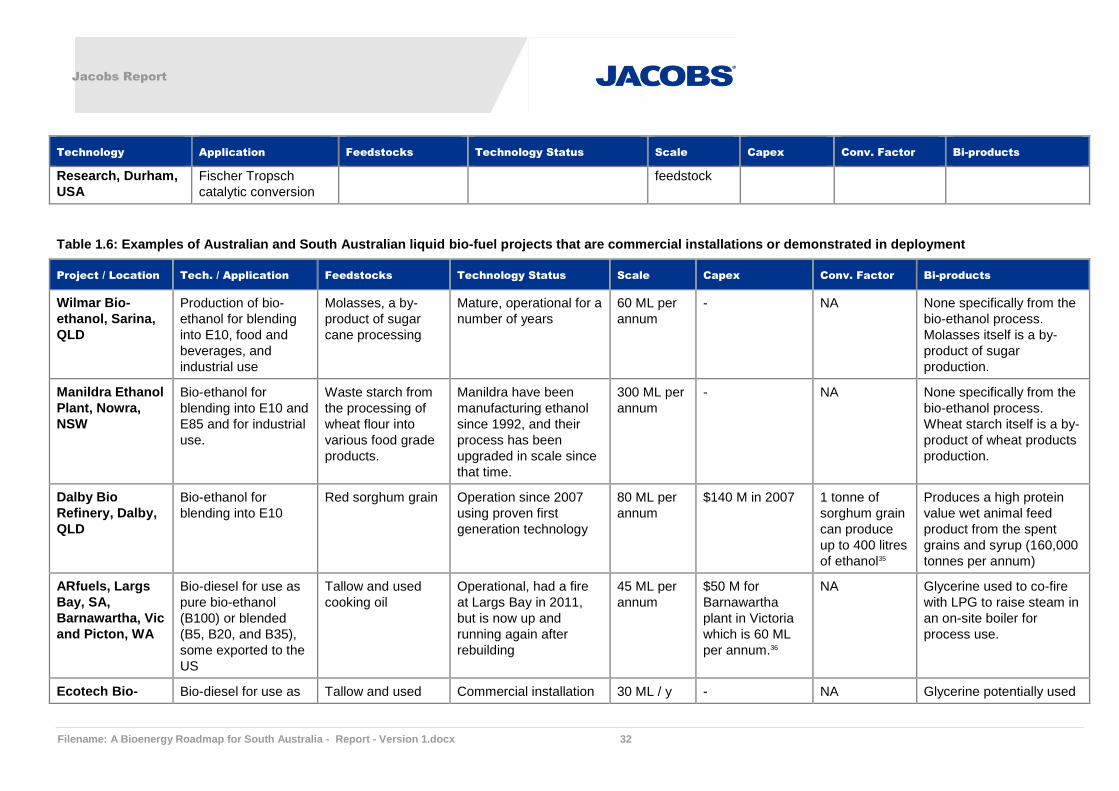
Jacobs Report
Filename: A Bioenergy Roadmap for South Australia - Report - Version 1.docx 32
Technology Application Feedstocks Technology Status Scale Capex Conv. Factor Bi-products
Research, Durham,
USA
Fischer Tropsch
catalytic conversion
feedstock
Table 1.6: Examples of Australian and South Australian liquid bio-fuel projects that are commercial installations or demonstrated in deployment
Project / Location Tech. / Application Feedstocks Technology Status Scale Capex Conv. Factor Bi-products
Wilmar Bio-
ethanol, Sarina,
QLD
Production of bio-
ethanol for blending
into E10, food and
beverages, and
industrial use
Molasses, a by-
product of sugar
cane processing
Mature, operational for a
number of years
60 ML per
annum
- NA None specifically from the
bio-ethanol process.
Molasses itself is a by-
product of sugar
production.
Manildra Ethanol
Plant, Nowra,
NSW
Bio-ethanol for
blending into E10 and
E85 and for industrial
use.
Waste starch from
the processing of
wheat flour into
various food grade
products.
Manildra have been
manufacturing ethanol
since 1992, and their
process has been
upgraded in scale since
that time.
300 ML per
annum
- NA None specifically from the
bio-ethanol process.
Wheat starch itself is a by-
product of wheat products
production.
Dalby Bio
Refinery, Dalby,
QLD
Bio-ethanol for
blending into E10
Red sorghum grain Operation since 2007
using proven first
generation technology
80 ML per
annum
$140 M in 2007 1 tonne of
sorghum grain
can produce
up to 400 litres
of ethanol35
Produces a high protein
value wet animal feed
product from the spent
grains and syrup (160,000
tonnes per annum)
ARfuels, Largs
Bay, SA,
Barnawartha, Vic
and Picton, WA
Bio-diesel for use as
pure bio-ethanol
(B100) or blended
(B5, B20, and B35),
some exported to the
US
Tallow and used
cooking oil
Operational, had a fire
at Largs Bay in 2011,
but is now up and
running again after
rebuilding
45 ML per
annum
$50 M for
Barnawartha
plant in Victoria
which is 60 ML
per annum.36
NA Glycerine used to co-fire
with LPG to raise steam in
an on-site boiler for
process use.
Ecotech Bio- Bio-diesel for use as Tallow and used Commercial installation 30 ML / y - NA Glycerine potentially used

Jacobs Report
Filename: A Bioenergy Roadmap for South Australia - Report - Version 1.docx 33
Project / Location Tech. / Application Feedstocks Technology Status Scale Capex Conv. Factor Bi-products
diesel,
Narangba, QLD
pure bio-ethanol
(B100) or blended
(B5 and B20)
cooking oil operational since 2006 for skin care and soap
industries or as anaerobic
digester feedstock37
Ecofuels
Australia,
Echuca, Vic
Bio-diesel for vehicle
use on farms
Canola Commercial
demonstration facility
operational since 2013
1.5 ML / y $1.76 M38 NA 40,000 tonnes of animal
feed. Other wastes may
be fed to an anaerobic
digester to produce bio-
gas energy
Ethanol
Technologies
Ltd, Harwood,
NSW
Bio-ethanol from
cellulosic feedstocks
employing an acid
hydrolysis stage39
Bagasse and wood Pilot plant, not a
commercial installation
Unknown - NA Spent biomass residues
are proposed to be
combusted in the on-site
sugar mill bagasse boiler
to generate heat and
power for site use
Licella,
Somersby, NSW
Bio-crude production
via catalytic thermal
hydrolysis of solid
biomass using steam
under supercritical
pressure
Pine sawdust
(sawmill residue)
and other solid
biomass including
banana grass and
algae
Pilot plant successfully
demonstrated in 2012,
demonstration plant in
progress
350 tpa
product
$10 M40 1000 oven dry
tonnes of
feedstock per
annum.
Equivalent to
~ 0.35 kg oil /
kg dry
feedstock
By-products not stated
Aurora Algae,
Karratha, WA
Production of algae
for various uses
including as a
potential bio-fuel
feedstock
Micro algae
production from
sunlight and
atmospheric carbon
dioxide in saline
water
Pilot demonstration
project operated for 3
years, now closed
Up to 15
tonnes of
dry
biomass
per month
- - Omega 3s for
pharmaceuticals, health
foods, beverages and fish
feed
Muradel,
Whyalla, SA41
Growing, harvesting
and converting algae
Halophytic
microalgae
Pilot plant started
operating in October
30,000 L / y $10.7 M

Jacobs Report
Filename: A Bioenergy Roadmap for South Australia - Report - Version 1.docx 34
Project / Location Tech. / Application Feedstocks Technology Status Scale Capex Conv. Factor Bi-products
to fuel or chemical
feedstocks
2014
Qantas/Shell,
Sydney, NSW42
Jet fuel production
from sustainable
sources either via the
waste to fuel process
(Fischer-Tropsch), or,
by the natural oils to
fuel path
MSW for the waste
to fuel pathway or
oilseed producing
crops or tallow for
the natural oil to
fuel pathway
50:50 blend of
sustainable aviation fuel
/ crude oil based
aviation fuel
successfully trialled on
commercial flights,
feasibility study
completed
- - - Naphtha, gas, bio-diesel
Jacobs Report
Filename: A Bioenergy Roadmap for South Australia - Report - Version 1.docx 35
1.5 Global Bio-energy Landscape
Bio-energy is moving forward fast in many parts of the world. The rapid deployment of sustainable biomass for
energy is a key challenge within the global climate and energy policy areas.
Bio-energy technology is generally well established globally, and there are numerous ways of converting
biomass into bio-energy on a commercial basis. These are ‘mature’ technologies. Additionally, new forms of
technology are being investigated that may make better use of ‘residue’ materials from agricultural and forestry
processes. These second generation technologies are now progressing through pilot phases and may present
opportunities for Australian businesses. These are generally known as ‘emerging’ technologies. Some of the
mature technologies have not reached their resource potential due to cost and commercial barriers. In that
sense they are technologically mature but commercially borderline or emerging.
1.6 Australian and South Australian Bio-energy Landscape
Bio-energy in Australia and South Australia can be viewed favourably due to:
The increases in local energy costs (electricity and gas).
Changes in climatic conditions presenting land otherwise used for productive agriculture.
Increases in weed composition within the landscape.
Costs associated with dumping of agricultural wastes.
Growth performance of agricultural crops providing opportunity straw harvest after the food crop has been
harvested.
Localised energy demands close to waste streams.
Existing support through bio-energy industry leadership .There are a number of challenges that beset the
smaller scale, higher cost projects such as:
The absence of an adequate carbon price signal that is commensurate with the risk of adverse climate
change impacts is the fundamental reason why an optimal level of bio-energy is not currently achievable.
The low price for Renewable Energy Certificates (RECs) and spot energy is a strong disincentive for the
development of new projects.
Regulatory gaps affecting eligibility and accreditation such as within the definitions of categories of fuels
which may qualify as renewable energy.
The high cost of arranging connection to the distribution system through project specific negotiation makes
smaller projects non-viable.
The lack of general information on the value of embedded generation to the network and the cost of
connection make it costly to screen projects for viable options and to optimise project location.
The lack of an effective process to co-ordinate many small projects in an area to justify a scale efficient
network extension at the distribution level is similar to the same problem at the transmission level which is
being addressed by the Australian Energy Markets Commission.
Community support for local bio-energy projects can be difficult to sustain despite the benefits of local
employment and security of electricity supply.
1.6.1 South Australian Bio-energy Political Landscape
In its Economic Statement of March 2009, the SA Economic Development Board (EDB) identified renewable
energy as an important industry for South Australia’s economic future and recommended strategies to promote
technological innovation across a diverse range of technologies, the development of fast track demonstration
plants, the minimisation of regulatory impediments and the securing of industry investment. Given current
Jacobs Report
Filename: A Bioenergy Roadmap for South Australia - Report - Version 1.docx 36
performance in renewable energy, the State is well placed to establish itself as the nation’s leader in clean
energy production and usage.
In 2009 the SA Government developed a renewable energy target of 33% by 2020 which was achieved in 2013
14. Most of this was a achieved via the adoption of solar and wind technologies.
Policies assisting the target included:
Establishing Australians most streamlined planning framework for wind investors
Introduction of Australia's first only payroll tax rebate scheme for wind investors
Providing rebates and other financial assistance to the solar industry
In 2014 a renewable energy target of 50% by 2025 was set subject to a national renewable energy policy being
retained.
Although part of the Government’s planning considerations for other forms of energy, bio-energy has not yet
been afforded the same opportunities as wind and solar. Bio-energy is featured in the State Development Plan’s
renewables section; however it is rarely present in council development plans. Bio-energy is not covered by the
Office of the Technical Regulator at this stage.
Jacobs Report
Filename: A Bioenergy Roadmap for South Australia - Report - Version 1.docx 37
2. Bio-energy Material Sources in South Australia
2.1 Relevant Materials
Feedstocks in SA can be grouped as noted in Table 2.1 below.
Table 2.1: Feedstock groupings
Feedstock Constituents
Agricultural Waste Livestock manure
Abattoir waste solids
Other processing plants
Crop and food residues from
harvesting and processing
Horticultural Waste Vegetables & fruit
Shells, pips, trees
Energy Crops Canola
Planted Mallee
Woody Weeds
Planted fast growing crops
(annual and perennial)
Algae
Forest Residues Plantation forests
Saw mills residues
Manufactured wood plant
residues
Municipal Waste Green organics, paper,
Timber
Processed food
2.1.1 Existing Feedstocks
Animal Waste
Bioenergy potential exists with animal wastes from pig and dairy farming. These sources are generally high
quality for anaerobic digestion processes. Other animal waste includes feed lots and potentially shearing
sheds.
Animal waste is suitable for anaerobic digestion and is usually available as disposal can be a problematic for
the farmer. Waste from milking sheds quite often requires permits to enable it to be irrigated to land. Processing
the waste into energy can assist to deal with other environmental issues associated with the waste stream.
Animal waste is usually a very liquid waste with transport away from site to a central energy producing source
expensive.
Refer to Figure 2.1 for a picture of a dairy shed effluent pond.

Jacobs Report
Filename: A Bioenergy Roadmap for South Australia - Report - Version 1.docx 38
Figure 2.1: Dairy shed waste pond
Chicken Litter
In past years chicken shed litter (straw or sawdust, feathers and chicken excretion) has been taken away at no
or little charge and provided to primary producers as a soil conditioner or poor quality fertiliser.
Most producers are now charged to remove their litter and because of the composition of the litter past
recipients of the litter find it difficult to spread over their paddocks. The chicken industry continues to expand
however disposal of the waste stream is now costly.
It is possible to produce reasonable amounts of energy from chicken litter. However transport away from site to
a central energy producing source could become expensive. Chicken litter can be combusted or used in
anaerobic digestion after addition of water.
Refer to Figure 2.2 for a picture of chicken litter.

Jacobs Report
Filename: A Bioenergy Roadmap for South Australia - Report - Version 1.docx 39
Figure 2.2: Chicken litter
Horticultural Waste
Horticultural waste streams include end of growth materials from glasshouses, open paddock vegetable crops,
fruit and nut crops and from tree and vine renewals. The waste stream is available for collection from all areas
involved in horticultural activities. Collection of the waste would need to be well coordinated.
Figure 2.3: Waste from vineyard and other fruit tree renewal in the Barossa Valley, SA

Jacobs Report
Filename: A Bioenergy Roadmap for South Australia - Report - Version 1.docx 40
Crop Stubble
Crop stubbles are available after initial harvest of grains from varieties of wheat and barley and are seen as a
waste product from cropping programs. These stubbles may also be used for export orders making them
unavailable. Removal of straw may reduce soil structure improvement attempts requiring additional fertilisers to
be applied to grow the next crop. A reduction in stubble could also increase wind erosion of soil and accelerate
moisture loss.
Baled straw ready for export is shown in
Figure 2:4
Figure 2:4: Stubble straw bales off to export, Kapunda, SA 2015
Forestry Waste
Forestry waste has two main streams:
Trimmings (branches) left behind on the forests floor at the time of harvest
Timber waste (bark and sawdust) from the saw milling processes.
Forestry waste is available for collection in all forestry areas; however it may be located in difficult to collect
areas. There may be resistance to harvest as removal ultimately prevents nutrients returning to the soil.
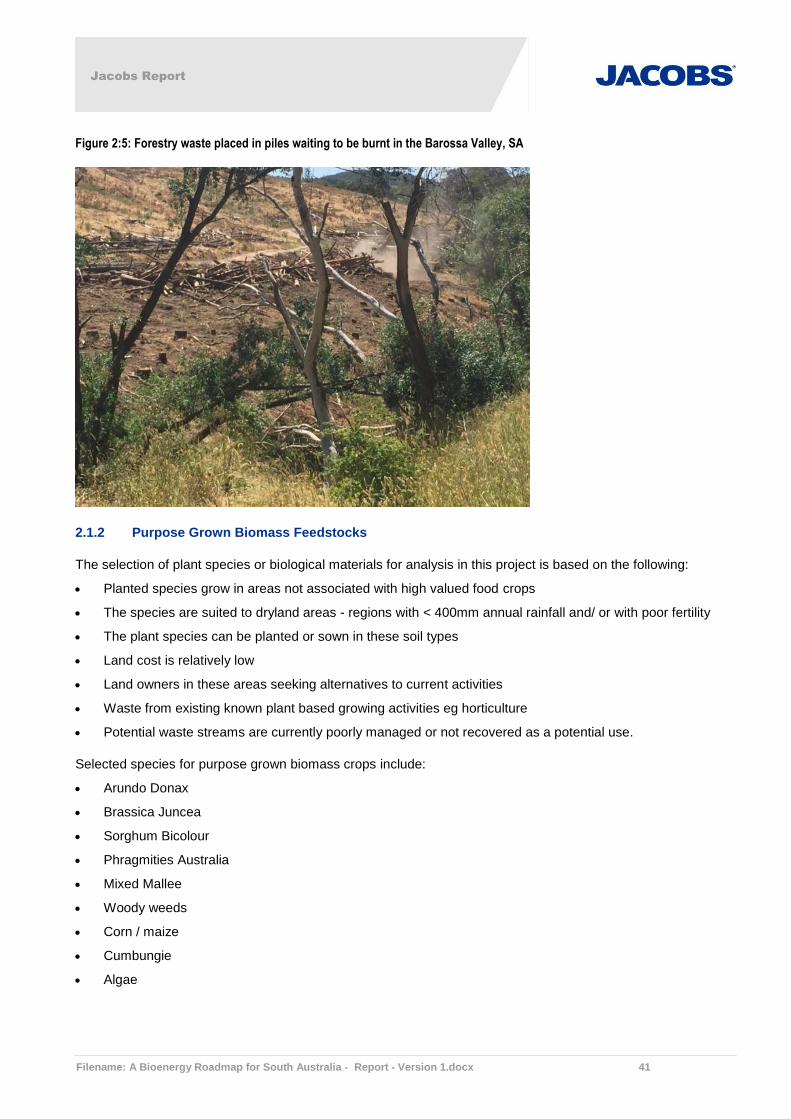
Jacobs Report
Filename: A Bioenergy Roadmap for South Australia - Report - Version 1.docx 41
Figure 2:5: Forestry waste placed in piles waiting to be burnt in the Barossa Valley, SA
2.1.2 Purpose Grown Biomass Feedstocks
The selection of plant species or biological materials for analysis in this project is based on the following:
Planted species grow in areas not associated with high valued food crops
The species are suited to dryland areas - regions with < 400mm annual rainfall and/ or with poor fertility
The plant species can be planted or sown in these soil types
Land cost is relatively low
Land owners in these areas seeking alternatives to current activities
Waste from existing known plant based growing activities eg horticulture
Potential waste streams are currently poorly managed or not recovered as a potential use.
Selected species for purpose grown biomass crops include:
Arundo Donax
Brassica Juncea
Sorghum Bicolour
Phragmities Australia
Mixed Mallee
Woody weeds
Corn / maize
Cumbungie
Algae

Jacobs Report
Filename: A Bioenergy Roadmap for South Australia - Report - Version 1.docx 42
Arundo Donax
Arundo Donax (giant reed) is a rhizomatous grass widely found in temperate and subtropical regions. It was
planted in the 1920 - 50's in SA because of its capacity to grow vigorously in marginal land to assist with the
control of sand dune erosion and to provide tomato stakes for the horticultural industry. Many examples remain
today.
Arundo Donax can be a medium biomass production crop on marginal lands and a high biomass producer with
additional water. Arundo Donax is a perennial plant which can be harvested two times per year. It has low
fertility needs, however will respond to nitrogen fertilisers as required. Arundo Donax is a sterile plant and its
propagation is based on vegetative propagation (rhizomes or canes) and in vitro culture, making establishing
the crop more expensive than a seeded crop.
Refer to Figure 2:6 and Figure 2:7 for photos of Arundo Donax growing in SA.
Figure 2:6: Arundo Donax growing in 270mm rainfall region in the Mallee area of SA

Jacobs Report
Filename: A Bioenergy Roadmap for South Australia - Report - Version 1.docx 43
Figure 2:7 : Arundo Donax growing in 350 mm rainfall coastal area of the Yorke Peninsula
Brassica Juncea
Brassica Juncea (Indian mustard), a close relative of canola (Brassica Napus) however it is more drought and
heat tolerant and therefore an alternative oilseed to canola for the low rainfall zones in South Australia. Brassica
Juncea is very tolerant of dry and climate variable conditions; however is not yet a mainstream dryland cropping
plant. Refer to Figure 2:8 for a photo of Brassica Juncea in flower.

Jacobs Report
Filename: A Bioenergy Roadmap for South Australia - Report - Version 1.docx 44
Figure 2:8: Brassica Juncea in flower
Sorghum Bicolour
Sorghum Bicolour (sweet sorghum) is receiving significant global interest because of its potential as a multi-
product crop, however there has been minimal research under Australian growing conditions. Under favourable
growing conditions, Sorghum can produce high biomass yields with low rates of nitrogen fertilizer. Growth can
be exceptional growth under the correct moisture and temperature conditions. More trials are required to
understand varieties and opportunities in Australia.
Refer to Figure 2:9 for an example of Sorghum growing in SA.
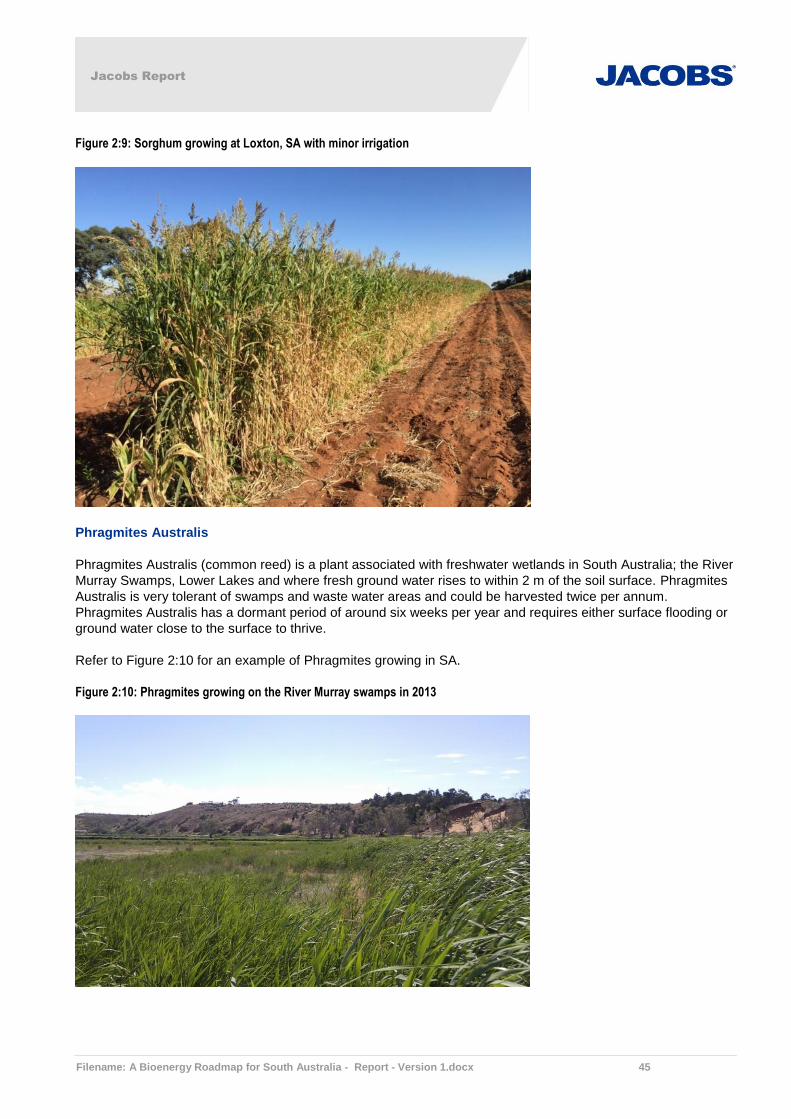
Jacobs Report
Filename: A Bioenergy Roadmap for South Australia - Report - Version 1.docx 45
Figure 2:9: Sorghum growing at Loxton, SA with minor irrigation
Phragmites Australis
Phragmites Australis (common reed) is a plant associated with freshwater wetlands in South Australia; the River
Murray Swamps, Lower Lakes and where fresh ground water rises to within 2 m of the soil surface. Phragmites
Australis is very tolerant of swamps and waste water areas and could be harvested twice per annum.
Phragmites Australis has a dormant period of around six weeks per year and requires either surface flooding or
ground water close to the surface to thrive.
Refer to Figure 2:10 for an example of Phragmites growing in SA.
Figure 2:10: Phragmites growing on the River Murray swamps in 2013
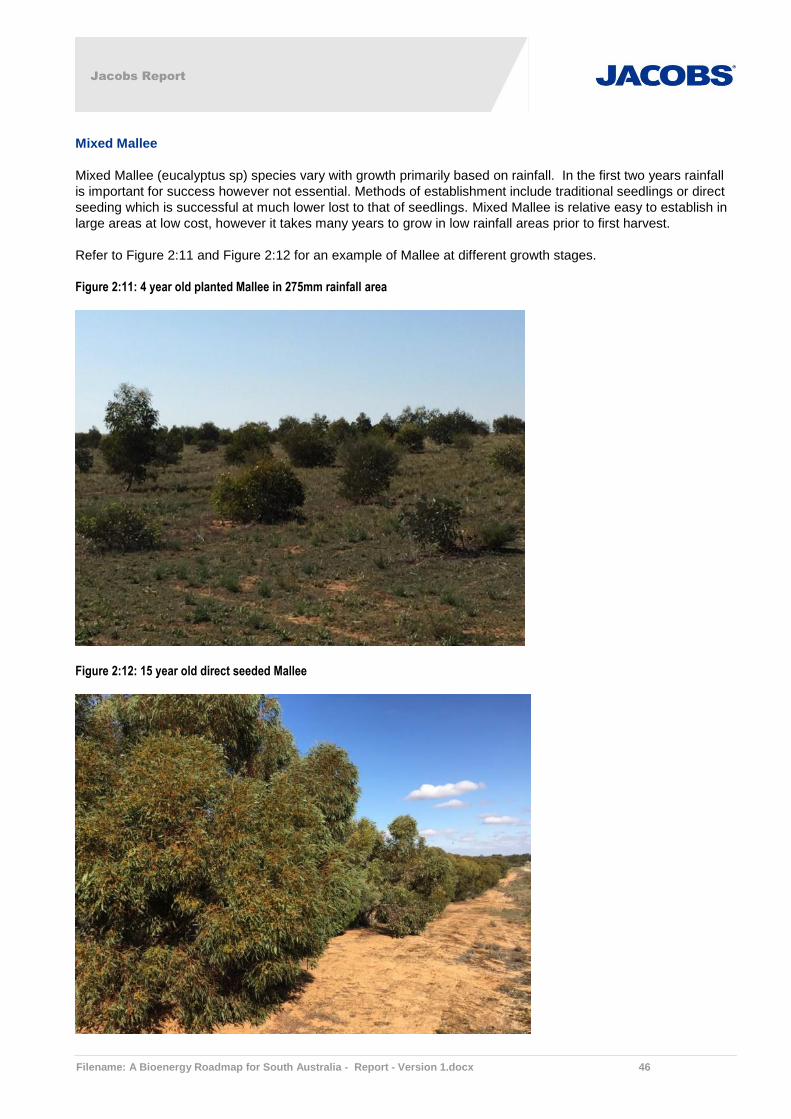
Jacobs Report
Filename: A Bioenergy Roadmap for South Australia - Report - Version 1.docx 46
Mixed Mallee
Mixed Mallee (eucalyptus sp) species vary with growth primarily based on rainfall. In the first two years rainfall
is important for success however not essential. Methods of establishment include traditional seedlings or direct
seeding which is successful at much lower lost to that of seedlings. Mixed Mallee is relative easy to establish in
large areas at low cost, however it takes many years to grow in low rainfall areas prior to first harvest.
Refer to Figure 2:11 and Figure 2:12 for an example of Mallee at different growth stages.
Figure 2:11: 4 year old planted Mallee in 275mm rainfall area
Figure 2:12: 15 year old direct seeded Mallee

Jacobs Report
Filename: A Bioenergy Roadmap for South Australia - Report - Version 1.docx 47
Woody Weeds
Woody weeds are plants (trees and shrubs) that have become problems species causing an impact to
catchments, native vegetation areas, government and private land. Woody weeds include Aleppo pines, Olives,
Pittosporum and Acacia. Many thousands of dollars are spent burning these weeds to control spread of these
weeds every year. The weeds may be found in areas that are difficult to harvest.
Pines and olives actively growing in the Adelaide Hills are shown in Figure 2:13.
Figure 2:13: Pines and Olives smothering landscapes in the Adelaide Hills
2.2 Quantities and Geographical Origins
Jacobs has undertaken GIS mapping of the existing bio-energy feedstocks and purpose grown biomass. Key
input information included in the maps is (depending on the particular product):
Stock numbers from Primary Industries Information Management System (PIIMS) database
PIRSA statewide land use classification
Generalised land use
Soil types
Rainfall
Various industries that could contribute feedstocks such as chicken growers, dairy milking sheds, feedlots,
meat processing plants, horticulture, crops and the like
Land parcels
The information sources that have been used are referenced in Appendix B.1. The sources are generally
government departments such as PIRSA, DMITRE, BOM, SARIG and the like.
Quantities of feedstocks have been calculated subject to feedstock type by either:
Known areas with that feedstock multiplied by typical yields per area for that particular area, or,
Known stocks numbers multiplied by feedstock yield per animal for that animal.
The quantities have then been multiplied by the calorific value of the particular feedstock to determine the
potential energy yield.

Jacobs Report
Filename: A Bioenergy Roadmap for South Australia - Report - Version 1.docx 48
Summaries by feedstock grouping (slurries cf biomass) are shown in Figure 2.14 and Figure 2.15. The locations
and quantities of the existing biomass energy sources are shown in Figure 2.16 for all feedstocks.

Jacobs Report
Filename: A Bioenergy Roadmap for South Australia - Report - Version 1.docx 49
Figure 2.14: Summary of existing slurry type feedstocks by location

Jacobs Report
Filename: A Bioenergy Roadmap for South Australia - Report - Version 1.docx 50
Figure 2.15: Summary of existing biomass type feedstocks by location
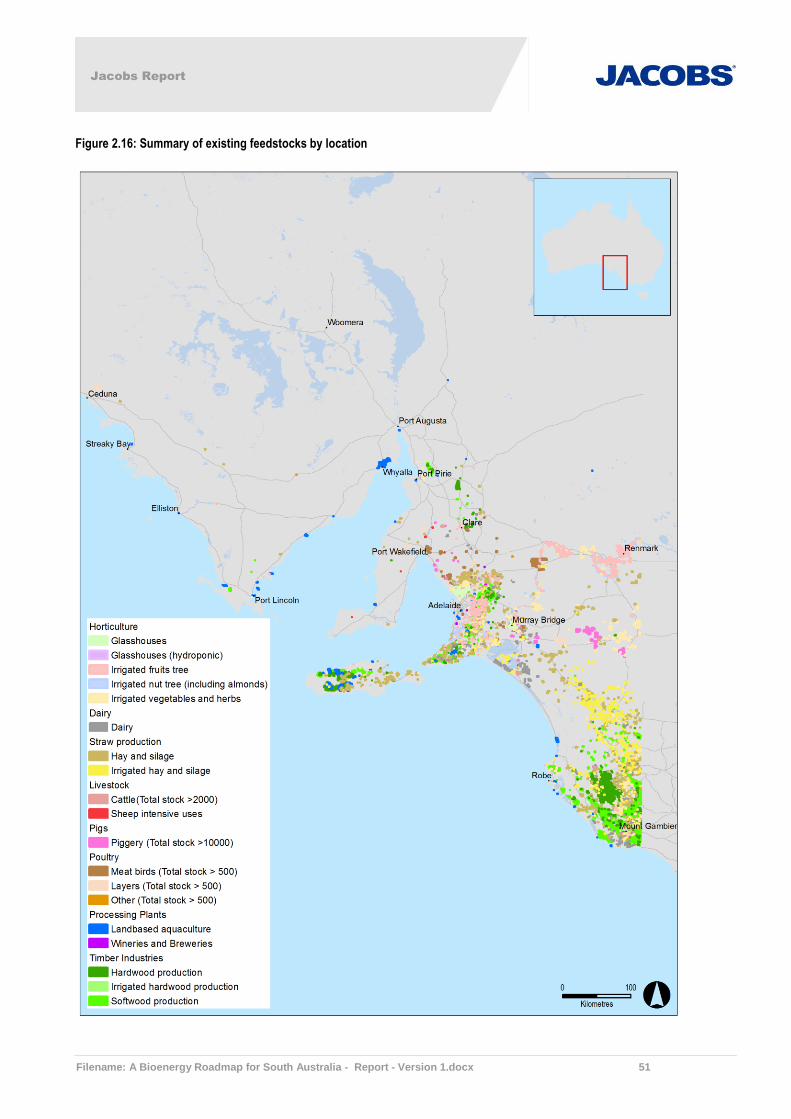
Jacobs Report
Filename: A Bioenergy Roadmap for South Australia - Report - Version 1.docx 51
Figure 2.16: Summary of existing feedstocks by location

Jacobs Report
Filename: A Bioenergy Roadmap for South Australia - Report - Version 1.docx 52
Expected quantities and calorific values for the existing feedstocks are shown in Table 2.2. The calorific values
stated are at the moisture content stated in the table.
Table 2.2: Existing bio-energy materials
Material Actual Tonnes (t) /
Volume (m3) or
No.s
Calorific Value
(MJ/kg or
MJ/No.)
Moisture
Content (%)
Comment
Timber 984,000 tpa 7.7 50
Poultry 30,310,000
chickens
96 Slurry
Broadacre 154,000 tpa 14 15
Pigs 225,000 pigs 1,580 Slurry
Horticulture 112,500 tpa 10 50
Livestock 15,200 cows 3,240 Slurry
Dairy 88,000 cows 3,240 Slurry
Locations to grow purpose grown biomass crops are summarised in Figure 2.16, Figure 2.17 and Figure 2.18 by
crop and location.

Jacobs Report
Filename: A Bioenergy Roadmap for South Australia - Report - Version 1.docx 53
Figure 2.16: Summary of potential growing areas for Algae, Arundo Donax and Corn / Maize
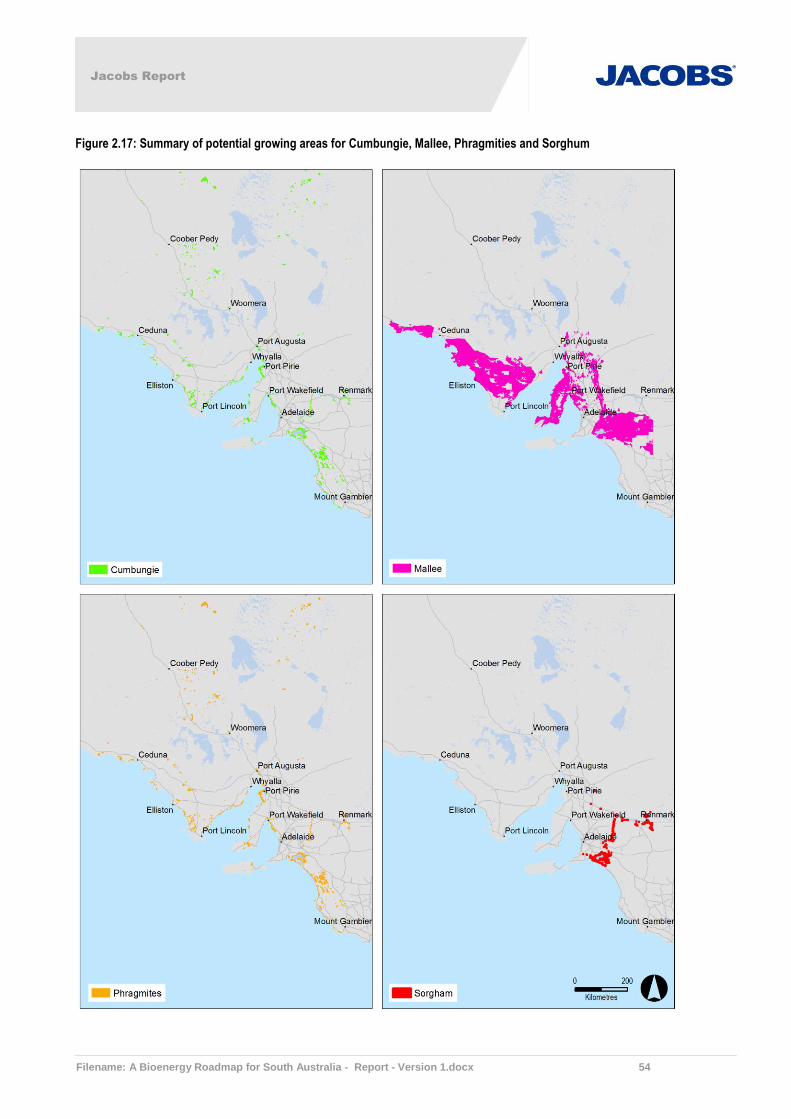
Jacobs Report
Filename: A Bioenergy Roadmap for South Australia - Report - Version 1.docx 54
Figure 2.17: Summary of potential growing areas for Cumbungie, Mallee, Phragmities and Sorghum
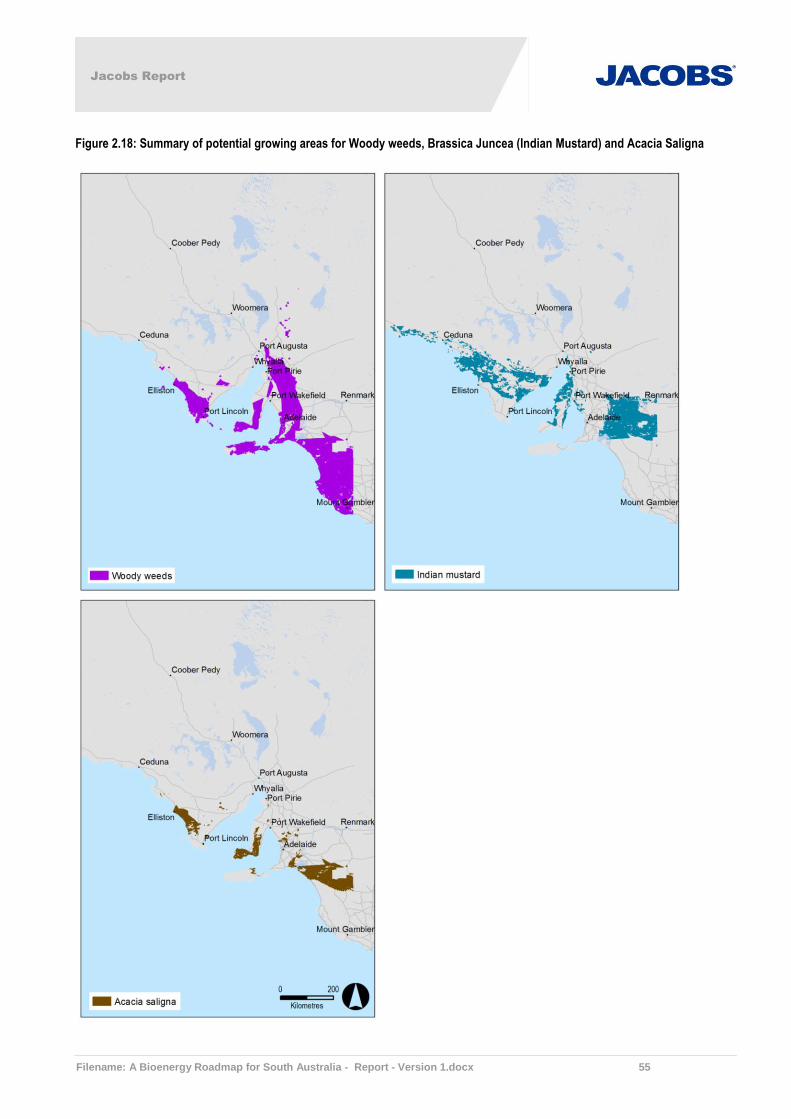
Jacobs Report
Filename: A Bioenergy Roadmap for South Australia - Report - Version 1.docx 55
Figure 2.18: Summary of potential growing areas for Woody weeds, Brassica Juncea (Indian Mustard) and Acacia Saligna
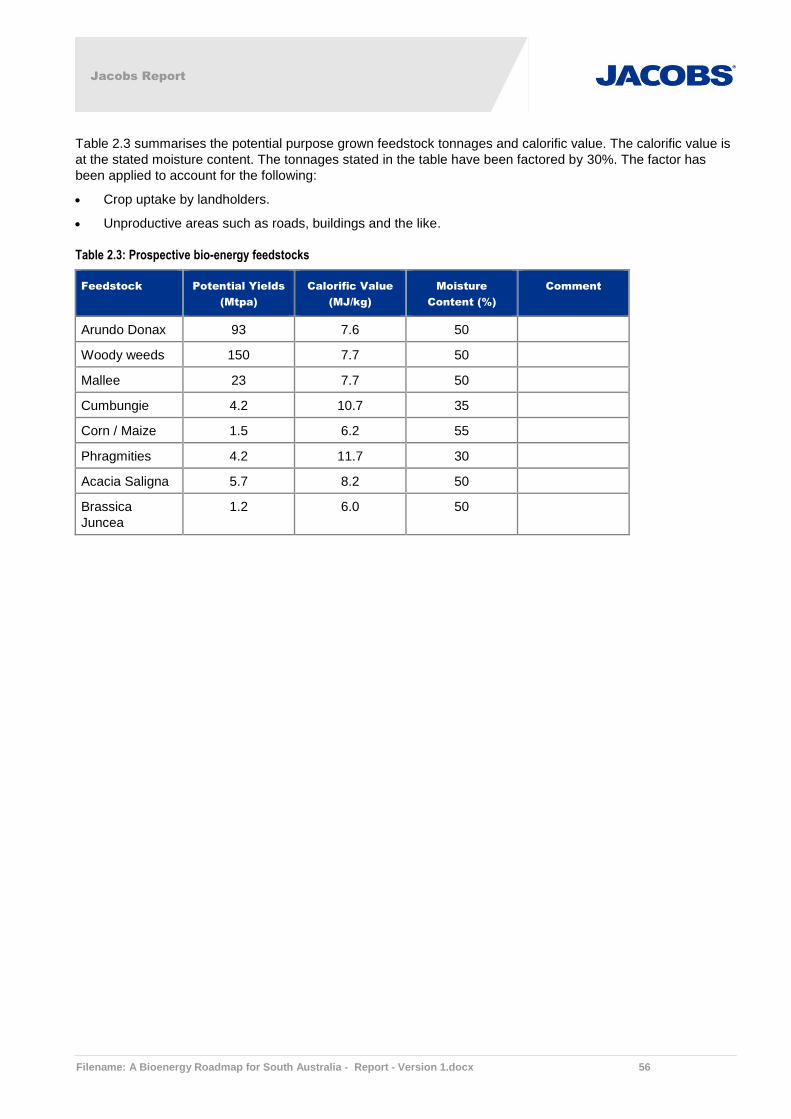
Jacobs Report
Filename: A Bioenergy Roadmap for South Australia - Report - Version 1.docx 56
Table 2.3 summarises the potential purpose grown feedstock tonnages and calorific value. The calorific value is
at the stated moisture content. The tonnages stated in the table have been factored by 30%. The factor has
been applied to account for the following:
Crop uptake by landholders.
Unproductive areas such as roads, buildings and the like.
Table 2.3: Prospective bio-energy feedstocks
Feedstock Potential Yields
(Mtpa)
Calorific Value
(MJ/kg)
Moisture
Content (%)
Comment
Arundo Donax 93 7.6 50
Woody weeds 150 7.7 50
Mallee 23 7.7 50
Cumbungie 4.2 10.7 35
Corn / Maize 1.5 6.2 55
Phragmities 4.2 11.7 30
Acacia Saligna 5.7 8.2 50
Brassica
Juncea
1.2 6.0 50
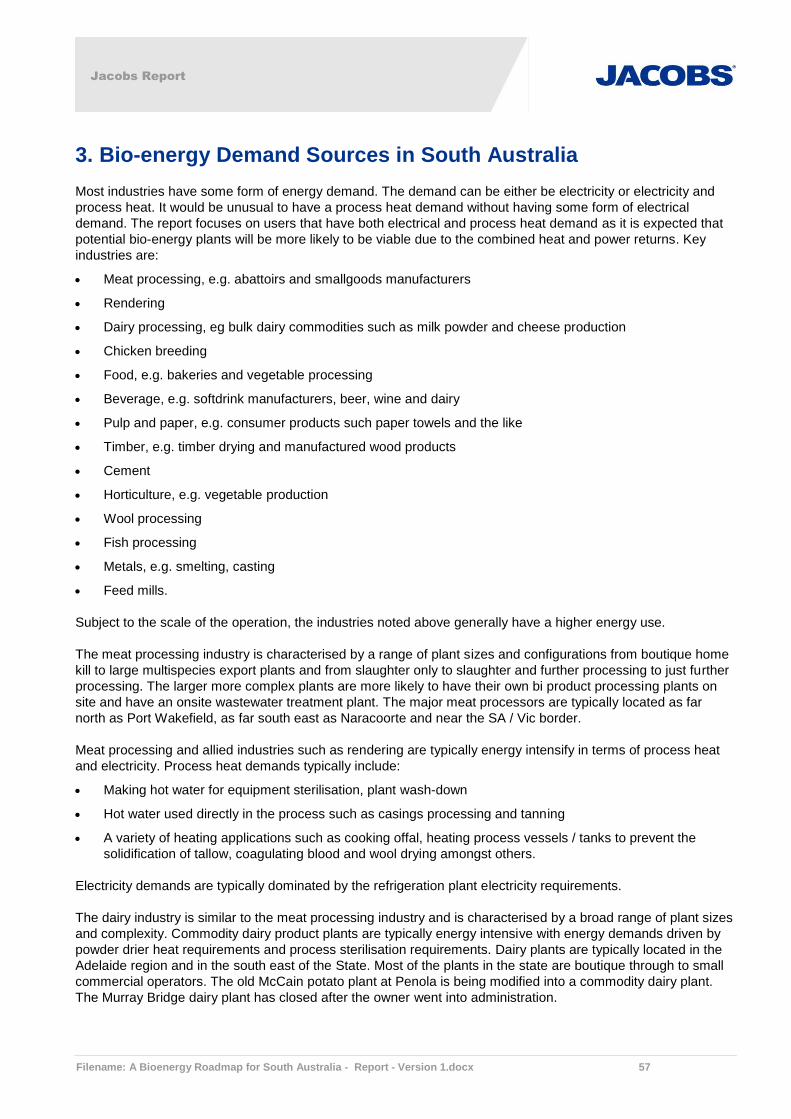
Jacobs Report
Filename: A Bioenergy Roadmap for South Australia - Report - Version 1.docx 57
3. Bio-energy Demand Sources in South Australia
Most industries have some form of energy demand. The demand can be either be electricity or electricity and
process heat. It would be unusual to have a process heat demand without having some form of electrical
demand. The report focuses on users that have both electrical and process heat demand as it is expected that
potential bio-energy plants will be more likely to be viable due to the combined heat and power returns. Key
industries are:
Meat processing, e.g. abattoirs and smallgoods manufacturers
Rendering
Dairy processing, eg bulk dairy commodities such as milk powder and cheese production
Chicken breeding
Food, e.g. bakeries and vegetable processing
Beverage, e.g. softdrink manufacturers, beer, wine and dairy
Pulp and paper, e.g. consumer products such paper towels and the like
Timber, e.g. timber drying and manufactured wood products
Cement
Horticulture, e.g. vegetable production
Wool processing
Fish processing
Metals, e.g. smelting, casting
Feed mills.
Subject to the scale of the operation, the industries noted above generally have a higher energy use.
The meat processing industry is characterised by a range of plant sizes and configurations from boutique home
kill to large multispecies export plants and from slaughter only to slaughter and further processing to just further
processing. The larger more complex plants are more likely to have their own bi product processing plants on
site and have an onsite wastewater treatment plant. The major meat processors are typically located as far
north as Port Wakefield, as far south east as Naracoorte and near the SA / Vic border.
Meat processing and allied industries such as rendering are typically energy intensify in terms of process heat
and electricity. Process heat demands typically include:
Making hot water for equipment sterilisation, plant wash-down
Hot water used directly in the process such as casings processing and tanning
A variety of heating applications such as cooking offal, heating process vessels / tanks to prevent the
solidification of tallow, coagulating blood and wool drying amongst others.
Electricity demands are typically dominated by the refrigeration plant electricity requirements.
The dairy industry is similar to the meat processing industry and is characterised by a broad range of plant sizes
and complexity. Commodity dairy product plants are typically energy intensive with energy demands driven by
powder drier heat requirements and process sterilisation requirements. Dairy plants are typically located in the
Adelaide region and in the south east of the State. Most of the plants in the state are boutique through to small
commercial operators. The old McCain potato plant at Penola is being modified into a commodity dairy plant.
The Murray Bridge dairy plant has closed after the owner went into administration.

Jacobs Report
Filename: A Bioenergy Roadmap for South Australia - Report - Version 1.docx 58
Chicken growers are typically located around the broader Adelaide region ranging from Tailem Bend through to
Port Wakefield. Chicken growers typically heat and ventilate their sheds and therefore have both gas and
electricity requirements. Chicken processing is typically located in the Northern Adelaide commercial suburbs.
Chicken processing energy demands are similar in nature to meat processing energy demands.
The State’s food processing industry appears to be dominated by niche to small plants with fewer large
commercial operators. The larger operators are represented by the likes of Arnotts, Tip Top Bakeries and
Quality Bakers. Food processor energy demands are similar in nature to meat and dairy plants, i.e, there are
process heat requirements and electrical demands. Bakeries are less likely to have major electrical loads such
as refrigeration. The state’s major bakeries are generally located in suburban Adelaide.
The State has quite a number of beverage manufacturers. The beverage sector manufacturers wine, beer,
cider, soft drinks, bottled water, flavoured milk and juice. The manufacturers range from the small niche
producers to large commercial operators. The larger commercial operators are represented by the likes of
Coopers, Lionco (Westend and National Foods), Coca Cola Amatil, Wolf Blass and Jacobs Creek. The
manufacturers are typically in the broader Adelaide area with the wineries having the greatest geographic
spread across the Barossa Valley, Clare Valley, McLaren Vale and the Riverlands. The beverage production
sites have both process heat and refrigeration requirements to a greater or lesser degree subject to the sector.
For example, breweries require process heat for fermentation, pasteurisation and equipment cleaning, however
they are unlikely to have major refrigeration loads whereas flavoured milk manufacturers will.
Fish processing in the State is largely centred around Port Lincoln and Adelaide and involves catching,
distribution and further processing. Fish processors process heat and electrical demands are similar in nature to
the meat industry, i.e., heat is required for cooking, and equipment wash-down, and electricity is required for
refrigeration with significant energy going into ice production for the fresh fish distribution.
SA has one commercial scale wool scour (Michell Wool) based in suburban Adelaide. The scouring requires
process heat and electricity to remove the grease and other contaminates from the wool prior to the wool being
further processed for use.
The State’s horticulture industry, in particular glasshouse vegetable and fruit production and mushroom growing
use both process heat and electricity at different times of the year. Process heat and electricity is required to
maintain optimum growing conditions such as temperature and humidity during the summer and winter months.
The glasshouse horticultural areas are typically located around Virginia and in the Riverland area.
SA has one cement manufacturing company (Adelaide Brighton Cement) with sites located in Adelaide and
Angaston. The cement manufacturing process uses both process heat and electricity. The cement manufacturer
kilns already use a process engineered waste for heating.
The State’s metals processing industry includes a range of sectors and companies. These include Nyrstar’s
lead smelter / refinery at Port Pirie, BHPB’s Olympic Dam near Roxby Downs, Adchem’s copper concentrate
plant at Burra and Intercast’s foundry in Adelaide. The metal processing industry requires heat for their various
process and often large amounts of electricity to drive grinding mills and the like.
The pulp and paper sector comprises of one plant (Kimberly Clark) located in the south east of the state. The
plant manufacturers’ paper based consumer products such as paper towels, nappies, toilet tissue, incontinence
products and like. The manufacturing processes require both process heat and power as evidenced by the
recent installation of a natural gas fired cogeneration plant (a biomass fired plant was considered but did not
show economic advantage).
The SA timber industry is largely based in the south east of the state with various smaller scale operations
located around Adelaide. The industry comprises of a range of producers from small scale sawmills to larger
production plants. Small scale examples include South East Pine Sales, South East Pine Treatment and
examples of the larger scale operations include Carter Holt Harvey wood products sawmill, particle board and
laminated veneer lumber manufacturing. Process heat is required for timber drying and particle board
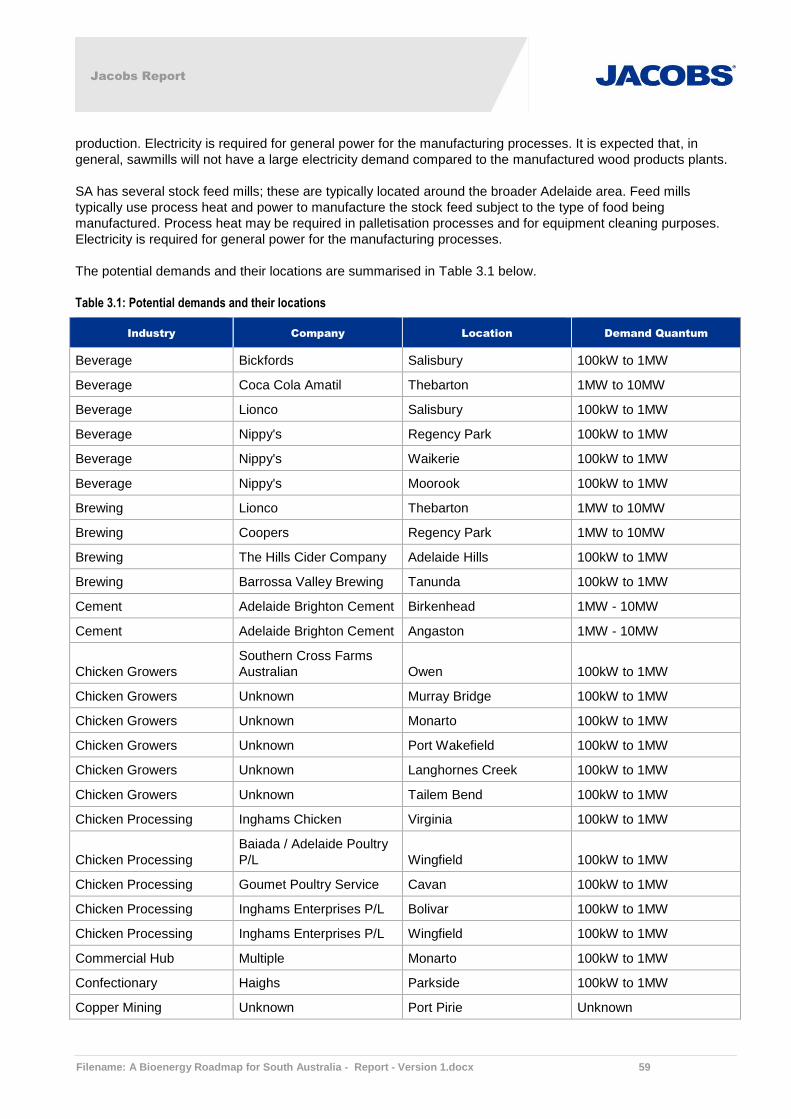
Jacobs Report
Filename: A Bioenergy Roadmap for South Australia - Report - Version 1.docx 59
production. Electricity is required for general power for the manufacturing processes. It is expected that, in
general, sawmills will not have a large electricity demand compared to the manufactured wood products plants.
SA has several stock feed mills; these are typically located around the broader Adelaide area. Feed mills
typically use process heat and power to manufacture the stock feed subject to the type of food being
manufactured. Process heat may be required in palletisation processes and for equipment cleaning purposes.
Electricity is required for general power for the manufacturing processes.
The potential demands and their locations are summarised in Table 3.1 below.
Table 3.1: Potential demands and their locations
Industry Company Location Demand Quantum
Beverage Bickfords Salisbury 100kW to 1MW
Beverage Coca Cola Amatil Thebarton 1MW to 10MW
Beverage Lionco Salisbury 100kW to 1MW
Beverage Nippy's Regency Park 100kW to 1MW
Beverage Nippy's Waikerie 100kW to 1MW
Beverage Nippy's Moorook 100kW to 1MW
Brewing Lionco Thebarton 1MW to 10MW
Brewing Coopers Regency Park 1MW to 10MW
Brewing The Hills Cider Company Adelaide Hills 100kW to 1MW
Brewing Barrossa Valley Brewing Tanunda 100kW to 1MW
Cement Adelaide Brighton Cement Birkenhead 1MW - 10MW
Cement Adelaide Brighton Cement Angaston 1MW - 10MW
Chicken Growers
Southern Cross Farms
Australian Owen 100kW to 1MW
Chicken Growers Unknown Murray Bridge 100kW to 1MW
Chicken Growers Unknown Monarto 100kW to 1MW
Chicken Growers Unknown Port Wakefield 100kW to 1MW
Chicken Growers Unknown Langhornes Creek 100kW to 1MW
Chicken Growers Unknown Tailem Bend 100kW to 1MW
Chicken Processing Inghams Chicken Virginia 100kW to 1MW
Chicken Processing
Baiada / Adelaide Poultry
P/L Wingfield 100kW to 1MW
Chicken Processing Goumet Poultry Service Cavan 100kW to 1MW
Chicken Processing Inghams Enterprises P/L Bolivar 100kW to 1MW
Chicken Processing Inghams Enterprises P/L Wingfield 100kW to 1MW
Commercial Hub Multiple Monarto 100kW to 1MW
Confectionary Haighs Parkside 100kW to 1MW
Copper Mining Unknown Port Pirie Unknown

Jacobs Report
Filename: A Bioenergy Roadmap for South Australia - Report - Version 1.docx 60
Industry Company Location Demand Quantum
Beverage Bickfords Salisbury 100kW to 1MW
Beverage Coca Cola Amatil Thebarton 1MW to 10MW
Beverage Lionco Salisbury 100kW to 1MW
Beverage Nippy's Regency Park 100kW to 1MW
Beverage Nippy's Waikerie 100kW to 1MW
Beverage Nippy's Moorook 100kW to 1MW
Brewing Lionco Thebarton 1MW to 10MW
Brewing Coopers Regency Park 1MW to 10MW
Brewing The Hills Cider Company Adelaide Hills 100kW to 1MW
Brewing Barrossa Valley Brewing Tanunda 100kW to 1MW
Cement Adelaide Brighton Cement Birkenhead 1MW - 10MW
Cement Adelaide Brighton Cement Angaston 1MW - 10MW
Chicken Growers
Southern Cross Farms
Australian Owen 100kW to 1MW
Chicken Growers Unknown Murray Bridge 100kW to 1MW
Chicken Growers Unknown Monarto 100kW to 1MW
Chicken Growers Unknown Port Wakefield 100kW to 1MW
Chicken Growers Unknown Langhornes Creek 100kW to 1MW
Chicken Growers Unknown Tailem Bend 100kW to 1MW
Chicken Processing Inghams Chicken Virginia 100kW to 1MW
Chicken Processing
Baiada / Adelaide Poultry
P/L Wingfield 100kW to 1MW
Chicken Processing Goumet Poultry Service Cavan 100kW to 1MW
Chicken Processing Inghams Enterprises P/L Bolivar 100kW to 1MW
Chicken Processing Inghams Enterprises P/L Wingfield 100kW to 1MW
Commercial Hub Multiple Monarto 100kW to 1MW
Confectionary Haighs Parkside 100kW to 1MW
Copper Mining Unknown Port Pirie Unknown
Copper Mining Rex Minerals Ardrossan 10MW +
Copper Mining Hillgrove Resources Callington 10MW +
Dairy Processing Farm cluster Mt Gambier, Mt Shank 100kW to 1MW
Dairy Processing United Dairy Murray Bridge 100kW to 1MW
Dairy Processing
Alexandrina Cheese
Company Mt Jagged 100kW to 1MW
Dairy Processing B-D Farm Paris Creek 100kW to 1MW
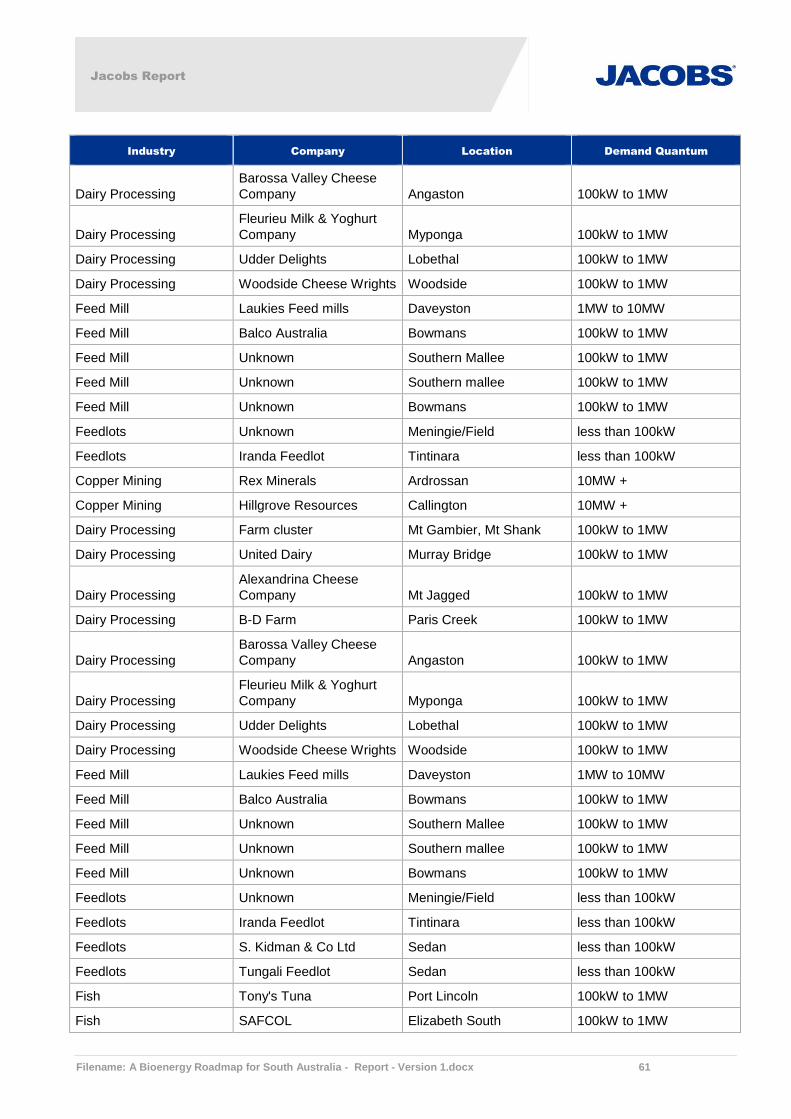
Jacobs Report
Filename: A Bioenergy Roadmap for South Australia - Report - Version 1.docx 61
Industry Company Location Demand Quantum
Dairy Processing
Barossa Valley Cheese
Company Angaston 100kW to 1MW
Dairy Processing
Fleurieu Milk & Yoghurt
Company Myponga 100kW to 1MW
Dairy Processing Udder Delights Lobethal 100kW to 1MW
Dairy Processing Woodside Cheese Wrights Woodside 100kW to 1MW
Feed Mill Laukies Feed mills Daveyston 1MW to 10MW
Feed Mill Balco Australia Bowmans 100kW to 1MW
Feed Mill Unknown Southern Mallee 100kW to 1MW
Feed Mill Unknown Southern mallee 100kW to 1MW
Feed Mill Unknown Bowmans 100kW to 1MW
Feedlots Unknown Meningie/Field less than 100kW
Feedlots Iranda Feedlot Tintinara less than 100kW
Copper Mining Rex Minerals Ardrossan 10MW +
Copper Mining Hillgrove Resources Callington 10MW +
Dairy Processing Farm cluster Mt Gambier, Mt Shank 100kW to 1MW
Dairy Processing United Dairy Murray Bridge 100kW to 1MW
Dairy Processing
Alexandrina Cheese
Company Mt Jagged 100kW to 1MW
Dairy Processing B-D Farm Paris Creek 100kW to 1MW
Dairy Processing
Barossa Valley Cheese
Company Angaston 100kW to 1MW
Dairy Processing
Fleurieu Milk & Yoghurt
Company Myponga 100kW to 1MW
Dairy Processing Udder Delights Lobethal 100kW to 1MW
Dairy Processing Woodside Cheese Wrights Woodside 100kW to 1MW
Feed Mill Laukies Feed mills Daveyston 1MW to 10MW
Feed Mill Balco Australia Bowmans 100kW to 1MW
Feed Mill Unknown Southern Mallee 100kW to 1MW
Feed Mill Unknown Southern mallee 100kW to 1MW
Feed Mill Unknown Bowmans 100kW to 1MW
Feedlots Unknown Meningie/Field less than 100kW
Feedlots Iranda Feedlot Tintinara less than 100kW
Feedlots S. Kidman & Co Ltd Sedan less than 100kW
Feedlots Tungali Feedlot Sedan less than 100kW
Fish Tony's Tuna Port Lincoln 100kW to 1MW
Fish SAFCOL Elizabeth South 100kW to 1MW
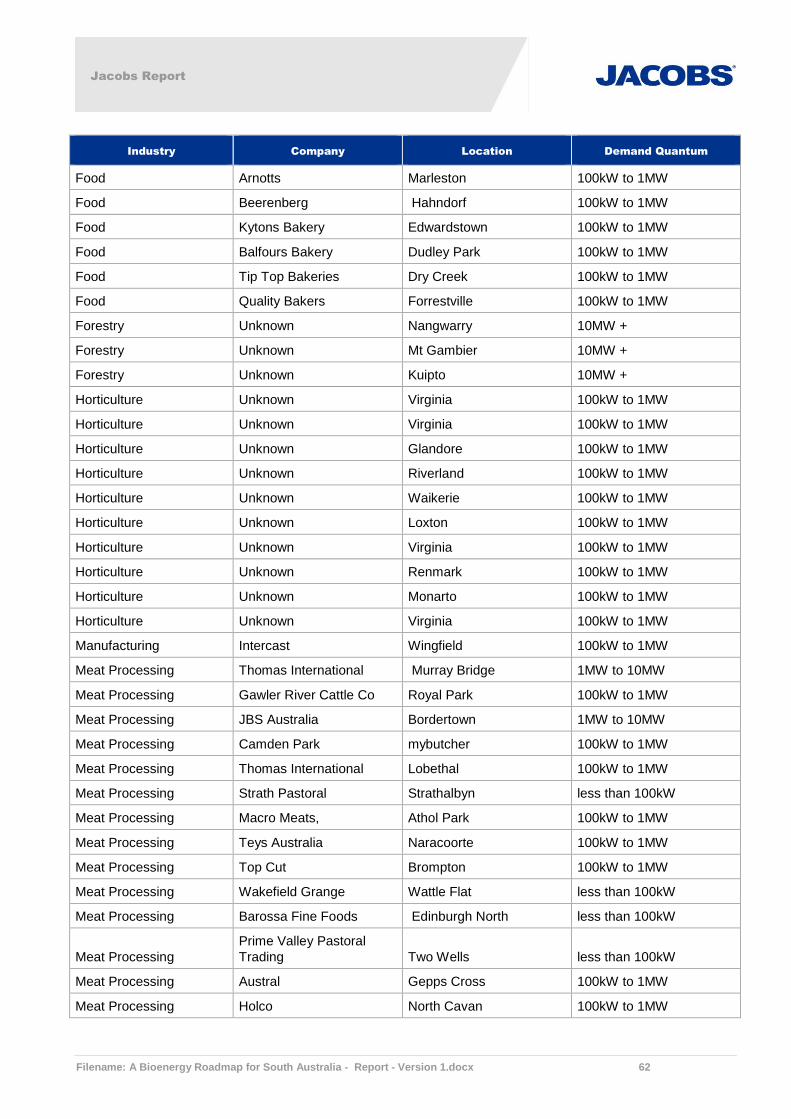
Jacobs Report
Filename: A Bioenergy Roadmap for South Australia - Report - Version 1.docx 62
Industry Company Location Demand Quantum
Food Arnotts Marleston 100kW to 1MW
Food Beerenberg Hahndorf 100kW to 1MW
Food Kytons Bakery Edwardstown 100kW to 1MW
Food Balfours Bakery Dudley Park 100kW to 1MW
Food Tip Top Bakeries Dry Creek 100kW to 1MW
Food Quality Bakers Forrestville 100kW to 1MW
Forestry Unknown Nangwarry 10MW +
Forestry Unknown Mt Gambier 10MW +
Forestry Unknown Kuipto 10MW +
Horticulture Unknown Virginia 100kW to 1MW
Horticulture Unknown Virginia 100kW to 1MW
Horticulture Unknown Glandore 100kW to 1MW
Horticulture Unknown Riverland 100kW to 1MW
Horticulture Unknown Waikerie 100kW to 1MW
Horticulture Unknown Loxton 100kW to 1MW
Horticulture Unknown Virginia 100kW to 1MW
Horticulture Unknown Renmark 100kW to 1MW
Horticulture Unknown Monarto 100kW to 1MW
Horticulture Unknown Virginia 100kW to 1MW
Manufacturing Intercast Wingfield 100kW to 1MW
Meat Processing Thomas International Murray Bridge 1MW to 10MW
Meat Processing Gawler River Cattle Co Royal Park 100kW to 1MW
Meat Processing JBS Australia Bordertown 1MW to 10MW
Meat Processing Camden Park mybutcher 100kW to 1MW
Meat Processing Thomas International Lobethal 100kW to 1MW
Meat Processing Strath Pastoral Strathalbyn less than 100kW
Meat Processing Macro Meats, Athol Park 100kW to 1MW
Meat Processing Teys Australia Naracoorte 100kW to 1MW
Meat Processing Top Cut Brompton 100kW to 1MW
Meat Processing Wakefield Grange Wattle Flat less than 100kW
Meat Processing Barossa Fine Foods Edinburgh North less than 100kW
Meat Processing
Prime Valley Pastoral
Trading Two Wells less than 100kW
Meat Processing Austral Gepps Cross 100kW to 1MW
Meat Processing Holco North Cavan 100kW to 1MW
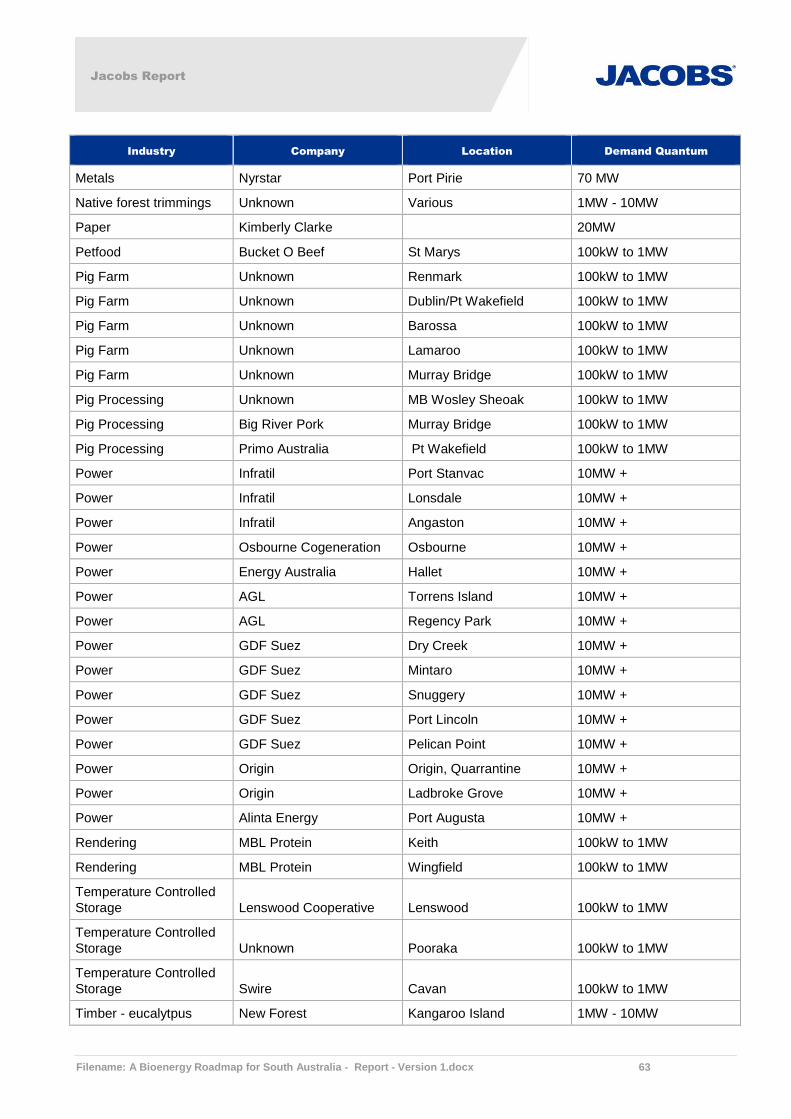
Jacobs Report
Filename: A Bioenergy Roadmap for South Australia - Report - Version 1.docx 63
Industry Company Location Demand Quantum
Metals Nyrstar Port Pirie 70 MW
Native forest trimmings Unknown Various 1MW - 10MW
Paper Kimberly Clarke 20MW
Petfood Bucket O Beef St Marys 100kW to 1MW
Pig Farm Unknown Renmark 100kW to 1MW
Pig Farm Unknown Dublin/Pt Wakefield 100kW to 1MW
Pig Farm Unknown Barossa 100kW to 1MW
Pig Farm Unknown Lamaroo 100kW to 1MW
Pig Farm Unknown Murray Bridge 100kW to 1MW
Pig Processing Unknown MB Wosley Sheoak 100kW to 1MW
Pig Processing Big River Pork Murray Bridge 100kW to 1MW
Pig Processing Primo Australia Pt Wakefield 100kW to 1MW
Power Infratil Port Stanvac 10MW +
Power Infratil Lonsdale 10MW +
Power Infratil Angaston 10MW +
Power Osbourne Cogeneration Osbourne 10MW +
Power Energy Australia Hallet 10MW +
Power AGL Torrens Island 10MW +
Power AGL Regency Park 10MW +
Power GDF Suez Dry Creek 10MW +
Power GDF Suez Mintaro 10MW +
Power GDF Suez Snuggery 10MW +
Power GDF Suez Port Lincoln 10MW +
Power GDF Suez Pelican Point 10MW +
Power Origin Origin, Quarrantine 10MW +
Power Origin Ladbroke Grove 10MW +
Power Alinta Energy Port Augusta 10MW +
Rendering MBL Protein Keith 100kW to 1MW
Rendering MBL Protein Wingfield 100kW to 1MW
Temperature Controlled
Storage Lenswood Cooperative Lenswood 100kW to 1MW
Temperature Controlled
Storage Unknown Pooraka 100kW to 1MW
Temperature Controlled
Storage Swire Cavan 100kW to 1MW
Timber - eucalytpus New Forest Kangaroo Island 1MW - 10MW
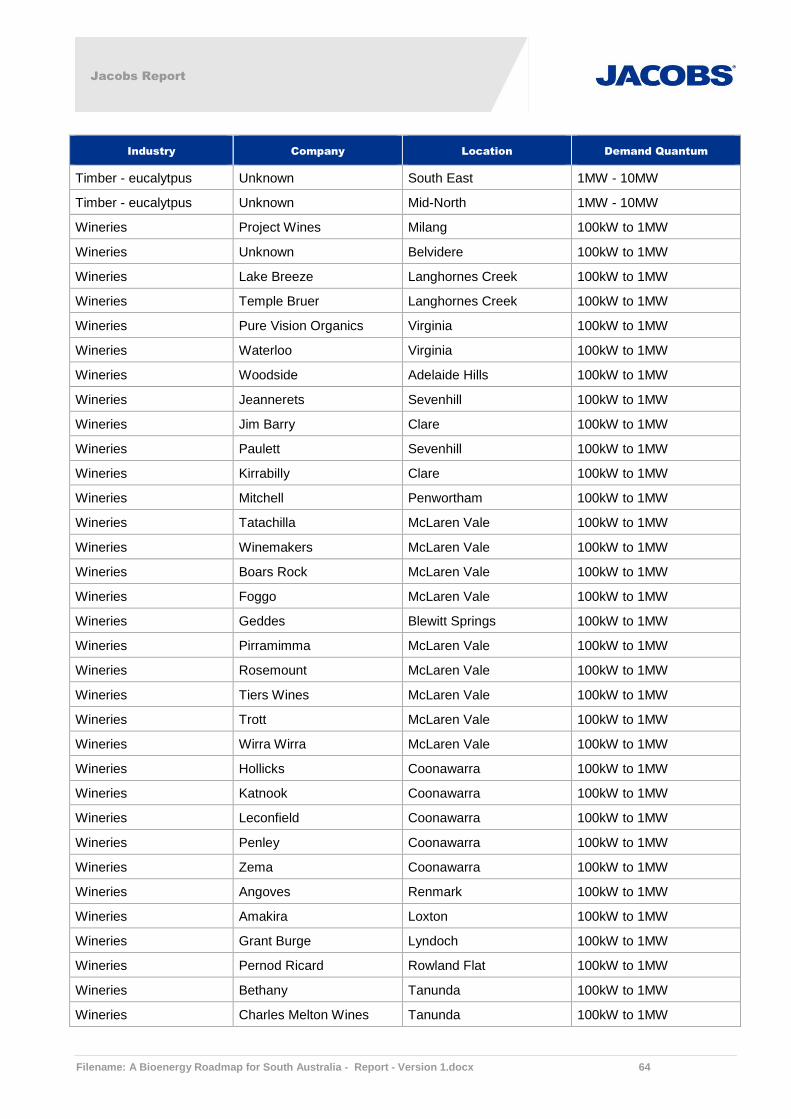
Jacobs Report
Filename: A Bioenergy Roadmap for South Australia - Report - Version 1.docx 64
Industry Company Location Demand Quantum
Timber - eucalytpus Unknown South East 1MW - 10MW
Timber - eucalytpus Unknown Mid-North 1MW - 10MW
Wineries Project Wines Milang 100kW to 1MW
Wineries Unknown Belvidere 100kW to 1MW
Wineries Lake Breeze Langhornes Creek 100kW to 1MW
Wineries Temple Bruer Langhornes Creek 100kW to 1MW
Wineries Pure Vision Organics Virginia 100kW to 1MW
Wineries Waterloo Virginia 100kW to 1MW
Wineries Woodside Adelaide Hills 100kW to 1MW
Wineries Jeannerets Sevenhill 100kW to 1MW
Wineries Jim Barry Clare 100kW to 1MW
Wineries Paulett Sevenhill 100kW to 1MW
Wineries Kirrabilly Clare 100kW to 1MW
Wineries Mitchell Penwortham 100kW to 1MW
Wineries Tatachilla McLaren Vale 100kW to 1MW
Wineries Winemakers McLaren Vale 100kW to 1MW
Wineries Boars Rock McLaren Vale 100kW to 1MW
Wineries Foggo McLaren Vale 100kW to 1MW
Wineries Geddes Blewitt Springs 100kW to 1MW
Wineries Pirramimma McLaren Vale 100kW to 1MW
Wineries Rosemount McLaren Vale 100kW to 1MW
Wineries Tiers Wines McLaren Vale 100kW to 1MW
Wineries Trott McLaren Vale 100kW to 1MW
Wineries Wirra Wirra McLaren Vale 100kW to 1MW
Wineries Hollicks Coonawarra 100kW to 1MW
Wineries Katnook Coonawarra 100kW to 1MW
Wineries Leconfield Coonawarra 100kW to 1MW
Wineries Penley Coonawarra 100kW to 1MW
Wineries Zema Coonawarra 100kW to 1MW
Wineries Angoves Renmark 100kW to 1MW
Wineries Amakira Loxton 100kW to 1MW
Wineries Grant Burge Lyndoch 100kW to 1MW
Wineries Pernod Ricard Rowland Flat 100kW to 1MW
Wineries Bethany Tanunda 100kW to 1MW
Wineries Charles Melton Wines Tanunda 100kW to 1MW

Jacobs Report
Filename: A Bioenergy Roadmap for South Australia - Report - Version 1.docx 65
Industry Company Location Demand Quantum
Wineries Henschke Keyneton 100kW to 1MW
Wineries Harbord Stockwell 100kW to 1MW
Wineries Richmond Grove Tanunda 100kW to 1MW
Wineries Tarac Technologies Nuriootpa 100kW to 1MW
Wineries Viking Marananga 100kW to 1MW
Wool Michell Wool Salisbury 1MW - 10MW
Demand locations are shown graphically in Figure 3.1: Potential demand locations and Figure 3.2.
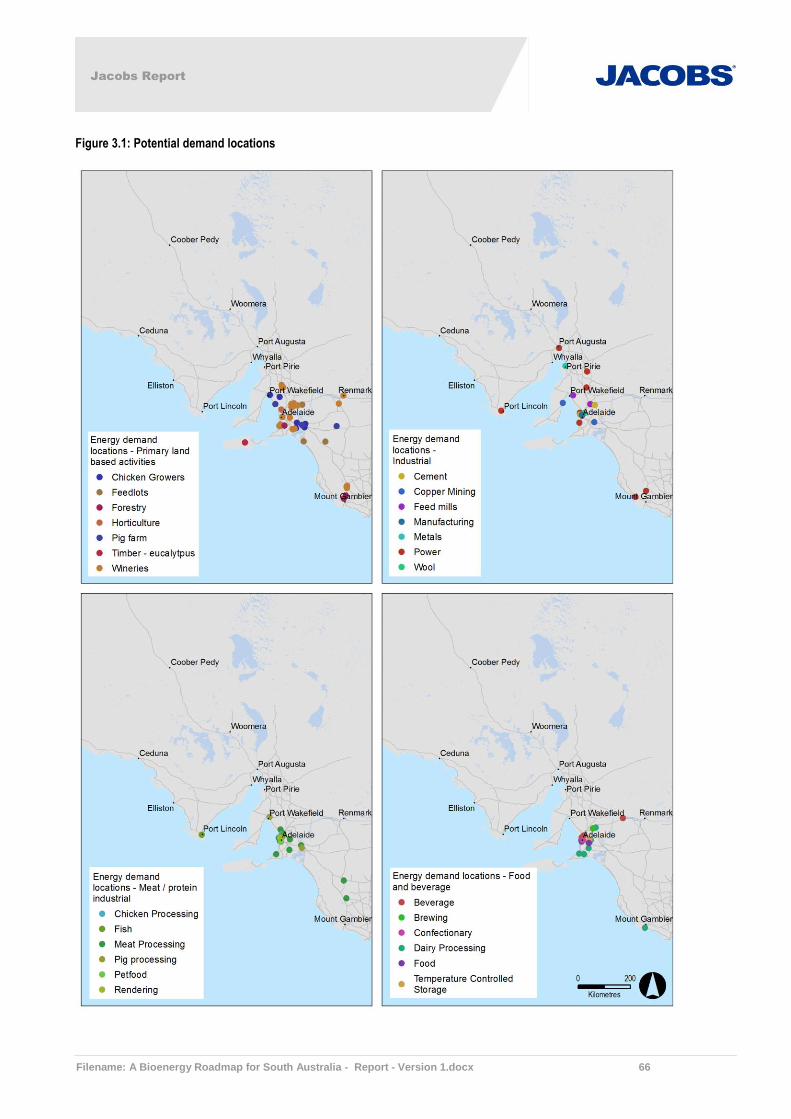
Jacobs Report
Filename: A Bioenergy Roadmap for South Australia - Report - Version 1.docx 66
Figure 3.1: Potential demand locations
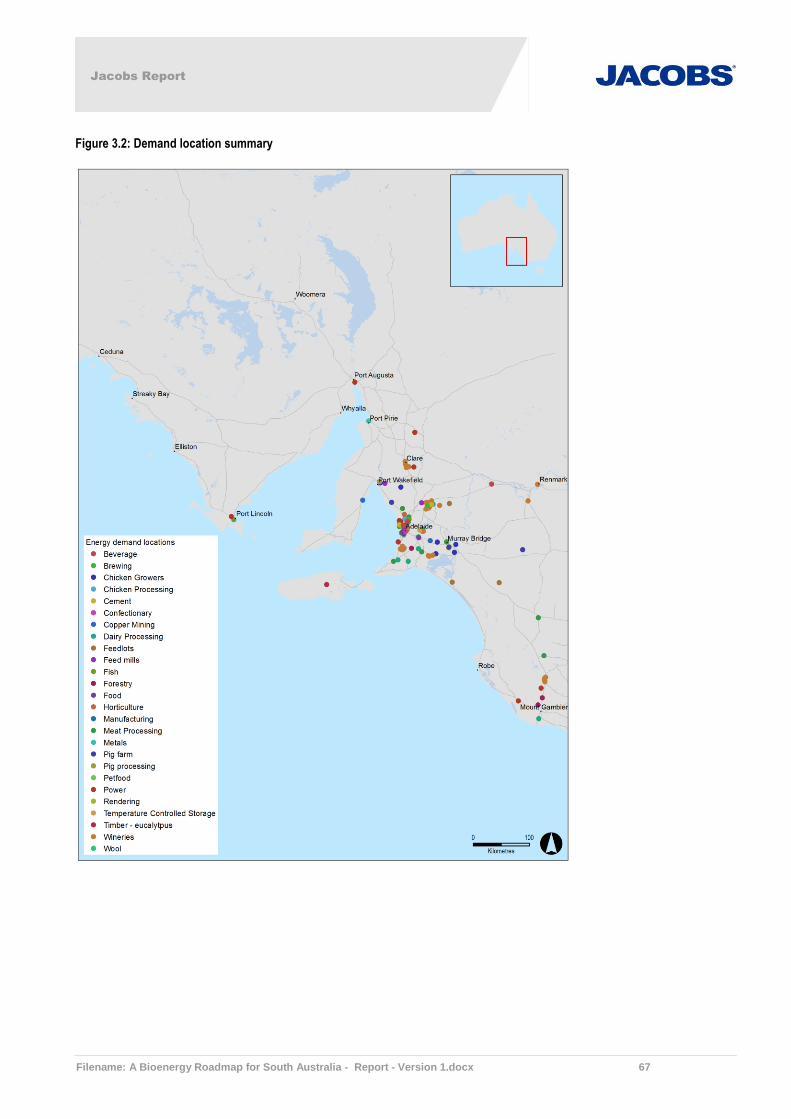
Jacobs Report
Filename: A Bioenergy Roadmap for South Australia - Report - Version 1.docx 67
Figure 3.2: Demand location summary

Jacobs Report
Filename: A Bioenergy Roadmap for South Australia - Report - Version 1.docx 68
4. Logistical Factors Influencing Bio-energy Projects in South Australia
There are several logistics challenges for hauling bio-energy feedstocks. These include low value per tonne,low
density, few economies of scale and the need for purpose built vehicles.
Most bio-energy feedstocks will be of low unit value as they are typically bi-products of a current process. On
this basis it will likely be economic to haul the feedstocks over short distances only, similar to other low value
industry inputs. For example, sugarcane, or building inputs like sand and gravel are rarely hauled more than 40-
50 km. 40-50 km is a road distance, so ‘as the crow flies’, the distance may be lower. Overseas experience has
shown that feedstocks can be hauled over longer distances, potentially up to 100 km if the feedstock is readily
transportable / has higher value.
Feedstock type, e.g., a solid such as straw bales compared to a slurry such as pig effluent, has an impact on
the economic haul distance. The materials handling at either end of the trip also impacts the economics, e.g., a
manual materials handling system will have a low capital cost but a higher operating cost versus a more
automatic material handling system. Vehicles with more expensive body options e.g. tankers or covered bulk
tippers will have an impact on the haulage economics. Neither of these vehicles has low operating costs further
deterring long distance haulage. Purpose built vehicles, e.g., hauling woodchips using self-discharging trailers
with moving floors may be required subject to the haulage volume. Low cost alternatives are possible, for
example, old petroleum road tankers can be converted to carry bulk tallow by changing the tanker piping and
installing an insulating cover.
Overseas experience has shown that solid easily handled feedstocks tend to be hauled the longest distance
e.g. straw bales. Solid feedstocks that are less easily handled, e.g. MSW tend to be hauled shorter distances.
We note that in South Australia MSW tends to be hauled longer distances and that there is already an
established transport network to deliver MSW to the States landfill facilities. Liquid / slurry feedstocks tend to be
used on the site that they are produced or an adjacent site.
There are few economies of scale in bio-energy fuel haulage as the volumes and weights are typically low. This
means establishing specialist haulage fleets will not be economic. For example, in the organic recycling data
sheet, the largest item was garden organics at 211,000 tonnes per annum. This equates to 840 tonnes per day
which is 20 truckloads for the entire state. Most of the sources might need 6-8 truckloads per day
Economics of waste haulage will likely lend itself to short distances of typically up to 40-50 km. If there was a
niche location where there was no nearby energy alternative and/or very large volumes, longer haulage may
become feasible. However neither of these circumstances is relevant to this initial overview, which involves
reviewing typical or average applications.

Jacobs Report
Filename: A Bioenergy Roadmap for South Australia - Report - Version 1.docx 69
5. Technological Factors Influencing Bio-energy Projects in South Australia
5.1 Introduction
There are several existing feedstocks that have been identified as having potential for bio-energy in South
Australia. These are:
Council green waste (garden and park waste)
Municipal solid waste
Forestry waste and sawmill residues
High moisture content organic wastes (pig slurries, chicken litter, dairy shed effluent, feedlot waste).
Straw feedstocks
Sewage bio-gas has already been investigated by SA Water and there are various projects underway or in
operation.
The technology options for particular feedstocks are discussed in the following sections.
In addition, the following case studies and discussion are also provided:
Small scale biomass heating which could be applicable for any of the woody biomass nodes or other areas
where smaller volumes of clean wood chip like material available, such as forestry residues, woody energy
crops and woody green waste sources (400 to 20,000 tonnes of feedstock available per annum)
Bio-gas upgrading to bio-methane (as an alternate to bio-gas use in gas engines)
Algae production and refining for liquid bio-fuels.
The indicative bio-energy project examples are based on a number of key assumptions which have not been
verified as a part of this report. The assumptions are:
Confirmation of availability of feedstock
Assessment of potential gate fees or feedstock costs
Feedstock quality details including chemical and physical properties including moisture content and energy
value
The standard of and source country of equipment manufacturing can impact considerably the capital cost
of the technologies discussed below. Confirmation of economic feasibility of the economic feasibility of the
technologies noted below has not been undertaken as a part of this work
Capital costs and capital cost rates per MW are indicative of the order of magnitude of cost and are not
suitable for project approval purposes.
5.2 Council Green Waste
Source segregated council green waste represents a biomass feedstock of relatively high biogenic purity (with
some minor plastic contamination etc. possible), which may be suitable for use in either of the two following well
technically proven and commercial technologies (other technologies are also possible but less well proven for
this feedstock):
A combustion type process to generate power and heat
An anaerobic digestion process to produce bio-gas which could be used to generate power in a spark
ignition engine and/or provide heat for process use.
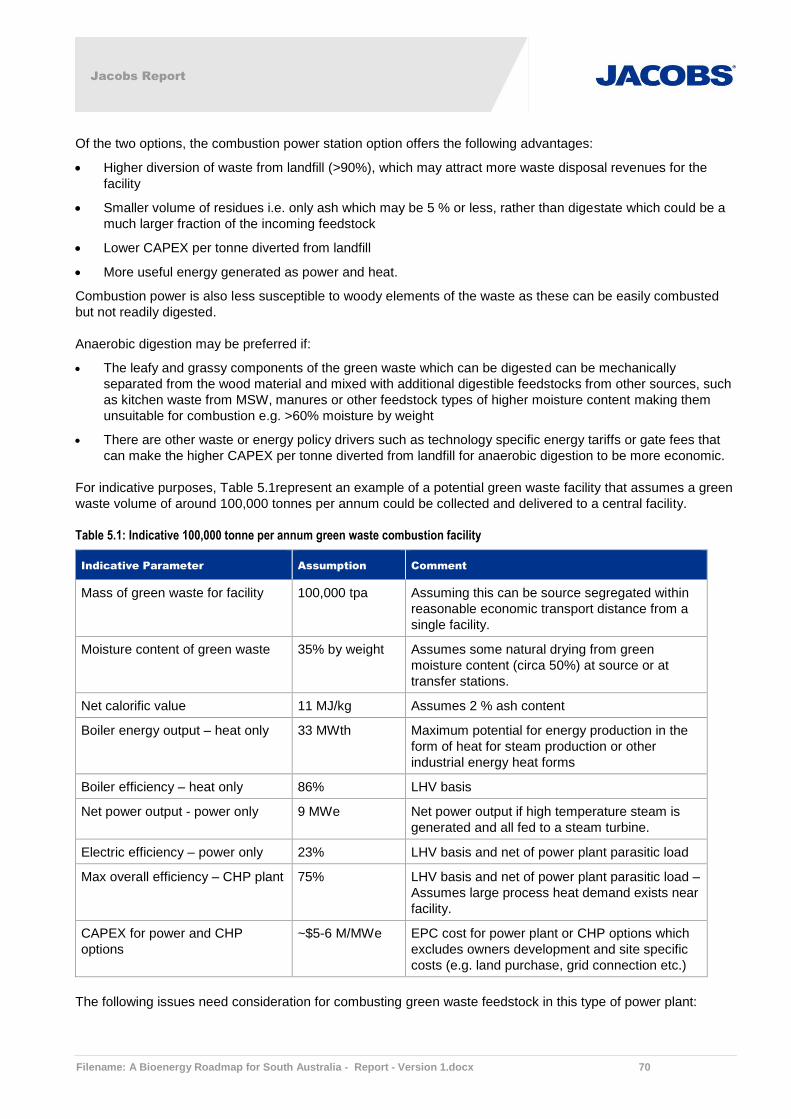
Jacobs Report
Filename: A Bioenergy Roadmap for South Australia - Report - Version 1.docx 70
Of the two options, the combustion power station option offers the following advantages:
Higher diversion of waste from landfill (>90%), which may attract more waste disposal revenues for the
facility
Smaller volume of residues i.e. only ash which may be 5 % or less, rather than digestate which could be a
much larger fraction of the incoming feedstock
Lower CAPEX per tonne diverted from landfill
More useful energy generated as power and heat.
Combustion power is also less susceptible to woody elements of the waste as these can be easily combusted
but not readily digested.
Anaerobic digestion may be preferred if:
The leafy and grassy components of the green waste which can be digested can be mechanically
separated from the wood material and mixed with additional digestible feedstocks from other sources, such
as kitchen waste from MSW, manures or other feedstock types of higher moisture content making them
unsuitable for combustion e.g. >60% moisture by weight
There are other waste or energy policy drivers such as technology specific energy tariffs or gate fees that
can make the higher CAPEX per tonne diverted from landfill for anaerobic digestion to be more economic.
For indicative purposes, Table 5.1represent an example of a potential green waste facility that assumes a green
waste volume of around 100,000 tonnes per annum could be collected and delivered to a central facility.
Table 5.1: Indicative 100,000 tonne per annum green waste combustion facility
Indicative Parameter Assumption Comment
Mass of green waste for facility 100,000 tpa Assuming this can be source segregated within
reasonable economic transport distance from a
single facility.
Moisture content of green waste 35% by weight Assumes some natural drying from green
moisture content (circa 50%) at source or at
transfer stations.
Net calorific value 11 MJ/kg Assumes 2 % ash content
Boiler energy output – heat only 33 MWth Maximum potential for energy production in the
form of heat for steam production or other
industrial energy heat forms
Boiler efficiency – heat only 86% LHV basis
Net power output - power only 9 MWe Net power output if high temperature steam is
generated and all fed to a steam turbine.
Electric efficiency – power only 23% LHV basis and net of power plant parasitic load
Max overall efficiency – CHP plant 75% LHV basis and net of power plant parasitic load –
Assumes large process heat demand exists near
facility.
CAPEX for power and CHP
options
~$5-6 M/MWe EPC cost for power plant or CHP options which
excludes owners development and site specific
costs (e.g. land purchase, grid connection etc.)
The following issues need consideration for combusting green waste feedstock in this type of power plant:
Jacobs Report
Filename: A Bioenergy Roadmap for South Australia - Report - Version 1.docx 71
Normally this type of biomass material would be fired on a grate type boiler and produce steam in excess
of 4000 C if feeding to a steam turbine.
Pre-processing will be required to shred to chip like particles or smaller for the purposes of handling and
firing the material. Screening and stone removal is also recommended.
Energy output per tonne combusted will be subject to the moisture content of the green waste.
The high proportion of leaf and bark content of the green waste can mean it is higher in the elements
sodium, potassium and chlorine than some other biomass feedstocks like clean wood chip. This needs to
be considered in the boiler design and steam conditions to prevent fouling and corrosion problems in the
operational boiler plant.
Green waste could also be aggregated with other woody biomass types e.g. forestry residues or energy
crops to fire in a larger facility. The facility would need to be carefully designed to handle and combust
multiple fuel sources. An aggregated facility improves the economies of scale of such a project.
5.3 Residual Municipal Solid Waste
Residual municipal waste (RMW) collected separately from recyclables at source represents a biomass
feedstock of perhaps approximately 50% biogenic or organic purity with significant plastic, textile and a number
of other inorganic components. The RMW may be suitable for use in either of the two following technically well
proven and commercial technologies:
A combustion type process to generate power and heat
An anaerobic digestion process to produce bio-gas which could be used to generate power in a spark
ignition engine and/or provide heat for process use.
Other technologies are also possible but less well proven at large scale.
Either of the two options noted above could also be combined with a front end waste treatment process if there
was a driver to increase recycling levels from this residual waste stream, which will still contain metals, glass
and plastic bottles etc, that have not be placed in separate collection bins. Generally waste pre-treatment
systems are of the mechanical and/or biological type, with many variants possible. The variants have different
levels of recyclables extracted depending on the incoming waste composition and the treatment technology
adopted.
Of the two options above, the combustion energy from waste (EfW) option offers the following advantages:
Higher diversion of waste from landfill >75%, which may attract more waste disposal revenues for the
facility
Smaller volume of residues i.e. only ash which may be 25 % or less, rather than digestate and non-
recyclable inorganics which could be a much larger fraction of the incoming feedstock
Lower CAPEX per tonne diverted from landfill
More useful energy generated as power and heat
Such a facility can combust the organic fraction and the in-organic fraction in an environmentally
responsible and efficient, well proven process.
Anaerobic digestion may be preferred if:
The organic fraction of the MSW can be source segregated in collection regimes such as green bins which
can receive only kitchen and garden waste.
There are other waste policy drivers that seek to drive higher levels of recycling which would make the
additional CAPEX and OPEX costs of operating a mechanical and/or biological pre-treatment plant viable.
Pre-treatment is generally preferred to first separate the organic from the inorganic fraction of the incoming
waste. Anaerobic digestion is then applied to a relatively high organic content feedstock.

Jacobs Report
Filename: A Bioenergy Roadmap for South Australia - Report - Version 1.docx 72
Jacobs understands that the majority of South Australian MSW is collected and transported centrally to one of
two landfill sites near urban areas. At the time of writing of this report, waste volume data for residual waste (i.e.
non-recyclables) has not been provided for these landfills, however on a per capita basis, it has been assumed
that municipal waste generation for the state will be more than one million tonnes per annum.
For indicative purposes Table 5.2 represents an example of an energy from waste facility assuming a residual
municipal waste volume of around 1,000,000 tpa could be diverted from the existing landfills located near urban
areas and delivered to a central facility nearby. The following example is based on no pre-treatment of the
waste which would be expected to maximise energy recovery, minimise waste to landfill, and give the lowest
cost per tonne of waste diverted from landfill. To make such a facility economic, in addition to power revenues,
it would need to be reliant on charging gate fees per tonne of waste processed. For example, in the UK where
there are many such energy from waste plants, facilities of this type can be economic on a large scale (e.g.
greater than around 200,000 tpa) when charging of the order of A$150 to 200 per tonne of waste received.
Table 5.2: Indicative 1,000,000 tonne per annum residual municipal solid waste combustion facility
Indicative Parameter Assumption Comment
Mass of residual municipal waste 1,000,000 tpa Assuming this can be diverted from existing
landfills located nearby to a centralised facility.
Moisture content of MSW 27% by weight Typical assumption, moisture content will vary
depending on waste composition and also
seasonally.
Net calorific value 9.5 MJ/kg Assumes 24 % ash content
Boiler energy output – heat only 285 MWth Maximum potential for energy production in the
form of heat for steam production or other
industrial energy heat forms
Boiler efficiency – heat only 85% LHV basis
Net power output - power only 89 MWe Net power output if high temperature steam is
generated and all fed to a steam turbine.
Electric efficiency – power only 26.5 % LHV basis and net of power plant parasitic load
Max overall efficiency – CHP plant 75% LHV basis and net of power plant parasitic load –
Assumes large process heat demand exists near
facility.
CAPEX for power and CHP
options
~$2000 to 3000 /
MWth fuel input
EPC cost for large scale EfW power plant or
CHP options which excludes owners
development and site specific costs (e.g. land
purchase, grid connection etc)
The following issues need consideration for combusting municipal solid waste feedstock in this type of power
plant:
Normally this type of waste material would be fired on a hydraulic ram stoker grate type boiler and produce
steam in excess of 4000 C if feeding to a steam turbine.
Pre-processing is not required for robust and proven grate designs for MSW feedstock, and waste can be
handled with a grab crane.
Post combustion gas clean-up is required for emissions control.
Energy output per tonne combusted will be subject to the waste composition and moisture content of the
MSW which should be examined carefully as part of the EfW project development.

Jacobs Report
Filename: A Bioenergy Roadmap for South Australia - Report - Version 1.docx 73
MSW is high in the elements sodium, potassium and chlorine. This needs to be considered in the boiler
design and steam conditions to prevent fouling and corrosion problems in the operational boiler plant.
MSW could also be aggregated with other non-hazardous MSW-like wastes such as commercial and
industrial (C&I) waste, to fire in a larger facility if that facility was carefully designed to handle and combust
multiple fuel sources.
Geographically large collection areas can result in a number of different recycling and waste collection
regimes between the local government authorities. This has the potential to change the composition of the
waste and affect the EfW plant output. The risk can be mitigated by all stakeholders agreeing to a common
standard.
5.4 Forestry and Sawmill Residues Project
Within South Australia, particularly within the south eastern part of the state, there is a forestry industry
generating which generates considerable biomass. This project example focuses on the utilisation of wood
residues derived from saw mills or residues left in the forest after harvesting. When forests are harvested for
logs, there is a significant volume of material such as branches which are cut away in the forest and could be
chipped into a useful solid biomass fuel. In addition, sawmill residues include sawdust, shavings and wood cut
away from the trunks during the production of useful timber. Residues generated at the mill can be of the order
of 50% of the incoming volume of wood. Both these forms of woody biomass have similar characteristics and
can sometimes be combined to form the feedstock for a biomass energy project.
Depending on the volume of woody material available there may be one of two established and commercialised
technologies for converting the woody biomass residues to useful energy.
A combustion type process with a steam turbine to generate power and heat on a medium to large scale.
A combustion process coupled with an organic Rankine cycle (ORC) for smaller scale projects.
Option 1 above is applicable at scales circa > 1 MW electrical output equivalent and will be the more efficient of
the two at larger scales e.g. greater than 5 MW equivalent of electrical capacity. Option 2 is applicable for
electrical capacities up to a single unit size of around 2 MW electrical and will normally be more efficient at
those lower capacities. Both options have the potential to produce useful heat as well as power, and operate as
a combined heat and power (CHP) plant. Locating such a project at a sawmill or similar wood processing
facility may present an opportunity where there is both feedstock and energy demand in the forms of power and
heat all present on the one site. Stand-alone power export projects are also possible in the right economic
context.
For indicative purposes Table 5.3 represents an example of a potential sawmill and forestry facility assuming a
wood residue volume of around 100,000 tonnes per annum could be collected and delivered to a central facility.
At this capacity, it is assumed a steam turbine cycle will be the preferred option.
Table 5.3: Indicative 100,000 tonne per annum forestry and sawmill combustion facility with steam turbine
Indicative Parameter Assumption Comment
Mass of woody residues 100,000 tpa Assuming this can be source segregated within
reasonable economic transport distance from a
single facility.
Moisture content of wood waste 50% by weight Assumes green wood is used without natural
drying prior to use.
Net calorific value 7.9 MJ/kg Assumes 0.5% ash content
Boiler energy output – heat only 28 MWth Maximum potential for energy production in the
form of heat for steam production or other
industrial energy heat forms

Jacobs Report
Filename: A Bioenergy Roadmap for South Australia - Report - Version 1.docx 74
Indicative Parameter Assumption Comment
Boiler efficiency – heat only 84% LHV basis
Net power output - power only 6 MWe Net power output if high temperature steam is
generated and all fed to a steam turbine.
Electric efficiency – power only 22 % LHV basis and net of power plant parasitic load
Max overall efficiency – CHP plant 74% LHV basis and net of power plant parasitic load –
Assumes large process heat demand exists near
facility.
CAPEX for power and CHP
options
~$5-6 M / MWe EPC cost for power plant or CHP options which
excludes owners development and site specific
costs (e.g. land purchase, grid connection etc).
The following issues need consideration for combusting forestry and saw mill residue feedstocks in this type of
power plant:
Most commonly this type of biomass material would be fired on a grate type boiler and produce steam in
excess of 4500 C if feeding to a steam turbine, however fluidised bed boilers are also a feasible option for
clean and reasonably high moisture content feedstock
If wood chips are produced at the saw mill or in a chipper in the field they will generally be fairly uniform
and easy to handle. If material is processed in a hammer mill it could be less uniform. Forestry residues
could contain some stones or rocks also, so screening may be advisable.
Energy output per tonne combusted will be subject to the moisture content of the wood waste
This type of clean wood chip is low in the elements sodium, potassium and chlorine and should not result in
major fouling and corrosion problems in the operational boiler plant.
Wood residues could also be aggregated with other woody biomass types (e.g. energy crops) to fire in a
larger facility if that facility was carefully designed to handle and combust multiple fuel sources. This would
improve the economies of scale of such a project.
5.5 High Moisture Content Organic Feedstock Project
This example project could be applied to a number of high moisture content bio-feedstocks where technologies
like combustion are inappropriate. This could include a range of feedstocks such as livestock animal manures,
food wastes, garden wastes and similar feedstocks with moisture contents in excess of 55 to 60% by weight.
This study has identified that within South Australia there are some hot spots for the production of pigs and
chickens. The associated manures or slurries may have some potential for aggregation to a centralised facility
to give sufficient volume for a bio-energy project.
For feedstocks of this type the preferred energy conversion technology is anaerobic digestion (AD) because of
the high moisture content. AD is a naturally occurring biological process that uses microbes to break down
organic materials in the absence of oxygen. The digestion of organic wastes takes place inside a reactor in
which the pH, moisture content and temperature are maintained to give the optimal gas yield. Depending on the
feedstock and the type of system used, digestion can take as little as a day or two or up to two months in some
circumstances. Sometimes the gas needs to be cleaned of contaminants, which include the highly corrosive
hydrogen sulphide, moisture, and for some feedstocks also siloxanes which can be damaging to downstream
equipment using the bio-gas.
There are a number of AD technology options which could be chosen depending on a number of factors not the
least being the chemical and physical properties of the digester feedstock, and in particular, the solids content is
very important. This report does not investigate in depth the various AD options, however careful consideration
of the following issues is required for a specific feedstock or feedstocks:

Jacobs Report
Filename: A Bioenergy Roadmap for South Australia - Report - Version 1.docx 75
Selection of a wet or dry phase digestion process.
Thermophilic (higher) or mesophilic (medium) operating temperatures.
Continuous or batch flow process.
Pre-treatment requirements or options to enhance bio-gas yields (e.g. thermal hydrolysis).
Post treatment requirements for the digestate residues may be required so that they can be made safe to
use.
Anaerobic digestion is a proven technology that has been operational at industrial scale for several decades.
Historically, the AD market has been given significant government support in continental Europe, especially in
the Netherlands, Belgium and Germany and it is from these countries that many of the well proven technology
designs originate.
The methane content of bio-gas produced by different feedstocks can vary between 55 to 75%, which is
normally sufficient for use as a fuel directly in various energy applications. The most commercialised options for
the conversion of the bio-gas to useful energy include:
Use in a gas boiler for heat generation only if there is sufficient local heat demand to consume the volume
of gas generated.
Use in spark ignition gas engines for power generation with the potential for heat recovery if required for
temperature control of the AD process or for other heating applications if such a demand exists.
Use in gas turbine generator(s) also for the generation of heat and power. Micro or mini turbines could be
considered.
Use in fuel cells for the generation of power and potentially also some heat.
A further option to upgrade the bio-gas to bio-methane is discussed further in Section 5.7.
Of the above options, bio-gas use in spark ignition engines offers the following advantages:
Produces power at relatively high efficiency which is a higher value energy product than heat. Spark
ignition engines have a higher efficiency than gas turbines, only fuel cells may be higher out of the three
non-boiler options.
Lower in capital costs per unit of power generation installed than fuel cells.
The most well proven and commercialised conversion technology option.
A technology which is readily scalable for a wide range of capacities of digesters by varying engine unit
sizes and with multiple modules as required.
Heat only boilers may be preferred if:
The organisation generating the bio-gas or its neighbour(s) has a considerable demand for heat.
No readily available electricity grid connection exists.
Gas turbines may be preferred if:
High electrical conversion efficiency is not the priority.
Significant demand for process steam exists at or near the site, which can be generated from the turbine
exhaust gases.
For indicative purposes, Table 5.4 represents an example of anaerobic digestion plant with spark ignition gas
engines for power generation utilising around 30,000 tpa of mixed feedstocks made up from primarily pig slurry
(20,000 tpa) and chicken litter (10,000 tpa), presuming this could be collected and delivered to a central facility.
It is noted however that different sized facilities may be feasible at specific locations as AD projects are
technically scalable from small systems at single large farms up to industrial scale facilities.

Jacobs Report
Filename: A Bioenergy Roadmap for South Australia - Report - Version 1.docx 76
Table 5.4: Indicative 30,000 tpa feedstock anaerobic digestion facility with engine generator
Indicative Parameter Assumption Comment
Mass of AD plant feedstock 30,000 tpa Assuming this can be sourced cost effectively
within reasonable economic transport distance
from a single facility.
Moisture content manure
feedstocks
80% by weight Assumes mixed feedstock 2:1 ratio of pig slurry
and chicken litter.
Bio-gas yield per tonne 65 Nm3/tonne Assumes medium yields from combined waste at
65% methane content.
Bio-gas produced 1.95 Million
Nm3/annum
At 65% methane content.
Equivalent gas energy value 47,000
GJ/annum
LHV basis assuming 24 MJ/Nm3
Power generation capacity 620 kW Assumes a 38% engine efficiency on a lower
heating value basis
AD plant including engine CAPEX ~$10 -14 M /
MWe
Construction cost for production of AD plant
including engine which excludes owner’s
development and site specific costs (e.g. land
purchase, grid connection etc.)
The following issues need consideration for this type of AD gas engine power plant:
It is key requirement to understand the particular feedstock quality in detail for the specific project, including
undertaking digestibility assessment and bio-gas yields assessment. The selection of the appropriate
digester type to employ for a specific project should be based on the feedstock quality assessment.
It is also very important to understand the feedstock market in depth to confirm ongoing availability of
feedstocks at an appropriate cost or gate fee if the feedstock is a waste where disposal fees can be
charged.
Achieving appropriate gas quality is key to reliable and continuous operation of the engines. Removing
elements like moisture, hydrogen sulphide and siloxanes (if present) in the bio-gas produced, will lower
maintenance costs and improve engine availability.
Heat recovery from spark ignition gas engines is possible from the radiator cooling system (hot water) and
also from the engine exhaust (can be either hot water or low pressure steam).
5.6 Straw Feedstock Project
This study has identified significant quantities of straw are available in some regions which could support a
straw to power project. This project example focuses on the utilisation of straw left over from harvesting of
cereal crops like wheat. These materials can be baled at the farms and stored to dry, and then transported by
truck to a centralised facility which stores and handles the straw in bale form. This type of facility is common in
Europe and China. Both countries have established methods for handling and converting the straw to useful
energy.
Depending on the volume of straw material available there may be one of two potential technologies for
converting the straw residues to useful energy:
A combustion type process with a steam turbine to generate power and heat for medium to large scale
A gasification process coupled with a combustion burner and steam turbine.

Jacobs Report
Filename: A Bioenergy Roadmap for South Australia - Report - Version 1.docx 77
Of these two options, combustion is the most widely adopted and practiced internationally, this option has
proven designs and reliability. Currently straw energy is abundant throughout Europe, however the only large
scale installations exist in the UK, Spain and Denmark. Although straw energy potential is high, it is often not
linked to the technology options and therefore is overlooked as an energetic resource.
The development of the utilisation of cereal straws and other baled biomass materials for energy recovery has
the longest historical track record in Denmark compared to any other country in the world. This development
was driven further forward by a Danish government decision in 1993 to instruct power utility companies to burn
1.2 million tonnes of surplus straw per annum by the year 2000.
Straw is one of the primary sources of domestic biomass in Denmark and the first generation of biomass CHP
plants that were built in Denmark were 100% straw fired. The first straw fired power plant was commissioned in
1989 in Haslev with the next two being commissioned shortly afterwards in Slagelse and Rudkobing in 1990.
In 1996 the first of the second generation of biomass plants was commissioned in Masnedo, Denmark. This
plant had a significantly higher steam and boiler temperature. In Denmark today there are 13 operational straw
fired power plants.
Ely power station was built in 2001 in Cambridgeshire, UK. Ely has a capacity of 38 MW and requires 200,000
tons of straw each year making it the world’s largest single straw boiler. Two other straw fired projects are now
under construction/initial operation at Sleaford and at Brigg (both circa 40 MWe).
The Sanguesa power plant in Spain went operational in June 2002 and provides 25 MWe to a nearby industrial
estate. Long-term contracts with farmers were created for providing the 160,000 tons of straw that is needed
yearly to run the plant.
Outside of Europe, China is focusing on increasing its production of energy from straw. China produces over
700 million tons of straw each year with a surplus of 150 million tons that are wasted. Straw fired power stations
would be able to consume this fuel surplus and reduce CO2 emissions. The first biomass power plant built in
China was the Shandong Shanxian plant which went into operation at the end of 2006. Currently there are over
21 straw fired power plants constructed and in development in China alone.
Wheat straw is the predominant fuel type used in straw plants, however, some of the other fuels that have been
combusted include:
Barley straw
Rye straw
Oats straw
Oil seed rape straw
Maize straw.
Wood chips can also be co-fired in straw plants to supplement fuel supply if a separate chip handling system is
provided. A straw boiler with the ability to handle other types of fuels offers potential for risk mitigation for times
when straw availability is reduced. The use of other fuel types is normally supply chain driven to give more
certainty over supply volumes which may suffer from seasonality or weather issues or rely ultimately on the
choices of crops that local farmers decide to plant. Two projects in the UK are known to have been designed to
burn up to 10-20% wood chips co-fired with straw through a separate wood chip handling conveyor system.
For indicative purposes Table 5.5 represents an example of a potential straw fired plant assuming a volume of
around 200,000 tonnes per annum could be collected and delivered to a central facility. At this capacity, it is
assumed a steam turbine cycle will be the preferred option, and it is assumed that the plant will be a stand-
alone power generator which does not provide heat.

Jacobs Report
Filename: A Bioenergy Roadmap for South Australia - Report - Version 1.docx 78
Table 5.5: Indicative 200,000 tpa straw combustion facility with steam turbine
Indicative Parameter Assumption Comment
Mass of straw 200,000 tpa Assuming this can be source segregated within
reasonable economic transport distance from a
single facility.
Moisture content of straw 16% by weight Assumes green wood is used without natural
drying prior to use.
Net calorific value 14 MJ/kg Assumes 6% ash content
Boiler efficiency 92 % LHV basis
Net power output - power only 32 MWe Net power output if high temperature steam is
generated and all fed to a steam turbine.
Electric efficiency – power only 33 % LHV basis and net of power plant parasitic load
CAPEX for power and CHP
options
~$4-6 M / MWe EPC cost for power plant or CHP options which
excludes owners development and site specific
costs (e.g. land purchase, grid connection etc).
The following issues need consideration:
Most commonly this type of biomass material would be fired in a water cooled grate type boiler and
produce steam in excess of 5000 C if feeding to a steam turbine
Bales are typically stored in a barn onsite, handled automatically with cranes and then conveyed into the
boiler house to be broken by devices called scarifiers. The loose straw is fed on to the grate by water
cooled screw feeders.
Energy output per tonne combusted will be subject to the moisture content of the straw, so in wet periods
where bales do not dry well in the field, output may be constrained. Wet straw can also cause boiler
fouling problems.
Straw is notoriously high in the elements of potassium and chlorine and major fouling will result if proven
boiler designs are not adopted. Corrosion problems could also occur in the operational boiler plant if the
boiler metallurgy is not correctly specified. There are however some specific boiler suppliers worldwide who
can however resolve these issues to construct reliable and efficient plant.
5.7 Indicative Small Scale Heating Project
This energy conversion technology example is not node specific and could be applied to a range of smaller
scales such as from 100 kWth to 5 MWth where there is a suitable matching heat demand. Demand locations
may include hospitals, municipal swimming pools, small industrial demands or district heating schemes.
Heating schemes in this size range would normally use clean wood chip feedstocks between 30 to 50%
moisture content, which could be sourced from any of the following feedstock types:
Forestry residues
Saw mill residues
Purpose grown woody energy crops
Woody green waste.
Smaller boilers may also use wood pellets, although this have significantly more expensive ongoing costs and
pellet feedstock may need to be sourced from outside the local region.
The options for a small scale heating application are:
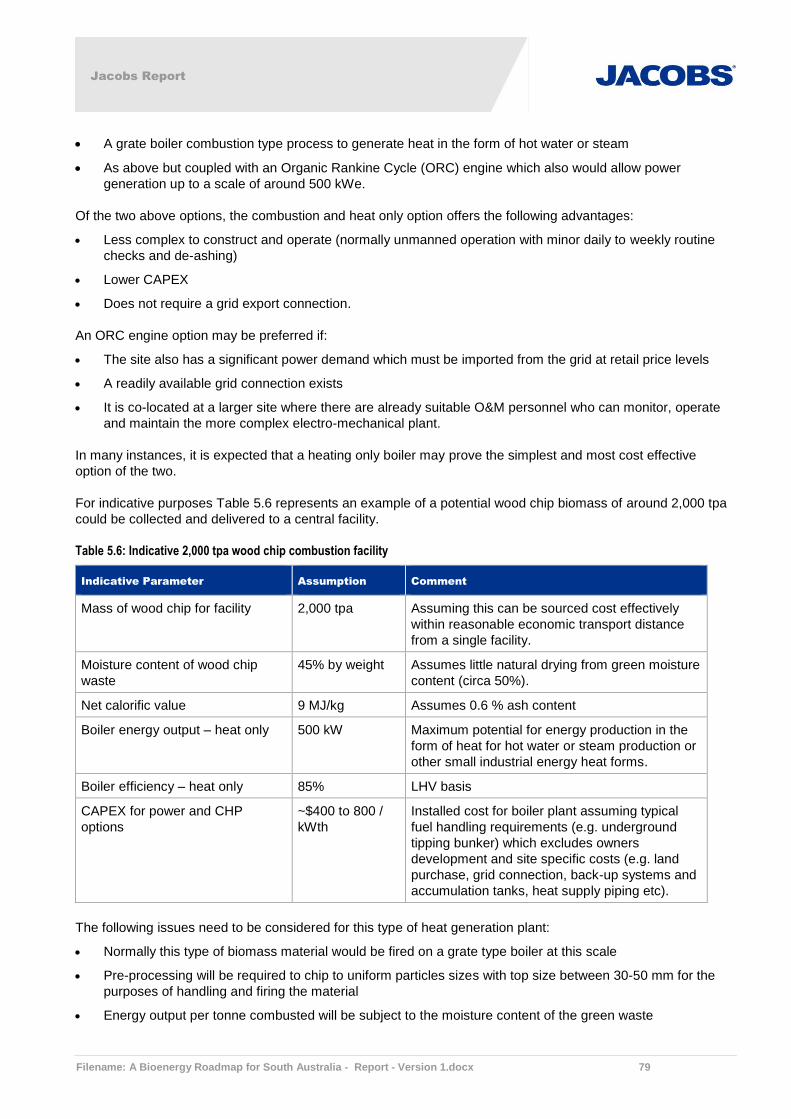
Jacobs Report
Filename: A Bioenergy Roadmap for South Australia - Report - Version 1.docx 79
A grate boiler combustion type process to generate heat in the form of hot water or steam
As above but coupled with an Organic Rankine Cycle (ORC) engine which also would allow power
generation up to a scale of around 500 kWe.
Of the two above options, the combustion and heat only option offers the following advantages:
Less complex to construct and operate (normally unmanned operation with minor daily to weekly routine
checks and de-ashing)
Lower CAPEX
Does not require a grid export connection.
An ORC engine option may be preferred if:
The site also has a significant power demand which must be imported from the grid at retail price levels
A readily available grid connection exists
It is co-located at a larger site where there are already suitable O&M personnel who can monitor, operate
and maintain the more complex electro-mechanical plant.
In many instances, it is expected that a heating only boiler may prove the simplest and most cost effective
option of the two.
For indicative purposes Table 5.6 represents an example of a potential wood chip biomass of around 2,000 tpa
could be collected and delivered to a central facility.
Table 5.6: Indicative 2,000 tpa wood chip combustion facility
Indicative Parameter Assumption Comment
Mass of wood chip for facility 2,000 tpa Assuming this can be sourced cost effectively
within reasonable economic transport distance
from a single facility.
Moisture content of wood chip
waste
45% by weight Assumes little natural drying from green moisture
content (circa 50%).
Net calorific value 9 MJ/kg Assumes 0.6 % ash content
Boiler energy output – heat only 500 kW Maximum potential for energy production in the
form of heat for hot water or steam production or
other small industrial energy heat forms.
Boiler efficiency – heat only 85% LHV basis
CAPEX for power and CHP
options
~$400 to 800 /
kWth
Installed cost for boiler plant assuming typical
fuel handling requirements (e.g. underground
tipping bunker) which excludes owners
development and site specific costs (e.g. land
purchase, grid connection, back-up systems and
accumulation tanks, heat supply piping etc).
The following issues need to be considered for this type of heat generation plant:
Normally this type of biomass material would be fired on a grate type boiler at this scale
Pre-processing will be required to chip to uniform particles sizes with top size between 30-50 mm for the
purposes of handling and firing the material
Energy output per tonne combusted will be subject to the moisture content of the green waste
Jacobs Report
Filename: A Bioenergy Roadmap for South Australia - Report - Version 1.docx 80
Biomass heating boilers generally are best running to serve a base load demand so if the demand is
variable and peaky, a peaking gas boiler or an accumulator tank may be advisable to maintain steadier
boiler operation throughout the day.
If 24/7 continuity of heat supply is required a backup boiler may be also be advisable of some sort.
5.8 Indicative Bio-methane Upgrading Project
This energy conversion technology example could be applied as an alternative to using anaerobic digester gas
in a reciprocating engine, and may be applicable at scales in excess of 500,000 to 1 million normal cubic meters
of gas per annum. Bio-gas produced from AD is made up of between 20 to 40% CO2, and 55 to 75% CH4 plus
a number of other impurities depending on the feedstock. To make bio-methane suitable for gas network
injection or for road transport fuel use the bio-gas needs to be ‘upgraded’ to meet the engine’s specifications. It
should be noted that the gas quality necessary for the generation of electricity in stationary engines is much
lower than for gas network injection or road transport fuel and therefore the capital cost of gas upgrading can be
higher than that required to use the bio-gas in a stationary engine for power and heat production. The
economics of bio-gas gas power generation are generally more attractive than upgrading unless a significant
financial incentive exists for renewable heat or transport fuels, or capital grant funding is available. The
economics of any anaerobic digestion plant is enhanced if the facility can charge gate fees for disposal of waste
or save costs for disposal via another route such as to landfill.
Technology to upgrade bio-gas to bio-methane is well established with water scrubbing methods (around 45%
of the market share) and pressure swing adsorption (PSA) currently being the most popular. Other techniques
include organic solvent scrubbing and membrane separation. Hydrogen sulphide and moisture removal are
additional processing steps that are also normally required. Some gases may also need a siloxane removal
step.
As part of the CIVITAS SMILE programme, the Swedish city of Malmo, built a plant to upgrade bio-gas that was
produced in the sewage wastewater treatment plant to meet transport requirements. The bio-gas upgrading
plant has been running since summer 2008 and produces bio-gas equivalent to 2 million litres of petrol each
year43 (CIVITAS Website, 2009). The Adnams brewery in Suffolk was the first facility in the UK to commence
gas grid injection in 2010 and produces up to 4.8 million kWh per year of gas at grid quality44.
Technically any feedstock that can be digested to produce bio-gas with a reasonable methane content could be
used to make bio-methane. The more common applications to date include sewage bio-gas food and drink
waste, agricultural wastes and landfill gas from municipal solid waste.
The two options for bio-methane use are:
Bio-methane to natural gas standards for grid injection
Bio-methane for vehicle fuel use either as compressed or liquefied natural gas.
Of the two above options, grid injection offers the following advantages:
Less complex supply chain for end users e.g. CNG and LNG distribution and sales
Less infrastructure costs for vehicle refuelling stations.
Vehicle fuel use may be preferred if:
The organisation generating the bio-methane has a considerable demand for vehicle fuels e.g. waste
management, council fleet etc.
No readily available gas grid connection exists.
For indicative purposes, Table 5.7 represents an example of a bio-methane upgrading facility utilising around
30,000 tonnes per annum of mixed food waste and the organic fraction of MSW feedstocks, presuming this
could be collected and delivered to a central facility.

Jacobs Report
Filename: A Bioenergy Roadmap for South Australia - Report - Version 1.docx 81
Table 5.7: Indicative 30,000 tonne feedstock anaerobic digestion facility with bio-methane upgrading
Indicative Parameter Assumption Comment
Mass of AD plant feedstock 30,000 tonnes Assuming this can be sourced cost effectively
within reasonable economic transport distance
from a single facility.
Moisture content of food and
organic MSW
70% by weight Assumes mixed feedstock of food and MSW
organic fraction.
Bio-gas yield per tonne 75 Nm3 / t46 Assumes medium yields from combined waste.
Bio-methane produced 2.25 Million Nm3
/ y
Purified bio-methane volume
Equivalent energy value 81,000 GJ / y LHV basis assuming 36 MJ/Nm3
Auxiliary power consumption 450 MWh / y Assumes 0.18 to 0.22 kWh/Nm3 of raw gas,
Schmack Carbotech PSA process45.
AD plant CAPEX only ~$3-5 million46 Construction cost for production of bio-gas only
excluding engine or upgrading costs which also
exclude owner’s development and site specific
costs (e.g. land purchase, upgrading, grid
connection, vehicle refuelling equipment etc.)
Gas upgrading CAPEX only ~$2 million46 Based on CENEX Bio-methane Toolkit Data
(Euro 1 M / 300 Nm3/h of raw gas processing).
Excludes building costs.
The following issues need to be considered for this type of bio-gas upgrading plant:
Grid injection will require meeting local natural gas grid standards which may require the injection of some
larger molecule hydrocarbon gas than methane to correct the Wobbe index to match natural gas, and also
the adding of odorant for gas safety. The operators of the gas network may also have other regulatory
hurdles that need to be overcome before grid injection is legally possible.
Similarly there exist international and engine manufacturer specific vehicle fuel gas standards that an
upgraded fuel may need to meet to be used without vehicle warranty implications. A robust assessment of
available supply chain demand for suitable CNG or LNG fuelled vehicles that could consume the fuel would
also be needed in the feasibility investigations of a vehicle fuel upgrading facility.
5.9 Algae Production for Bio-fuels
The key criteria for the potential production of algae are not specific to availability of a feedstock, but rather the
availability of suitable sites and land area which have appropriate environmental conditions that promote algae
growth by photosynthesis.
In the case of algae fuels produced from natural sunlight, atmospheric carbon dioxide, and a water source
(often salt water), the ready availability of these precursors are the main criteria. It is recognised that South
Australia, particularly along coastal areas has good technical potential for the production of algae. This
production process has been in the demonstration phase since 2014 by Muradel in Whyalla, a $10.7 million and
around 1,000 litre per year of bio-crude project with core funding by ARENA ($4.4 million) and also supported
by Whyalla council and the South Australian government.47 The Muradel process grows the algae in open salt
water ponds. A significant land area allocated primarily for ponds will be required to produce algae on a large
scale.

Jacobs Report
Filename: A Bioenergy Roadmap for South Australia - Report - Version 1.docx 82
It is also possible to utilise a more engineered photo-bioreactor solution which is a series of glass vessels that
can absorb sunlight through the glass. This requires less land area, however this method is expected to have
higher capital cost than using open ponds.
An option that has also been trialled in Australia for algae production requires the co-location of the algae
production facility at a thermal power station producing a carbon dioxide rich flue gas stream. The carbon
dioxide is converted to algae biomass in enclosed photo-bioreactor vessels. This second option is understood
to be trialled at Bayswater Power station in NSW with Algaetec providing the algae production equipment.
Algaetec indicates the process requires approximately one tenth of the land area required by open ponds for a
similar production rate48. The first phase of this trial was proposed to start in 2014. A flue gas CO2 algae trial
has also been undertaken by Stanwell Corporation (formerly Tarong Energy) at Tarong Power station in
Queensland which commenced in 2009 with MBD Energy Ltd49, and utilised coal ash dam water to meet the
process water consumption needs.
Production of the algae is the first step in the process, which then needs to be converted to a useful bio-fuel
(normally liquid, although anaerobic digestion of algae is also possible to produce a bio-gas). Some conversion
processes produce a crude bio-fuel that needs refining to be useful for automotive or even jet fuel applications
based around a diesel like end product. For this method the lipids within the algae are the oil pre-cursor which
can be around 30% of the algae biomass by weight. There are also processes where the algae can produce
bio-ethanol or other alcohols through fermentation which can be used as a petrol replacement. Most
demonstration projects to date in Australia have explored bio-diesel production options.
It is noted however that in the present market, that the production of bio-fuels from algae is not considered a
commercially demonstrated technology, and the costs of production of bio-oil by this route are expected to be
higher than from conventional fossil sources. In 2010, Bloomberg New Energy Finance reported the costs of
various technologies (micro algae production in open ponds, photo-bioreactors and fermentation) for bio-fuel
production at between US$ 2 to 10 per litre50. Most projects in Australia and elsewhere in the world to date
producing algae on a more commercial basis have targeted other higher value end use applications which yield
better returns than bio-diesel production. From Jacobs’ discussions with Muradel regarding the South
Australian project, it is understood that whilst bio-crude can be produced, at present Muradel’s algae product is
more valuable to use for other applications than for the production of bio-oil. High value end products targeted
to date from algae projects have included the production of fish and animal feed, the production of Omega 3
oils, for pharmaceuticals and health supplements, cosmetics and beauty products, and also for the production of
human food and beverages.
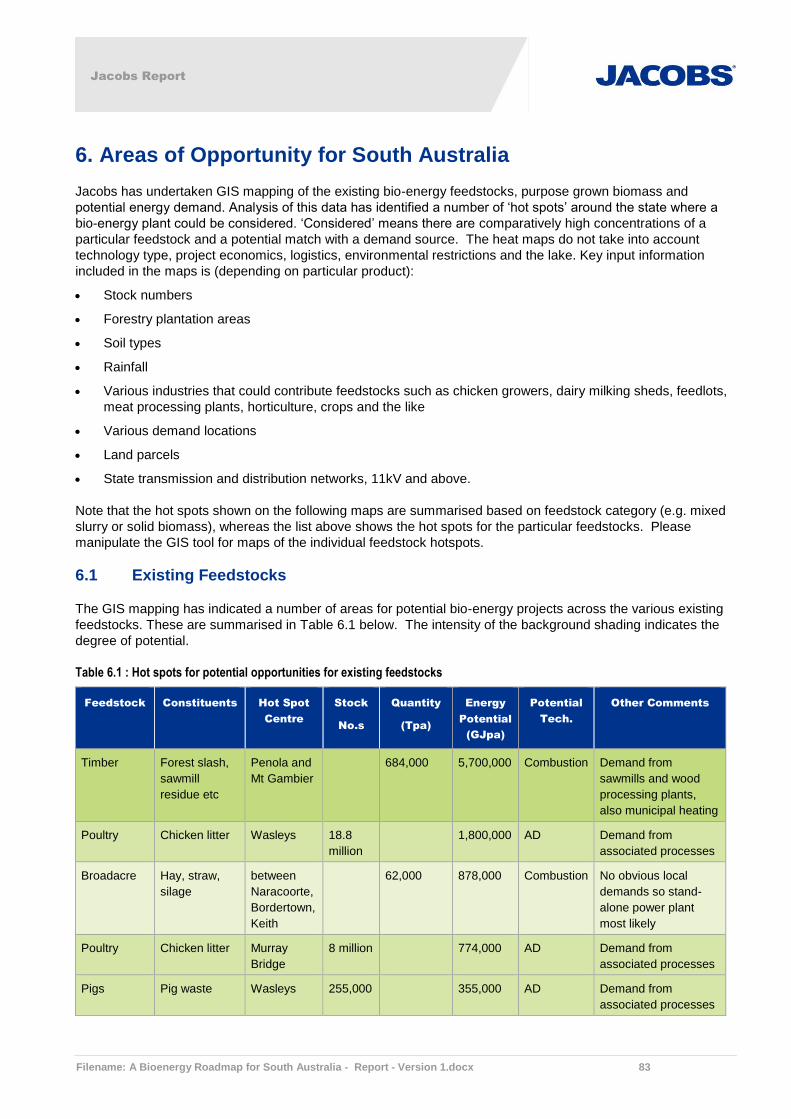
Jacobs Report
Filename: A Bioenergy Roadmap for South Australia - Report - Version 1.docx 83
6. Areas of Opportunity for South Australia
Jacobs has undertaken GIS mapping of the existing bio-energy feedstocks, purpose grown biomass and
potential energy demand. Analysis of this data has identified a number of ‘hot spots’ around the state where a
bio-energy plant could be considered. ‘Considered’ means there are comparatively high concentrations of a
particular feedstock and a potential match with a demand source. The heat maps do not take into account
technology type, project economics, logistics, environmental restrictions and the lake. Key input information
included in the maps is (depending on particular product):
Stock numbers
Forestry plantation areas
Soil types
Rainfall
Various industries that could contribute feedstocks such as chicken growers, dairy milking sheds, feedlots,
meat processing plants, horticulture, crops and the like
Various demand locations
Land parcels
State transmission and distribution networks, 11kV and above.
Note that the hot spots shown on the following maps are summarised based on feedstock category (e.g. mixed
slurry or solid biomass), whereas the list above shows the hot spots for the particular feedstocks. Please
manipulate the GIS tool for maps of the individual feedstock hotspots.
6.1 Existing Feedstocks
The GIS mapping has indicated a number of areas for potential bio-energy projects across the various existing
feedstocks. These are summarised in Table 6.1 below. The intensity of the background shading indicates the
degree of potential.
Table 6.1 : Hot spots for potential opportunities for existing feedstocks
Feedstock Constituents Hot Spot
Centre
Stock
No.s
Quantity
(Tpa)
Energy
Potential
(GJpa)
Potential
Tech.
Other Comments
Timber Forest slash,
sawmill
residue etc
Penola and
Mt Gambier
684,000 5,700,000 Combustion Demand from
sawmills and wood
processing plants,
also municipal heating
Poultry Chicken litter Wasleys 18.8
million
1,800,000 AD Demand from
associated processes
Broadacre Hay, straw,
silage
between
Naracoorte,
Bordertown,
Keith
62,000 878,000 Combustion No obvious local
demands so stand-
alone power plant
most likely
Poultry Chicken litter Murray
Bridge
8 million 774,000 AD Demand from
associated processes
Pigs Pig waste Wasleys 255,000 355,000 AD Demand from
associated processes
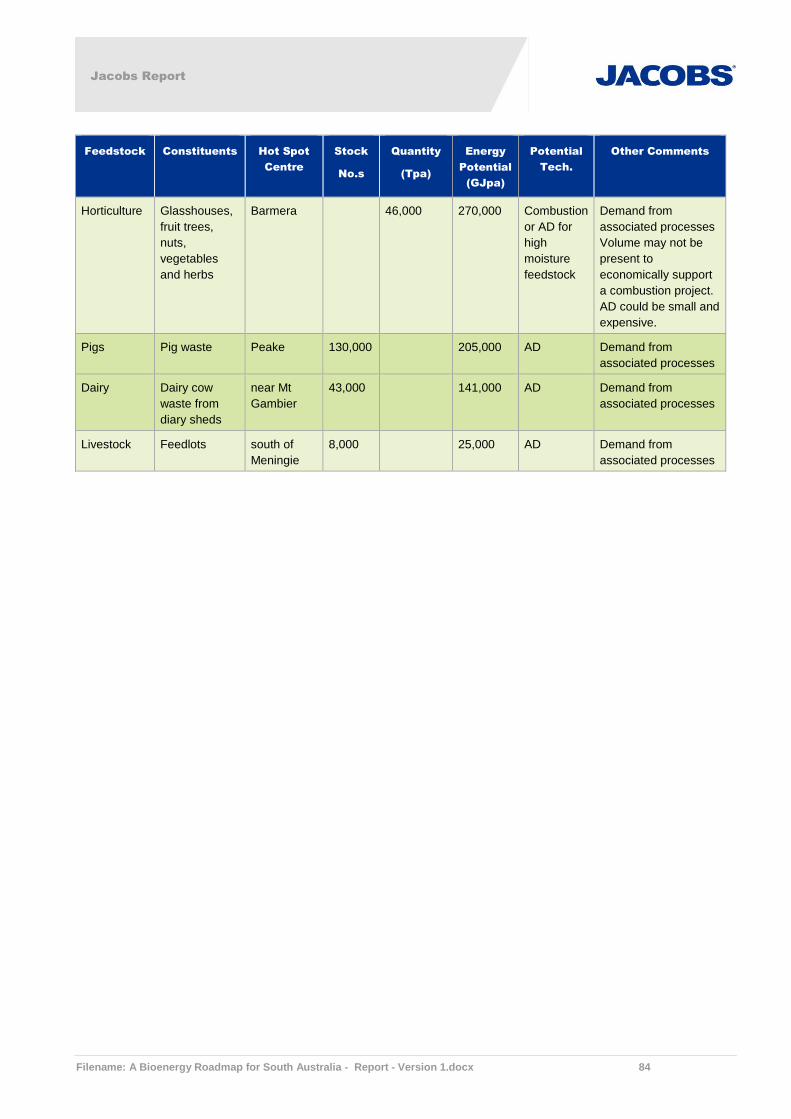
Jacobs Report
Filename: A Bioenergy Roadmap for South Australia - Report - Version 1.docx 84
Feedstock Constituents Hot Spot
Centre
Stock
No.s
Quantity
(Tpa)
Energy
Potential
(GJpa)
Potential
Tech.
Other Comments
Horticulture Glasshouses,
fruit trees,
nuts,
vegetables
and herbs
Barmera 46,000 270,000 Combustion
or AD for
high
moisture
feedstock
Demand from
associated processes
Volume may not be
present to
economically support
a combustion project.
AD could be small and
expensive.
Pigs Pig waste Peake 130,000 205,000 AD Demand from
associated processes
Dairy Dairy cow
waste from
diary sheds
near Mt
Gambier
43,000 141,000 AD Demand from
associated processes
Livestock Feedlots south of
Meningie
8,000 25,000 AD Demand from
associated processes
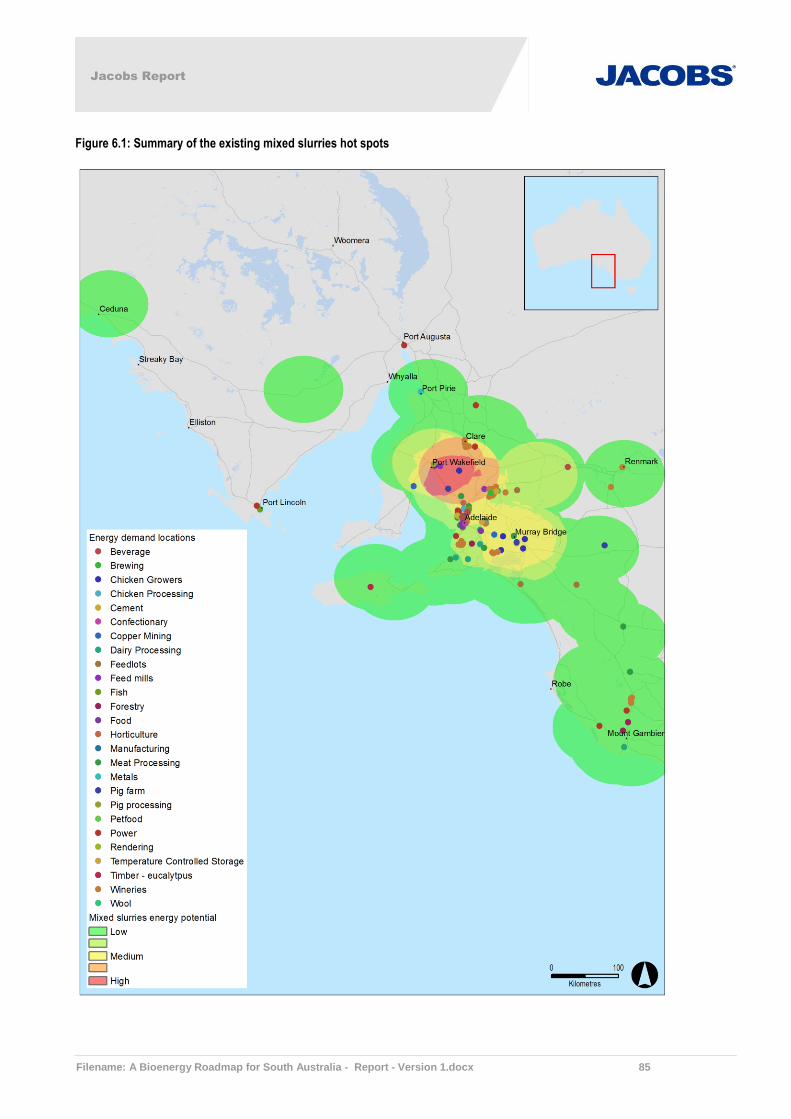
Jacobs Report
Filename: A Bioenergy Roadmap for South Australia - Report - Version 1.docx 85
Figure 6.1: Summary of the existing mixed slurries hot spots

Jacobs Report
Filename: A Bioenergy Roadmap for South Australia - Report - Version 1.docx 86
Figure 6.2: Summary of the existing solid biomass hot spots
The opportunity hot spots for the existing feedstocks is summarised in .
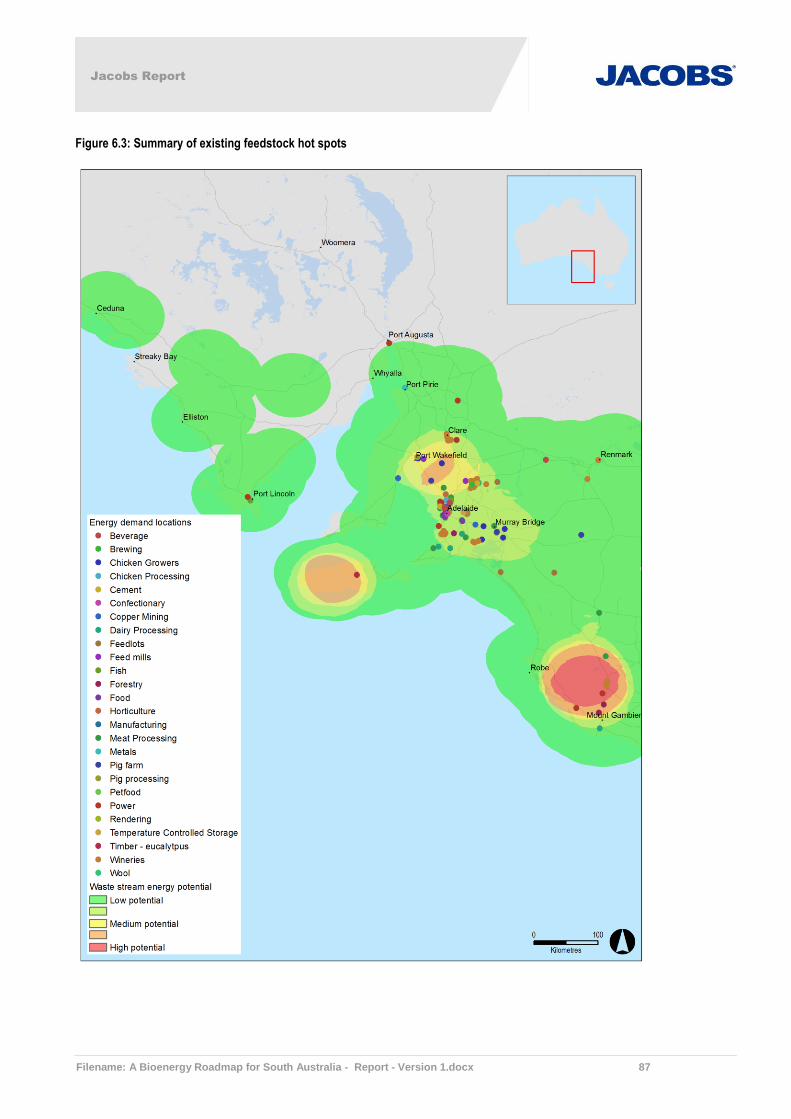
Jacobs Report
Filename: A Bioenergy Roadmap for South Australia - Report - Version 1.docx 87
Figure 6.3: Summary of existing feedstock hot spots
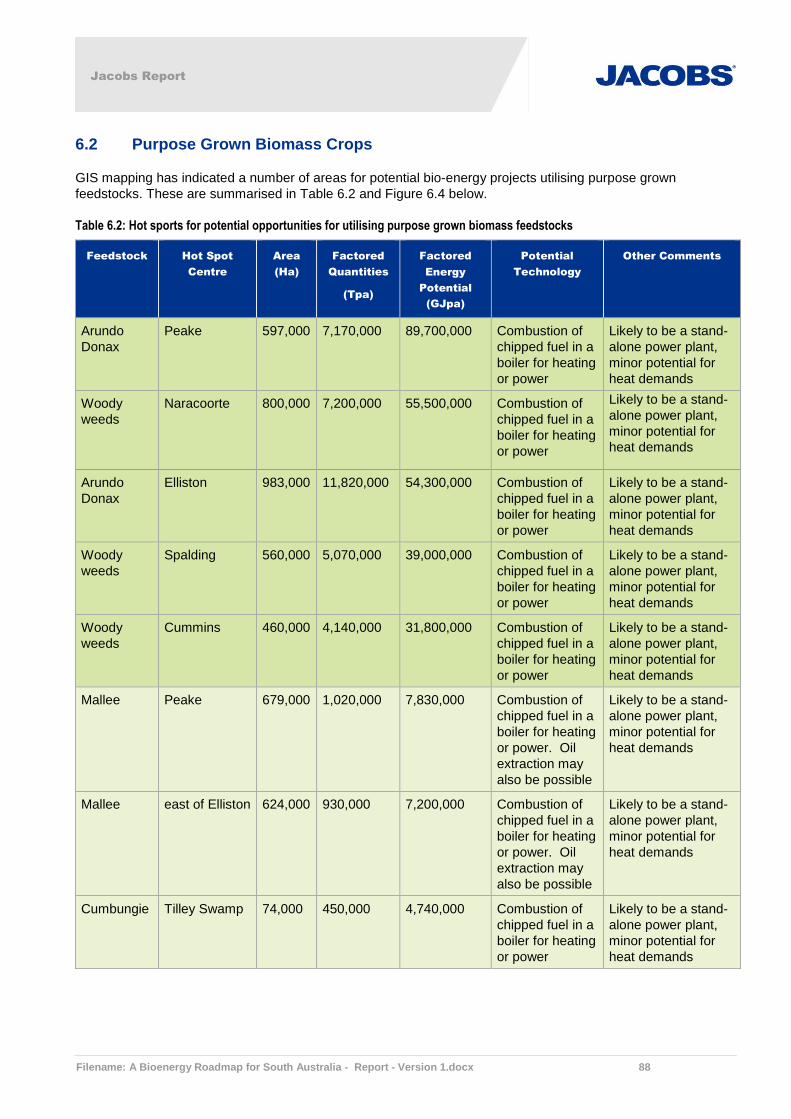
Jacobs Report
Filename: A Bioenergy Roadmap for South Australia - Report - Version 1.docx 88
6.2 Purpose Grown Biomass Crops
GIS mapping has indicated a number of areas for potential bio-energy projects utilising purpose grown
feedstocks. These are summarised in Table 6.2 and Figure 6.4 below.
Table 6.2: Hot sports for potential opportunities for utilising purpose grown biomass feedstocks
Feedstock Hot Spot
Centre
Area
(Ha)
Factored
Quantities
(Tpa)
Factored
Energy
Potential
(GJpa)
Potential
Technology
Other Comments
Arundo
Donax
Peake 597,000 7,170,000 89,700,000 Combustion of
chipped fuel in a
boiler for heating
or power
Likely to be a stand-
alone power plant,
minor potential for
heat demands
Woody
weeds
Naracoorte 800,000 7,200,000 55,500,000 Combustion of
chipped fuel in a
boiler for heating
or power
Likely to be a stand-
alone power plant,
minor potential for
heat demands
Arundo
Donax
Elliston 983,000 11,820,000 54,300,000 Combustion of
chipped fuel in a
boiler for heating
or power
Likely to be a stand-
alone power plant,
minor potential for
heat demands
Woody
weeds
Spalding 560,000 5,070,000 39,000,000 Combustion of
chipped fuel in a
boiler for heating
or power
Likely to be a stand-
alone power plant,
minor potential for
heat demands
Woody
weeds
Cummins 460,000 4,140,000 31,800,000 Combustion of
chipped fuel in a
boiler for heating
or power
Likely to be a stand-
alone power plant,
minor potential for
heat demands
Mallee Peake 679,000 1,020,000 7,830,000 Combustion of
chipped fuel in a
boiler for heating
or power. Oil
extraction may
also be possible
Likely to be a stand-
alone power plant,
minor potential for
heat demands
Mallee east of Elliston 624,000 930,000 7,200,000 Combustion of
chipped fuel in a
boiler for heating
or power. Oil
extraction may
also be possible
Likely to be a stand-
alone power plant,
minor potential for
heat demands
Cumbungie Tilley Swamp 74,000 450,000 4,740,000 Combustion of
chipped fuel in a
boiler for heating
or power
Likely to be a stand-
alone power plant,
minor potential for
heat demands
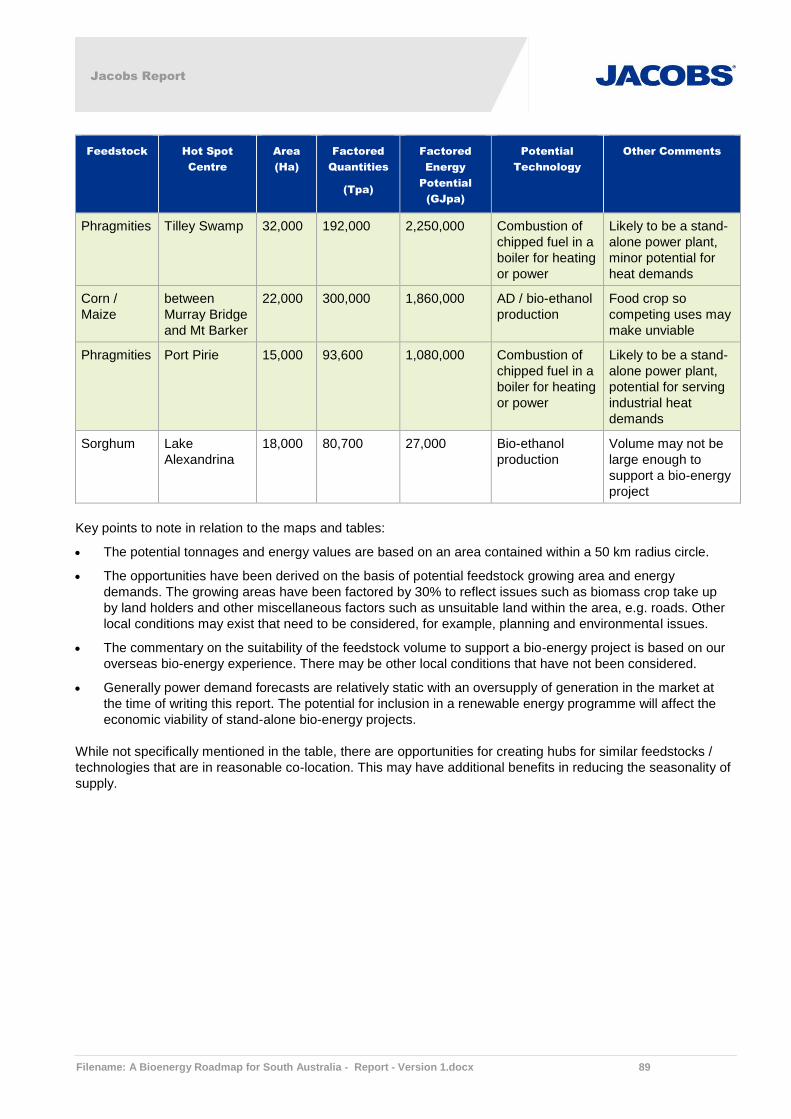
Jacobs Report
Filename: A Bioenergy Roadmap for South Australia - Report - Version 1.docx 89
Feedstock Hot Spot
Centre
Area
(Ha)
Factored
Quantities
(Tpa)
Factored
Energy
Potential
(GJpa)
Potential
Technology
Other Comments
Phragmities Tilley Swamp 32,000 192,000 2,250,000 Combustion of
chipped fuel in a
boiler for heating
or power
Likely to be a stand-
alone power plant,
minor potential for
heat demands
Corn /
Maize
between
Murray Bridge
and Mt Barker
22,000 300,000 1,860,000 AD / bio-ethanol
production
Food crop so
competing uses may
make unviable
Phragmities Port Pirie 15,000 93,600 1,080,000 Combustion of
chipped fuel in a
boiler for heating
or power
Likely to be a stand-
alone power plant,
potential for serving
industrial heat
demands
Sorghum Lake
Alexandrina
18,000 80,700 27,000 Bio-ethanol
production
Volume may not be
large enough to
support a bio-energy
project
Key points to note in relation to the maps and tables:
The potential tonnages and energy values are based on an area contained within a 50 km radius circle.
The opportunities have been derived on the basis of potential feedstock growing area and energy
demands. The growing areas have been factored by 30% to reflect issues such as biomass crop take up
by land holders and other miscellaneous factors such as unsuitable land within the area, e.g. roads. Other
local conditions may exist that need to be considered, for example, planning and environmental issues.
The commentary on the suitability of the feedstock volume to support a bio-energy project is based on our
overseas bio-energy experience. There may be other local conditions that have not been considered.
Generally power demand forecasts are relatively static with an oversupply of generation in the market at
the time of writing this report. The potential for inclusion in a renewable energy programme will affect the
economic viability of stand-alone bio-energy projects.
While not specifically mentioned in the table, there are opportunities for creating hubs for similar feedstocks /
technologies that are in reasonable co-location. This may have additional benefits in reducing the seasonality of
supply.

Jacobs Report
Filename: A Bioenergy Roadmap for South Australia - Report - Version 1.docx 90
Figure 6.4: Summary of purpose grown biomass hot spots

Jacobs Report
Filename: A Bioenergy Roadmap for South Australia - Report - Version 1.docx 91
Key points to note in relation to the maps and table for purpose grown crops:
The potential tonnages and energy values are based on an area contained within a 50 km radius circle
The tonnages are theoretical and do not consider alternative uses or economic viability
The opportunities have been derived on the basis of feedstocks and energy demands. Other local
conditions may exist that need to be considered, for example, planning and environmental issues
The commentary on the suitability of the feedstock volume to support a bio-energy project is based on our
overseas bio-energy experience. There may be other local conditions that have not been considered
Generally power demand forecasts are relatively static with an oversupply of generation in the market at
the time of writing this report. The potential for inclusion in a renewable energy programme will affect the
economic viability of stand-alone bio-energy projects.
While not specifically mentioned in the table, there are opportunities for creating hubs for similar feedstocks /
technologies. For example, AD hubs could be created in the south east of the state and north of Adelaide by
combining poultry, dairy, piggery and feedlot waste streams.
Jacobs Report
Filename: A Bioenergy Roadmap for South Australia - Report - Version 1.docx 92
7. Conclusions and Recommendations
There is considerable up-take of bio-energy worldwide and, to a lesser extent, in Australia. However uptake in
SA is presently low. There are many well established conversion technologies and so technology risk is not a
major deterrent to developing projects in SA.
There is a regional demand for and potential to supply additional energy. Industries that could benefit or
expand from the opportunity include:
Horticulture – heating
Intensive industries (e.g. chickens and pigs) – process heating and electricity generation
Processing plants – heating and power generation
Processing hubs – heating
Forestry processing – heating and power generation
Our investigation has shown that there are both untapped existing and potential sources of biomass. These
sources have been identified on a geographic basis that has led to the identification of potential bio-energy
nodes across SA. These nodes are highlighted in Table 6.1and Table 6.2
The feasibility of utilising these sources has not been investigated and further work including consultation with
stakeholders is a logical next step to determine:
If the sources have been adequately characterised – and do, in fact, exist
The barriers to use of the sources
What other uses of the land / products would be displaced if the biomass was produced and used for bio-
energy
The environmental and social impacts of growing and utilising these sources
The economics of bio-energy projects including the value of the unconverted biomass and hence the
likelihood of landowners using their land to grow additional biomass or to divert wastes from existing uses.

Jacobs Report
Filename: A Bioenergy Roadmap for South Australia - Report - Version 1.docx 93
Appendix A. GIS User Guide
Bioenergy Roadmap for SA
Web mapping application user guide
JACOBS
Flex web mapping application
Rev 1
5/08/2015
Document history and status
Revision Date Description By Review Approved
A 20/03/2015 Initial draft CJ - -
1 05/08/2015 Final issue CJ JB TJ
Distribution of copies
Revision Issue
approved
Date issued Issued to Comments
Web mapping application user guide
i
Project Name
Project no: IW0085700
Document title: Web mapping application user guide
Revision: 1
Date: 5/08/2015
Client name: Department of State Development
Client no: -
Project manager: Chris Johnson
Author: Chris Johnson
File name: \\Jacobs.com\adeprojects\IE\Projects\IW085700\Technical\Spatial_Data\Documentation\User
_guide\Flex web mapping application user guide.docx
Jacobs Group (Australia) Pty Limited
ABN 37 001 024 095
Level 6, 30 Flinders Street
Adelaide SA 5000 Australia
PO Box 8291
T +61 8 8113 5400
F +61 8 8113 5440
www.jacobs.com
COPYRIGHT: The concepts and information contained in this document are the property of Jacobs Group
(Australia) Pty Limited. Use or copying of this document in whole or in part without the written permission of Jacobs
constitutes an infringement of copyright.
Web mapping application user guide
ii
Contents
1. Introduction ................................................................................................................................................ 3
1.1 Key features .................................................................................................................................................................................... 3
1.2 Support contacts ............................................................................................................................................................................. 3
2. User access ................................................................................................................................................ 4
2.1 Login details .................................................................................................................................................................................... 4
2.2 Server details .................................................................................................................................................................................. 4
3. Using the web mapping application ........................................................................................................ 5
3.1 Using the application....................................................................................................................................................................... 5
3.2 Web application interface................................................................................................................................................................ 5
3.3 Zoom and pan tool .......................................................................................................................................................................... 6
3.4 Navigation panel ............................................................................................................................................................................. 6
3.4.1 Layer list.......................................................................................................................................................................................... 7
3.4.2 Legend tool ..................................................................................................................................................................................... 8
3.4.3 Basemap switcher........................................................................................................................................................................... 9
3.4.4 Bookmarks tool ............................................................................................................................................................................. 11
3.4.5 Enhanced draw tool ...................................................................................................................................................................... 12
3.4.6 Print tool ........................................................................................................................................................................................ 14
3.4.7 Identify tool ................................................................................................................................................................................... 15
3.4.8 Swipe spotlight tool ....................................................................................................................................................................... 16
3.4.9 HTML pop up ................................................................................................................................................................................ 17
Web mapping application user guide
3
1. Introduction
Jacobs’ web mapping application provides access to spatial data for Bioenergy roadmap SA project. The map
viewer is updated with new data as the project progresses to ensure the latest information is readily available to
the project team.
1.1 Key features
The Jacobs’ web mapping application’s key purpose is to share information across the project team. The
application is accessed via a web browser over the internet. The data is centrally stored and maintained on a
secure server.
Key features of the application include:
• Spatial data stored in a central repository that can be accessed globally via the internet for project work
• The ability to provide GIS tools and spatial data for external and internal team members who don’t have
GIS training or skills
• Access is password secured and only allows authorised users to see the project data
• Data updates are managed by GIS specialists to ensure the latest data is quickly available
• Widgets provide ability to draw, measure, edit, query, analyse data and print maps.
1.2 Support contacts
The contacts for user queries or data updates:
Chris Johnson
GIS Analyst (Jacobs)
Phone: (08) 8424 3845
E-mail: [email protected]
Hannah McInerney
Graduate GIS Analyst
Phone: (08) 8424 6578
E-mail: [email protected]

Web mapping application user guide
4
2. User access
2.1 Login details
Access to the web mapping application requires a username and password.
Username: bioenergysa_user
Password: bioenergy_315
2.2 Server details
The web mapping application and map service is hosted by Jacobs. Spatial services are provided by the
Jacobs’ Adelaide office. Maintenance performed by the Jacobs’ spatial team includes data updates, project user
creation and control, team support, web application refreshes and updates.
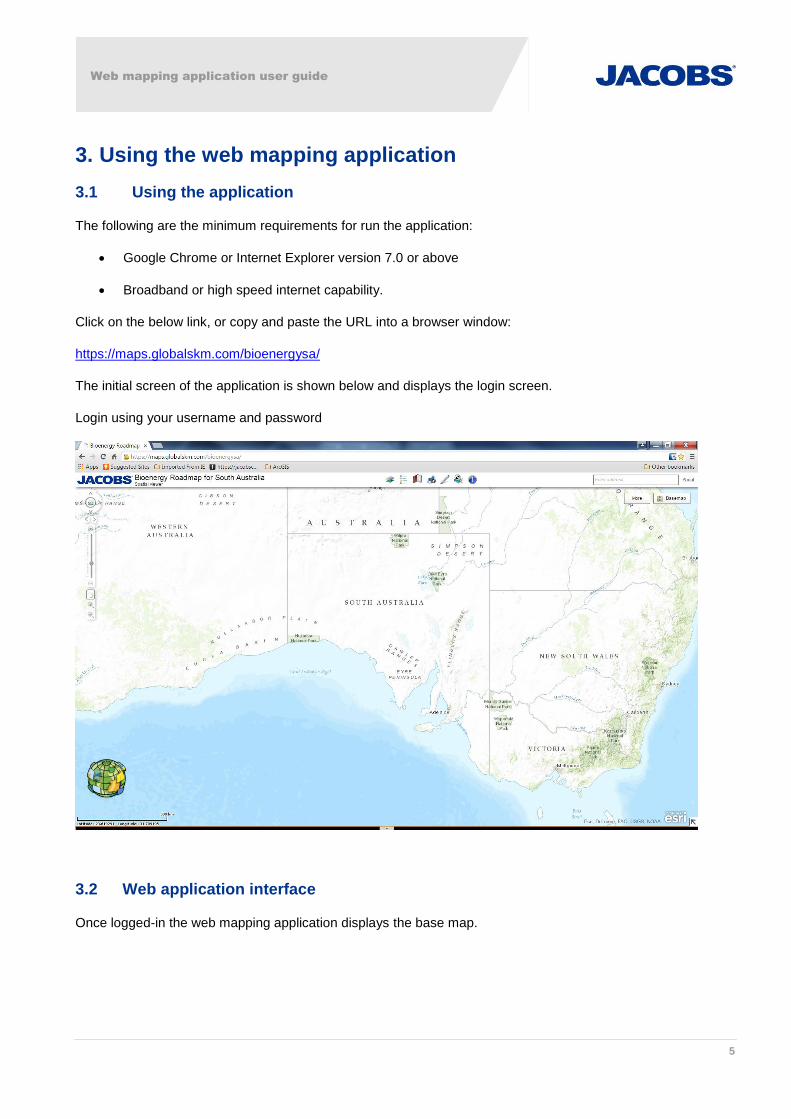
Web mapping application user guide
5
3. Using the web mapping application
3.1 Using the application
The following are the minimum requirements for run the application:
Google Chrome or Internet Explorer version 7.0 or above
Broadband or high speed internet capability.
Click on the below link, or copy and paste the URL into a browser window:
https://maps.globalskm.com/bioenergysa/
The initial screen of the application is shown below and displays the login screen.
Login using your username and password
3.2 Web application interface
Once logged-in the web mapping application displays the base map.
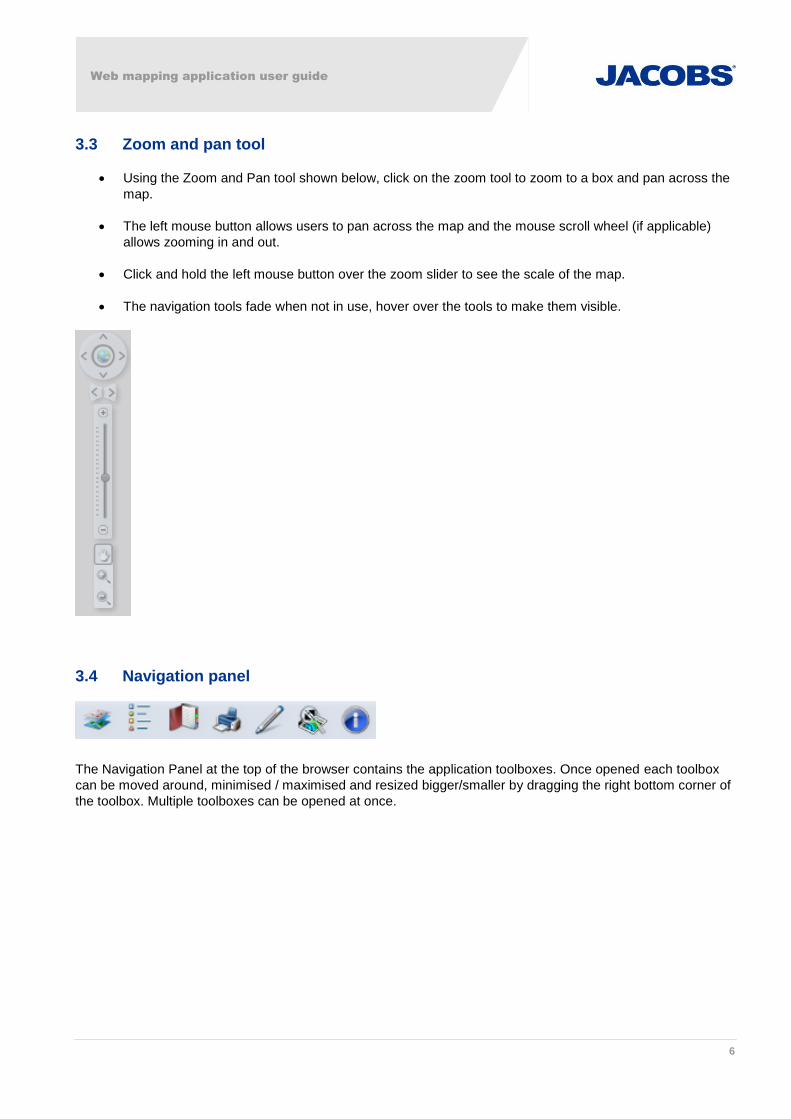
Web mapping application user guide
6
3.3 Zoom and pan tool
Using the Zoom and Pan tool shown below, click on the zoom tool to zoom to a box and pan across the
map.
The left mouse button allows users to pan across the map and the mouse scroll wheel (if applicable)
allows zooming in and out.
Click and hold the left mouse button over the zoom slider to see the scale of the map.
The navigation tools fade when not in use, hover over the tools to make them visible.
3.4 Navigation panel
The Navigation Panel at the top of the browser contains the application toolboxes. Once opened each toolbox
can be moved around, minimised / maximised and resized bigger/smaller by dragging the right bottom corner of
the toolbox. Multiple toolboxes can be opened at once.
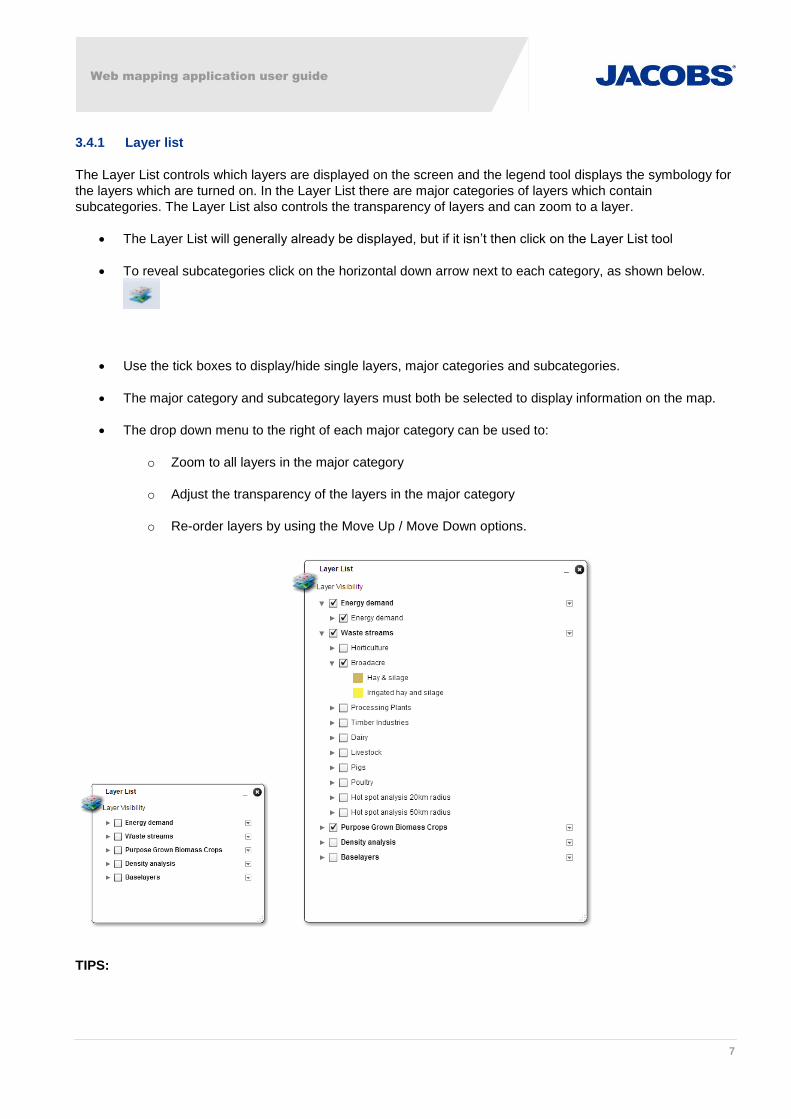
Web mapping application user guide
7
3.4.1 Layer list
The Layer List controls which layers are displayed on the screen and the legend tool displays the symbology for
the layers which are turned on. In the Layer List there are major categories of layers which contain
subcategories. The Layer List also controls the transparency of layers and can zoom to a layer.
The Layer List will generally already be displayed, but if it isn’t then click on the Layer List tool
To reveal subcategories click on the horizontal down arrow next to each category, as shown below.
Use the tick boxes to display/hide single layers, major categories and subcategories.
The major category and subcategory layers must both be selected to display information on the map.
The drop down menu to the right of each major category can be used to:
o Zoom to all layers in the major category
o Adjust the transparency of the layers in the major category
o Re-order layers by using the Move Up / Move Down options.
TIPS:
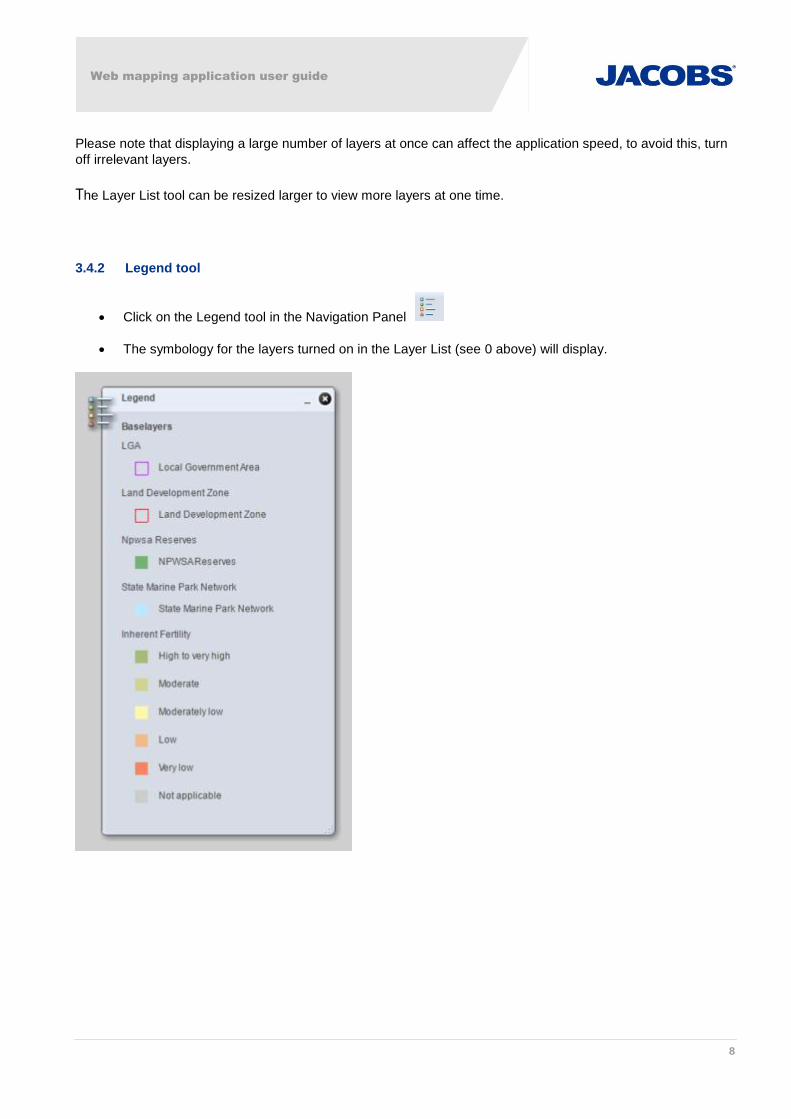
Web mapping application user guide
8
Please note that displaying a large number of layers at once can affect the application speed, to avoid this, turn
off irrelevant layers.
The Layer List tool can be resized larger to view more layers at one time.
3.4.2 Legend tool
Click on the Legend tool in the Navigation Panel
The symbology for the layers turned on in the Layer List (see 0 above) will display.
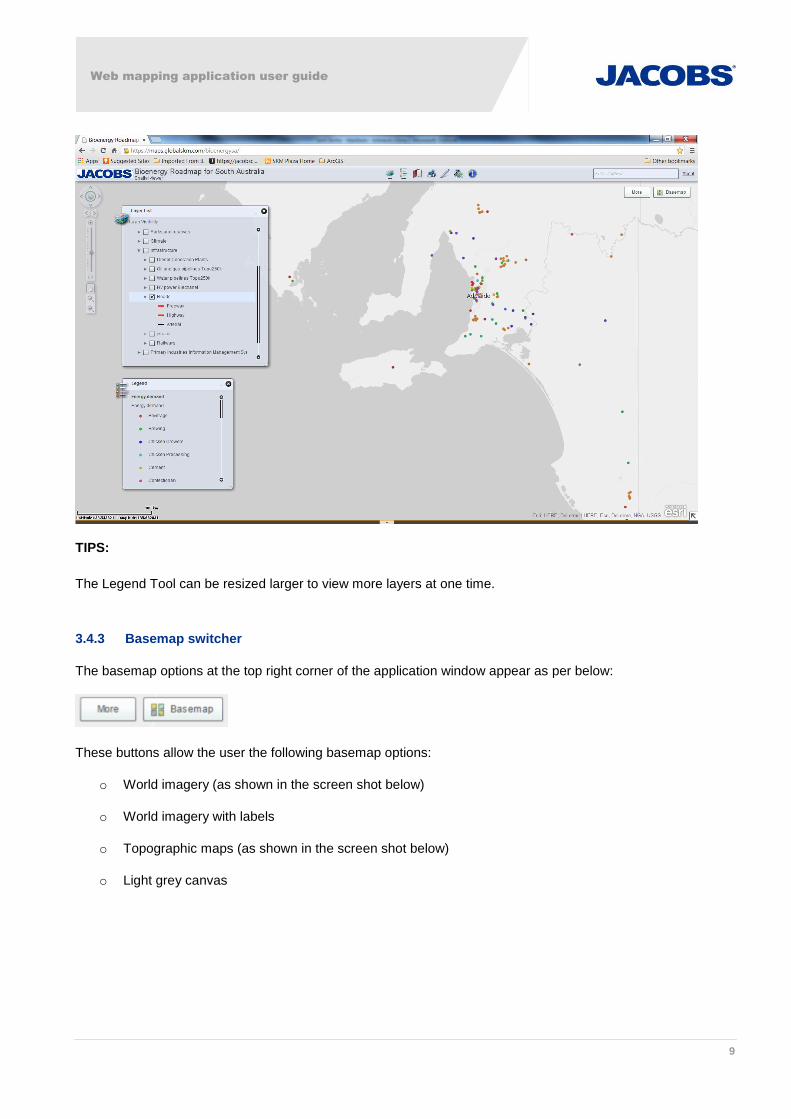
Web mapping application user guide
9
TIPS:
The Legend Tool can be resized larger to view more layers at one time.
3.4.3 Basemap switcher
The basemap options at the top right corner of the application window appear as per below:
These buttons allow the user the following basemap options:
o World imagery (as shown in the screen shot below)
o World imagery with labels
o Topographic maps (as shown in the screen shot below)
o Light grey canvas

Web mapping application user guide
10

Web mapping application user guide
11
3.4.4 Bookmarks tool
The Bookmarks tool is used to identify map extents that the user wants to save and refer to later. Bookmarks
saved in your session are available in subsequent sessions, only on the same machine under the same user
profile.
To add a bookmark to refer to the current map extent:
o Click on the Bookmarks tool in the Navigation Panel
o The Bookmark tool will pop up.
o Click on the Add Bookmark button (icon with green ‘add’ button on book)
o Name the bookmark appropriately and click Add Bookmark.
o To show all existing bookmarks click on the Bookmarks button at the top of the Bookmarks tool.
TIP:
It is good practice to name bookmarks in an appropriate and consistent manner to avoid confusion, such as the
locality/purpose of the bookmark.
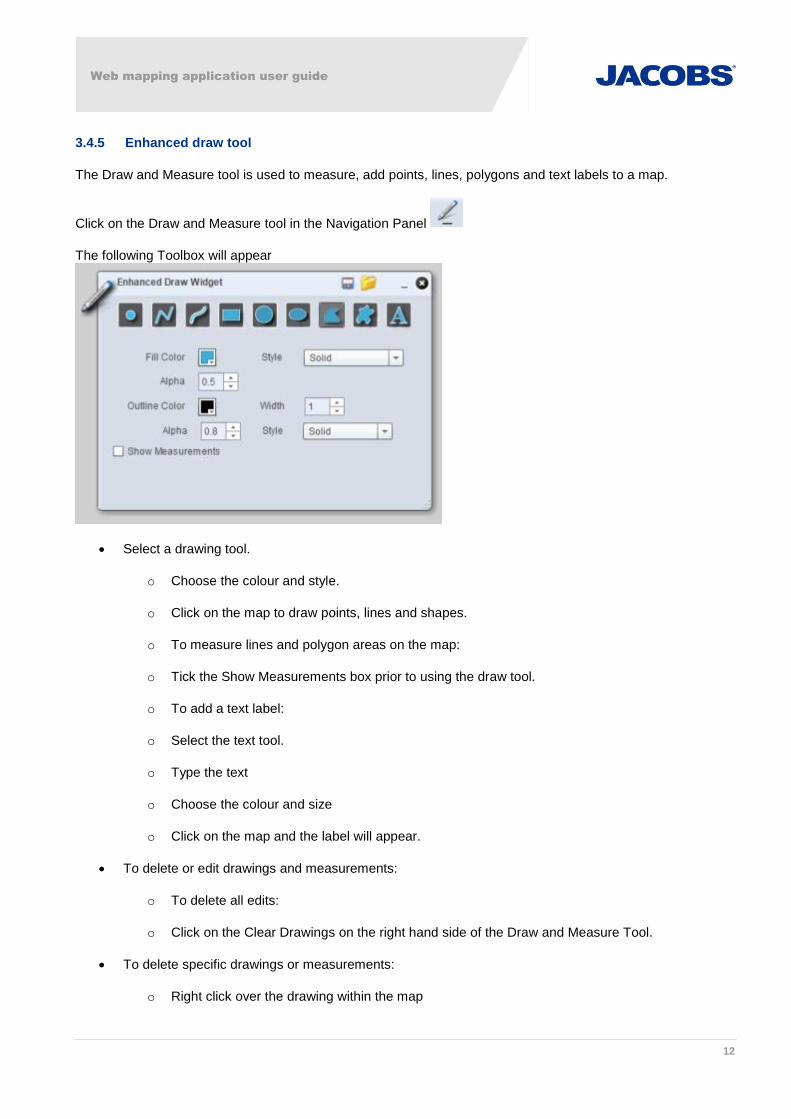
Web mapping application user guide
12
3.4.5 Enhanced draw tool
The Draw and Measure tool is used to measure, add points, lines, polygons and text labels to a map.
Click on the Draw and Measure tool in the Navigation Panel
The following Toolbox will appear
Select a drawing tool.
o Choose the colour and style.
o Click on the map to draw points, lines and shapes.
o To measure lines and polygon areas on the map:
o Tick the Show Measurements box prior to using the draw tool.
o To add a text label:
o Select the text tool.
o Type the text
o Choose the colour and size
o Click on the map and the label will appear.
To delete or edit drawings and measurements:
o To delete all edits:
o Click on the Clear Drawings on the right hand side of the Draw and Measure Tool.
To delete specific drawings or measurements:
o Right click over the drawing within the map
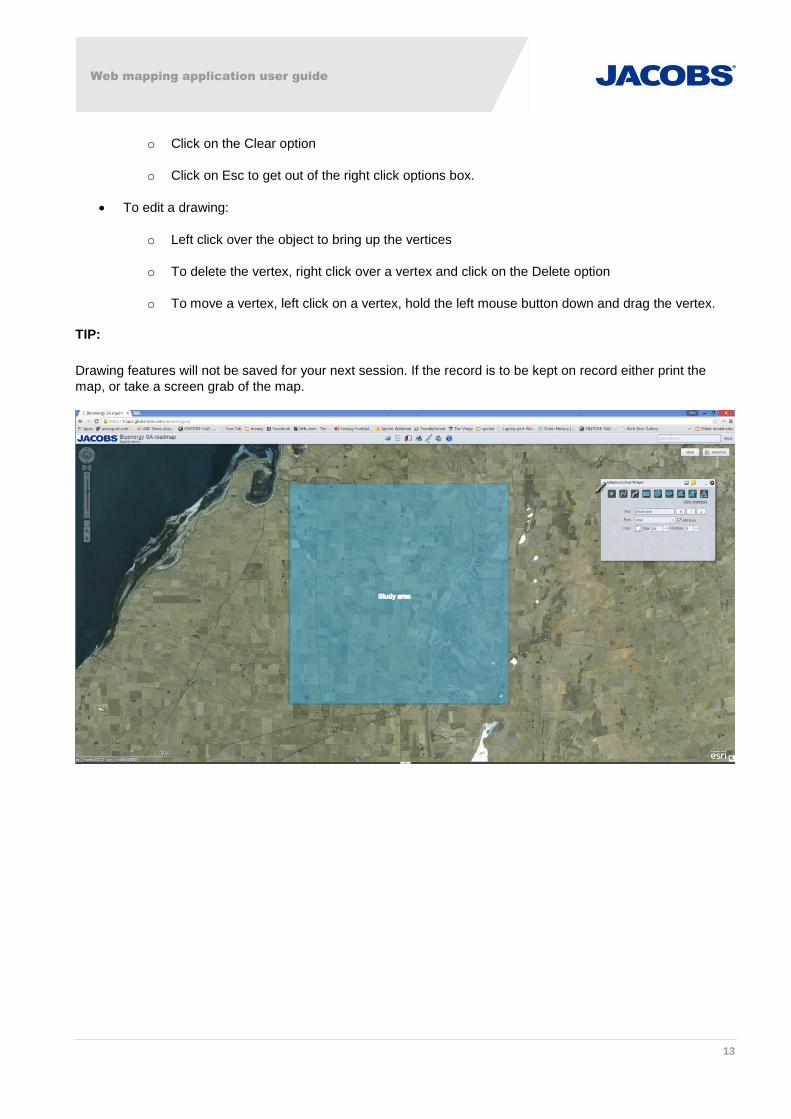
Web mapping application user guide
13
o Click on the Clear option
o Click on Esc to get out of the right click options box.
To edit a drawing:
o Left click over the object to bring up the vertices
o To delete the vertex, right click over a vertex and click on the Delete option
o To move a vertex, left click on a vertex, hold the left mouse button down and drag the vertex.
TIP:
Drawing features will not be saved for your next session. If the record is to be kept on record either print the
map, or take a screen grab of the map.

Web mapping application user guide
14
3.4.6 Print tool
The Print tool prints a copy of the screen extents, with a title and sub title.
Click on the Print tool in the Navigation Panel to create a print layout
Add the required title and author in the Print tool window.
Select a layout template in the printer window.
Select a file format.
Specify a scale if required
Click on the Print button
The map can only be printed as a PDF using this tool if you have Adobe Acrobat or PDF writer software
on your computer.

Web mapping application user guide
15
3.4.7 Identify tool
Click on the Identify tool in the Navigation Panel
Select the ‘Identify by…’ option to choose point, line rectangular polygon etc. which will be used to
select a feature/features.
Select a feature to identify

Web mapping application user guide
16
3.4.8 Swipe spotlight tool
Click on the Swipe Spotlight tool in the Navigation Panel
Use the dropdown options to select the two layers that you would like to swipe/spotlight
Select the Swipe or Spotlight option (and Spotlight Radius if relevant)
TIP:
Select Freeze Layer Mask to freeze the Swipe/Spotlight view
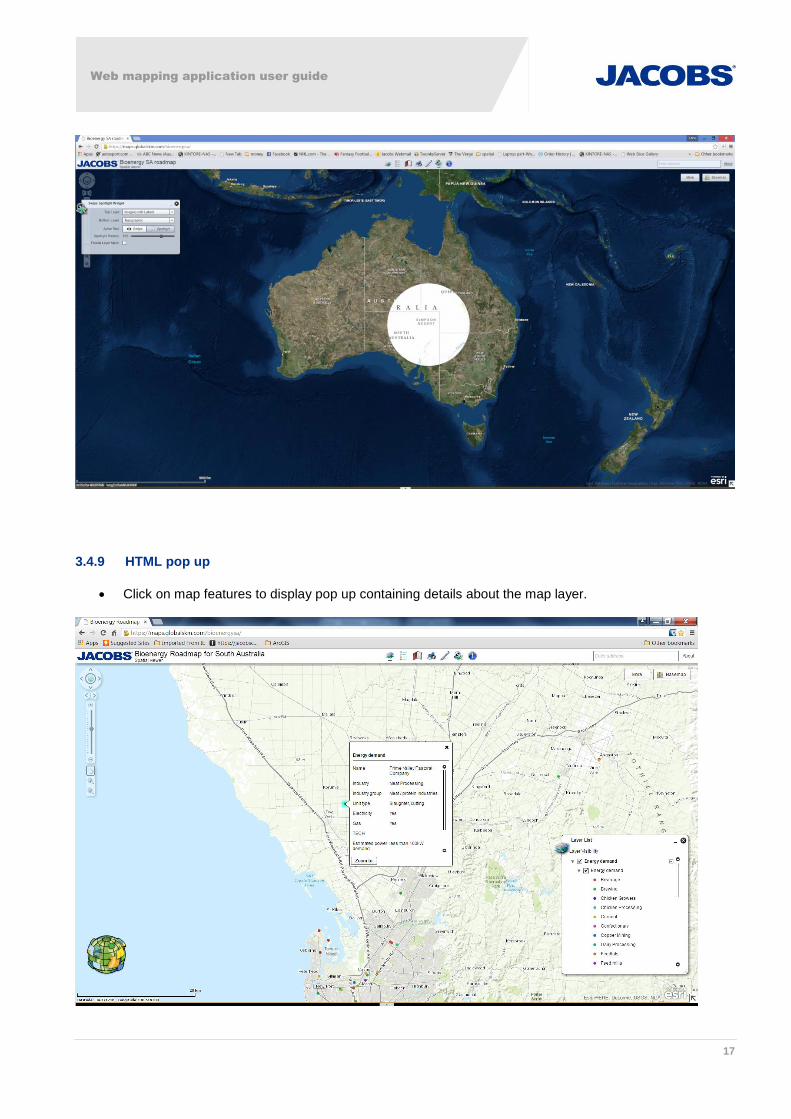
Web mapping application user guide
17
3.4.9 HTML pop up
Click on map features to display pop up containing details about the map layer.

Jacobs Report
Filename: A Bioenergy Roadmap for South Australia - Report - Version 1.docx 94
Appendix B. References
B.1 GIS Maps
Dataset Description Source
Rainfall Annual averages and monthly
averages BOM
Temperature Average temperature BOM
Land use 2008 State land use classification
(ALUM) DWLBC, 2008
Soils Soils of South Australia's
Agricultural Lands DWLBC, 2002
Gas Topo250k pipelines Topo250k
Electricity HV power Electranet tranmission lines (132
and 275 kV) Electranet
Electranet
substations Electranet substations Electranet ([email protected])
Electricity LV power SA Power Networks, distribution
lines >11 kV
SA Power Networks
Electricity
substations SA Power Networks
SA Power Networks
Major water
pipelines Topo250k pipelines Topo250k
Roads State roads DPTI, downloaded from data.sa.gov.au 18/03/2015
Railway State railways DPTI, downloaded from data.sa.gov.au 18/03/2015
Local Government
Area DPTI, downloaded from data.sa.gov.au 18/03/2015
Land Development
Zones DPTI, downloaded from data.sa.gov.au 18/03/2015
NPWSA Reserves
DEWNR, downloaded from data.sa.gov.au
18/03/2015
State Marine Park
Network State marine park network
DEWNR, downloaded from data.sa.gov.au
18/03/2015
NPWSA Properties
National park properties
DEWNR, downloaded from data.sa.gov.au
18/03/2015
Evaporation BOM
Power stations Power stations (Gas, Coal,
Wind, Diesel, Biomass)
DMITRE ([email protected])
Diesel generation
plant
Download from SARIG 25/03/2015
Roads DPTI Roads Downloaded from data.sa.gov.au 18/03/2015
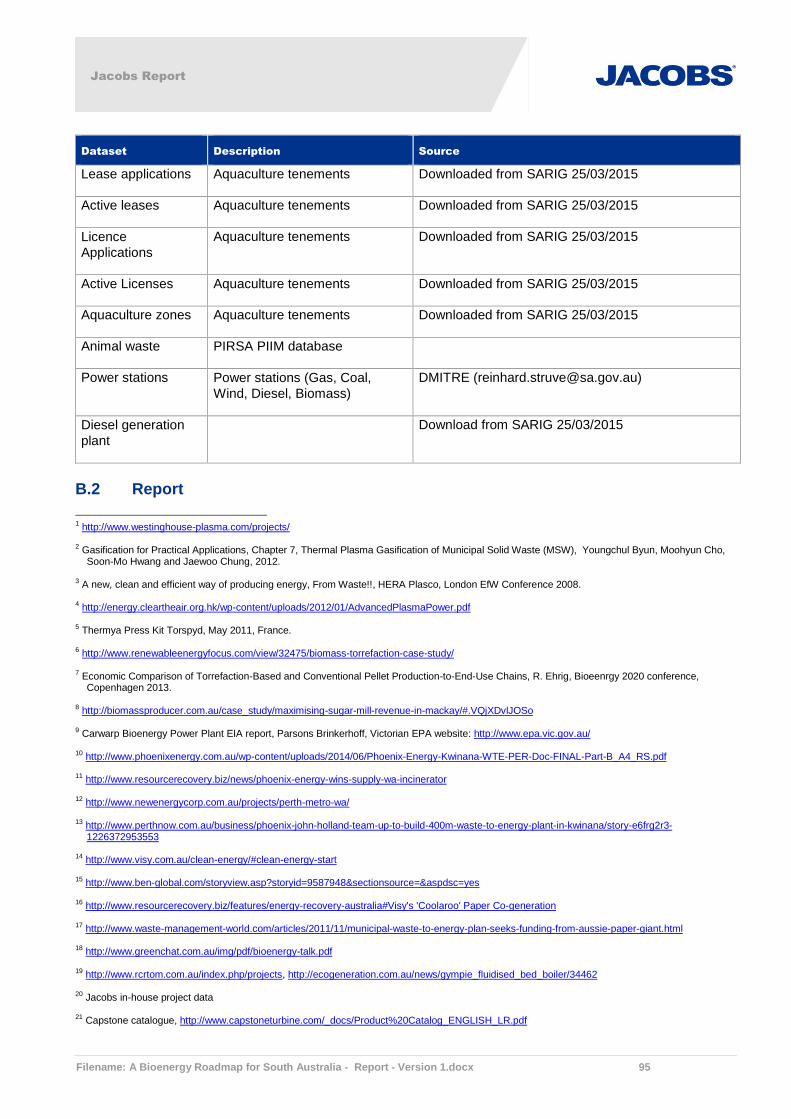
Jacobs Report
Filename: A Bioenergy Roadmap for South Australia - Report - Version 1.docx 95
Dataset Description Source
Lease applications Aquaculture tenements Downloaded from SARIG 25/03/2015
Active leases Aquaculture tenements Downloaded from SARIG 25/03/2015
Licence
Applications
Aquaculture tenements Downloaded from SARIG 25/03/2015
Active Licenses Aquaculture tenements Downloaded from SARIG 25/03/2015
Aquaculture zones Aquaculture tenements Downloaded from SARIG 25/03/2015
Animal waste PIRSA PIIM database
Power stations Power stations (Gas, Coal,
Wind, Diesel, Biomass)
DMITRE ([email protected])
Diesel generation
plant
Download from SARIG 25/03/2015
B.2 Report
1 http://www.westinghouse-plasma.com/projects/ 2 Gasification for Practical Applications, Chapter 7, Thermal Plasma Gasification of Municipal Solid Waste (MSW), Youngchul Byun, Moohyun Cho,
Soon-Mo Hwang and Jaewoo Chung, 2012. 3 A new, clean and efficient way of producing energy, From Waste!!, HERA Plasco, London EfW Conference 2008. 4 http://energy.cleartheair.org.hk/wp-content/uploads/2012/01/AdvancedPlasmaPower.pdf 5 Thermya Press Kit Torspyd, May 2011, France. 6 http://www.renewableenergyfocus.com/view/32475/biomass-torrefaction-case-study/ 7 Economic Comparison of Torrefaction-Based and Conventional Pellet Production-to-End-Use Chains, R. Ehrig, Bioeenrgy 2020 conference,
Copenhagen 2013. 8 http://biomassproducer.com.au/case_study/maximising-sugar-mill-revenue-in-mackay/#.VQjXDvlJOSo 9 Carwarp Bioenergy Power Plant EIA report, Parsons Brinkerhoff, Victorian EPA website: http://www.epa.vic.gov.au/ 10 http://www.phoenixenergy.com.au/wp-content/uploads/2014/06/Phoenix-Energy-Kwinana-WTE-PER-Doc-FINAL-Part-B_A4_RS.pdf 11 http://www.resourcerecovery.biz/news/phoenix-energy-wins-supply-wa-incinerator 12 http://www.newenergycorp.com.au/projects/perth-metro-wa/ 13 http://www.perthnow.com.au/business/phoenix-john-holland-team-up-to-build-400m-waste-to-energy-plant-in-kwinana/story-e6frg2r3-
1226372953553 14 http://www.visy.com.au/clean-energy/#clean-energy-start 15 http://www.ben-global.com/storyview.asp?storyid=9587948§ionsource=&aspdsc=yes 16 http://www.resourcerecovery.biz/features/energy-recovery-australia#Visy's 'Coolaroo' Paper Co-generation 17 http://www.waste-management-world.com/articles/2011/11/municipal-waste-to-energy-plan-seeks-funding-from-aussie-paper-giant.html 18 http://www.greenchat.com.au/img/pdf/bioenergy-talk.pdf 19 http://www.rcrtom.com.au/index.php/projects, http://ecogeneration.com.au/news/gympie_fluidised_bed_boiler/34462 20 Jacobs in-house project data 21 Capstone catalogue, http://www.capstoneturbine.com/_docs/Product%20Catalog_ENGLISH_LR.pdf
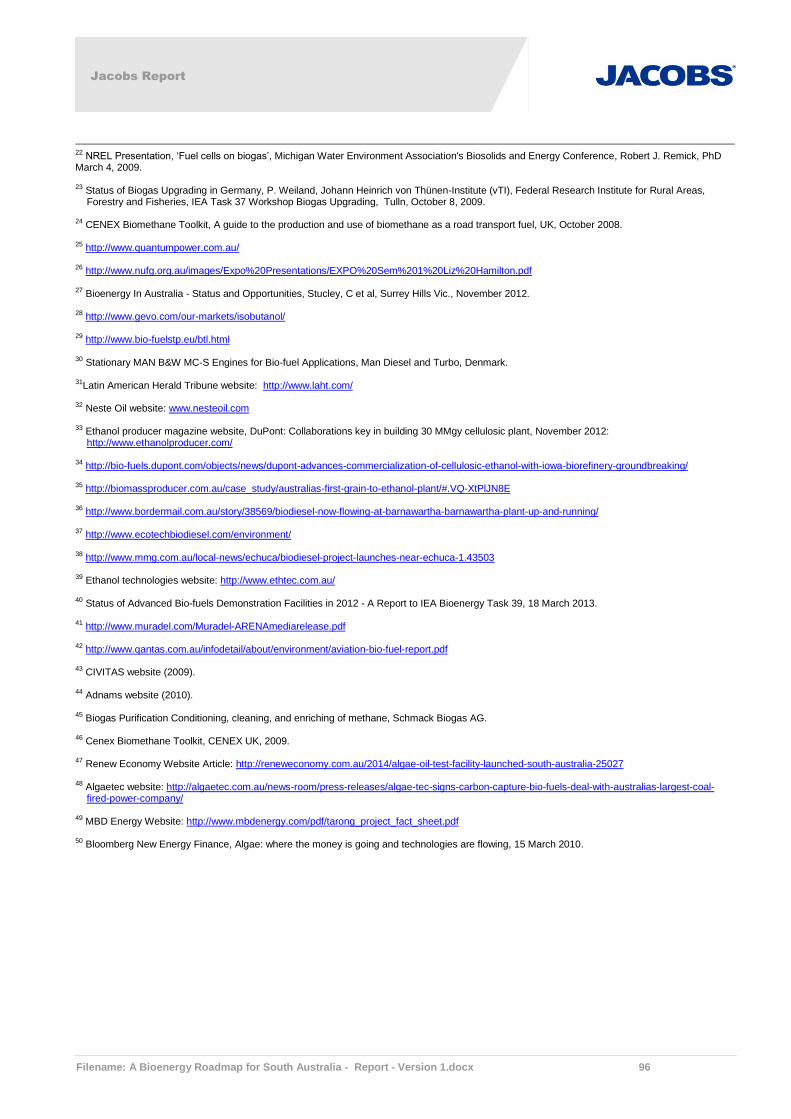
Jacobs Report
Filename: A Bioenergy Roadmap for South Australia - Report - Version 1.docx 96
22 NREL Presentation, ‘Fuel cells on biogas’, Michigan Water Environment Association's Biosolids and Energy Conference, Robert J. Remick, PhD March 4, 2009. 23 Status of Biogas Upgrading in Germany, P. Weiland, Johann Heinrich von Thünen-Institute (vTI), Federal Research Institute for Rural Areas,
Forestry and Fisheries, IEA Task 37 Workshop Biogas Upgrading, Tulln, October 8, 2009. 24 CENEX Biomethane Toolkit, A guide to the production and use of biomethane as a road transport fuel, UK, October 2008. 25 http://www.quantumpower.com.au/ 26 http://www.nufg.org.au/images/Expo%20Presentations/EXPO%20Sem%201%20Liz%20Hamilton.pdf 27 Bioenergy In Australia - Status and Opportunities, Stucley, C et al, Surrey Hills Vic., November 2012. 28 http://www.gevo.com/our-markets/isobutanol/ 29 http://www.bio-fuelstp.eu/btl.html 30 Stationary MAN B&W MC-S Engines for Bio-fuel Applications, Man Diesel and Turbo, Denmark. 31Latin American Herald Tribune website: http://www.laht.com/ 32 Neste Oil website: www.nesteoil.com 33 Ethanol producer magazine website, DuPont: Collaborations key in building 30 MMgy cellulosic plant, November 2012:
http://www.ethanolproducer.com/ 34 http://bio-fuels.dupont.com/objects/news/dupont-advances-commercialization-of-cellulosic-ethanol-with-iowa-biorefinery-groundbreaking/ 35 http://biomassproducer.com.au/case_study/australias-first-grain-to-ethanol-plant/#.VQ-XtPlJN8E 36 http://www.bordermail.com.au/story/38569/biodiesel-now-flowing-at-barnawartha-barnawartha-plant-up-and-running/ 37 http://www.ecotechbiodiesel.com/environment/ 38 http://www.mmg.com.au/local-news/echuca/biodiesel-project-launches-near-echuca-1.43503 39 Ethanol technologies website: http://www.ethtec.com.au/ 40 Status of Advanced Bio-fuels Demonstration Facilities in 2012 - A Report to IEA Bioenergy Task 39, 18 March 2013. 41 http://www.muradel.com/Muradel-ARENAmediarelease.pdf 42 http://www.qantas.com.au/infodetail/about/environment/aviation-bio-fuel-report.pdf 43 CIVITAS website (2009). 44 Adnams website (2010). 45 Biogas Purification Conditioning, cleaning, and enriching of methane, Schmack Biogas AG. 46 Cenex Biomethane Toolkit, CENEX UK, 2009. 47 Renew Economy Website Article: http://reneweconomy.com.au/2014/algae-oil-test-facility-launched-south-australia-25027 48 Algaetec website: http://algaetec.com.au/news-room/press-releases/algae-tec-signs-carbon-capture-bio-fuels-deal-with-australias-largest-coal-
fired-power-company/ 49 MBD Energy Website: http://www.mbdenergy.com/pdf/tarong_project_fact_sheet.pdf 50 Bloomberg New Energy Finance, Algae: where the money is going and technologies are flowing, 15 March 2010.