a biometric study of major body components of the slate
TRANSCRIPT
A BIOMETRIC STUDY OF MAJOR BODY COMPONENTS OF THE
SLATE-COLORED JUNCO, JUNCO HYEMALZS
CARL W. HELMS, WILLIAM H. AUSSIKER, EDWARD B. BOWER AND STEPHEN D. FRETWELL
The live wet weight of a bird is made up of several major fractions. While body weight has been. the subject of many investigations (see Baldwin and Kendeigh, 1938; Nice, 1938; Helms and Drury, 1960), carcass components have been little studied (see TurEek, 1960; Odum, Rogers, and Hicks, 1964; King, Farner, and Morton, 1965; Zimmerman, 1965). Water, protein, carbohydrate, minerals, and lipid, as well as their total, vary from species to species, from bird to bird within a species, and from time to time within an individual. Nevertheless, following classical ideas developed in mammalian studies (see Broiek, 1963), Odum et al. (1964) suggested that lean weight is relatively constant in birds in spite of gross fluctuations in body weight. This is a reasonable theory because nonfat components are, in large measure, bound to living, supporting, and insulating tissues or struc- tures while most of the lipid is stored in an inactive and dehydrated form as neutral fat that may be readily mobilized to meet the energy needs of a healthy individual. To oversimplify this situation, it could be stated that lean wet weight estimates the basic energy-requiring mass of an organism, while the weight of fat estimates the mass available to the organism as energetic reserve. For precise study, mea- surements of body cell mass, metabolism, and total energy reserves would be re- quired. However, many features of component variation are evident from gross analyses which are, therefore, of interest to students of bioenergetics.
We report here the results of a study of the body components of a cold-hardy, relatively short-distance, intracontinental migrant, the Slate-colored Junco, Junco Ityemalis, sampled within its winter range.
METHODS
EXPERIMENTAL DESIGN
During the winters of 1962-1963 and 1964-1965, 159 Slate-colored Juncos were collected near Lewisburg, Pennsylvania (table 1). With some foreknowledge of wet-weight variation in the junco (Helms and Drury, 1960), we attempted to procure 5 to 10 individuals in each month from November through February and in each half-month from March through April; in the first year, additional specimens were taken during spring migration to define more precisely weight and component changes during that season. In 1962-1963 morning and afternoon birds were taken in
relatively uniform numbers. Most of this sample was netted or trapped (89%). In 1964-1965 our primary objective was an analysis of carcass fatty acids (Bower and Helms, 1967), so that collections were limited to the afternoon hours when birds were fattest. Most of this sample was shot (83%) to avoid the use of baited traps in winter. The total sample had an afternoon bias.
EXPERIMENTAL METHODS
Collection. Birds were weighed after collection (& 0.1 g) ; fat class (fc) was determined (Helms and Drury, 1960) ; wing length was measured to the tip of the longest primary with the wing flattened and straightened; sex was estimated by cloaca1 or feather inspection; and birds were killed if collected by trap or net. Each individual was sealed in a plastic bag in the field. Within two hours collected birds were weighed in the laboratory (2 0.2 mg), resealed in a plastic bag, and frozen at -29°C. Specimens were held at this temperature two to six months before extraction.
THE CONWR, 69:560-578, 1967 [5601
BODY COMPONENTS OF THE JUNCO 561
Extraction. Birds were thawed and warmed to room temperature within their sealed bag to prevent moisture condensation, weighed (2 0.2 mg) to determine weight loss during storage, and their sex and age were determined by dissection. Specimens were refrozen, sliced in a freezer using a food mill, and quickly transferred to a weighed glass Soxhlet thimble within the freezer. Thimble and bird were then warmed to room temperature in a closed desiccator (without desiccant), weighed, dried for 72 hours under vacuum at 40” C, extracted in a Soxhlet apparatus for 12 to 18 hours with a 5:l mixture of reagent grade petroleum ether (30-60” C): reagent grade chloroform, dried under vacuum at room temperature for six hours, and weighed. Solvent was evaporated from the extracted lipids in weighed beakers or flasks with heat and then under vacuum. Extracted lipids were weighed.
Suggested modification. For birds the size of juncos, we recommend that the thawed carcass be sliced at room temperature with a razor blade to eliminate the unavoidable moisture con- densation obtained with the method as outlined above.
Calculations. Weight at capture was designated wet weight (WW). The difference between net weights before and after slicing was used to calculate a correction factor for losses which were assumed to be evenly distributed among all body components. These losses were under 5 per cent of wet weight in all cases and were less than 1 per cent in most. Weight before drying minus weight after drying (multiplied by the correction factor) plus the difference between wet weight at capture and wet weight before grinding equalled total water (TW). Weight before extraction minus weight after extraction (multiplied by the correction factor) equalled total fat (TF). Wet weight minus total fat equalled wet fat-free weight (WFFW-not treated in detail), and this value minus total water equalled dry fat-free weight (DFFW), which was also equal to the net tissue weight after extraction and drying times the correction factor. Total lipid (TL) was the corrected weight of ether-chloroform soluble material and did not differ significantly from calcu- lated total fat (d = -0.04 f 0.12 g, n = 159, P > 0.5). Total fat values are used throughout this paper. Water and fat as percentages of wet weight (W’$WW and F%WW, respectively) and water and fat indexes (WI and FI, respectively) were also calculated: W%WW = (TW/WW) . 100; F%WW = (TF/WW) . 100; WI = TW/DFFW; and FI = TF/DFFW.
Raw data were entered on Hollerith cards, and most calculations were performed using IBM
1620 and 7094 Data Processing Systems.
TERMINOLOGY
Although the term lipid includes, by circular definition, all materials soluble in lipid solvents
and the term fat may be restricted to neutral fats or triglycerides, there is no general agreement in the use of these terms. We will use them interchangeably for those materials extracted by a 5:l mixture of petroleum ether:chloroform. These materials were predominately triglycerides in the Slate-colored Junco (unpublished data).
STATISTICAL NOTATIONS AND TESTING
The statistical symbols used follow Steel and Torrie (1960). Means. Sample mean = 5; sample standard deviation = s; sample standard error (standard
deviation of the mean) = SS; coefficient of variation = CV; and sample size = 1~.
Differences. Difference between sample means = d; standard error of the difference (standard
deviation of the difference between means) = s; ; t = d/s; ; degrees of freedom = df ; probability
= P; * = 0.05 > P > 0.01; ** = 0.01 > P; and ns = P >O.OS. In preliminary tests of differences, conservative procedures were followed: s; values were
based on the assumption that variances were unequal. The resulting t’ was not distributed as Student’s t : t’ values were compared with tabulated t for dfnl where al 4 ti in most cases (critical tests were made with corrected values). This means that (Y f P (the probability of a Type Z error was equal to or less than the stated probability). This short cut reduced efficiency somewhat but seemed to be justified because we judged the seriousness of a Type Z error (false rejection of the null hypothesis) to be greater than that of a Type ZZ error (false acceptance of the null hypothesis). See Steel and Torrie (1960).
562 HELMS, AUSSIKER, BOWER, AND FRETWELL
Chi square (x’) was used to test enumeration data. Normality of fat data was tested using
the method outlined by Snedecor (1956, p. 201-202).
Regressions. Regression equations were tested and compared usi.ng the F statistic. Slopes
(b) were tested for differences using calculated t for simple linear comparisons and 0.95 confidence intervals for multiple regressions (see Steel and Torrie, 1960).
Other statistics reported include: F (used in testing equations or the partitioned sums of squares due to regression) ; df; t (used in testing the significance of regression coefficients-the
standard error of the regression coefficient is not reported because it can be obtained directly from the equation st, = b/t) ; n; P; Y (simple correlation coefficient) or ryri (partial correlation
coefficient) ; and Ra (coefficient of determination; R2 . 100 = % of explained variation). Analysis oj variance. These procedures are not reproduced-the statistics generated are repre-
sented by several symbols listed above.
Significance. The term “significant” is reserved for tested observations attributable to chance no oftener than once in 20 occurrences, i.e., 0.05 > P.
Subsamples. This designation is reserved for the monthly or half-monthly groupings of birds
within the sample, arbitrarily excluding its use for alternative groupings such as those involving
sex or time of day. For purposes of analysis, all birds collected before 1 December and after
15 March were, respectively, classed as fall and spring migrants. Individuals taken between these
dates were considered to be winter residents. These dates were chosen on the basis of previous field experience, Helms and Drury (1960)) and unpublished observations on the phenology of captives of this species.
RESULTS
SAMPLE HOMOGENEITY, BIASES, AND SEX RATIOS
Homogeneity and sample bias. In most treatments presented in this report, we have pooled data for different sexes, collection times, collection seasons or subsamples, and collection years freely and at will to illustrate general trends and differences. Note the fairly proportionate distribution of individuals within subsamples by sex, time of day, and other variables in table 1. However, pooling data for the two years needs justification because these samples were collected and processed by different operators using different collecting techniques. Since morning birds were collected only in the first season, they will be excluded from the following discussion.
We find no reason to assume that males collected in the two seasons were not from comparable populations. Dry fat-free weight and wing length did not differ in the two sets of data (respective analyses of variance: df = 1, 73 ; P > 0.1). None of the other variables measured differed significantly between the seasons (by t-tests of means). Pooling of data for males seems justified. No significant differences or major heterogeneity were introduced into sampling or processing of males by the different operators and sampling methods employed.
Among females, however, the situation is more complex. Afternoon females had significantly higher wet weights (d = 1.03 f 0.483 g, 0.05 > P > 0.02), total water (d = 0.523 * 0.216 g, P = 0.02), and dry fat-free weight (d= 0.384 2 0.118 g, 0.01 > P > 0.001) in the second season although they did not differ significantly in the other variables measured (by t-tests of means). Dry fat-free weight differed sig- nificantly between the sample years while wing length did not (respective analyses of variance: df = 1, 45 ; 0.005 > PI, P1 > 0.1). Since males and females were processed similarly within seasons, the source of these differences must have resided in sample bias or in the nature of the variances of the two samples.
BODY COMPONENTS OF THE JUNCO 563
Female subsamples were strongly biased toward migratory birds in the first season (74% of the birds but only 40% of the subsamples were taken during migra- tion) but not in the second (35% of the birds and 38% of the subsamples were taken during migration). Sample bias alone does not, however, account for the weight dif- ferences among females since spring migrants alone were 1.0 g heavier (wet weight) in the second year. A nested analysis of variance (years, subsamples within years, and birds within subsamples) indicates that the major differences in the partitioned sums of squares of wet weight were between subsamples and not years so that pooling between years is justified in spite of the mean differences between them. A similar analysis of total fat indicates parallel variability between subsamples within years, but not between years. A major source of variability in wet weight seems, therefore, to have resided in variability in fat. This does not explain the mean wet-weight difference, however, since spring migrant females were insignificantly fatter in the second year (0.13 g).
In contrast to these analyses, major variation in dry fat-free weight was between years (df = 1, 11, 0.05 > P > 0.025). Spring migrant females had higher lean dry weights (0.49 g) in the second year. In addition, they had more water (0.39 g), although here the significance of year was questionable (df = 1, 11, 0.1 > P > 0.05 ). Pooling dry fat-free weight and possibly water for females for the two samples may not be justified. However, (1) these differences were not found in males, hence did not reside in technique; moreover, (2) the test for dry fat-free weight was not highly significant when the sums of squares were partitioned, and (3) the variances were not significantly heterogeneous between years (df = 26, 19, P > 0.1). We will, therefore, pool both dry fat-free weight and total water for the two years.
The total wet-weight difference in females between years (1.0 g) can be partly accounted for by the difference in biased mean air temperature (6.4’ F; predicted wet-weight difference = 0.6 g) but the dry fat-free weight difference (0.38 g) cannot be so explained (predicted difference = 0.06 g; see equations given below). Major differences between sample years must have been due to bias from collecting technique.
Collection bias and sex ratios. In winter the different collection techniques used did not result in different sex ratios (1962-1963 sex ratio: 16 3 3 :8 0 0 ; 1964-1965 sex ratio: 24 8 8 :8 0 0 ; (0.5 > P > 0.25). The combined sex ratio (40 3 3 :16 0 0 or 5 8 3 : 2 0 0 ) departed significantly from unity (0.005 > P), indicating a pre- ponderance of males in both winter populations.
During migration, however, marked collection bias is apparent. In the first year the migrant sex ratio was 27 3 3 :34 0 0 and did not depart significantly from unity (0.5 > P > 0.25). These birds were largely netted. In the second year the migrant sex ratio was 30 8 L? : 12 0 0 and did differ from unity (P = 0.005). These birds were largely shot. If the collecting methods were identical, sex composition of migratory populations was quite different in the two years. However, it is more likely that populations were similar and differences were the result of collection technique. Shooting should bias vernal samples toward the more conspicuous singing males and mature females and away from the less conspicuous and younger females, while netting should not have this bias. Although nets might preferentially sample the more actively feeding and smaller individuals, there should not be an appreciable sex bias in their use. The actual sex ratios of migratory populations were probably close to unity.

564 HELMS, AUSSIKER, BOWER, AND FRETWELL
20
15
IO
5
go NOV DEC JAN FEB MAR APR
Figure 1. Seasonal changes in body composition and wing length. Black rectangles represent dry fat-free weight, white rectangles represent total water, and the two together represent wet fat-free weight. Stippled rectangles represent total fat. All components in each sample equal wet weight. Wing length is indicated by the upper line. (See tables 2 and 3.)
Collecting techniques need experimental examination so that biases may be evaluated if not eliminated in future studies of this type.
Summary. Males collected in the afternoon in the two years of study formed a homogeneous derived population. Females collected in the afternoon may have dif- fered in lean dry mass in the two years, but variances were not heterogeneous between the years of study in either sex, and data pooling appeared to be justified. Differences between the female samples were due to sample bias correlated with air temperature and to collection bias related to techhique in spring migration. Winter collections were relatively unbiased and males predominated (2-3 8 8 : 1 0 ). Shoot- ing was a biased technique in spring, and actual migrant sex ratios were probably close to unity in both years.
COMPONENT DIFFERENCES
By sex. Males were heavier than females (wet weight d = 1.22 _* 0.29 g, 0.001 > P; total water d = 0.70 + 0.14 g, 0.001 > P; dry fat-free weight d = 0.50 2 0.07 g, 0.001 > P) and had longer wings (wing length d = 3.6 + 0.4 mm, 0.001 > P). Females had a higher water index than males (d = 0.05 + 0.02, 0.02 > P > O.Ol), but this can be explained by the tendency of lighter birds to have relatively more water (predicted difference = 0.06; based upon the following significant regression: WI = 2.81 - 0.126DFFW k 0.113, where WI = water index and DFFW = dry fat- free weight). This was not a size-independent sex difference. There were no significant sex differences in total fat, fat as a per cent of wet weight, fat index, and visible fat.
Male-to-female ratios of mass (wet weight, total water, and dry fat-free weight) and size (wing length) were, respectively, 1.03-1.05 and 1.03 in winter and 1.05-1.07 and 1.04 in migration. Winter females tended to be relatively larger and heavier with respect to males than did migrant females. Male-to-female ratios of total fat were
’ 0.99 in winter and 0.95 in migration. Females may have been fatter than males at
BODY COMPONENTS OF THE JUNCO 565
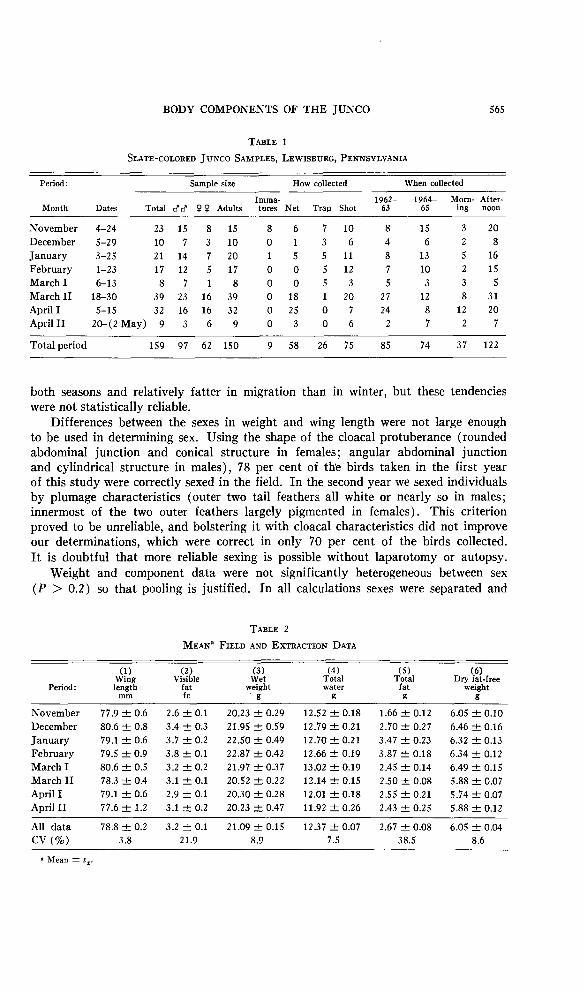
TABLE 1
SLATE-COLORED JUNCO SAMPLES, LEWISBURG, PENNSYLVANIA
Period:
Month Dates
Sample size How collected When collected
Imma- 1964- Morn- After- Total d6” 0 0 Adults tures Net Trap Shot Yz- 65 ing noon
November 4-24 23 15 8 15 8 6 7 10 8 15 3 20
December 5-29 10 7 3 10 0 1 3 6 4 6 2 8
January 3-25 21 14 7 20 1 5 5 11 8 13 5 16
February l-23 17 12 5 17 0 0 5 12 7 10 2 15
March I 6-13 8 7 1 8 0 0 5 3 5 3 3 5
March II 18-30 39 23 16 39 0 18 1 20 27 12 8 31
April I 5-15 32 16 16 32 0 25 0 7 24 8 12 20
April II 20-(2May) 9 3 6 9 0 3 0 6 2 7 2 7
Total period 159 97 62 150 9 58 26 75 85 74 37 122
both seasons and relatively fatter in migration than in winter, but these tendencies were not statistically reliable.
Differences between the sexes in weight and wing length were not large enough to be used in determining sex. Using the shape of the cloaca1 protuberance (rounded abdominal junction and conical structure in females; angular abdominal junction and cylindrical structure in males), 78 per cent of the birds taken in the first year of this study were correctly sexed in the field. In the second year we sexed individuals by plumage characteristics (outer two tail feathers all white or nearly so in males; innermost of the two outer feathers largely pigmented in females). This criterion proved to be unreliable, and bolstering it with cloaca1 characteristics did not improve our determinations, which were correct in only 70 per cent of the birds collected. It is doubtful that more reliable sexing is possible without laparotomy or autopsy.
Weight and component data were not significantly heterogeneous between sex (P > 0.2) so that pooling is justified. In all calculations sexes were separated and
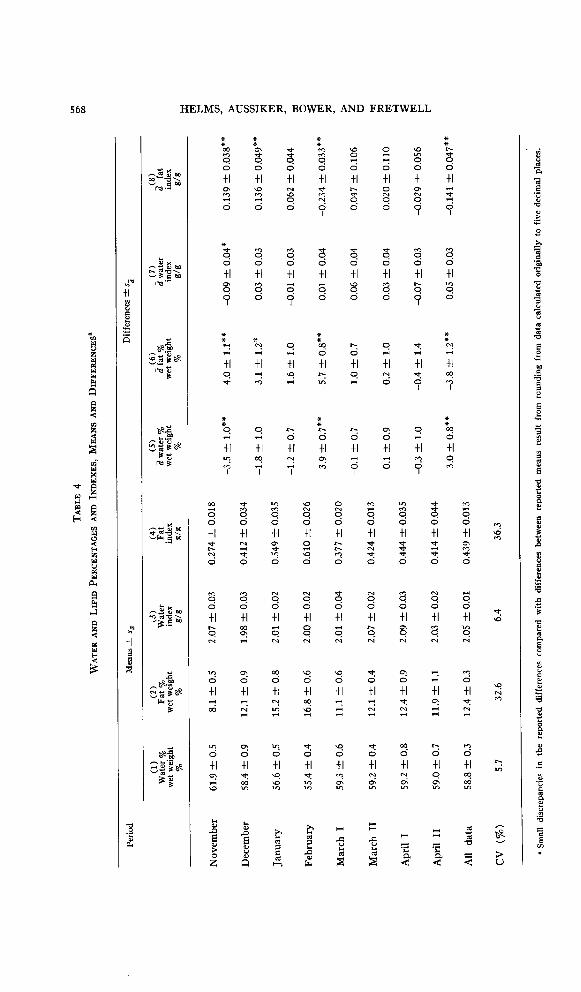
TABLE 2
MEAN’ FIELD AND EXTRACTION DATA
Period:
(1) Wing length
mm
(2)
%Y fc
(3) wet
weight g
(4) Total water
K
(5) Total
fat K
(6) Dry fat-free
weight K
November December January February March I March II April I April II
77.9 k 0.6 80.6 -+ 0.8 79.1 k 0.6 79.5 f 0.9 80.6 2 0.5 78.3 +- 0.4 79.1 + 0.6 77.6 XL 1.2
2.6 +- 0.1 20.23 2 0.29 12.52 f 0.18 1.66 r 0.12
3.4 * 0.3 21.95 2 0.59 12.79 k 0.21 2.70 f 0.27
3.7 f 0.2 22.50 f 0.49 12.70 2 0.21 3.47 k 0.23
3.8 f 0.1 22.87 + 0.42 12.66 2 0.19 3.87 + 0.18
3.2 2 0.2 21.97 -I- 0.37 13.02 k 0.19 2.45 e 0.14
3.1 * 0.1 20.52 k 0.22 12.14 f 0.15 2.50 k 0.08
2.9 -+ 0.1 20.30 +- 0.28 12.01 & 0.18 2.55 2 0.21
3.1 t 0.2 20.23 f 0.47 11.92 -c 0.26 2.43 k 0.25
6.05 2 0.10
6.46 rf: 0.16
6.32 f 0.13
6.34 -+ 0.12
6.49 2 0.15
5.88 k 0.07
5.74 f 0.07
5.88 & 0.12
All data 78.8 k 0.2 3.2 2 0.1 21.09 2 0.15 12.37 f 0.07 2.67 ? 0.08 6.05 2 0.04 CV (%) 3.8 21.9 8.9 7.5 38.5 8.6
566 HELMS, AUSSIKER, BOWER, AND FRETWELL
65
60
’ - % 55 W%WW
F%WW120
1.5 - NOV DEC JAN FEB MAR APR
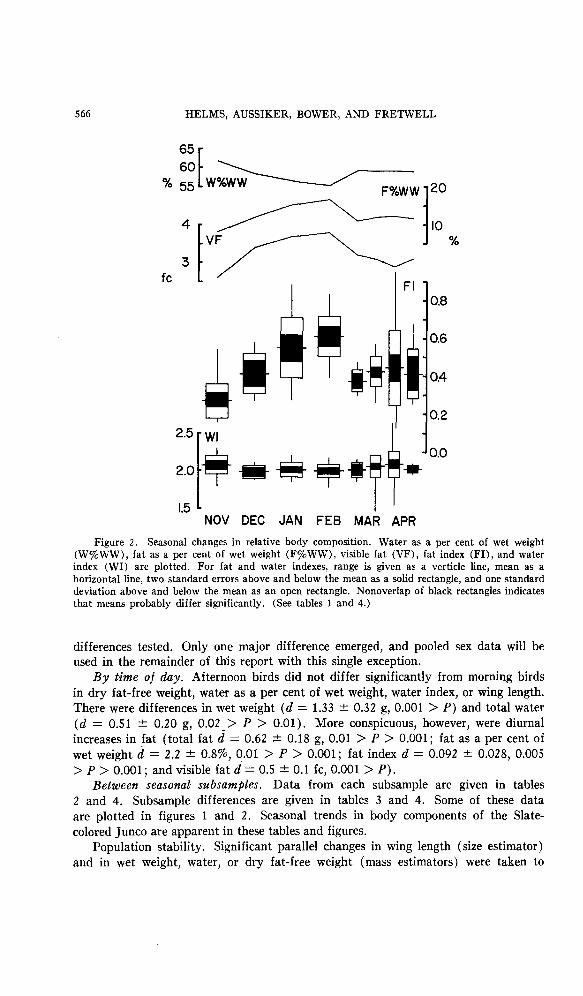
Figure 2. Seasonal changes in relative body composition. Water as a per cent of wet weight (WSWW), fat as a per cent of wet weight (F%WW), visible fat (VF), fat index (FI), and water index (WI) are plotted. For fat and water indexes, range is given as a verticle line, mean as a horizontal line, two standard errors above and below the mean as a solid rectangle, and one standard deviation above and below the mean as an open rectangle. Nonoverlap of black rectangles indicates that means probably differ significantly. (See tables 1 and 4.)
differences tested. Only one major difference emerged, and pooled sex data will be used in the remainder of this report with this single exception.
By time of day. Afternoon birds did not differ significantly from morning birds in dry fat-free weight, water as a per cent of wet weight, water index, or wing length. There were differences in wet weight (d = 1.33 -+ 0.32 g, 0.001 > P) and total water (2 = 0.51 -+ 0.20 g, 0.02_> P > 0.01). More conspicuous, however, were diurnal increases in fat (total fat d = 0.62 f 0.18 g, 0.01 > P > 0.001; fat as a per cent of wet weight d = 2.2 * 0.8%, 0.01 > P > 0.001; fat index d = 0.092 f 0.028, 0.005 > P > 0.001; and visible fat d = 0.5 + 0.1 fc, 0.001 > P).
Between seasonal subsamples. Data from each subsample are given in tables 2 and 4. Subsample differences are given in tables 3 and 4. Some of these data are plotted in figures 1 and 2. Seasonal trends in body components of the Slate- colored Junco are apparent in these tables and figures.
Population stability. Significant parallel changes in wing length (size estimator) and in wet weight, water, or dry fat-free weight (mass estimators) were taken to
BODY COMPONENTS OF THE JUNCO 567
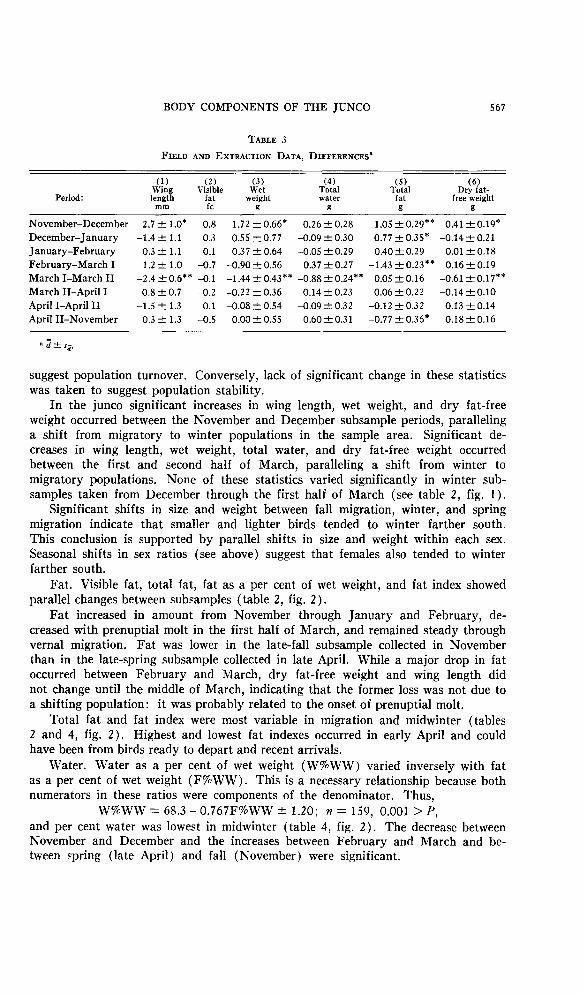
TABLE 3
FIELD AND EXTRACTION DATA, DIFFERENCES’
November-December
December-January
January-February
February-March I
March I-March II
March II-April I
April I-April II
April II-November
Period:
(1) (2) (3) (4) (61 Wing Visible wet Total T% Dry fat- length
‘i”,’ weight water fat free weight
mm g g g g
2.7 zk 1.0* 0.8 1.72 k 0.66* 0.26 k 0.28 1.05~0.29** 0.41 kO.19’
-1.4k 1.1 0.3 0.55 r+ 0.77 -0.09 f 0.30 0.77 f 0.35* -0.14 +- 0.21
0.3 -c 1.1 0.1 0.37 k 0.64 -0.05 2 0.29 0.40 rf; 0.29 0.01 2 0.18
1.2 f 1.0 -0.7 -0.90 k 0.56 0.3720.27 -1.43 k 0.23** 0.16 ‘-c 0.19
-2.4-+0.6*’ -0.1 -1.44?0.43** -0.88f0.24** 0.0520.16 -0.61?0.17**
0.8 -+ 0.7 -0.2 -0.22 f 0.36 -0.14 & 0.23 0.06 k 0.22 -0.14 k 0.10
-1.5 * 1.3 0.1 -0.08 k 0.54 -0.09 f 0.32 -0.12 2 0.32 0.13 ‘-c 0.14
0.3 f 1.3 -0.5 0.00 2 0.55 0.60 -t 0.31 -0.77 k 0.36’ 0.18 rt 0.16
suggest population turnover. Conversely, lack of significant change in these statistics was taken to suggest population stability.
In the junco significant increases in wing length, wet weight, and dry fat-free weight occurred between the November and December subsample periods, paralleling a shift from migratory to winter populations in the sample area. Significant de- creases in wing length, wet weight, total water, and dry fat-free weight occurred between the first and second half of March, paralleling a shift from winter to migratory populations. None of these statistics varied significantly in winter sub- samples taken from December through the first half of March (see table 2, fig. 1).
Significant shifts in size and weight between fall migration, winter, and spring migration indicate that smaller and lighter birds tended to winter farther south. This conclusion is supported by parallel shifts in size and weight within each sex. Seasonal shifts in sex ratios (see above) suggest that females also tended to winter farther south.
Fat. Visible fat, total fat, fat as a per cent of wet weight, and fat index showed parallel changes between subsamples (table 2, fig. 2).
Fat increased in amount from November through January and February, de- creased with prenuptial molt in the first half of March, and remained steady through vernal migration. Fat was lower in the late-fall subsample collected in November than in the late-spring subsample collected in late April. While a major drop in fat occurred between February and March, dry fat-free weight and wing length did not change until the middle of March, indicating that the former loss was not due to a shifting population: it was probably related to the onset of prenuptial molt.
Total fat and fat index were most variable in migration and midwinter (tables 2 and 4, fig. 2). Highest and lowest fat indexes occurred in early April and could have been from birds ready to depart and recent arrivals.
Water. Water as a per cent of wet weight (W%WW) varied inversely with fat as a per cent of wet weight (F%WW). This is a necessary relationship because both numerators in these ratios were components of the denominator. Thus,
W%WW = 68.3 - 0.767FkWW f 1.20; n = 159, 0.001 > P, and per cent water was lowest in midwinter (table 4, fig. 2). The decrease between November and December and the increases between February and March and be- tween spring (late April) and fall (November) were significant.

BODY COMPONENTS OF THE JUNCO 569
Water index (lacking the fat and water components in the denominator) was constant throughout the sample period except between November and December when it decreased significantly. However, rejection of the increase between the March subsamples is probably a Type ZZ error based upon the small sample size in early March when field collection was difficult. If both of these shifts are accepted, they could be largely explained on the basis of the inverse correlation of water index with dry fat-free weight (observed differences = -0.09 and +0.06; pre- dicted differences = -0.05 and +0.08; see regression equation above).
The only significant change in total water was a decrease between early and late March. This drop was paralleled by a reduction in dry fat-free weight and was related to the different population sampled.
Total water and water index were most variable during migratory periods. The low water indexes in late March and early April were each from single birds collected in the early morning (both with fat indexes of 0.5) that may have arrived the previous night. The highest water indexes seen (2.6 and 2.4) were also found in morning birds collected during spring migration (fat indexes of these birds were, respectively, 0.2 and 0.1). No such extreme variations were found in the winter subsamples.
Summary. Age differences were not evaluated because only nine immatures (defined by cranial ossification) were collected in the two years of this study. Males were larger and heavier than females, but the sexes did not differ in fat. Variances were not significantly heterogeneous between sexes. Winter females were larger and heavier relative to winter males than were migrant females to migrant males. After- noon birds were fatter than morning birds. There may have been heterogeneity between morning and afternoon collections in total water. Migratory populations differed in body size and mass from the winter population. They were smaller and lighter. Fat increased to a midwinter peak in January and February, dropped prior to spring migration, and remained steady during the period of vernal movement. Water index did not change during the winter but was higher in November and prob- ably in late March and early April. These changes were reconcilable with the lighter dry fat-free weight of birds collected in migration. Fat and water indexes were most variable at the peak of spring migration in early April.
DISCUSSION
SEASONAL CHANCES IN BODY COMPONENTS
Body weight increased in Slate-colored Juncos sampled in central Pennsylvania from a value around 20 g during late-fall migration to a high value around 23 g in midwinter and decreased to 20-21 g prior to spring migration. These changes closely paralleled those found-by Helms and Drury (1960) in eastern Massachusetts; mean weights were similar (d = 0.03 * 0.01 g) although significantly different (0.001 > P), and standard deviations were very close ( 1.89 and 1.88 g) . The present study shows that body fat is the major component involved in gross weight variations in the junco.
Fat. Winter fat reserves were maximal in February, when birds had 3.87 g of extractible lipid. Assuming that 0.23 g of these lipids were not available for energetic utilization (based upon unpublished sectional extractions and regressions of sec- tional lipid with total fat in the Tree Sparrow, SpizeZZa arborea), 3.64 g of fat were available as fuel. At 9.5 kcal/g, this reserve represented about 3.5 kcal, which should have been sufficient for maintenance requirements in winter for a period of about

570 HELMS, AUSSIKER, BOWER, AND FRETWELL
48 hours (mean catabolized energy in winter, 18.0 kcal/bird-day [unpublished data] ). In 10 years of field experience with this species in Massachusetts and Pennsylvania, the senior author has never seen a period lasting longer than one day and two nights in which the junco would be totally prevented from feeding in its normal winter habitat. Winter fat reserves, therefore, appear to have provided an adequate bio- energetic margin for this species in the region sampled.
Maximal migratory fat reserves were found during the first half of April and included 2.55 g of extractible lipid; about 2.32 g of this fat should have been available as fuel. Using the power-consumption estimate of Nisbet, Drury, and Baird (1963) of 0.076 kcal/g wet weight per hour for migratory flight, an average junco weighing 20.3 g at this time could have flown for more than 14 hours on fat alone. Using the average ground speed of 25 miles/hour for small birds determined by radar (Drury and Keith, 1962), this flight time would have taken an average individual some 360 miles. Vernal fat reserves should have been adequate, therefore, for normal spring migration, since suitable breeding habitat could have been reached in one flight and the most distant portion of the range in 10 flights.
Autumnal (November) fat was only 1.66 g. Using the assumptions made above, this should have been adequate for about 10 hours of flight, if required, although the fall sample may well have contained individuals at or near their chosen wintering latitude.
Lean weight. There was no significant variation in dry fat-free weight during the winter, although winter birds were heavier than both spring and fall migrants. Nor did total water vary significantly in winter, although winter birds had more total water but were relatively drier than migrants (see section on component dif- ferences above). Winter and migratory differences have been interpreted as in- dicating population exchange during migration. The lack of gross variations in lean body components is in line with the homeostatic hypothesis of Odum et al. (1964).
COMPONENT INTERRELATIONS
Dry fat-free weight (DFFW), total water (TW), and total fat (TF) would be expected to vary together. Birds with more water and more fat should have higher dry fat-free weight. These relationships held in the populations of the junco sampled and were highly significant:
DFFW = 1.08 + 0.374TW + 0.131TF + 0.348; df = 2, 156, 0.005 > P; R2 = 0.537.
Before discussing these interrelationships, however, we will mention two covariates that we felt would be helpful in error control and prediction,
Wing length. Wing length is commonly used as an indicator of size (see Hamilton, 1961), and its cube is related to mass in interspecific comparisons (see Greenewalt, 1962). To evaluate the usefulness of this variable in the junco, these relationships were tested by regression and should have been significant. Moreover, the log,, slope (b) relating mass to wing length should have equalled 3 -0.
In female juncos, loglo DFFW = 0.892 + l.l4logr,, (.OlWL) 2 0.300; n = 67, 0.001 > P,
where DFFW = dry fat-free weight and WL = wing length (this variable was trans- formed as indicated to prevent high-order overflow in computer output during cubic calculations; the slope was unaffected by this operation). In male juncos,
log,, DFFW = 0.806 + O.l221ogr,, (.OlWL) + 0.0329; n = 92, P > 0.5.
To our surprise, this regression was linear for females (not cubic) while it was
BODY COMPONENTS OF THE JUNCO 571
insignificant for males. These equations probably indicate a valid sex difference. This is supported by the following observations: ( 1) the two slopes differed sig- nificantly (& = 1.02 k 0.367, df = 15.5, 0.01 > P > 0.001); (2) within the range of overlapping wing length, wet fat-free weights (and presumably dry fat-free weights) of males were significantly higher than those of females (G? = 1.04 f 0.27 g, 0.001 > P) ; and (3) by analysis of variance, males contributed nothing to an equation for pooled data and the slope was unchanged. On the other hand, winter females alone did not show significant relationships between lean mass and wing length. However, this sample was small (16 birds), and the winter equation did not differ significantly from that based upon migrant and all female data.
These sex differences were not expected and remain unexplained. They indicate that extreme care must be exercised by authors using wing length as an indicator of mass, and negate the use of wing length in prediction although it may retain some value in error control.
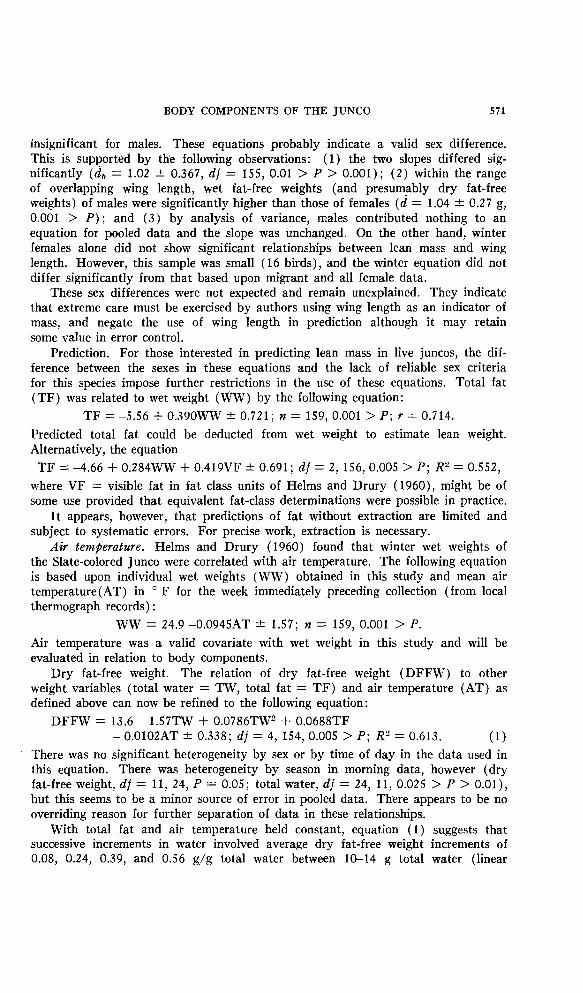
Prediction. For those interested in predicting lean mass in live juncos, the dif- ference between the sexes in these equations and the lack of reliable sex criteria for this species impose further restrictions in the use of these equations. Total fat (TF) was related to wet weight (WW) by the following equation:
TF = -5.56 + 0.39OWW * 0.721; n = 159, 0.001 > P; Y = 0.714.
Predicted total fat could be deducted from wet weight to estimate lean weight. Alternatively, the equation
TF = -4.66 + 0.284WW + 0.419VF f 0.691; df = 2, 156, 0.005 > P; R2 = 0.552,
where VF = visible fat in fat class units of Helms and Drury (1960), might be of some use provided that equivalent fat-class determinations were possible in practice.
It appears, however, that predictions of fat without extraction are limited and subject to systematic errors. For precise work, extraction is necessary.
Air temperature. Helms and Drury (1960) found that winter wet weights of the Slate-colored Junco were correlated with air temperature. The following equation is based upon individual wet weights (WW) obtained in this study and mean air temperature(AT) in ’ F for the week immediately preceding collection (from local thermograph records) :
WW = 24.9 -0.0945AT -+ 1.57; n = 159, 0.001 > P. Air temperature was a valid covariate with wet weight in this study and will be evaluated in relation to body components.
Dry fat-free weight. The relation of dry fat-free weight (DFFW) to other weight variables (total water = TW, total fat = TF) and air temperature (AT) as defined above can now be refined to the following equation:
DFFW = 13.6 - 1.57TW + 0.0786TW2 + 0.0688TF - 0.0102AT ZL 0.338; df = 4, 154, 0.005 > P; R' = 0.613. (1)
There was no significant heterogeneity by sex or by time of day in the data used in this equation. There was heterogeneity by season in morning data, however (dry fat-free weight, df = 11, 24, P = 0.05; total water, df = 24, 11, 0.025 > P > O.Ol), but this seems to be a minor source of error in pooled data. There appears to be no overriding reason for further separation of data in these relationships.
With total fat and air temperature held constant, equation ( 1) suggests that successive increments in water involved average dry fat-free weight increments of 0.08, 0.24, 0.39, and 0.56 g./g total water between l&l4 g total water (linear
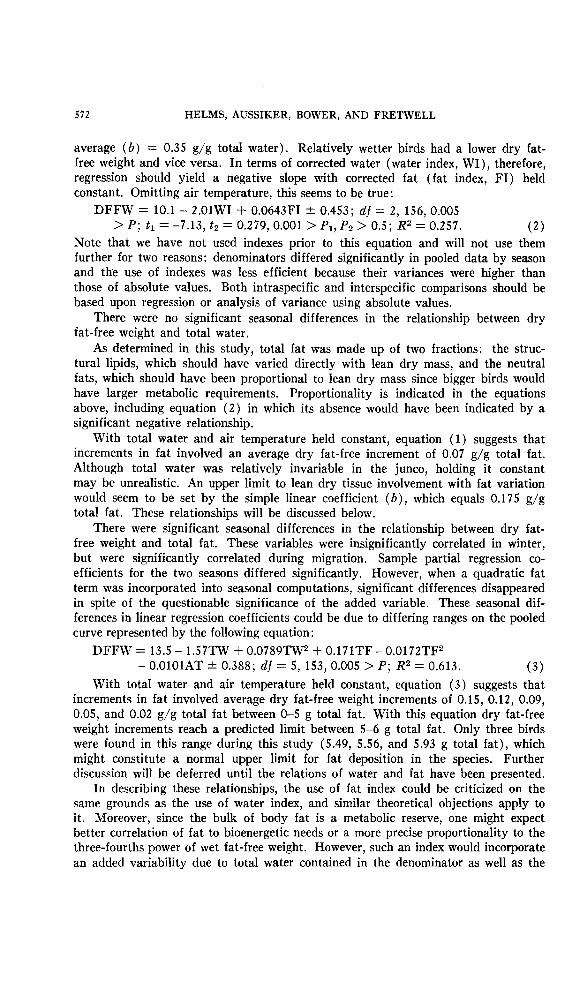
572 HELMS, AUSSIKER, BOWER, AND FRETWELL
average (b) = 0.35 g/g total water). Relatively wetter birds had a lower dry fat- free weight and vice versa. In terms of corrected water (water index, WI), therefore, regression should yield a negative slope with corrected fat (fat index, FI) held constant. Omitting air temperature, this seems to be true:
DFFW = 10.1 - 2.01WI + 0.0643FI +- 0.453; df = 2, 156, 0.005 > P; tl = -7.13, t2 = 0.279, 0.001 > PI, Pp > 0.5; R2 = 0.257. (2)
Note that we have not used indexes prior to this equation and will not use them further for two reasons: denominators differed significantly in pooled data by season and the use of indexes was less efficient because their variances were higher than those of absolute values. Both intraspecific and interspecific comparisons should be based upon regression or analysis of variance using absolute values.
There were no significant seasonal differences in the relationship between dry fat-free weight and total water.
As determined in this study, total fat was made up of two fractions: the struc- tural lipids, which should have varied directly with lean dry mass, and the neutral fats, which should have been proportional to lean dry mass since bigger birds would have larger metabolic requirements. Proportionality is indicated in the equations above, including equation (2) in which its absence would have been indicated by a significant negative relationship.
With total water and air temperature held constant, equation (1) suggests that increments in fat involved an average dry fat-free increment of 0.07 g/g total fat. Although total water was relatively invariable in the junco, holding it constant may be unrealistic. An upper limit to lean dry tissue involvement with fat variation would seem to be set by the simple linear coefficient (6), which equals 0.175 g/g total fat. These relationships will be discussed below.
There were significant seasonal differences in the relationship between dry fat- free weight and total fat. These variables were insignificantly correlated in winter, but were significantly correlated during migration, Sample partial regression co- efficients for the two seasons differed significantly. However, when a quadratic fat term was incorporated into seasonal computations, significant differences disappeared in spite of the questionable significance of the added variable. These seasonal dif- ferences in linear regression coefficients could be due to differing ranges on the pooled curve represented by the following equation:
DFFW = 13.5 - 1.57TW + 0.0789TW2 + 0.171TF - 0.0172TF2 - O.OlOlAT -t 0.388; df = 5, 153, 0.005 > P; R2 = 0.613. (3)
With total water and air temperature held constant, equation (3) suggests that increments in fat involved average dry fat-free weight increments of 0.15, 0.12, 0.09, 0.05, and 0.02 g/g total fat between O-5 g total fat. With this equation dry fat-free weight increments reach a predicted limit between 5-6 g total fat. Only three birds were found in this range during this study (5.49, 5.56, and 5.93 g total fat), which might constitute a normal upper limit for fat deposition in the species. Further discussion will be deferred until the relations of water and fat have been presented.
In describing these relationships, the use of fat index could be criticized on the same grounds as the use of water index, and similar theoretical objections apply to it. Moreover, since the bulk of body fat is a metabolic reserve, one might expect better correlation of fat to bioenergetic needs or a more precise proportionality to the three-fourths power of wet fat-free weight. However, such an index would incorporate an added variability due to total water contained in the denominator as well as the
BODY COMPONENTS OF THE JUNCO 573
uncertainty of the precise exponent to be applied, and would complicate calculations already sufficiently involved. With readily available computer programs for re- gression and analysis of variance, all tests and comparisons should be based upon absolute or transformed values for maximum efficiency.
It should be noted that air temperature not only controls variance in equations (1) and (3) above, but also explains a significant fraction of it, suggesting a control of lean dry weight by temperature. However, this relationship was not significant in winter birds when the population was stable. Its significance in the total sample seems to be due solely to its contribution during vernal migration when it may well represent only a correlation of different-sized migrants with season (heavier birds moving first at lower temperatures, lighter birds moving later with higher temperatures), or a progressive depletion of body mass (protein?) during migration, or collection bias, or all three in some measure. Inclusion of this term is justified, however, since correction is applied regardless of the cause of correlation.
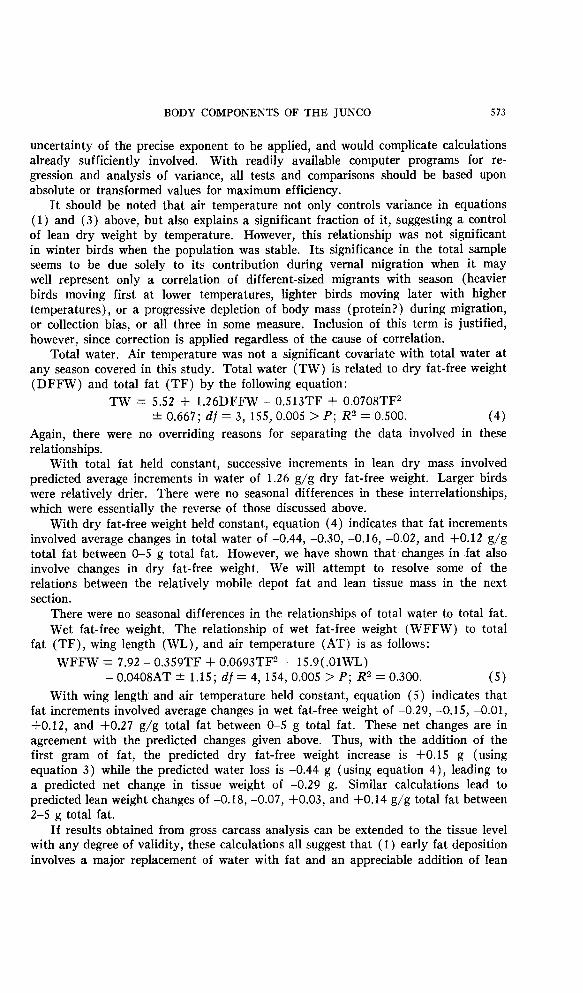
Total water. Air temperature was not a significant covariate with total water at any season covered in this study. Total water (TW) is related to dry fat-free weight (DFFW) and total fat (TF) by the following equation:
TW = 5.52 + 1.26DFFW - 0.513TF + 0.0708TF2 + 0.667; df = 3, 155, 0.005 > P; R2 = 0.500. (4)
Again, there were no overriding reasons for separating the data involved in these relationships.
With total fat held constant, successive increments in lean dry mass involved predicted average increments in water of 1.26 g/g dry fat-free weight. Larger birds were relatively drier. There were no seasonal differences in these interrelationships, which were essentially the reverse of those discussed above.
With dry fat-free weight held constant, equation (4) indicates that fat increments involved average changes in total water of -0.44, -0.30, -0.16, -0.02, and +0.12 g/g total fat between O-5 g total fat. However, we have shown that changes in fat also involve changes in dry fat-free weight. We will attempt to resolve some of the relations between the relatively mobile depot fat and lean tissue mass in the next section.
There were no seasonal differences in the relationships of total water to total fat. Wet fat-free weight. The relationship of wet fat-free weight (WFFW) to total
fat (TF), wing length (WL), and air temperature (AT) is as follows:
WFFW = 7.92 - 0.359TF + 0.0693TF2 + 15.9(.OlWL) - 0.0408AT 2 1.15; df = 4, 154, 0.005 > P; R2 = 0.300. (5)
With wing length and air temperature held constant, equation (5) indicates that fat increments involved average changes in wet fat-free weight of -0.29, -0.15, -0.01, +0.12, and +0.27 g/g total fat between O-5 g total fat. These net changes are in agreement with the predicted changes given above. Thus, with the addition of the first gram of fat, the predicted dry fat-free weight increase is +0.15 g (using equation 3) while the predicted water loss is -0.44 g (using equation 4)) leading to a predicted net change in tissue weight of -0.29 g. Similar calculations lead to predicted lean weight changes of -0.18, -0.07, +0.03, and +0.14 g/g total fat between 2-5 g total fat.
If results obtained from gross carcass analysis can be extended to the tissue level with any degree of validity, these calculations all suggest that (1) early fat deposition involves a major replacement of water with fat and an appreciable addition of lean
574 HELMS, AUSSIKER, BOWER, AND FRETWELL
dry weight, (2) late fat deposition involves the addition of water with little change in lean dry mass, and (3) fat deposition around the mean involves little net water change and average lean dry-mass addition. According to the hypothesis of Odum et al. (1964), the number of adipocytes remains relatively constant in birds-these cells are filled and emptied like “tanks” or “balloons.” Neither analogy is perfect. Tank structure would imply a rigid container, while balloon structure would suggest a passively expanding and contracting sheath. Adipocytes are neither of these-they are dynamic cells apparently adding mass while they or surrounding spaces lose water with the initial deposition of fat. Subsequently, as the fat cells swell, tissue changes become essentially surface phenomena while fat changes become essentially volume ones with proportionate reductions in tissue addition although total volume of the organism in general and the vascular tree servicing the inflated fat organs and the intercellular spaces in particular increase (as reflected by the predicted increases in total water at high fat levels). The distribution of total water in lean and obese birds needs to be examined to verify these relationships.
To this point, our estimates of lean dry-weight involvement with the addition of fat have approximated 7-8 per cent (linear estimates). This value is lower than the average lean mass contribution to human adipose tissue (12-13%, Morse and Soeldner, 1964), but could be due to a larger average cell size in avian fat tissue (Odum et al., 1964; Odum, 1965; Hicks, unpublished data). It is within the range of lean mass contributions to avian adipose tissue in five species studied by Walker (1964, about 2-12%). Using curvilinear estimates, early deposition in the junco would involve tissue composition similar to that of mammals and would approach limits at about the observed maximum depot fat. Theory argues for this pattern of deposition. However, in the junco, this pattern is not supported statistically (it is strongly sup- ported by unpublished data for the Tree Sparrow). Our data do not disprove the homeostatic hypothesis of Odum et aE. (1964), but do suggest that tissue involvement be looked for in future studies using somatolytic techniques.
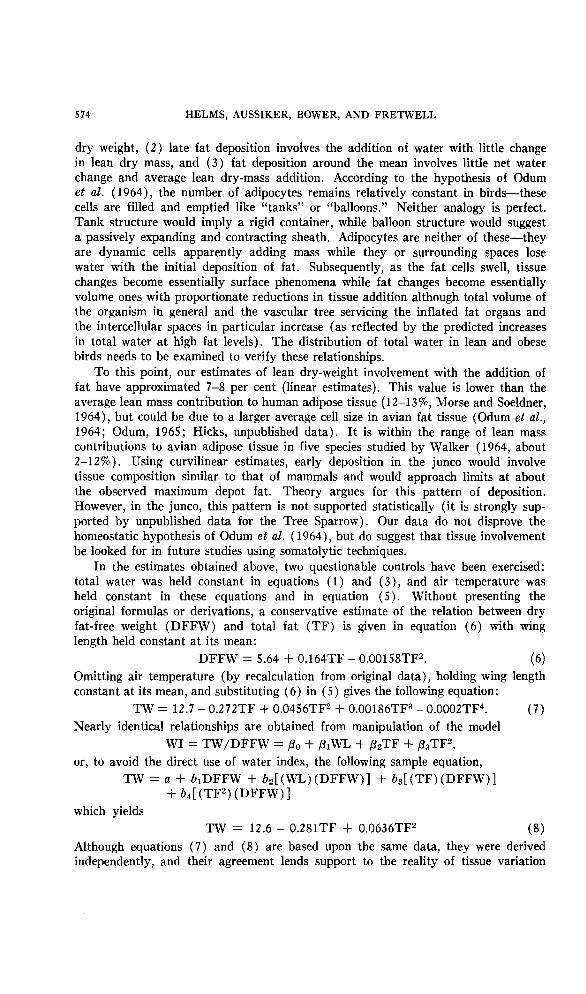
In the estimates obtained above, two questionable controls have been exercised: total water was held constant in equations (1) and (3), and air temperature was held constant in these equations and in equation (5). Without presenting the original formulas or derivations, a conservative estimate of the relation between dry fat-free weight (DFFW) and total fat (TF) is given in equation (6) with wing length held constant at its mean:
DFFW = 5.64 + 0.164TF - 0.00158TF2. (6) Omitting air temperature (by recalculation from original data), holding wing length constant at its mean, and substituting (6) in (5) gives the following equation:
TW = 12.7 - 0.272TF + 0.0456TF2 + 0.00186TF3 - 0.0002TF4. (7) Nearly identical relationships are obtained from manipulation of the model
WI = TW/D*FW = PO + plWL + P2TF + P3TF”,
or, to avoid the direct use of water index, the following sample equation,
TW = a + blDFFW + bz[ (WL) (DFFW)] + bs[ (TF) (DFFW)] + b.l[ (TF”) (DFFW)]
which yields
TW = 12.6 - 0.281TF + 0.0636TF2 (8) Although equations (7) and (8) are based upon the same data, they were derived independently, and their agreement lends support to the reality of tissue variation
BODY COMPONENTS OF THE JUNCO 575
WEIGHT CHANGE
4
8
6
RANGE, TOTAL FAT
- DEPOT FAT
LTOTAL WATER
0 2 4 6 8 TOTAL FAT 9
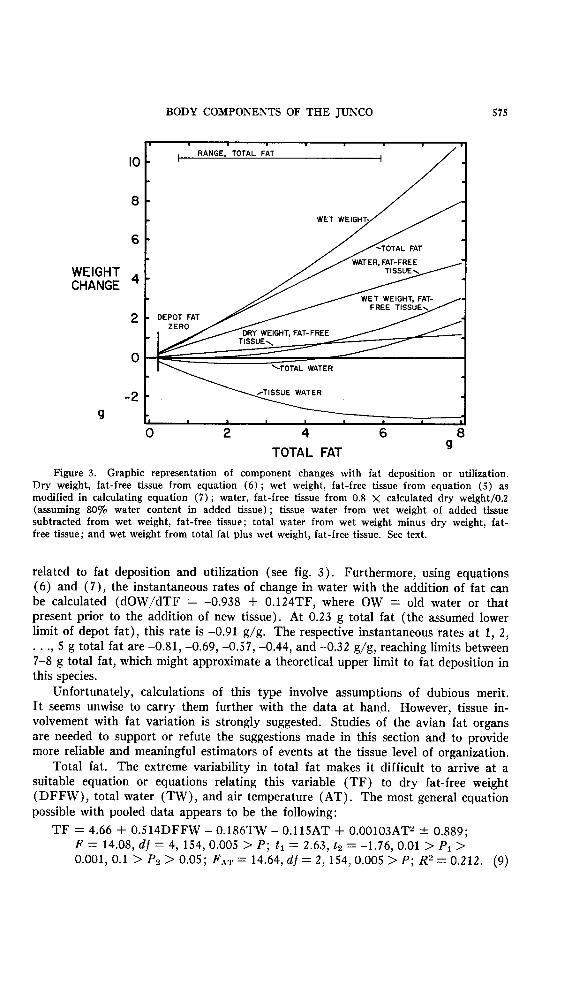
Figure 3. Graphic representation of component changes with fat deposition or utilization. Dry weight, fat-free tissue from equation (6) ; wet weight, fat-free tissue from equation (5) as modified in calculating equation (7) ; water, fat-free tissue from 0.8 X calculated dry weight/O.2 (assuming 80% water content in added tissue) ; tissue water from wet weight of added tissue subtracted from wet weight, fat-free tissue; total water from wet weight minus dry weight, fat- free tissue; and wet weight from total fat plus wet weight, fat-free tissue. See text.
related to fat deposition and utilization (see fig. 3). Furthermore, using equations (6) and (7), the instantaneous rates of change in water with the addition of fat can be calculated (dOW/dTF = -0.938 + O.l24TF, where OW = old water or that present prior to the addition of new tissue). At 0.23 g total fat (the assumed lower limit of depot fat), this rate is -0.91 g/g. The respective instantaneous rates at 1, 2,
f * ‘7 5 g total fat are -0.81, -0.69, -0.57, -0.44, and -0.32 g/g, reaching limits between 7-8 g total fat, which might approximate a theoretical upper limit to fat deposition in this species.
Unfortunately, calculations of this type involve assumptions of dubious merit. It seems unwise to carry them further with the data at hand. However, tissue in- volvement with fat variation is strongly suggested. Studies of the avian fat organs are needed to support or refute the suggestions made in this section and to provide more reliable and meaningful estimators of events at the tissue level of organization.
Total fat. The extreme variability in total fat makes it difficult to arrive at a suitable equation or equations relating this variable (TF) to dry fat-free weight (DFFW), total water (TW), and air temperature (AT). The most general equation possible with pooled data appears to be the following:
TF = 4.66 + OS14DFFW - 0.186TW - 0.115AT + 0.00103AT2 -+ 0.889; F = 14.08, df = 4, 154, 0.005 > P; tl = 2.63, t2 = -1.76, 0.01 > PI > 0.001, 0.1 > Pz > 0.05; FAT = 14.64, df = 2, 154, 0.005 > P; R2 = 0.212. (9)
576 HELMS, AUSSIKER, BOWER, AND FRETWELL
The variance explained by total water and squared air temperature is of questionable significance (respective F = 3.46, 3.27, ~?f = 1, 154, 0.1 > P > 0.05) in this equation. However, all of these variables were significant (by F and t) in afternoon data. Equation (4) seems to be a reasonable compromise without transformation. The following equation incorporates a normalizing transformation and curvilinearity in line with the discussions above and is clearly superior to (9) :
log,,(TF + 1.0) = 1.27 + 0.8631og,,,DFFW - 0.75610g1,TW - 0.36410g1,,AT f 0.106; F = 17.72, o!f = 3, 155, 0.005 > P; tl = 2.66, tz = -2.22, t3 = -5.29, 0.01 > PI > 0.001, 0.05 > Pz > 0.02, 0.001 > Pa; R2 = 0.255. (10)
However, this equation is more difficult to work with and does not seem to be re- quired since total fat was not significantly skewed (g = 0.0272 f 0.609, P > 0.5) nor significantly kurtotic (g = 0.0352 -+ 0.383, P > 0.5) in the pooled sample.
Summary. Body weight and fat were greatest in midwinter. Fat reserves were significantly and negatively correlated with air temperature during winter and were adequate for winter survival. Migratory fat reserves were sufficient for normal migration. Lean weight did not vary significantly in the stable winter population but was lower during migration. Dry fat-free weight and total water were sig- nificantly interrelated-this relationship did not show significant seasonal change. Both dry fat-free weight and total water were significantly related to total fat, the former variable increasing by an average of 0.07 g/g fat, the latter variable de- creasing by an average of -0.12 g/g fat. However, the former relationship appeared to be curvilinear, suggesting major involvement at low fat levels and diminishing involvement as fat increased, reaching limits at maximum fat (5-6 g) in this species. The latter relationship involved water loss with fat deposition in lean birds but water addition in more obese individuals. Tissue was added with fat deposition, but, in line with the homeostatic hypothesis of Odum et al. ( 1964), there was no evidence that cells were added. If adipocytes were recruited, linearity should prevail in component interrelatiqns, and there would be no reason to limit total fat deposi- tion at the maximum reported. The so-called Yank” theory of lipid deposition in birds (see Odum, 1965) appears to be supported. There remains, however, con- siderable uncertainty about the location of component changes. Therefore, studies of the fat organs themselves are needed to resolve many of the uncertainties attendant upon work with total body data.
SUMMARY
During the winters of 1962-1963 and 1964-1965, 159 Slate-colored Juncos, Bunco hyemalis, were collected in central Pennsylvania. Birds were measured, weighed, and frozen. Age, sex, wet weight, total fat, total water, dry fat-free weight, and fat and water indexes were determined.
Dry fat-free weight, total water, and water index did not vary significantly during the winter, although water as a per cent of wet weight and fat as a per cent of wet weight did vary significantly and inversely. Individuals collected in the spring and fall migratory periods were significantly smaller and less. massive with lower dry fat-free weights than birds collected in winter. Water index was higher during both migratory periods than in winter but was related to basic body weight, not migration per se.
Seasonal changes in wet weight were due largely to changes in fat. Highest wet weight (22.87 -C 0.42 g) and total fat (3.87 ? 0.18 g) were found in February.
BODY COMPONENTS OF THE JUNCO 577
The Slate-colored Junco is a cold-hardy species and should be able to survive without feeding for two days in midwinter using available depot fat. Migratory weights were between 20 and 21 g in spring and fall. There was no increase in fat during the spring, but mean reserves were sufficient for flights of about 360 miles at that season.
Males were heavi “I;
(wet weight difference = 1.22 -C 0.29 g) and larger (wing length difference = 3. +- 0.4 mm) than females. Afternoon birds were heavier (wet weight difference = 1.33 -+ 0.32 g) and fatter (total fat difference = 0.62 * 0.18 g; fat index difference = 0.092 +- 0.028) than morning birds.
Dry fat-free weight (mass estimator) and wing length (size estimator) were linearily correlated in females but not in males. This seems to be a valid sex dif- ference in this species and precludes any meaningful prediction of weight in male juncos based upon wing-length measurement.
Dry fat-free weight was positively related to both total water and total fat. Total water was positively related to dry fat-free weight but negatively related to total fat. It appears that in the junco tissue mass but not necessarily cell number increases during the early stages of fat deposition and decreases during late stages of fat utilization, while fat replaces water throughout fat deposition but less rapidly at higher fat values and vice versa. These processes reach limits at the maximum fat (about S-7 g) and at the minimum fat (about 0.2 g) for the species. These interrelationships argue against a strict interpretation of the hypothesis of Odum, Rogers, and Hicks (1964) that nonfat components are stable during fat mobilization and depletion; but the magnitude of lean mass change with fat deposition is probably minor, and there is no evidence that additional adipocytes are recruited. Direct studies of fat organs are needed.
ACKNOWLEDGMENTS
We would like to thank the staff of the Frease-Rooke and the University of Georgia computing centers for their assistance; Robert B. Smythe for his help in the field; Eugene P. Odum, John T. McGinnis, and Michael Rosenzweig for method- ological and statistical suggestions; James R. King, Jack E. Harclerode, and others mentioned above for their critical evaluation of the manuscript; Lawrence F. Wilson, Jack W. and Dorothy R. McLaren, Charles J. Jones, the late Paul Hightower, and Karl H. Purnell for permission to use land owned by them in the field portions of this study. This work was supported by Bucknell University and with grants AM 06798 and HE 08294 (USPHS). Portions of the study were undertaken while Helms was on a NSF Science Faculty Fellowship. Fretwell received fellowship support from USPHS GM 678-05.
LITERATURE CITED
BALDWIN, S. P., and S. C. KENDEIGH. 1938. Variations in the weight of birds. Auk, 55:416-467.
BOWER, E. B., and C. W. HELMS. 1967. Seasonal variation in fatty acids of the Slate-colored Junco, Junco hyemalis. Physiol. Zoiil. (submitted for publication).
BRO~EK, J., ed. 1963. Body composition. Ann. N.Y. Acad. Sci., llO:l-1018.
DRURY, W. H., JR., and J. A. KEITH. 1962. Radar studies of songbird migration in eastern New England. Ibis, 105 : 234-237.
FARNER, D. S. 1964. The photoperiodic control of reproductive cycles in birds. Amer. Sci., 52:137-156.
GREENEWALT, C. H. 1962. Dimensional relationships for flying animals. Smith. Misc. Coll., 144: l-46. Publ. 4477.
578 HELMS, AUSSIKER, BOWER, AND FRETWELL
HAMILTON, T. H. 1961. The adaptive significance of intraspecific trends of variation in wing length and body size among bird species. Evolution, 15:180-195.
HELMS, C. W., and W. H. DRURY, JR. 1960. Winter and migratory weight and fat: field studies on some North American buntings. Bird-Banding, 31:1-40.
KING, J. R., D. S. FARNER, and M. L. MORTON. 1965. The lipid reserves of White-crowned Sparrows on the breeding ground in central Alaska. Auk, 82:236-252.
MORSE, W. I., and J. S. SOELDNER. 1965. The measurement of human adipose tissue mass. In Handbook of physiology. Section 5: adipose tissue. A. E. Renold and G. F. Cahill, eds. 653-659.
NICE, M. M. 1938. The biological significance of bird weights. Bird-Banding, 9: l-11. NI~BET, I. C. T., W. H. DRURY, JR., and J. BAIRD. 1963. Weight loss during migration. Bird-
Banding, 34: 107-159. ODUM, E. P. 1965. Adipose tissue in migratory birds. In Handbook of physiology. Section 5:
adipose tissue. A. E. Renold and G. F. Cahill, eds. 37-43. ODUM, E. P., D. T. ROGERS, and D. L. HICKS. 1964. Homeostasis of the nonfat components of
migratory birds. Science, 143: 1037-1039. SNEDECOR, G. W. 1956. Statistical methods. 5th ed. Iowa State College Press, Ames. STEEL, R. G., and J. H. TORRIE. 1960. Principles and procedures of statistics. McGraw-Hill,
New York. TUREEX, F. J. 1960. The proportions of plumage, organic matter and water content in the
bodies of some birds. Proc. XII Intern. Ornithol. Congr., p. 724-729. WALKER, A. T. 1964. Major fatty acids in migratory bird fat. Physiol. ZoSl., 37:57-64. ZIMMERMAN, J. L. 1965. Carcass analysis of wild and thermal-stressed Dickcissels. Wilson Bull.,
77:55-70.
Department of Biology, Bucknell University, Lewisburg, Pennsylvania 17837. (Present addresses: Aussiker, University of Pennsylvania, Philadelphia, Pennsylvania; Bower, Jefferson Medical School, Philadelphia, Pennsylvania; and Fretwell, North Carolina State University, Raleigh, North Carolina.) 14 December 1966.