a bird's-eye view of the rare disease landscape
TRANSCRIPT
A Bird’s-Eye View of the Rare Disease Landscape

2 / January 2017 © Informa UK Ltd 2016 (Unauthorized photocopying prohibited.)
January 2017 / 3© Informa UK Ltd 2016 (Unauthorized photocopying prohibited.)
The focus of this analysis is limited to indications considered to be a rare disease as defined by the FDA and EMA. Specifically, these are the conditions that affect 200,000 people or less in the US (FDA) or ones with a prevalence of 1 in 2,000 people, which is the equivalent of fewer than 250,000 people in the EU (EMA). As of October 2016, Pharmaprojects captured a total of 9,626 drugs in development for at least one of these rare diseases. Among the 499 Pharmaprojects indications designated as rare diseases, 494 have been addressed by the pharma industry with focus areas made evident by total number of drugs developed per indication, both active (drugs still in preclinical or clinical development, registered, approved or launched) and inactive (drugs that have been suspended, discontinued, withdrawn, or active development cannot be confirmed in the public domain).
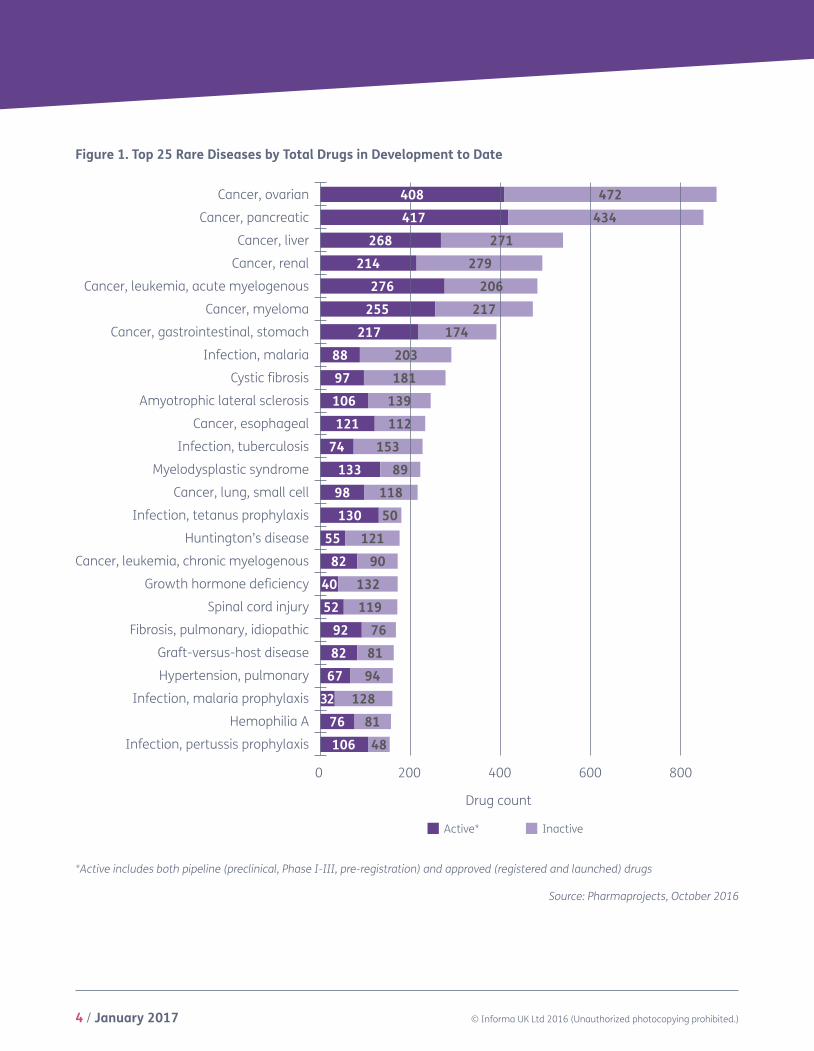
Overall, the largest number of drugs have targeted indications within the therapeutic areas of Cancer and Infectious Disease (ID). Among the top 25 rare disease categories depicted in Figure 1, combatting
cancer does appear to be the pharma industry’s priority as the first seven are all oncology indications. Ovarian and pancreatic cancer have been targeted the most, both historically and currently, with a total of 880 and 851 drugs, respectively. Liver cancer is a distant third with 539 total drugs, followed by renal, acute myelogenous leukemia (AML), myeloma, and stomach cancer. For most of these top cancers, the number of inactive drugs outnumber those still in active development, however, efforts are clearly still ongoing.
Within ID, malaria has been an area of high interest with both therapeutic and preventive interventions in the top 25. Unfortunately, this is primarily due to abandoned efforts against this mosquito-borne disease; 70% of malaria treatments and 80% of prophylaxis candidates are inactive. There are a few rare infectious diseases where interest is far from waning, specifically tetanus prophylaxis and pertussis prophylaxis, both of which possess a higher proportion of active drugs. (Figure 1)
A reflection on the rare disease landscape to date
Drug development is a challenging endeavor, which can be further exacerbated within the realm of rare diseases. Some additional issues encountered in this area include limited precedent for drug development within individual disorders, which typically have poorly understood natural histories, and very small populations affected by the disease. However, while individual rare diseases may only affect a small pool of patients, rare disease patients as a whole
are quite numerous at an estimated 350 million people worldwide. Perhaps most troubling is the fact that about half of these patients are children, 30% of whom will not live to see their fifth birthday per Global Genes®, a rare disease patient advocacy group. Various regulations and initiatives have been, and continue to be, implemented to both facilitate and incentivize rare disease R&D, and the pharma industry appears to be responding accordingly.
Doro ShinThought Leadership Manager
4 / January 2017 © Informa UK Ltd 2016 (Unauthorized photocopying prohibited.)
Figure 1. Top 25 Rare Diseases by Total Drugs in Development to Date
Source: Pharmaprojects, October 2016
*Active includes both pipeline (preclinical, Phase I-III, pre-registration) and approved (registered and launched) drugs
InactiveActive*
Cancer, ovarian
Cancer, pancreatic
Cancer, liver
Cancer, renal
Cancer, leukemia, acute myelogenous
Cancer, myeloma
Cancer, gastrointestinal, stomach
Infection, malaria
Cystic fibrosis
Amyotrophic lateral sclerosis
Cancer, esophageal
Infection, tuberculosis
Myelodysplastic syndrome
Cancer, lung, small cell
Infection, tetanus prophylaxis
Huntington’s disease
Cancer, leukemia, chronic myelogenous
Growth hormone deficiency
Spinal cord injury
Fibrosis, pulmonary, idiopathic
Graft-versus-host disease
Hypertension, pulmonary
Infection, malaria prophylaxis
Hemophilia A
Infection, pertussis prophylaxis
0 200 400 600 800
408 472417 434
268 271214 279
276 206255 217
217 17488 20397 181106 139121 112
74 153133 89
98 118130 50
55 12182 90
40 13252 119
92 7682 81
67 9432 128
76 81106 48
Drug count

January 2017 / 5© Informa UK Ltd 2016 (Unauthorized photocopying prohibited.)
The current status of active drug development for rare diseasesPharmaprojects last assessed the rare disease landscape in a November 2013 white paper, which found that 2,907 drugs were in active development for at least one of 364 rare diseases1. As of October 2016, a total of 4,549 drugs are now in development for at least one of 447 rare diseases. This is an increased drug count of 56% and 23% more rare diseases after nearly three years, demonstrating ongoing interest and seemingly increased enthusiasm for research within these areas of high unmet needs. As previously mentioned, a total of 494 rare indications have been targeted by pharma to date, leaving 47 as orphaned indications with no currently active drugs. These were generally much smaller efforts that peaked at a high of 13 total drugs previously in development for schistosomiasis prophylaxis. Ongoing therapeutic research for schistosomiasis remains, so the disease has not been completely abandoned.
With regard to the breakdown by disease status, or the highest phase of development a drug has reached for a particular disease, preclinical and early-to-mid stage clinical research continues to be the most active. In addition to the large proportion of early stage developments, a total of 1,387 launches have taken place. (Figure 2) Since drugs in development for more than one rare disease are counted for each individual indication, the same drug can be counted both across and within the same development phase. As such, this total of 1,387 launches represents 950 unique drugs that have been launched across 232 different rare diseases. Among these marketed products, ID is in the lead, with the largest number of launches, followed by Cancer.
Figure 2. Current Rare Disease Drug Development Landscape*
Source: Pharmaprojects, October 2016
*Drugs in development for >1 rare disease are represented at multiple development phases
1 Stephens J, Blazynski C (2013) Rare Disease Landscape: Will the Blockbuster Model be Replaced? Available from: https://pharmaintelligence.informa.com/resources/product-content/will-the-blockbuster-model-be-replaced
3000
2500
2000
1500
1000
500
0
# dr
ugs
in d
evel
opm
ent
Precli
nical
Phase
I
Phase
II
Phase
III
Pre-re
gistratio
n
Registered
Launch
ed
2564
1334 1558 1387
470
74 36
6 / January 2017 © Informa UK Ltd 2016 (Unauthorized photocopying prohibited.)
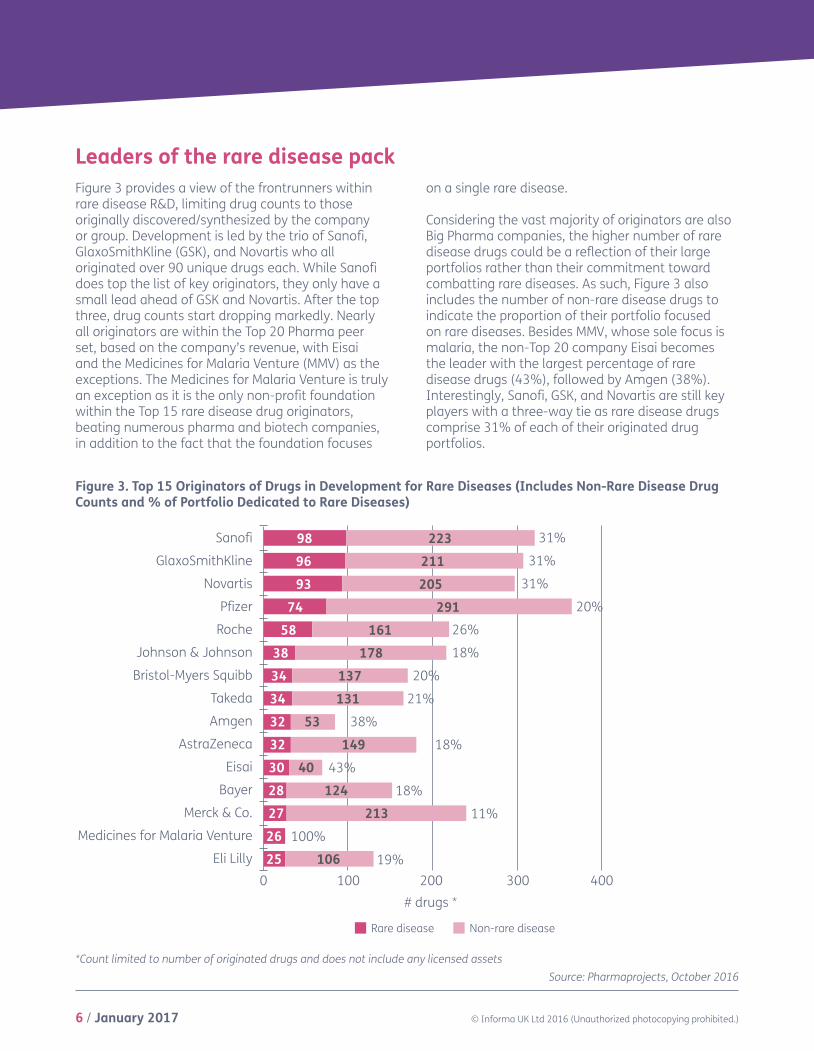
Leaders of the rare disease packFigure 3 provides a view of the frontrunners within rare disease R&D, limiting drug counts to those originally discovered/synthesized by the company or group. Development is led by the trio of Sanofi, GlaxoSmithKline (GSK), and Novartis who all originated over 90 unique drugs each. While Sanofi does top the list of key originators, they only have a small lead ahead of GSK and Novartis. After the top three, drug counts start dropping markedly. Nearly all originators are within the Top 20 Pharma peer set, based on the company’s revenue, with Eisai and the Medicines for Malaria Venture (MMV) as the exceptions. The Medicines for Malaria Venture is truly an exception as it is the only non-profit foundation within the Top 15 rare disease drug originators, beating numerous pharma and biotech companies, in addition to the fact that the foundation focuses
on a single rare disease.
Considering the vast majority of originators are also Big Pharma companies, the higher number of rare disease drugs could be a reflection of their large portfolios rather than their commitment toward combatting rare diseases. As such, Figure 3 also includes the number of non-rare disease drugs to indicate the proportion of their portfolio focused on rare diseases. Besides MMV, whose sole focus is malaria, the non-Top 20 company Eisai becomes the leader with the largest percentage of rare disease drugs (43%), followed by Amgen (38%). Interestingly, Sanofi, GSK, and Novartis are still key players with a three-way tie as rare disease drugs comprise 31% of each of their originated drug portfolios.
Figure 3. Top 15 Originators of Drugs in Development for Rare Diseases (Includes Non-Rare Disease Drug Counts and % of Portfolio Dedicated to Rare Diseases)
Source: Pharmaprojects, October 2016*Count limited to number of originated drugs and does not include any licensed assets
Non-rare diseaseRare disease
Sanofi
GlaxoSmithKline
Novartis
Pfizer
Roche
Johnson & Johnson
Bristol-Myers Squibb
Takeda
Amgen
AstraZeneca
Eisai
Bayer
Merck & Co.
Medicines for Malaria Venture
Eli Lilly
0 100 200 300 400# drugs *
98 22396 21193 205
74 29158 161
38 17834 13734 13132 5332 14930 4028 12427 21326 100%
25 106
31%
31%
31%
20%
26%
18%
20%
21%
38%
18%
43%
18%
11%
19%
January 2017 / 7© Informa UK Ltd 2016 (Unauthorized photocopying prohibited.)
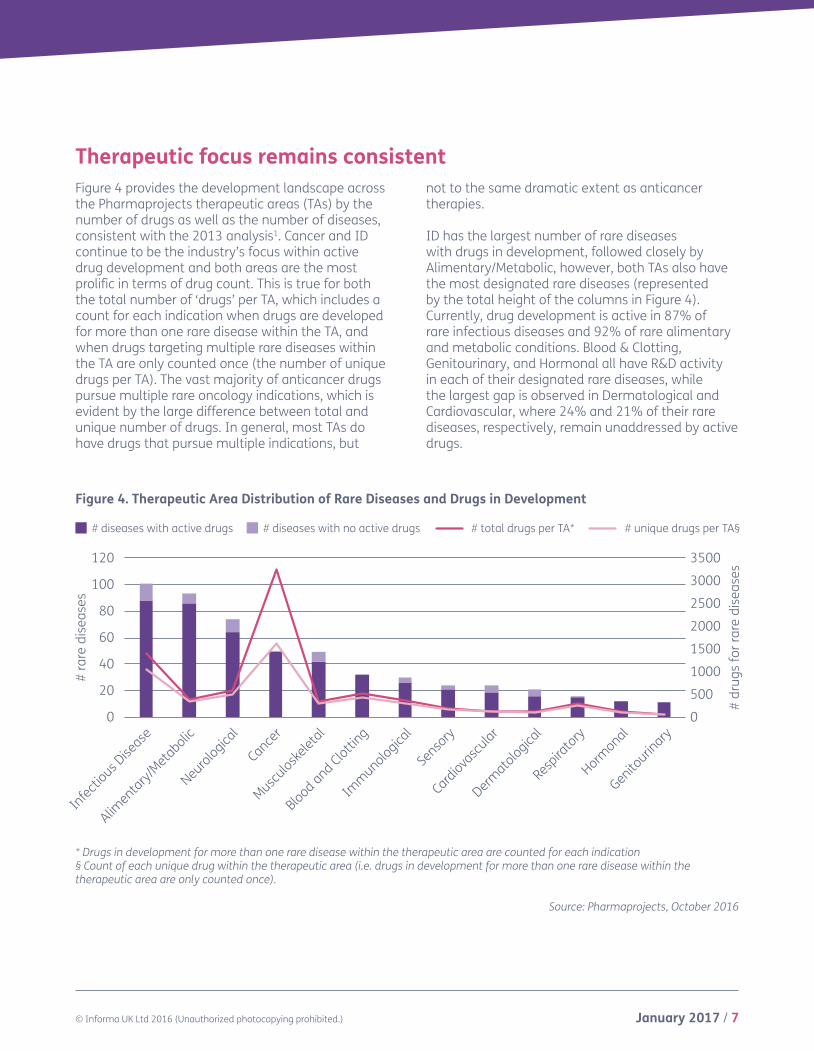
Therapeutic focus remains consistentFigure 4 provides the development landscape across the Pharmaprojects therapeutic areas (TAs) by the number of drugs as well as the number of diseases, consistent with the 2013 analysis1. Cancer and ID continue to be the industry’s focus within active drug development and both areas are the most prolific in terms of drug count. This is true for both the total number of ‘drugs’ per TA, which includes a count for each indication when drugs are developed for more than one rare disease within the TA, and when drugs targeting multiple rare diseases within the TA are only counted once (the number of unique drugs per TA). The vast majority of anticancer drugs pursue multiple rare oncology indications, which is evident by the large difference between total and unique number of drugs. In general, most TAs do have drugs that pursue multiple indications, but
not to the same dramatic extent as anticancer therapies.
ID has the largest number of rare diseases with drugs in development, followed closely by Alimentary/Metabolic, however, both TAs also have the most designated rare diseases (represented by the total height of the columns in Figure 4). Currently, drug development is active in 87% of rare infectious diseases and 92% of rare alimentary and metabolic conditions. Blood & Clotting, Genitourinary, and Hormonal all have R&D activity in each of their designated rare diseases, while the largest gap is observed in Dermatological and Cardiovascular, where 24% and 21% of their rare diseases, respectively, remain unaddressed by active drugs.
Figure 4. Therapeutic Area Distribution of Rare Diseases and Drugs in Development
Source: Pharmaprojects, October 2016
* Drugs in development for more than one rare disease within the therapeutic area are counted for each indication§ Count of each unique drug within the therapeutic area (i.e. drugs in development for more than one rare disease within the therapeutic area are only counted once).
120
100
80
60
40
20
0
3500
3000
2500
2000
1500
1000
500
0
# ra
re d
isea
ses
Infecti
ous Dise
ase
Alimentary/
Metabolic
Neurological
Cancer
Musculoske
letal
Blood and Clotting
Immunologica
l
Senso
ry
Cardiovasc
ular
Dermato
logical
Respira
tory
Hormonal
Genitourin
ary#
drug
s fo
r rar
e di
seas
es
# diseases with active drugs # diseases with no active drugs # total drugs per TA* # unique drugs per TA§
8 / January 2017 © Informa UK Ltd 2016 (Unauthorized photocopying prohibited.)
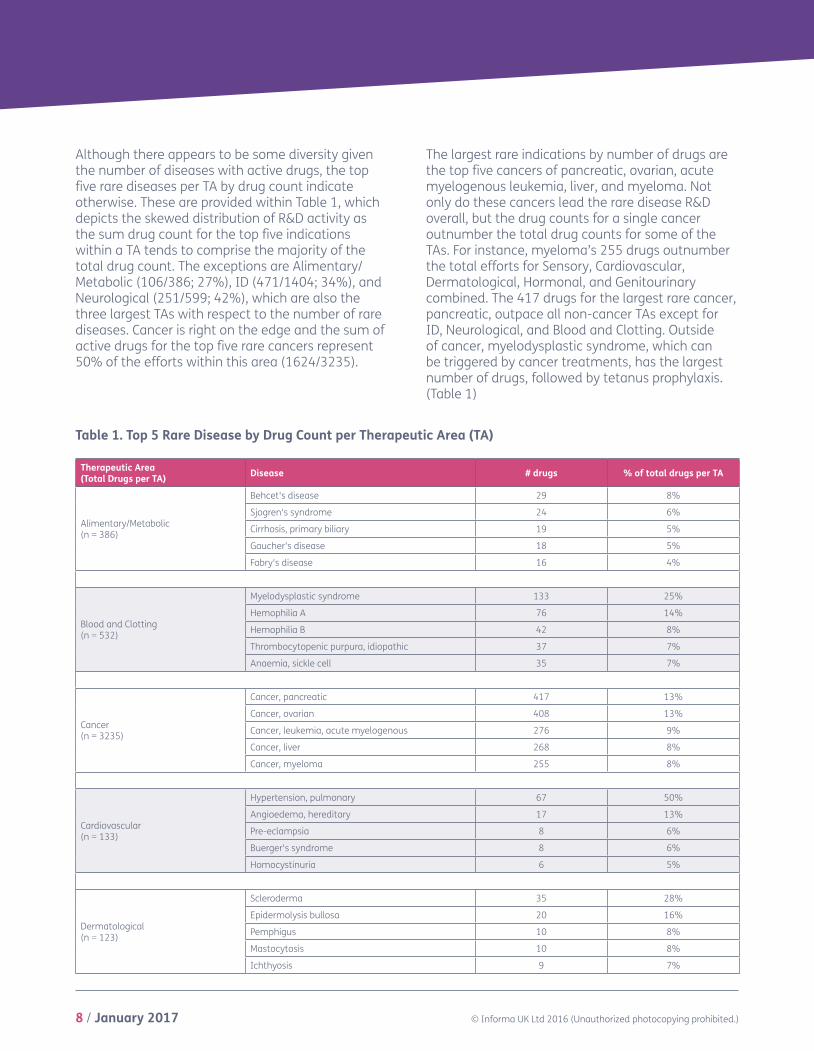
Although there appears to be some diversity given the number of diseases with active drugs, the top five rare diseases per TA by drug count indicate otherwise. These are provided within Table 1, which depicts the skewed distribution of R&D activity as the sum drug count for the top five indications within a TA tends to comprise the majority of the total drug count. The exceptions are Alimentary/Metabolic (106/386; 27%), ID (471/1404; 34%), and Neurological (251/599; 42%), which are also the three largest TAs with respect to the number of rare diseases. Cancer is right on the edge and the sum of active drugs for the top five rare cancers represent 50% of the efforts within this area (1624/3235).
The largest rare indications by number of drugs are the top five cancers of pancreatic, ovarian, acute myelogenous leukemia, liver, and myeloma. Not only do these cancers lead the rare disease R&D overall, but the drug counts for a single cancer outnumber the total drug counts for some of the TAs. For instance, myeloma’s 255 drugs outnumber the total efforts for Sensory, Cardiovascular, Dermatological, Hormonal, and Genitourinary combined. The 417 drugs for the largest rare cancer, pancreatic, outpace all non-cancer TAs except for ID, Neurological, and Blood and Clotting. Outside of cancer, myelodysplastic syndrome, which can be triggered by cancer treatments, has the largest number of drugs, followed by tetanus prophylaxis. (Table 1)
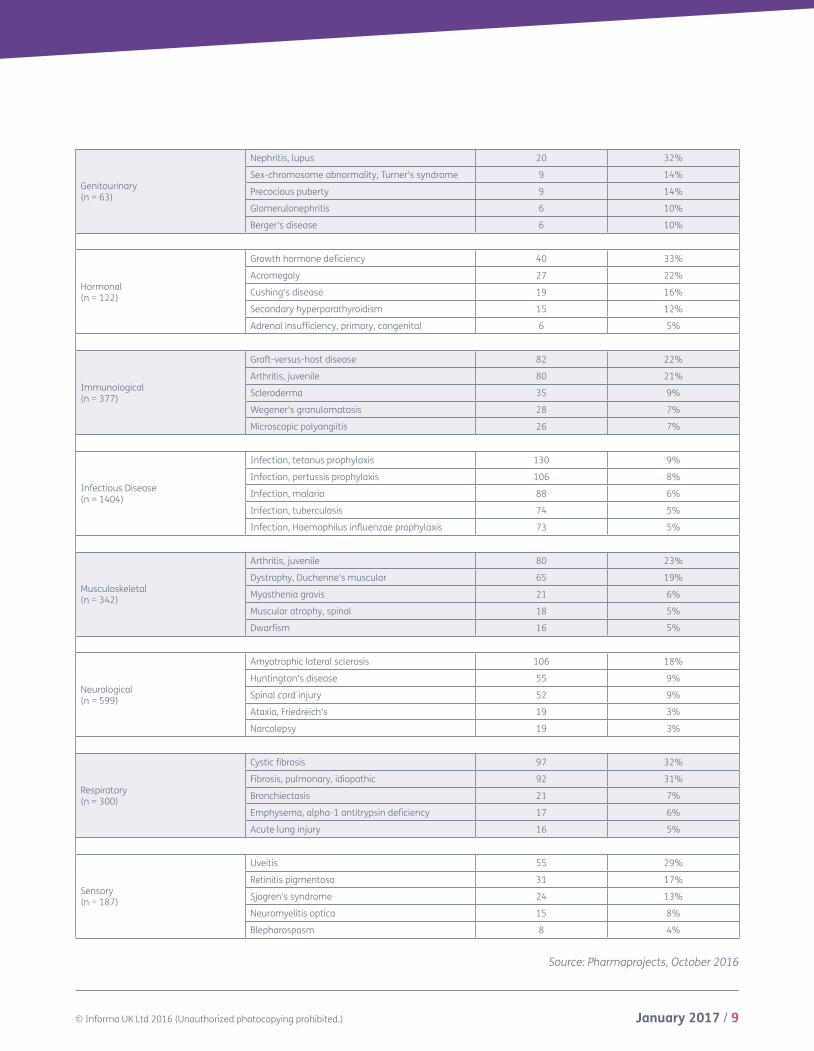
Table 1. Top 5 Rare Disease by Drug Count per Therapeutic Area (TA)
Therapeutic Area(Total Drugs per TA) Disease # drugs % of total drugs per TA
Alimentary/Metabolic(n = 386)
Behcet's disease 29 8%
Sjogren's syndrome 24 6%
Cirrhosis, primary biliary 19 5%
Gaucher's disease 18 5%
Fabry's disease 16 4%
Blood and Clotting(n = 532)
Myelodysplastic syndrome 133 25%
Hemophilia A 76 14%
Hemophilia B 42 8%
Thrombocytopenic purpura, idiopathic 37 7%
Anaemia, sickle cell 35 7%
Cancer(n = 3235)
Cancer, pancreatic 417 13%
Cancer, ovarian 408 13%
Cancer, leukemia, acute myelogenous 276 9%
Cancer, liver 268 8%
Cancer, myeloma 255 8%
Cardiovascular(n = 133)
Hypertension, pulmonary 67 50%
Angioedema, hereditary 17 13%
Pre-eclampsia 8 6%
Buerger's syndrome 8 6%
Homocystinuria 6 5%
Dermatological(n = 123)
Scleroderma 35 28%
Epidermolysis bullosa 20 16%
Pemphigus 10 8%
Mastocytosis 10 8%
Ichthyosis 9 7%
January 2017 / 9© Informa UK Ltd 2016 (Unauthorized photocopying prohibited.)
Genitourinary(n = 63)
Nephritis, lupus 20 32%
Sex-chromosome abnormality, Turner's syndrome 9 14%
Precocious puberty 9 14%
Glomerulonephritis 6 10%
Berger's disease 6 10%
Hormonal(n = 122)
Growth hormone deficiency 40 33%
Acromegaly 27 22%
Cushing's disease 19 16%
Secondary hyperparathyroidism 15 12%
Adrenal insufficiency, primary, congenital 6 5%
Immunological(n = 377)
Graft-versus-host disease 82 22%
Arthritis, juvenile 80 21%
Scleroderma 35 9%
Wegener's granulomatosis 28 7%
Microscopic polyangiitis 26 7%
Infectious Disease(n = 1404)
Infection, tetanus prophylaxis 130 9%
Infection, pertussis prophylaxis 106 8%
Infection, malaria 88 6%
Infection, tuberculosis 74 5%
Infection, Haemophilus influenzae prophylaxis 73 5%
Musculoskeletal(n = 342)
Arthritis, juvenile 80 23%
Dystrophy, Duchenne's muscular 65 19%
Myasthenia gravis 21 6%
Muscular atrophy, spinal 18 5%
Dwarfism 16 5%
Neurological(n = 599)
Amyotrophic lateral sclerosis 106 18%
Huntington's disease 55 9%
Spinal cord injury 52 9%
Ataxia, Friedreich's 19 3%
Narcolepsy 19 3%
Respiratory(n = 300)
Cystic fibrosis 97 32%
Fibrosis, pulmonary, idiopathic 92 31%
Bronchiectasis 21 7%
Emphysema, alpha-1 antitrypsin deficiency 17 6%
Acute lung injury 16 5%
Sensory(n = 187)
Uveitis 55 29%
Retinitis pigmentosa 31 17%
Sjogren's syndrome 24 13%
Neuromyelitis optica 15 8%
Blepharospasm 8 4%
Source: Pharmaprojects, October 2016
10 / January 2017 © Informa UK Ltd 2016 (Unauthorized photocopying prohibited.)
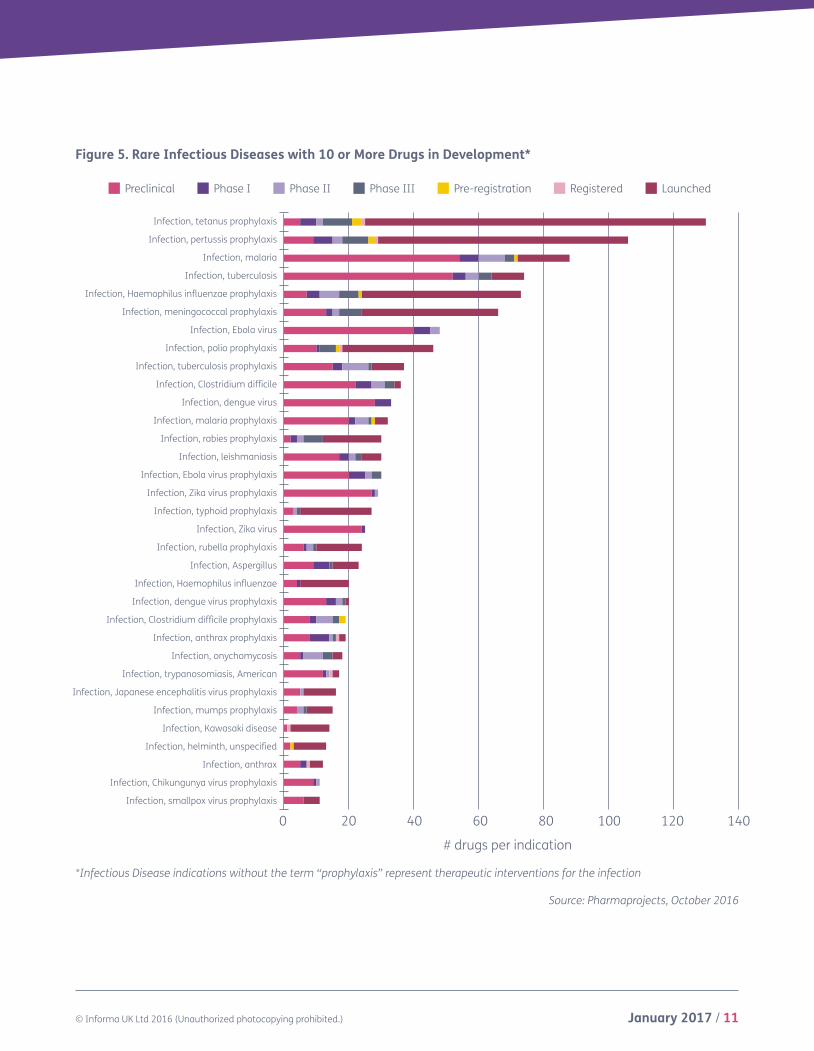
Infectious Disease activityThe large number of designated rare diseases for ID in Figure 4 can partially be attributed to the fact that many infections are combatted through prophylactic and therapeutic means, which are distinct indications within Pharmaprojects. However, ID remains one of the biggest TAs by disease number with a total of 69 unique rare infectious diseases. Among the 101 Pharmaprojects indications designated as rare diseases, 39 are specific to prophylaxis while 62 treat rare infectious diseases. Despite this, the proportion of activity is skewed toward prevention, which comprises 24 of the 33 rare ID indications with 10 active drugs or more. (Figure 5) Vaccines are the primary strategy pursued for these preventative interventions, and it’s not surprising to see large efforts within prophylaxis since the creation of vaccines is considered to be one of the most important public health achievements of the 20th century.
The leading rare infectious diseases by total number of active drugs are tetanus prophylaxis, pertussis prophylaxis, malaria, tuberculosis, and Haemophilus influenzae (Hib) prophylaxis. However, the drug counts for all the prophylaxis indications
are driven by the number of approved products; there are 105 launched products for tetanus, 77 for pertussis, and 49 for Hib prophylaxis. In contrast, the development of malaria and tuberculosis therapeutics is dominated by preclinical compounds, and these indications only have 16 and 10 launched therapeutics, respectively. Both tuberculosis prophylaxis and malaria prophylaxis also appear at 9th and 12th place, suggesting that they are a top priority for the pharma industry as they seek to eradicate these rare infectious diseases with multiple strategies.
The headline-grabbing outbreaks of the Ebola, Zika, and dengue viruses have certainly spurred the industry into action, and all three have at least 20 active drugs in development or more for both prophylaxis and treatment. Out of the three vector-borne viruses, only a single product has been launched, which is Sanofi’s dengue fever vaccine Dengvaxia. R&D activity across the three viruses is primarily preclinical; specifically, over 80% of therapeutics for Ebola and dengue and more than 90% of Zika prophylaxis and treatment are reported to be in preclinical development. (Figure 5)
January 2017 / 11© Informa UK Ltd 2016 (Unauthorized photocopying prohibited.)
Figure 5. Rare Infectious Diseases with 10 or More Drugs in Development*
Source: Pharmaprojects, October 2016
*Infectious Disease indications without the term “prophylaxis” represent therapeutic interventions for the infection
Preclinical Phase I Phase II Phase III Pre-registration Registered Launched
Infection, tetanus prophylaxis
Infection, pertussis prophylaxis
Infection, malaria
Infection, tuberculosis
Infection, Haemophilus influenzae prophylaxis
Infection, meningococcal prophylaxis
Infection, Ebola virus
Infection, polio prophylaxis
Infection, tuberculosis prophylaxis
Infection, Clostridium difficile
Infection, dengue virus
Infection, malaria prophylaxis
Infection, rabies prophylaxis
Infection, leishmaniasis
Infection, Ebola virus prophylaxis
Infection, Zika virus prophylaxis
Infection, typhoid prophylaxis
Infection, Zika virus
Infection, rubella prophylaxis
Infection, Aspergillus
Infection, Haemophilus influenzae
Infection, dengue virus prophylaxis
Infection, Clostridium difficile prophylaxis
Infection, anthrax prophylaxis
Infection, onychomycosis
Infection, trypanosomiasis, American
Infection, Japanese encephalitis virus prophylaxis
Infection, mumps prophylaxis
Infection, Kawasaki disease
Infection, helminth, unspecified
Infection, anthrax
Infection, Chikungunya virus prophylaxis
Infection, smallpox virus prophylaxis
0 20 40 60 80 100 120 140
# drugs per indication
12 / January 2017 © Informa UK Ltd 2016 (Unauthorized photocopying prohibited.)
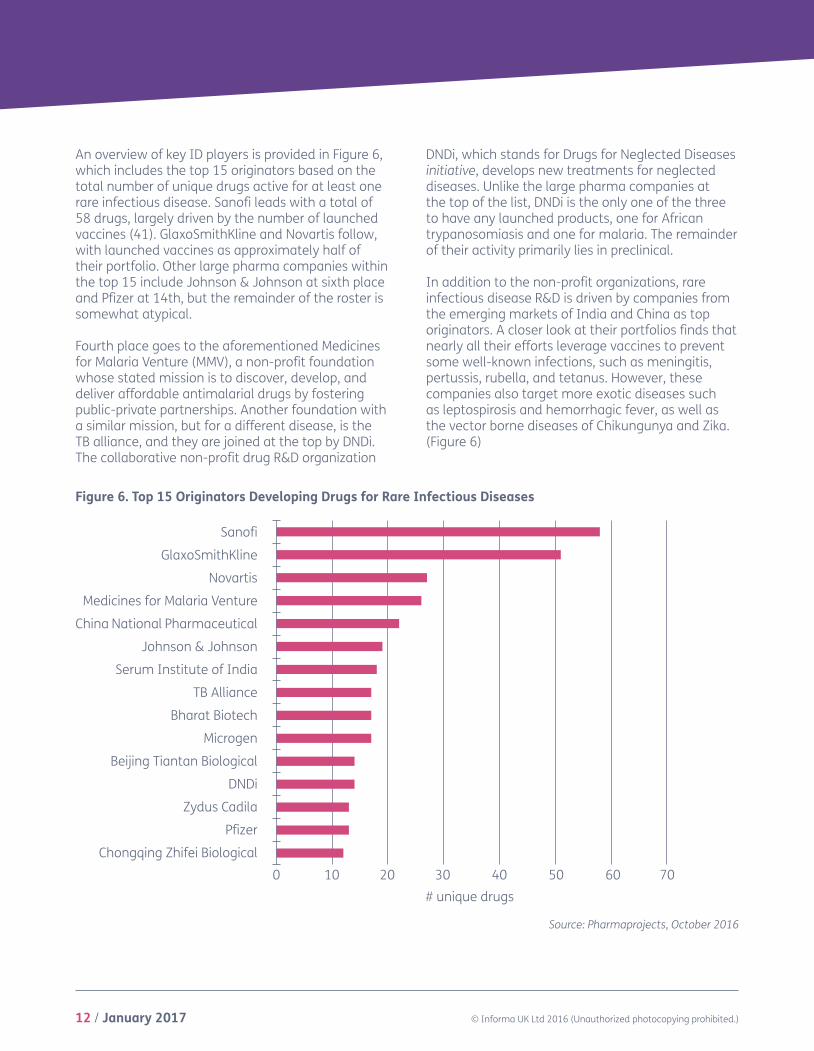
Figure 6. Top 15 Originators Developing Drugs for Rare Infectious Diseases
An overview of key ID players is provided in Figure 6, which includes the top 15 originators based on the total number of unique drugs active for at least one rare infectious disease. Sanofi leads with a total of 58 drugs, largely driven by the number of launched vaccines (41). GlaxoSmithKline and Novartis follow, with launched vaccines as approximately half of their portfolio. Other large pharma companies within the top 15 include Johnson & Johnson at sixth place and Pfizer at 14th, but the remainder of the roster is somewhat atypical.
Fourth place goes to the aforementioned Medicines for Malaria Venture (MMV), a non-profit foundation whose stated mission is to discover, develop, and deliver affordable antimalarial drugs by fostering public-private partnerships. Another foundation with a similar mission, but for a different disease, is the TB alliance, and they are joined at the top by DNDi. The collaborative non-profit drug R&D organization
DNDi, which stands for Drugs for Neglected Diseases initiative, develops new treatments for neglected diseases. Unlike the large pharma companies at the top of the list, DNDi is the only one of the three to have any launched products, one for African trypanosomiasis and one for malaria. The remainder of their activity primarily lies in preclinical.
In addition to the non-profit organizations, rare infectious disease R&D is driven by companies from the emerging markets of India and China as top originators. A closer look at their portfolios finds that nearly all their efforts leverage vaccines to prevent some well-known infections, such as meningitis, pertussis, rubella, and tetanus. However, these companies also target more exotic diseases such as leptospirosis and hemorrhagic fever, as well as the vector borne diseases of Chikungunya and Zika. (Figure 6)
Source: Pharmaprojects, October 2016
Sanofi
GlaxoSmithKline
Novartis
Medicines for Malaria Venture
China National Pharmaceutical
Johnson & Johnson
Serum Institute of India
TB Alliance
Bharat Biotech
Microgen
Beijing Tiantan Biological
DNDi
Zydus Cadila
Pfizer
Chongqing Zhifei Biological
0 10 20 30 40 50 60 70# unique drugs
January 2017 / 13© Informa UK Ltd 2016 (Unauthorized photocopying prohibited.)
Source: Pharmaprojects, October 2016
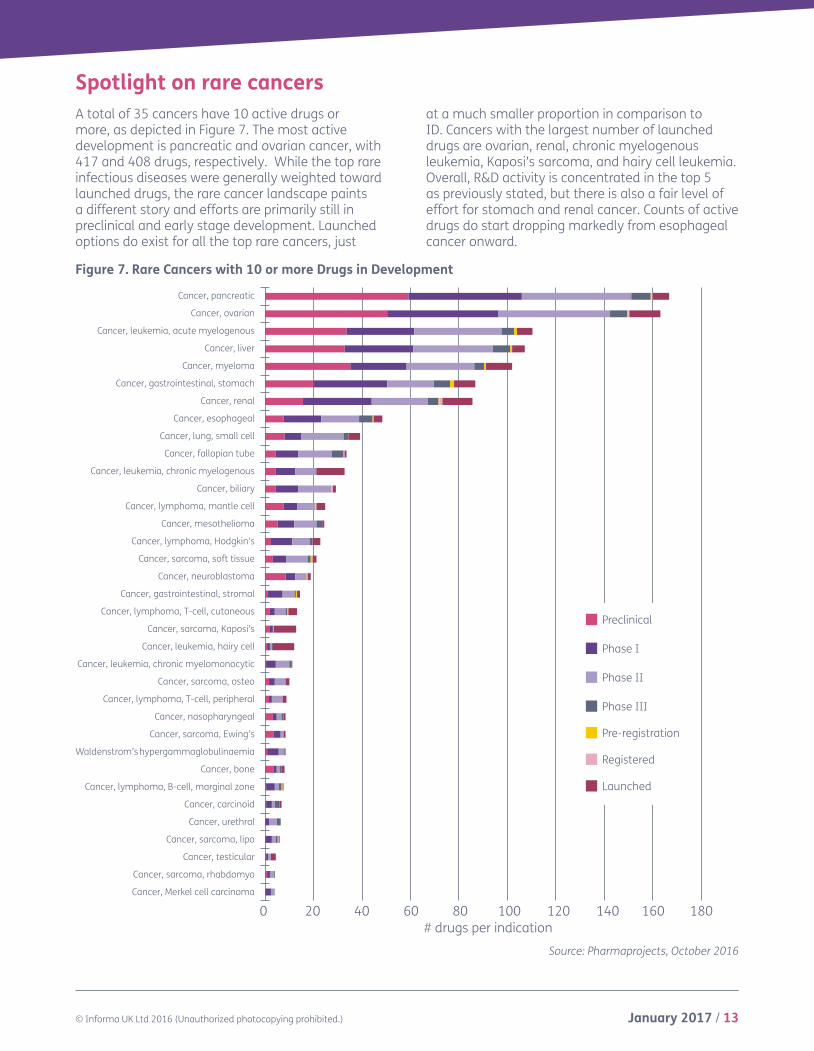
Spotlight on rare cancersA total of 35 cancers have 10 active drugs or more, as depicted in Figure 7. The most active development is pancreatic and ovarian cancer, with 417 and 408 drugs, respectively. While the top rare infectious diseases were generally weighted toward launched drugs, the rare cancer landscape paints a different story and efforts are primarily still in preclinical and early stage development. Launched options do exist for all the top rare cancers, just
at a much smaller proportion in comparison to ID. Cancers with the largest number of launched drugs are ovarian, renal, chronic myelogenous leukemia, Kaposi’s sarcoma, and hairy cell leukemia. Overall, R&D activity is concentrated in the top 5 as previously stated, but there is also a fair level of effort for stomach and renal cancer. Counts of active drugs do start dropping markedly from esophageal cancer onward.
Figure 7. Rare Cancers with 10 or more Drugs in Development
Cancer, pancreatic
Cancer, ovarian
Cancer, leukemia, acute myelogenous
Cancer, liver
Cancer, myeloma
Cancer, gastrointestinal, stomach
Cancer, renal
Cancer, esophageal
Cancer, lung, small cell
Cancer, fallopian tube
Cancer, leukemia, chronic myelogenous
Cancer, biliary
Cancer, lymphoma, mantle cell
Cancer, mesothelioma
Cancer, lymphoma, Hodgkin’s
Cancer, sarcoma, soft tissue
Cancer, neuroblastoma
Cancer, gastrointestinal, stromal
Cancer, lymphoma, T-cell, cutaneous
Cancer, sarcoma, Kaposi’s
Cancer, leukemia, hairy cell
Cancer, leukemia, chronic myelomonocytic
Cancer, sarcoma, osteo
Cancer, lymphoma, T-cell, peripheral
Cancer, nasopharyngeal
Cancer, sarcoma, Ewing’s
Waldenstrom’s hypergammaglobulinaemia
Cancer, bone
Cancer, lymphoma, B-cell, marginal zone
Cancer, carcinoid
Cancer, urethral
Cancer, sarcoma, lipo
Cancer, testicular
Cancer, sarcoma, rhabdomyo
Cancer, Merkel cell carcinoma
0 20 40 60 80 100 120 140 160 180# drugs per indication
Preclinical
Phase I
Phase II
Phase III
Pre-registration
Registered
Launched
14 / January 2017 © Informa UK Ltd 2016 (Unauthorized photocopying prohibited.)
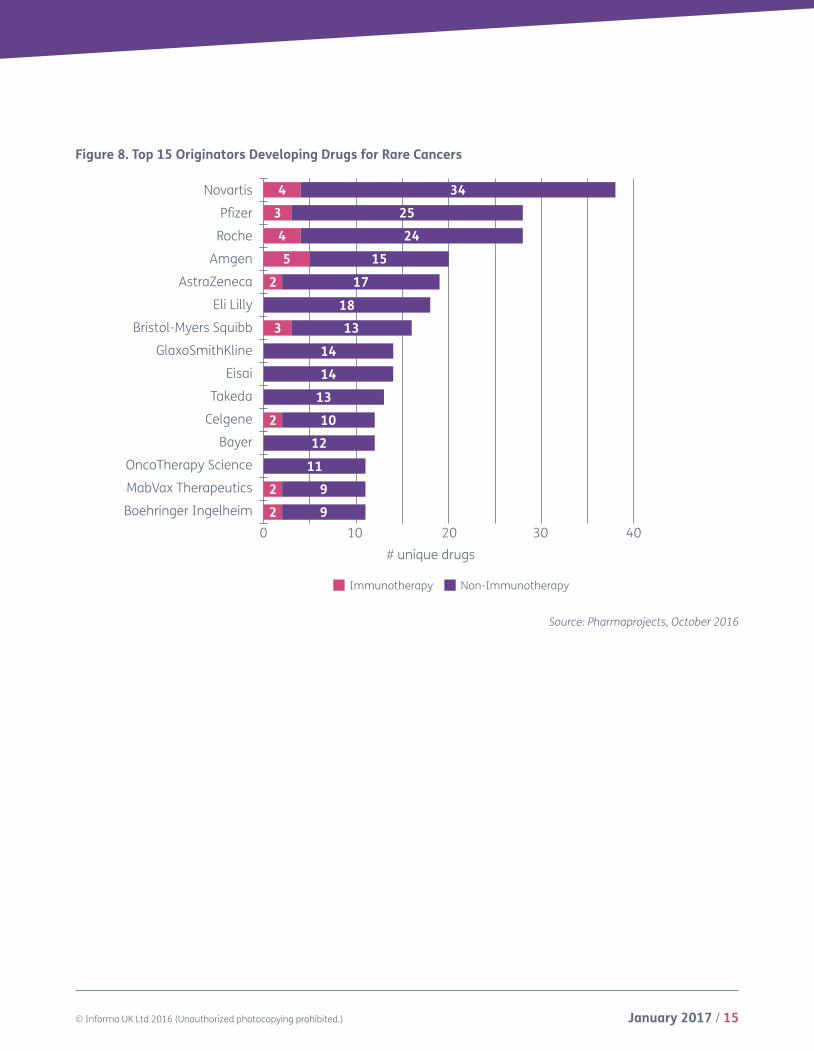
Among the top 15 originators within the anticancer space depicted in Figure 8, Novartis is the most active, both for the total number of unique drugs, as well as the number of pipeline candidates in development for at least one rare cancer. Pfizer and Roche tie for second place and the companies also possess the same number of unique launched drugs. However, across these top three originators, only a subset of their launched drugs have been approved for rare cancers. Most of their launched drugs have been launched for non-rare cancers, such as breast cancer. All three are pursuing a wide range of indications, including the ubiquitous pancreatic and ovarian cancers. Novartis has active drugs across 29 rare cancers and again, Pfizer and Roche tie with 23.
The burgeoning field of immuno-oncology (IO) continues to be an area of high interest and nine originators within this cohort are evaluating at least two immunotherapies for rare cancers. Amgen leads with five immuno-oncology drugs, which includes Imlygic, the first approved oncolytic viral therapy in the US that was launched for melanoma last year. Imlygic is under evaluation for a handful of non-rare oncology indications, and is currently in a Phase I trial for liver cancer. None of Amgen’s IO drugs have progressed beyond Phase I for rare cancers, and the largest efforts are observed with solitomab, an epithelial cell adhesion molecule inhibitor under evaluation in five different rare indications.
All the top originators also lead in their IO efforts. Novartis and Roche tie with four IO drugs each, while Pfizer has three. Roche’s primary effort has been with Tecentriq, which was recently approved for metastatic non-small cell lung cancer. This PD-L1 antagonist is still being studied in nine rare
indications spanning from preclinical to Phase III development, with small cell lung, renal, and urethral cancer as the forerunners. Another launched immunotherapy, GlycArt, is under evaluation for rare cancers. This CD20 antagonist has been approved for chronic lymphocytic leukemia (CLL) and registered for non-Hodgkin’s lymphoma (NHL). As of October 2016, GlycArt remains under clinical development for additional lymphoma types: marginal zone B-cell (Phase III) and mantle cell (Phase II). Roche’s remaining two immunotherapies, emactuzamab and ERY-974, are unapproved compounds that have not yet progressed beyond Phase II development.
Novartis also has four immuno-oncology drugs, including three chimeric antigen receptor T-cell (CAR-T) therapies that have been developed based on the in-licensed technology from the University of Pennsylvania. Part of the deal included CTL019, which targets CD19 expressed on cancer cells and is in Phase II for Hodgkin’s Lymphoma, but is mostly evaluated in non-rare cancers. Another is directed against mesothelin and is in Phase I trials to treat mesothelioma, pancreatic and ovarian cancer. A more recent candidate is an anti-BCMA CAR-T cell therapy with tandem TCR and 4-1BB costimulatory domains for the treatment of myeloma. This drug is also in a Phase I trial that is expected to complete in 2017. Despite the numerous candidates and clinical activity, in August 2016 the company announced plans to disband its cell and gene therapy unit. Although Novartis has reassured the public that they remain committed to the CAR-T space, it remains to be seen whether this commitment will be limited to the impending FDA filing of CTL019 for acute lymphoblastic leukemia (ALL) in early 2017.
January 2017 / 15© Informa UK Ltd 2016 (Unauthorized photocopying prohibited.)
Figure 8. Top 15 Originators Developing Drugs for Rare Cancers
Source: Pharmaprojects, October 2016
Non-ImmunotherapyImmunotherapy
Novartis
Pfizer
Roche
Amgen
AstraZeneca
Eli Lilly
Bristol-Myers Squibb
GlaxoSmithKline
Eisai
Takeda
Celgene
Bayer
OncoTherapy Science
MabVax Therapeutics
Boehringer Ingelheim
0 10 20 30 40# unique drugs
4 343 254 245 15
2 1718
3 131414
132 10
1211
2 992
16 / January 2017 © Informa UK Ltd 2016 (Unauthorized photocopying prohibited.)
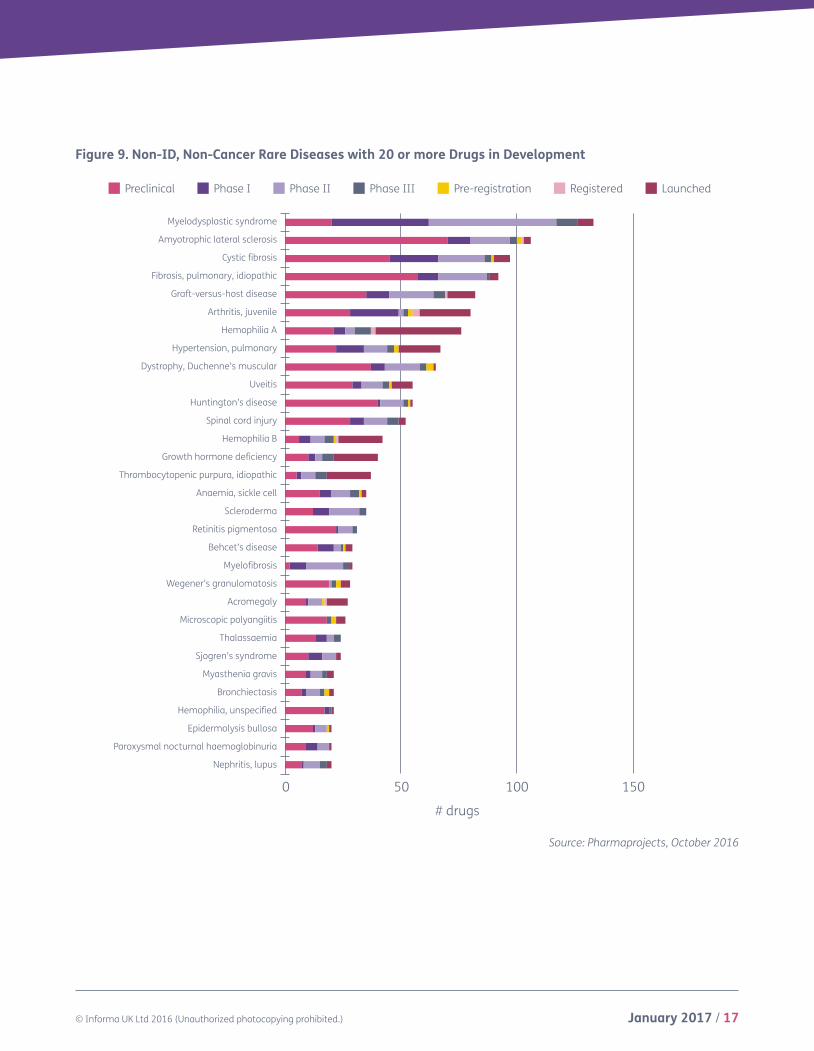
What’s happening elsewhere? Although ID and Cancer are the largest TAs for rare disease drug development, activity is far from limited outside these arenas. A total of 76 non-ID, non-Cancer rare diseases have 10 or more active drugs, and 31 have 20 or more as depicted in Figure 9. Among these diseases with 20 or more activedrugs, Blood & Clotting and Immunological are the most represented TAs based on number of diseases and the total number of drugs. Both appeared to be less active in Figure 4, but drug development in these TAs are more concentrated among a smaller group of diseases.
Myelodysplastic syndrome is the largest non-ID, non-Cancer rare disease with a total of 133 active drugs. However, radiation and chemotherapy are among the known triggers of development for this group of bone marrow disorders, and the Blood & Clotting indication could be considered tangentially related to cancer. Amyotrophic lateral sclerosis (ALS) follows with 106 active drugs, which includes a total of three launched and one registered drugs. In the 2013 analysis, only a single drug had been launched for ALS1. Since then, the rare disease was spurred into the spotlight following the viral Ice
Bucket Challenge that raised USD 115 million during an 8-week period in 2014, USD 77 million of which was dedicated to research2. The bulk of ALS research remains outside of clinical trials, with 66% of active drugs still in preclinical development.
Two Respiratory rare diseases fall at third and fourth place: cystic fibrosis and idiopathic pulmonary fibrosis (IPF) with 97 and 92 drugs, respectively. Following are the two Immunological indications graft-versus-host disease (GVHD) and juvenile arthritis. Most indications in Figure 9 have a somewhat limited number of launched drugs, especially in comparison to the top ID diseases, and a large amount of preclinical activity. Development stages beyond preclinical comprise the largest proportion of drugs for only six non-ID, non-cancer rare diseases. For hemophilia A, hemophilia B, growth hormone deficiency and idiopathic thrombocytopenic purpura, approximately half their drugs are launched, while MDS and myelofibrosis has the most activity in Phase II. There is also a single rare disease, acromegaly, with the same number of preclinical and launched drugs.
2 http://www.alsa.org/fight-als/ibc-progress.html [Accessed December 2016]
January 2017 / 17© Informa UK Ltd 2016 (Unauthorized photocopying prohibited.)
Figure 9. Non-ID, Non-Cancer Rare Diseases with 20 or more Drugs in Development
Source: Pharmaprojects, October 2016
Preclinical Phase I Phase II Phase III Pre-registration Registered Launched
Myelodysplastic syndrome
Amyotrophic lateral sclerosis
Cystic fibrosis
Fibrosis, pulmonary, idiopathic
Graft-versus-host disease
Arthritis, juvenile
Hemophilia A
Hypertension, pulmonary
Dystrophy, Duchenne’s muscular
Uveitis
Huntington’s disease
Spinal cord injury
Hemophilia B
Growth hormone deficiency
Thrombocytopenic purpura, idiopathic
Anaemia, sickle cell
Scleroderma
Retinitis pigmentosa
Behcet’s disease
Myelofibrosis
Wegener’s granulomatosis
Acromegaly
Microscopic polyangiitis
Thalassaemia
Sjogren’s syndrome
Myasthenia gravis
Bronchiectasis
Hemophilia, unspecified
Epidermolysis bullosa
Paroxysmal nocturnal haemoglobinuria
Nephritis, lupus
0 50 100 150
# drugs
18 / January 2017 © Informa UK Ltd 2016 (Unauthorized photocopying prohibited.)
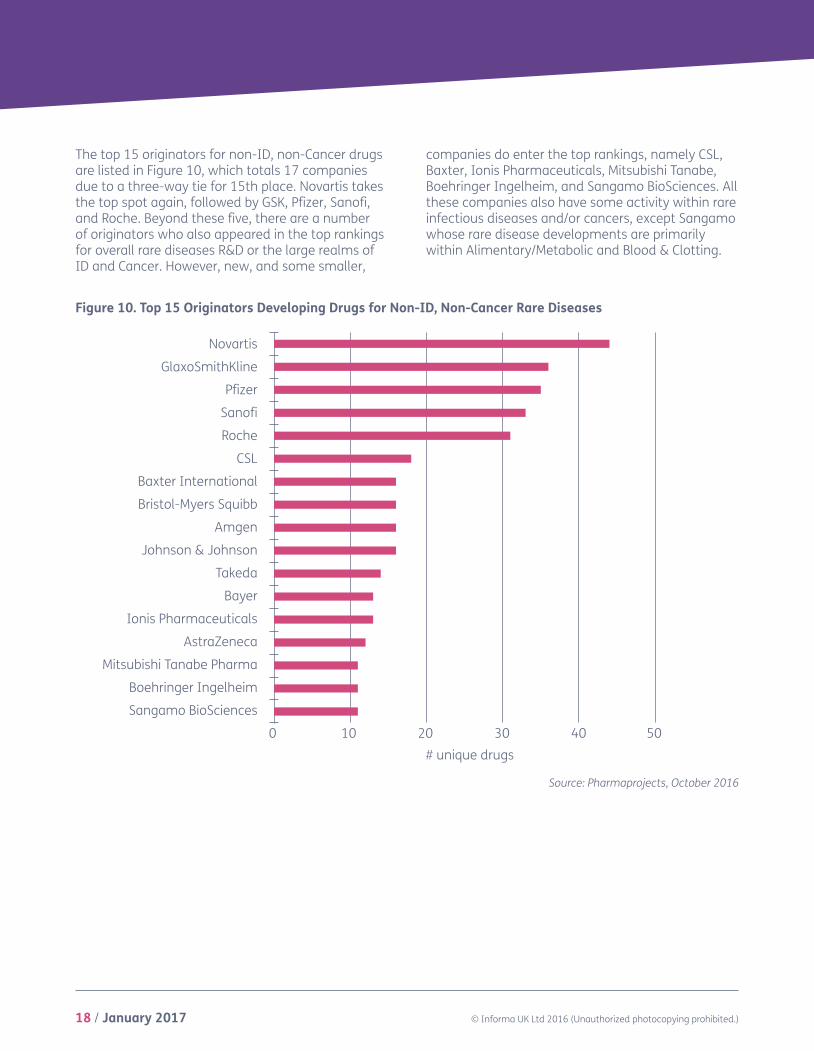
The top 15 originators for non-ID, non-Cancer drugs are listed in Figure 10, which totals 17 companies due to a three-way tie for 15th place. Novartis takes the top spot again, followed by GSK, Pfizer, Sanofi, and Roche. Beyond these five, there are a number of originators who also appeared in the top rankings for overall rare diseases R&D or the large realms of ID and Cancer. However, new, and some smaller,
companies do enter the top rankings, namely CSL, Baxter, Ionis Pharmaceuticals, Mitsubishi Tanabe, Boehringer Ingelheim, and Sangamo BioSciences. All these companies also have some activity within rare infectious diseases and/or cancers, except Sangamo whose rare disease developments are primarily within Alimentary/Metabolic and Blood & Clotting.
Figure 10. Top 15 Originators Developing Drugs for Non-ID, Non-Cancer Rare Diseases
Source: Pharmaprojects, October 2016
Novartis
GlaxoSmithKline
Pfizer
Sanofi
Roche
CSL
Baxter International
Bristol-Myers Squibb
Amgen
Johnson & Johnson
Takeda
Bayer
Ionis Pharmaceuticals
AstraZeneca
Mitsubishi Tanabe Pharma
Boehringer Ingelheim
Sangamo BioSciences
0 10 20 30 40 50# unique drugs
January 2017 / 19© Informa UK Ltd 2016 (Unauthorized photocopying prohibited.)
Conclusion Despite the additional challenges of developing drugs for rare diseases, it does not appear that this landscape will fade anytime soon. Sanofi, GSK, and Novartis lead the way with the largest number of drugs, as well as Eisai and Amgen who
have dedicated a large percentage of their smaller portfolios to rare diseases. The pursuit of potentially life transforming treatments and preventative measures to avoid certain diseases continues, with a strong focus from the industry on ID and Cancer.
Informa’s Pharma intelligence is home of the world’s leading pharma and healthcare R&D and business intelligence brands – Datamonitor Healthcare, Sitetrove, Trialtrove, Pharmaprojects, Medtrack, Biomedtracker, Scrip, Pink Sheet, In Vivo. Pharma intelligence’s brands are trusted to provide over 3000 of the world’s leading pharmaceutical, contract research organizations (CRO’s), medical technology, biotechnology and healthcare service providers, including the top 10 global pharma and top 10 CRO’s, with an advantage when making critical R&D and commercial decisions.
Accurate and timely intelligence about the drug development pipeline is vital to understanding the opportunities and risks in today’s biopharmaceutical marketplace – whether you are targeting an unmet medical need, investigating promising new therapies or researching drug development historical trends and treatment patterns. If you are providing contract research or other services in the pharma industry, you need to stand out. A solid understanding of your potential clients’ pipelines and competition will help you leave a lasting impression.
United States52 Vanderbilt Avenue11th FloorNew YorkNY 10017USA+1 646 957 8919+1 888 436 3012
United KingdomChristchurch Court10-15 Newgate StreetLondonEC1A 7HDUnited Kingdom+44 20 7017 5000
JapanKotakudo GinzaBuilding, 7th Floor5-14-5 GinzaChuo-kuTokyo104-0061+81 351 487 670
China23rd FloorChina Online Centre333 Lockhart RoadWanchaiHong Kong+85 239 667 222
AustraliaLevel 7120 Sussex StreetSydneyNSW 2000+61 2 8705 6900
Pharma Intelligence © 2016. All rights reserved. Pharma Intelligence is a trading division of Informa UK Ltd. Registered office: Mortimer House, 37-41 Mortimer Street, London W1T3JH, UK. Registered in England and Wales No 1072954
Discover the advantage of Pharma Intelligence here