a blueprint for urban sustainability: integrating sustainable energy practices … · ·...
TRANSCRIPT

A Blueprint For Urban Sustainability: Integrating Sustainable Energy Practices
Into Metropolitan Planning
Prepared by:
Sustainable Energy Planning Office Gas Technology Institute
www.gastechnology.org/sustainability
Primary Authors:
Una McGeough Doug Newman
Jay Wrobel
MAY 24, 2004

ii

DISCLAIMER
LEGAL NOTICE: This report was prepared by Gas Technology Institute (GTI) as an account of work sponsored by the Oak Ridge National Laboratory (ORNL). Neither ORNL, GTI nor any person acting on behalf of either: a. Makes any warranty or representation, express or implied with respect
to the accuracy, completeness, or usefulness of the information contained in this report, or that the use of any information, apparatus, method, or process disclosed in this report may not infringe privately owned rights; or
b. Assumes any liability with respect to the use of, or for any and all damages resulting from the use of, any information, apparatus, method, or process disclosed in this report
iii

ACKNOWLEDGEMENTS
This document is a product of many contributions and was inspired by the entries submitted to the first U.S. Competition for Metropolitan Energy Design, initiated by GTI’s Sustainable Energy Planning Office and conducted during the summer and fall of 2001 (see section 9.0). The competition produced seven finalists, and each finalist assumed a lead review responsibility corresponding to the subject area they led in the competition. These reviewers were:
City Subject Area Lead Official Austin Future Technologies Roger Duncan
Austin Energy Chattanooga Alternative Fuels - Mass
Transit Jim Frierson Advanced Transportation Technology Institute
Chicago Power Generation Steve Walter Department of Environment City of Chicago
Denver Alternative Fuels - Infrastructure & Fleet
Steve Foute Department of Environmental Health City and County of Denver, Colorado
Portland Renewables – Wind Curt Nichols Office of Sustainable Development City of Portland, Oregon
San Diego Renewables - Solar Scott Anders San Diego Regional Energy Office
Seattle Energy Efficiency Kim Drury Office of Sustainability and Environment City of Seattle
Submissions also were received from the Twin Cities Metropolitan Area (TCMA) of Minneapolis and St. Paul, Minnesota, with a self-directed focus on CO2 emission reduction plans and programs affiliated with the International Council for Local Environmental Initiatives (ICLEI) framework. Given that several other finalist cities share similar programs and associations with ICLEI, a section was added to chapter 1 of this document to address integrated environmental planning efforts to reduce global greenhouse gas emissions. The TCMA team, coordinated by Guy Fischer, Rick Person, and Mike Taylor, led the review of this section.
The competition submissions were evaluated by a panel of nationally recognized energy, environmental, and planning experts, who also acted as expert reviewers for this document. This panel included: James Cannon, President, Energy Futures, Inc.; Roger Duncan, Vice President, Conservation Renewables & Environmental Power, Austin Energy; the Honorable D. Bruce Merrifield, President of PRIDCO Management Company; Susan Ode, Program Manager, Cities for Climate Protection, International Council for Local Environmental Initiatives (ICLEI); Dr. David Rohy, Former Vice Chairman of the California Energy Commission; Jim Schwab, AICP, Senior Research Associate with the American Planning Association; and Suzanne Watson,
iv

Energy and Climate Team Leader, with the Northeast States for Coordinated Air Use Management (NESCAUM).
To provide an opportunity for additional input from cities across the nation, three organizations were enlisted to coordinate the participation of their membership. These were: Public Technologies Incorporated and the Urban Consortium Energy Task Force, whose lead coordinators were Sharron Brown and Roger Duncan; and ICLEI, whose coordinator was Susan Ode.
The authors also acknowledge the generous contributions received from: Fred Blood of the Transportation, Planning & Sustainability Department of Austin, Texas; John Bridger of the Chattanooga-Hamilton County Regional Planning Agency in Chattanooga, Tennessee; Robert Groberg, U.S. Department of Housing and Urban Development; Dennis McCloud of the Tennessee Valley Authority in Chattanooga, Tennessee; Skip Laitner of the U.S. Environmental Protection Agency; William Peden of the City of San Francisco; George Rainier, independent consultant; and Peter Dreyfuss and Stephanie Sung of the U.S. Department of Energy Chicago Regional Office.
Finally, for their detailed review and comment on the CHP section of this publication, the authors would also like to acknowledge the following industry and government experts: John Jimison (U.S. Combined Heat & Power Association), Rich Scheer (Energetics, Inc.), Rich Sweetser (Exergy Partners Corp.), Rob Thornton (International District Energy Association), Luis Troche (U.S. EPA Combined Heat and Power Partnership), and Walter Woods (American Gas Foundation).
v
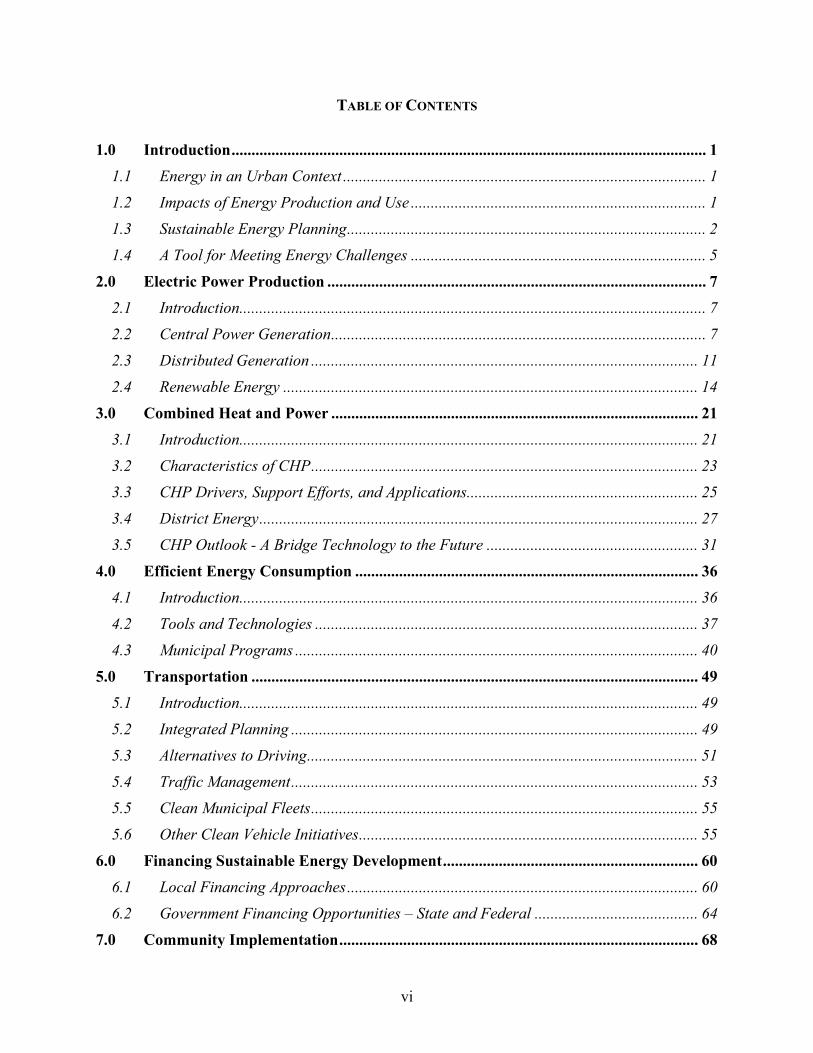
TABLE OF CONTENTS
1.0 Introduction....................................................................................................................... 1
1.1 Energy in an Urban Context ........................................................................................... 1
1.2 Impacts of Energy Production and Use .......................................................................... 1
1.3 Sustainable Energy Planning.......................................................................................... 2
1.4 A Tool for Meeting Energy Challenges .......................................................................... 5
2.0 Electric Power Production ............................................................................................... 7
2.1 Introduction..................................................................................................................... 7
2.2 Central Power Generation.............................................................................................. 7
2.3 Distributed Generation ................................................................................................. 11
2.4 Renewable Energy ........................................................................................................ 14
3.0 Combined Heat and Power ............................................................................................ 21
3.1 Introduction................................................................................................................... 21
3.2 Characteristics of CHP................................................................................................. 23
3.3 CHP Drivers, Support Efforts, and Applications.......................................................... 25
3.4 District Energy.............................................................................................................. 27
3.5 CHP Outlook - A Bridge Technology to the Future ..................................................... 31
4.0 Efficient Energy Consumption ...................................................................................... 36
4.1 Introduction................................................................................................................... 36
4.2 Tools and Technologies ................................................................................................ 37
4.3 Municipal Programs ..................................................................................................... 40
5.0 Transportation ................................................................................................................ 49
5.1 Introduction................................................................................................................... 49
5.2 Integrated Planning ...................................................................................................... 49
5.3 Alternatives to Driving.................................................................................................. 51
5.4 Traffic Management...................................................................................................... 53
5.5 Clean Municipal Fleets................................................................................................. 55
5.6 Other Clean Vehicle Initiatives..................................................................................... 55
6.0 Financing Sustainable Energy Development................................................................ 60
6.1 Local Financing Approaches........................................................................................ 60
6.2 Government Financing Opportunities – State and Federal ......................................... 64
7.0 Community Implementation.......................................................................................... 68
vi

7.1 Introduction................................................................................................................... 68
7.2 Community Organizations ............................................................................................ 68
7.3 State, Regional, and Federal Entities ........................................................................... 71
8.0 Sustainable Energy Planning for Smaller Communities............................................. 73
8.1 Introduction................................................................................................................... 73
8.2 Small Community Issues ............................................................................................... 73
8.3 Adapting Solutions ........................................................................................................ 76
9.0 City Summaries – U.S. Competition on Metropolitan Energy Design....................... 77
9.1 City of Austin................................................................................................................. 77
9.2 City of Chattanooga...................................................................................................... 78
9.3 City of Chicago ............................................................................................................. 79
9.4 City of Denver ............................................................................................................... 80
9.5 City of Portland............................................................................................................. 81
9.6 San Diego Regional Energy Office (SDREO)............................................................... 82
9.7 City of Seattle................................................................................................................ 83
9.8 Twin Cities Metropolitan Area (Minneapolis & St. Paul)............................................ 84
9.9 City Participation in Sustainable Energy Programs .................................................... 85
10.0 Appendices....................................................................................................................... 86
10.1 Sustainable Energy Planning Framework and Methodology....................................... 86
10.2 Summary of State Net Metering Programs ................................................................... 93
11.0 References........................................................................................................................ 97
vii

1.0 INTRODUCTION
1.1 Energy in an Urban Context 100 Years of US Population
-
50
100
150
200
250
1999
1990
1980
1970
1960
1950
1940
1930
1920
1910
1900
Popu
latio
n (m
illio
ns)
Urban
Cities in the United States are facing a growing crisis. Today, 80 percent of the U.S. population resides in urban areas and more than half live in the 25 largest metropolitan regions. These metropolitan regions already are facing the challenges of extended commute times, increasing energy costs, ozone alerts, and other urban irritants and problems leading to a declining quality of life. If current population growth trends continue, the increasing concentration of population in urban areas will only exacerbate this crisis. (U.S. 2000 Census)
Rural
Since it is unlikely that population trends will reverse, it becomes imperative that metropolitan regions become proactive in finding creative ways to address these challenges. Developing innovative methods to meet energy needs is among the most crucial challenges.
1.2 Impacts of Energy Production and Use American cities and towns account for the majority of national energy use, and this energy use assures the safety, security, functionality, and comfort of homes, businesses, and industry. At the same time, energy production and consumption have significant impacts on our economy, environment, and health.
In the United States, $699 billion, approximately seven percent of the Gross Domestic Product (GDP), was spent on energy purchases in 2001. A significant portion of these expenditures flows out of local communities, and this flow negatively affects their economic development. Oil imports alone accounted for $208 billion. Projected increases in energy demand mean that energy expenditures are expected to increase to over $1 trillion by 2025 (EIA Annual Energy Outlook 2003).
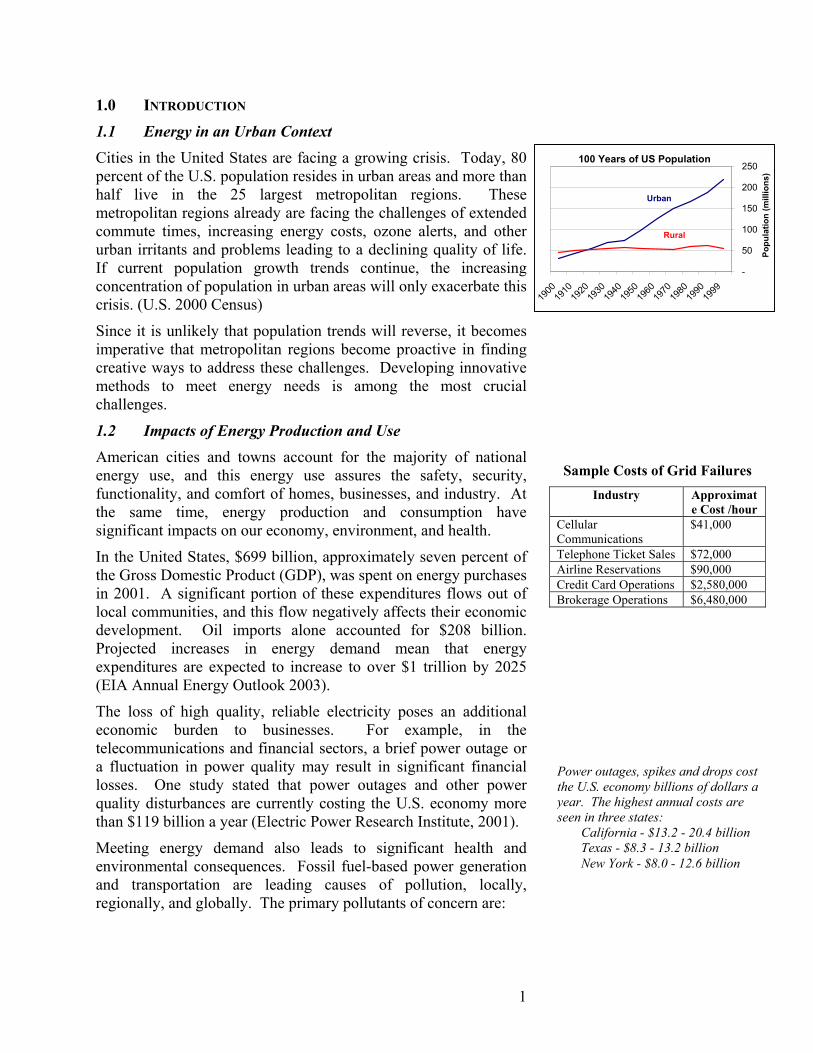
The loss of high quality, reliable electricity poses an additional economic burden to businesses. For example, in the telecommunications and financial sectors, a brief power outage or a fluctuation in power quality may result in significant financial losses. One study stated that power outages and other power quality disturbances are currently costing the U.S. economy more than $119 billion a year (Electric Power Research Institute, 2001).
Meeting energy demand also leads to significant health and environmental consequences. Fossil fuel-based power generation and transportation are leading causes of pollution, locally, regionally, and globally. The primary pollutants of concern are:
1
Sample Costs of Grid Failures Industry Approximat
e Cost /hour Cellular Communications
$41,000
Telephone Ticket Sales $72,000 Airline Reservations $90,000 Credit Card Operations $2,580,000 Brokerage Operations $6,480,000
Power outages, spikes and drops cost the U.S. economy billions of dollars a year. The highest annual costs are seen in three states:
California - $13.2 - 20.4 billion Texas - $8.3 - 13.2 billion New York - $8.0 - 12.6 billion

• Nitrogen oxides (NOx): the primary cause of smog
Natural Threats to Energy Security
Severe meteorological events,
including hurricanes, ice storms, blizzards and tornadoes, can severely
and rapidly impair generation and transmission systems, with significant consequences for the flow of energy
to consumers
PM - Respiratory disease, cardiopulmonary and lung cancer mortality
Mercury - Affects growth and development when ingested
SO2 - Respiratory disease
Energy-Related Pollution – Health Impacts
NOx - Respiratory disease
CO2 - Heat stroke and disease linked to climate change
• Carbon dioxide (CO2): a leading cause of global warming • Sulfur dioxide (SO2): a leading contributor to acid rain • Particulate matter (PM): a contributor to smog, acid rain, and
regional haze • Mercury: a toxic heavy metal that accumulates in plants and
animals These pollutants also have significant impacts on public health, especially asthma and other respiratory ailments (see sidebar).
Failures of the energy system can also cause public health problems. In 1995, high electricity demand during heat waves seriously compromised Chicago’s aging transmission and distribution system, leading to widespread power outages, failure of air conditioning systems, and hundreds of deaths. Similarly, reliable energy systems are essential to deliver heat during cold winter months, and to support critical medical facilities year-round.
Finally, energy security, especially since the events of September 11, 2001, is of great concern to the public. A report by the Union of Concerned Scientists (UCS, 2002) indicates that the nation’s current energy infrastructure is highly exposed and makes an easy target for a well-placed attack. A disruption at a key power plant, refinery, transmission hub, or pipeline could interrupt the flow of electricity or fuel to millions of customers and create costly energy price spikes or power outages, while also incurring significant damage to public welfare. A major accident at a nuclear power plant could have even more drastic consequences.
America’s Global Warming Solutions (Tellus Institute, 1999) predicts annual household energy savings of $350 and creation of
almost 900,000 new jobs by 2020 through accelerated use of
renewable energy and energy efficiency measures.
“Job Jolt: The Economic Impacts of Repowering the Midwest”
(Environmental Law and Policy Center, 2003) finds that
implementing clean energy measures across a 10-state Midwest
region would yield over 200,000 new jobs and $19.4 billion in
increased economic output by 2020.
1.3 Sustainable Energy Planning Because all these impacts are significant and growing, metropolitan regions must take steps to correct the situation today and plan for the expected demands of tomorrow. Cities need sound planning in order to improve the quality of urban life while maintaining economic prosperity. Sustainable energy planning addresses all of these impacts by integrating environmentally benign energy technologies and management practices into metropolitan energy infrastructure development and operations. Sustainable energy planning can bring multiple economic benefits in addition to the more obvious environmental advantages. First, the implementation of sustainable energy programs and technologies can decrease the costs associated with public health and environmental impacts (e.g., medical care and environmental compliance). Aggressive implementation of energy efficiency and renewable energy technologies can also stimulate economic development.
2
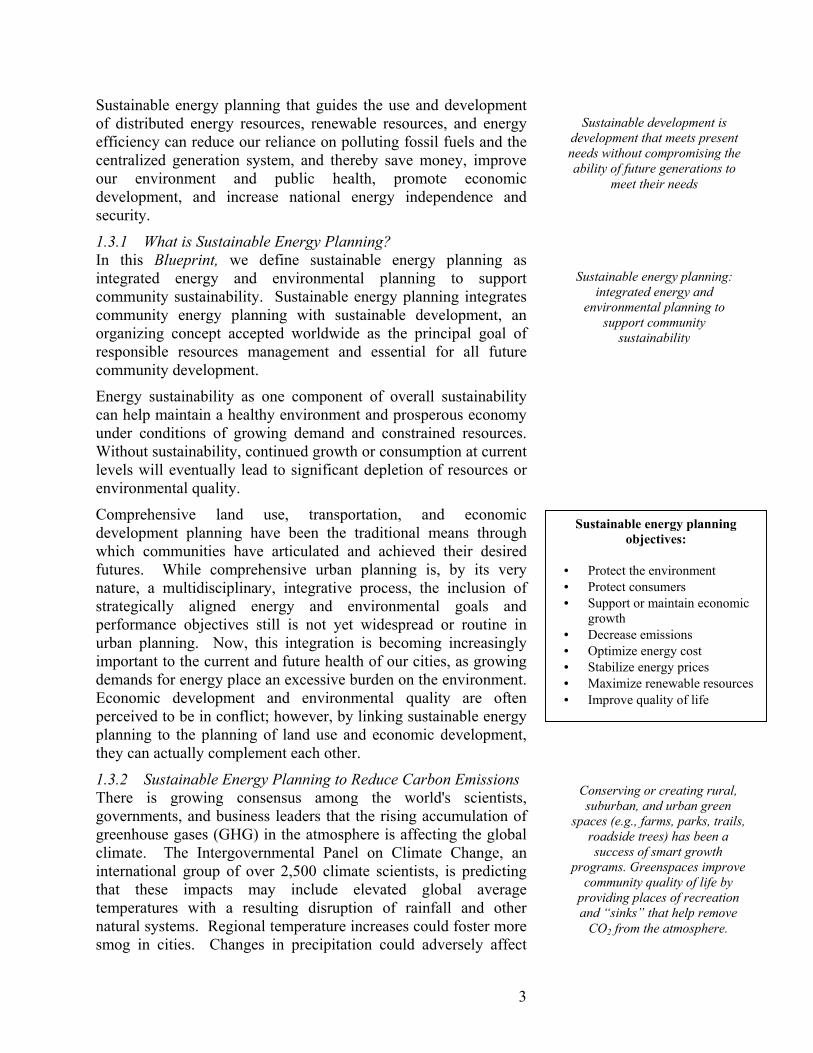
Sustainable energy planning that guides the use and development of distributed energy resources, renewable resources, and energy efficiency can reduce our reliance on polluting fossil fuels and the centralized generation system, and thereby save money, improve our environment and public health, promote economic development, and increase national energy independence and security.
Sustainable development is development that meets present needs without compromising the ability of future generations to
meet their needs
1.3.1 What is Sustainable Energy Planning? In this Blueprint, we define sustainable energy planning as integrated energy and environmental planning to support community sustainability. Sustainable energy planning integrates community energy planning with sustainable development, an organizing concept accepted worldwide as the principal goal of responsible resources management and essential for all future community development.
Energy sustainability as one component of overall sustainability can help maintain a healthy environment and prosperous economy under conditions of growing demand and constrained resources. Without sustainability, continued growth or consumption at current levels will eventually lead to significant depletion of resources or environmental quality.
Comprehensive land use, transportation, and economic development planning have been the traditional means through which communities have articulated and achieved their desired futures. While comprehensive urban planning is, by its very nature, a multidisciplinary, integrative process, the inclusion of strategically aligned energy and environmental goals and performance objectives still is not yet widespread or routine in urban planning. Now, this integration is becoming increasingly important to the current and future health of our cities, as growing demands for energy place an excessive burden on the environment. Economic development and environmental quality are often perceived to be in conflict; however, by linking sustainable energy planning to the planning of land use and economic development, they can actually complement each other.
•••
•••••
1.3.2 Sustainable Energy Planning to Reduce Carbon Emissions There is growing consensus among the world's scientists, governments, and business leaders that the rising accumulation of greenhouse gases (GHG) in the atmosphere is affecting the global climate. The Intergovernmental Panel on Climate Change, an international group of over 2,500 climate scientists, is predicting that these impacts may include elevated global average temperatures with a resulting disruption of rainfall and other natural systems. Regional temperature increases could foster more smog in cities. Changes in precipitation could adversely affect
3
Sustainable energy planning: integrated energy and
environmental planning to support community
sustainability
Sustainable energy planning objectives:
Protect the environment Protect consumers Support or maintain economic
growth Decrease emissions Optimize energy cost Stabilize energy prices Maximize renewable resources Improve quality of life
Conserving or creating rural, suburban, and urban green
spaces (e.g., farms, parks, trails, roadside trees) has been a success of smart growth
programs. Greenspaces improve community quality of life by
providing places of recreation and “sinks” that help remove
CO2 from the atmosphere.

urban water supplies. Rising sea level could affect infrastructure in many coastal areas. Portland, Oregon became the first
city in the United States to create aCarbon Dioxide Reduction Strategy.In 2000, Portland created the Officeof Sustainable Development togovern energy issues, communityoutreach, green building, and solidwaste/ recycling. In May 2002, theCity of Portland received a ClimateProtection Award from EPA, whichrecognized the City’saccomplishments to date. Local percapita CO2 emissions are now morethan seven percent below 1990levels. Statewide, Oregon has a2010 goal of 13 metric tons of CO2emissions per capita, down from the1999 level of 16.5 metric tons perperson. This equates to a 10 percentreduction below 1990 levels by2010.
Energy-related carbon dioxide emissions are the major component of GHG emissions. Thus, sustainable energy planning offers local governments an integrated approach that can be applied to mitigate the long-term risks that climate change poses in urban environments. Such an approach may include expanding transportation choices, conserving green spaces, and promoting new energy-efficient community and housing designs that promote transit-oriented developments, encourage infill and mixed-use development, and reduce energy use in commercial and residential buildings. In addition to being effective strategies for GHG reductions, these approaches offer alternatives to costly government regulations and help protect community quality of life.
The International Council for Local Environmental Initiatives (ICLEI) was launched in 1990 with a mission to build and serve a worldwide movement of local governments to achieve tangible improvements in global environmental and sustainable development conditions through cumulative local actions. One of the most important initiatives of ICLEI is the Cities for Climate Protection Campaign.
Since 1992, the Cities for Climate Protection (CCP) Campaign enlists cities that adopt policies and implement measures to achieve measurable reductions in local greenhouse gas emissions, improve air quality, and enhance urban livability and sustainability. The campaign presently includes over 400 municipalities that collectively account for nearly 8 percent of anthropogenic global greenhouse gas emissions. CCP Participants adopt a local government resolution, and then undertake and complete five performance milestones.
In 1998, CO2 emissions werecatalogued for the City of Denver,Colorado. The findings pointed tothe need for increased energyefficiency and conservation,expanded renewables, sustainabletransportation measures, education,and sequestration of CO2. Actionstaken have included planting 1,000trees per year, adding bicycle paths,purchasing wind power, andupgrading street and municipallighting with higher efficiencylights. Annual CO2 reductionsreached 25,500 tons per year by2000 (equal to about 8,500 cars).Denver plans to reduce CO2emissions per capita to 10 percentbelow 1995 baseline levels by 2010.
1. Conduct an energy and emissions inventory and forecast 2. Establish an emissions target 3. Develop and obtain approval for their local action plan 4. Implement the planned policies and measures 5. Monitor and verify results 1.3.3 A Framework for Sustainable Energy Planning Sustainable energy planning is designed to incorporate a community’s strategically aligned energy and environmental goals and objectives into the comprehensive metropolitan planning process. Sustainable energy plans and programs should be incorporated into communities’ overall comprehensive or general plans, which guide all decision-making at the community level.
4

It is important to note that there is no single sustainable energy plan or planning process suitable for all communities. All communities have unique social, economic, institutional, and physical features, and they require unique sustainable energy plans designed for those particular characteristics. Thus, effective program innovation for sustainable development must be inspired by a global awareness, but originated and deployed locally. (As a sample approach, we have included a seven-phase process that is widely used by planners in Appendix 10.1.)
An effective sustainable energy plan integrates a variety of urban systems
technologies, programs, and management practices
Sustainable energy plans must be incorporated into communities’ comprehensive plans, to ensure
their relevance and efficacy.
Twin Cities, Minnesota. St. Pauland Minneapolis participated jointlyin the International Urban CarbonDioxide (CO2) Emissions ReductionProject, the pilot project for ICLEI’sCCP. St. Paul and Minneapolis bothcontinue to participate in the CCP asseparate entities, and, in 1993, St.Paul initiated the St. PaulEnvironmental-Economic Partnership Project (E-EPP) in orderto implement the City’s Urban CO2Reduction Plan. A goal was set toreduce CO2 emissions by 20 percentfrom 1988 levels by 2005. In SaintPaul, this means a reduction ofabout 2.65 million tons ofCO2emissions by 2005.
Furthermore, it’s important not to think of sustainable energy plans as separate and distinct from other community imperatives. A truly effective sustainable energy plan not only improves transportation, enhances residential energy efficiency, and shifts to cleaner sources of power generation, it also integrates urban systems technologies, programs, and management practices across all sectors of energy use.
1.4 A Tool for Meeting Energy Challenges A Blueprint for Urban Sustainability is a resource designed to help cities develop sustainable energy plans that will enable communities to meet their present needs without compromising the ability of future generations to meet their needs.
The Blueprint constitutes a unique resource with its inclusion of case study examples, technological information, and contacts, especially applicable to metropolitan communities. The resulting compendium of best practices and programs can play a critical role in helping communities not only plan for sustainability, but also actually implement the measures that will result in sustainability.
The Blueprint catalogs clean energy technologies and best management practices that form the critical elements of a community sustainable energy plan. These elements are discussed in chapters that address power generation, energy efficiency, and transportation. The Blueprint also looks at integrated approaches to reducing greenhouse gas emissions and resources for financing sustainable energy plans. Finally, relevant case studies, institutional resources, and contacts are included. While the Blueprint has been developed for U.S. cities, with input from national energy and sustainability experts, policy makers, and program managers, many of its lessons apply to metropolitan regions around the world.
5

6
A Context for A Blueprint for Urban Sustainability
Many guides address different aspects of community, energy, and economic development planning. Forexample, the American Public Power Association developed Planning for Success – An EconomicDevelopment Guide for Small Public Power Communities. This guide focuses on describing a process forcommunities to implement strategic planning for economic development, especially with respect to the role forpublic utilities. The Rocky Mountain Institute has also published the Community Energy Workbook – A Guideto Building a Sustainable Economy, which also focuses on process – a process for carrying out communityenergy planning. Both function as workbooks that describe an approach for integrating planning principles intoa process to attain community goals for sustainability and economic development. The American PlanningAssociation published A Planner’s Guide to Sustainable Development, which provides a perspective on thebroader concept of sustainable development, its meaning at the local level, strategies for planners’ involvementin community sustainable development programs, as well as some case studies. A different approach has beenarticulated in PLACE3S, or Planning for Community Energy, Economy, and Environmental Sustainability,an urban planning method designed to help communities discern an effective path toward sustainability. Thisapproach integrates public participation, planning, design, and quantitative measurement and employs energy asa yardstick to measure the sustainability of urban design and growth management plans. Many more guides existthat offer valuable tools and perspectives in addressing the related concerns of energy, environment, andsustainability. In addition to these general guides, GTI’s Sustainable Energy Planning Office (SEPO) has developed, in consortwith many partners, “A Sustainable Urban System Design for the Greater San Diego-Tijuana BinationalMetropolitan Region.” This design serves as an example of a comprehensive regional approach to sustainabilitythat integrates all urban infrastructure technologies with energy efficient and ecologically sound land usedevelopment. The design articulates a 100-year vision for regional urban sustainability and a roadmap describingthe interim steps.

2.0 ELECTRIC POWER PRODUCTION
2.1 Introduction Electricity supply and delivery have become critical issues as metropolitan areas prepare for the future. While the outlook for most urban areas points to increased need for power, many urban power distribution grids are near capacity, and expansion is usually costly and disruptive. New power generation is projected to come primarily from the increased operation of existing coal plants, installation of large natural gas facilities, and increasing amounts of renewable energy. In addition, power produced near or within cities has negative impacts on the local public health and welfare, due primarily to air pollution. In many urban regions, these negative impacts motivate the community’s residents to demand energy management, clean energy, or renewable energy sources. City governments and planners have responded by incorporating energy and its impact on the environment into their city growth plans. This section will examine metropolitan planning with regard to electricity production – in particular, the use of cleaner fossil fuels, the use of renewable energy, and the advancement of distributed energy resources.
2.2 Central Power Generation
2.2.1 Background In the U.S., power is predominantly produced by large coal and nuclear generating facilities linked to demand areas by a transmission grid. This separation of demand and supply was instituted in order to remove air emissions from the major cities as well as to create a reliable and secure national energy infrastructure. Freed from immediate environmental concerns, power plants grew in size and production capacity. These large central plants generated electricity at a lower cost than the smaller city-based plants they replaced. Metropolitan communities embraced central power and benefited from an abundant energy supply that was inexpensive and reliable, with air quality impacts far removed from the cities. The current average cost of central power generation is very low (usually less than 2 cents per kWh) due primarily to the prevalence of coal-fired power plants in the U.S., including many older plants that are exempt from federal Clean Air Act requirements. The primary central generation technologies are described below.
• Steam Generator. A steam generator plant is one in which a fuel source is burned, or a nuclear reaction takes place, creating heat to produce steam. The steam then drives a turbine that is connected to an electric generator. Steam generators use fossil fuels (coal, gas and oil), nuclear fuel, or other energy sources
7

such as biomass or geothermal energy. The overall efficiency of this type of plant is generally in the 25 to 35 percent range.
• Gas Turbine. A gas turbine plant uses the hot gas from the combustion of fossil fuels, usually natural gas, to power a turbine, rather than to create steam. The turbine is then connected to a generator, as in a steam plant. Efficiencies for these plants are approximately 30 to 35 percent.
8
• Combined Cycle Gas Turbine. This is a newer technology than either the steam generator or the gas turbine, and it has become increasingly popular due to technological advances. Combined cycle plants operate by first using fossil fuels to power a gas turbine. Then, the hot turbine exhaust is used to create steam to power a steam turbine. Thanks to the capture and use of waste heat, plants of this type have achieved overall efficiencies of 50 to 60 percent. Most new power supply in the U.S. is expected to be combined cycle natural gas turbines.
Defining Green Power The Green-e Renewable ElectricityCertification Program is a nationalprogram administered by the non-profit Center for Resource Solutions(CRS). Green-e establishes technicalcriteria for green power certification,and provides a way for consumers toidentify environmentally superiorelectricity products in competitivemarkets. Other green powercertification programs includeRenew 2000, a certification programavailable for green power productsoffered in the Pacific Northwest.The Power Scorecard is a web-basedinformation tool created by acoalition of environmental groups. Itlets consumers compare theenvironmental impacts of greenpower and conventional powerproducts. To display the Green-elogo, an electricity product must:
• Renewables. Hydroelectric and some other renewable energy sources – especially wind power – are also used to generate electricity. Instead of using steam or hot gas in a turbine that drives a generator, these technologies use the kinetic energy of moving water or air to drive a turbine. In addition, there are centralized solar power plants in California and Arizona that use standard and concentrating photovoltaic panels. Although it still supplies only a small fraction of all electricity, wind power currently has the highest growth rate in the power sector worldwide.
2.2.2 Greening Central Power Generation
Even though large power plants are generally sited outside cities, their emissions travel, affecting near and distant areas. At the same time, many cities have expanded dramatically, so that power plants are no longer remote. Despite their impact on local and regional air quality, utilities are regulated by state and federal entities, not cities. While municipalities cannot regulate emissions from power plants, they can exert influence through legislative channels and negotiations with utilities as a part of their efforts to promote metropolitan sustainability.
• Include 50 percent or more solarelectric, wind, geothermal,biomass, and small or certifiedlow-impact hydro facilities;
• Emit no more air pollutants thanconventional electricity does(when a portion of the electricityis non-renewable);
• Exclude specific purchases ofnuclear power; and
• Meet the Green-e newrenewable requirement(Renewables generation fromfacilities that have come onlinesince 1997, or, in New England,since 1998. In Oregon, thecutoff for “new
Choosing Green Power Traditionally, metropolitan areas have been energy customers and have had little influence over the fuel mix or emissions of the power plants serving the city. However, due to electricity deregulation, some customers are being offered a choice of power provider and, in some cases, power type. This ability to express preferences can give customers a voice in some utility operations.
” is post July1999.)

Many cities have capitalized on the opportunity to choose by negotiating green power purchase contracts with the incumbent utility. Under these agreements, the utility is required to produce or procure a given amount of “green power,” which generally refers to electricity supplied in whole or in part from renewable energy sources (e.g., wind, solar, geothermal, hydropower, or biomass). The required percentage of green power displaces some conventional fossil-fueled generation – unless the utility buys a credit (referred to as “green tags” or “green credits”) for renewable energy produced elsewhere. In addition to municipal green power purchases, many utilities are offering a renewable option for all electricity customers with a choice of power provider. While the renewable option usually commands a premium price, significant public demand for the “green” option can further expand the installation of clean, renewable technologies and lead to continued displacement of higher polluting conventional power.
9
Chicago and ComEd: Partners for Grid Support
The City of Chicago has over 10 MW of natural gas fired reciprocating engines that are operating in standby mode. Commonwealth Edison and the City of Chicago have signed a demand curtailment contract whereby ComEd can call on the City to operate these engines during periods of grid constraint and feed the electricity generated into the grid, in return for payment based on the amount of electricity produced.
Green Power Agreements in Cities
Austin, Texas, through itsGreenChoice program, currentlymeets 3 percent of its power needswith green power and increasingthis to 5 percent by the end of 2002.Chattanooga, Tennessee has aGreen Power Switch Program thatis expected to result in 5 MW oflandfill gas, 2 MW (3 turbines) ofwind power, and 250 kW (11 sites)of solar power by the end of fiscalyear 2002. Chicago, Illinois, has entered intoan agreement with ComEdspecifying that 20 percent of theCity’s power (~80 megawatts) mustoriginate from renewable sourcesby 2006. Only 50 percent of thepower may be from landfill gas.Currently, 10 percent, orapproximately 40 MW, of the Cityof Chicago’s electricity comes fromrenewable sources. Denver, Colorado, purchased 660100kW blocks of green power amonth for a three-year period fromthe Public Service Company ofColorado’s Wind Source Program,in order to spark interest in greenpower and support the local utility’sgreen power efforts. Portland, Oregon, has committedto purchase 10 percent of its powerneeds from “new” renewables by2003 and 100 percent by 2010.
Cleaning Up Central Power Plants Many utilities are making their central plants – especially coal-fired plants – cleaner, in response to both regulations and increasing public scrutiny. Nonetheless, many older coal plants are exempt from federal Clean Air Act emissions standards, and these facilities continue to pollute heavily. The Chicago Energy Plan calls for increased pressure to subject older coal plants to tighter emissions regulations, and many other cities, especially those downwind of older coal plants, have also been advocating for these plants to comply with emissions standards. In addition to the push to clean up old power plants, many utilities are exploring cleaner ways to produce central power, such as co-firing biomass with coal, coal gasification, and advanced control systems. The vast majority of planned new power plants will be natural gas-fired, and these are much cleaner than the existing coal infrastructure (EIA 2002 Annual Energy Outlook).
Demand-Side Management Demand-side management, through energy conservation and efficient use of energy, is a leading metropolitan tactic to reduce energy use and air emissions while reaping economic benefits. Cities can work closely with utilities to manage demand on the central power generation system, which can help support the grid and alleviate supply disruptions with ancillary efficiency and emissions improvements. Historically, utilities were the home of demand-side management programs that increased energy efficiency and conservation and saved money for customers as well as utilities. With the advent of deregulation, many of these programs disappeared, but similar approaches are being used in innovative city-utility partnerships, resulting in benefits to the utility and commercial, industrial, institutional, or even residential

customers. (See Section 4.0 for information on energy efficiency technologies and programs.)
Innovative demand-side management programs can use pricing mechanisms to give end users the opportunity to monitor and alter their energy use in response to information about price or availability. Typically, energy consumers are unaware of, and protected from, volatile energy prices through fixed rate structures and long-term contracts. Utilities, however, are vulnerable to spot market price fluctuations, and may profit or lose money when there is a significant discrepancy between the price paid to purchase power and the price at which it is sold to customers. Utilities develop contracts and pricing approaches to protect against significant losses, but customers do not generally have a transparent mechanism for responding to price or availability changes. Alternative mechanisms, described below, would permit direct customer involvement in demand-side management.
Price-response approaches would link the customer price for energy to spot market prices, based on real-time availability. Under such a scheme, energy prices would be at their highest during peak demand times, and at their lowest during low usage periods. Customers monitoring this information would have the opportunity to increase or decrease their usage in response to the price signals.
Demand-curtailment approaches generally involve agreements between the utility and large customers, such as industrial or municipal users, to curtail energy use when the grid is nearing capacity during high-demand periods. In such cases, interruptible power clauses are part of the contract between utility and customer, and may include financial compensation to end users for shutting off their nonessential load during such periods.
Net metering programs have been established in several states (see Appendix 10.2). These programs allow customers who generate power to sell that power back to the utility and run their electric meter backwards. This enables more efficient operation of distributed generation – especially photovoltaics – as well as provides power to the utility. In some utility areas, however, instead of allowing net metering, buy back rates for excess electricity are so low that they discourage residential operation of distributed generation.
10

2.3 Distributed Generation
2.3.1 Distributed Generation Technologies The emergence of small-scale clean energy generators has caused some energy users to consider a return to on-site power generation. The main drivers of this shift include the desire for improved energy reliability, control of power supply, and energy security. Cities in particular have looked to distributed generation to ensure power supply during blackouts and to showcase and promote clean renewable energy. Distributed generation systems include the following:
Commonly Used Terms Distributed Generation (DG) –generation of electricity at or nearthe point of use that can supplycustomers or the grid Combined Heat and Power (CHP)– distributed generation that alsocaptures and uses the released heatfor heating or cooling purposes (alsoknown as cogeneration) Demand Response (DR) –distributed generation of electricityto support the grid during supplyoutages or grid constraints (mayinclude diesel backup generators) Distributed Energy Resources –includes all of the above as well asdemand-side management andenergy efficiency measures
Many utilities are choosing to establish distributed generation projects. For example, Excel
Energy in Minnesota is financing a number of solar panels through
the Solar Advantage Program. The program allows end-users to lease the systems at a premium
and purchase the system for one dollar after 10 years.
• Reciprocating Engines. Currently, the most common distributed generation technology is based on reciprocating engines, which are usually powered by diesel fuel or natural gas. The engine is coupled to an electric generator. Reciprocating gas engines are available in the 300 kW to 6 MW range and dominate distributed generation projects that are smaller than 5 MW capacity. Engines have very good quick-start and load-following capabilities that make them well suited for back-up generation as well as peak operating systems. The heat from the engine may be used for heating or cooling other processes. Many cities choose engines because of their proven technology, fuel flexibility, and back-up capabilities.
• Gas Turbines. Similar to central generation gas turbines, natural gas driven turbines are becoming a more prominent technology for distributed generation. These are available in the 300 kW – 40 MW range and dominate distributed generation projects larger than 5 MW. Turbines operate best at full load and continuous operation and are typically used as baseload (24 hour operation) technologies. Many cities choose turbines for baseload applications because turbines have low emissions and proven technology.
• Microturbines. Microturbines are small-scale gas turbines in the 30 to 70 kW range. They are a new technology that has not yet achieved significant market share. Most microturbine applications are pilot or test projects and are usually in government or public facilities. Microturbines have very low emissions compared to engines or turbines and may be a future distributed generation technology. A possible application is as pre-packaged, “plug and play” combined heat and power systems. Microturbines have often been installed as pilot projects because of available government and industry support – often financial – as well as their ultra-low emissions and small size.
11

• Fuel Cells. Fuel cells create electricity in a fundamentally different way from the generators discussed above. Rather than burning a fuel, fuel cells directly convert the chemical energy of hydrogen into electricity. Fuel cells, like microturbines, are future technologies that have not yet moved past the test and pilot project phases; however, fuel cells do have a huge potential future role in both power generation and transportation because they have few moving parts and very low or zero emissions. Federal and local support for fuel cell technology stems from these benefits as well as the hope for a hydrogen future, and this support has increased the popularity of fuel cells.
• Renewables. There are a variety of renewable energy technologies suitable for distributed generation applications. Small non-utility wind, mini-hydro, and solar photovoltaics are distributed generation technologies that produce power without using fossil fuels. Solar may be the dominant distributed renewable technology due to the coincidence of peak solar power production with peak demand times in certain climates, while wind and hydro are more adaptable to the central power generation market. Renewables may be chosen for their environmental qualities, such as low or zero emissions, high visibility, public support, and federal and local subsidies and credits.
2.3.2 Benefits of Distributed Generation Historically, most distributed generation has consisted of heavily polluting, diesel-fired emergency back-up power systems. However, this is changing, and many regions are supporting baseload (continuously running) or peaking (running during business hours) self-generation projects. A critical shift in municipal energy planning has been the increased reliance on distributed generation, such as district heat, on-site fossil-fuel generation, and on-site renewable energy for energy supply and demand reduction – not just demand response. While the disadvantages of distributed generation include higher cost of
San Diego Region Promotes DG
The San Diego Regional EnergyOffice administers the SELFGENIncentive Program, which offers $15million annually in rebates forqualifying distributed generationsystems. The SELFGEN program isexpected to add over 30 megawattsof clean distributed generation by2004.
power generation, high cost of distributed generation equipment, and competition with the incumbent utility, the benefits, which include increased efficiency, decreased emissions, and increased grid reliability, have led many regions to offer incentives for installing distributed generation systems.
Improved Energy Efficiency Since distributed generation technology is located on-site, it is relatively simple to use the waste heat from the power unit for building heating and cooling, process heat, and various other applications by using a combined heat and power (CHP) system.
12

These systems can achieve overall efficiencies ranging from 60 to 75 percent (double that of a central simple cycle gas turbine), and the efficiency may approach 80 percent. Combined heat and power systems are discussed in greater detail in section 3.0 below. Improved energy efficiency results in lowered energy costs and reduced emissions, benefiting both customers and the environment.
Emissions Reductions Most new distributed generation technologies are powered by natural gas, which emits significantly lower levels of many pollutants, offering another benefit of distributed generation. For example, reciprocating natural gas engines emit an average of 2.2 pounds of nitrogen oxides (NOx) per megawatt-hour (MWh), and some fuel cells emit as little as 0.01 lbs. NOx per MWh. National average emissions for central generating plants, on the other hand, are closer to 5 lbs. NOx per MWh. Emissions levels for sulfur dioxide (SO2) and carbon dioxide (CO2) from distributed generation technologies are also lower than most fossil fuel powered central plants – especially coal and oil fired. Greenhouse gas emissions from power generation are directly determined by the efficiency of the system and the fuel used. If new distributed generation replaces less efficient central power plants, overall CO2 emissions will be reduced.
Improved Grid Reliability
13
Another benefit of distributed generation is that it requires greatly reduced transmission and distribution networks. In recent years, much of the nations’ excess transmission capacity has been consumed as electricity use increased, leading to strained grids and more power disruptions. Distributed generation helps ease the burdened transmission system by supplying electricity directly to the user, thereby eliminating demand from the transmission and distribution systems. This can lead to fewer blackouts and brownouts, thereby increasing grid reliability and reducing transmission upgrade costs for the utility. Cities obtain direct benefits in the form of reduced health and economic risks associated with power disruptions, reduced ambient air emissions, and increased energy efficiency.
Cost of Entry
In many cases, distributed generation seems a logical and economic choice for new power generation. However, there are many barriers in place that affect the ability of distributed generation to enter the energy market. The following is a small sampling of the barriers: • Higher capital costs- mainly due
to economies of scale in production.
• Pollutant emissions released into populated areas rather than remote central power stations
• Utility interconnection issues, including mandatory reports, demand charges, standby charges. connection fees, and the need for approval and permitting
2.3.4 The Economics of Distributed Generation In general, economic considerations play a key role in the selection of energy sources. In most cases, central generation costs are lower than distributed generation due to the economy of scale not achievable with smaller generating technologies. However, this has begun to change due to factors such as new technologies, low- or zero-cost fuels (landfill gas), the costs of congested transmission and distribution systems, and environmental concerns. As an indication of this shift, one of the major advantages of distributed

generation is now its potential economic advantage over purchased power. Although the cost of generating power in a central plant is low, national average electricity prices for 2000 were 6.78 cents per kWh. Most of the price is due to transmission and distribution (T&D) charges. Distributed generation avoids these charges, yielding a price for power that reflects only the generation cost; for example, a reciprocating engine produces electricity for as little as 5 cents per kWh. The potential savings achievable with distributed generation vary significantly by region, technology, and among the different sectors of energy users. Average purchased power prices for the commercial sector, for example, are 7.36 cents per kWh, with some state rates as high as 12.54 cents (New York). In areas such as this, distributed generation could result in considerable savings for consumers. In most parts of the country, however, central plant electricity generation will continue to predominate, due to existing infrastructure and unfamiliarity with distributed generation technologies.
Putting Green in the Future- Urban Energy Goals
Portland, Oregon, has the goal ofmeeting all growth in electricitydemand between 1990 and 2010 withnew renewable sources. Chicago, Illinois, has the goal ofmeeting all new demand from 2000to 2010 with energy efficiency,renewables, and distributedgeneration.
The Largest Thin-Film PV Installation in the Southeast
Chattanooga's Finley Stadium isthe site of a solar photovoltaic (PV)system that began producingelectricity for the Green PowerSwitch customer choice program inJuly 2001. The 11 solar arrays,which are mounted on canopieslocated in one of the stadiumparking lots, can produceapproximately 127,000 kilowatt-hours of electricity a year, enoughto supply eight or nine typicalTennessee Valley homes. Thearrays feature 140 to 240photovoltaic modules each, for atotal of 2,260 modules that cangenerate up to 77.3 kilowatts ofalternating current.
2.4 Renewable Energy Leading the drive for distributed generation has been the combination of escalating grid constraint, improved economics and customer desire for a choice of power. However, the recent resurgence in distributed generation can also largely be attributed to renewable energy. The visibility of a solar panel or a wind turbine coupled with the public awareness of its environmental benefits has sparked an interest in the technology and a sharp increase in renewable installations. The work of municipal energy planners has led to greater commercial, industrial, and even residential adoption of many renewable technologies. Cities have been instrumental in advancing renewable energy by supporting demonstration projects that provide visible proof of the practicality and reliability of renewable technologies. Furthermore, federal and local governments have embraced the technologies, and they offer rebates or credits for many renewable operations. Despite all these factors, many renewable energy technologies are still expensive to install and require optimal siting for efficient operation. The economics for renewable energy technologies continue to improve as new breakthroughs increase efficiency or improve performance, and more installations lead to increased production and lower per unit costs. Many predict that, with increased production, the installed costs of renewable energy technologies will be competitive with traditional fossil fuel power generation. Already, large wind turbines are producing power for less than 5 cents per kWh – close to the generation cost of a simple cycle gas turbine.
14

Renewable energy offers municipal energy planners an effective means of meeting future increases in energy demand in a manner that contributes to improved public health and environmental quality. As discussed in this section, cities can take a variety of approaches in deploying these technologies to take advantage of their benefits.
2.4.1 Renewable Energy Technologies Renewable technologies have played a role in both central power production, such as large hydropower or wind farms, and in distributed generation, such as photovoltaics and methane recovery from landfills. In this regard, the opportunities, benefits, and barriers mentioned in the central power and distributed generation sections also apply to renewable technologies. In addition, renewable energy offers the advantages of greater sustainability, since it does not deplete natural resources, and it produces few or no emissions in generating heat or electricity. Renewable energy has been harnessed from sunshine, wind, ocean tides, river flow, geothermal heat, ocean temperature differences, biomass, and other sources, to produce electricity, methane, and direct heat. Unlike conventional fuel sources, renewable energy applications depend largely on geography, geology, and climate. This section addresses some of the renewable energy sources available for power production.
Hydropower
15
Water flow has been harnessed to power human needs for centuries. Initially the water flow was captured for mechanical work – to spin a wheel – but hydropower has since matured into an electric power generation device. Large hydropower facilities in which many of the nation’s largest rivers are dammed for power production easily constitute the leading source of renewable capacity. However, this traditional form of hydropower has resulted in flooding, loss of habitat, and decreased flow in waterways, all of which have had negative environmental consequences. New hydropower projects in the U.S. are unlikely to follow the same approach. Instead, hydropower now includes tidal power, where the energy from daily tidal waters is captured by a turbine that spins as water rushes in or out. In addition, “mini” or “run-of-the-river” hydro is being installed on rivers and other water flows to capture some of the water’s energy without damming the flow. Researchers are also investigating ways to capture the thermal energy of ocean water.
Sun Shines on …
• San Diego, a partner of the federalMillion Solar Roofs Initiative, hasover 1.6 MW of interconnectedphotovoltaics installed and isexpected to have between 5 and10 MW installed by 2004.
• Chicago is building a 2.5 MWsolar power plant and a landfillgas-fired power plant on abrownfield site.
• Portland uses solar power on itsmaintenance vans to power thetools used by technicians, ratherthan running the diesel engines toprovide power.
Solar For many people, solar power is the most visible and talked about type of renewable energy. Solar energy is obtained directly from sunlight, requiring no moving parts to generate heat and even

electricity. Solar projects have included passive solar heating through strategic placement of windows and thermal storage masses in building design, active solar heating of water, and electricity production through the use of photovoltaic cells. While it is one of the most expensive of the renewable energies, solar is also one of the only renewable energy technologies that residential consumers can invest in to produce their own power. Its modular nature makes it suitable for a wide range of applications, from individual rooftops to large arrays. In addition, federal, state and local government entities have been promoting solar-generated electricity through a variety of tax credits and other financial incentives.
WangaSMmgawmmBtogethwenwem61higa
Seattle Contracts for Wind Power
Seattle became the largestpurchaser of wind power by apublic utility in the country,contracting with the world’slargest wind farm – the StatelineWind Generating Plant on theWashington-Oregon border nearWalla Walla, Washington. TheCity acquired 50 megawatts ofcapacity early in 2002, and willincrease to as much as 175megawatts by August 2004. Wind
One of the earliest forms of renewable energy to be tapped, wind power has its roots in turning gears for work such as grinding of wheat or corn, or pumping water. In remote areas, small-scale wind turbines provide power for many farms and homes in the U.S., as they have for decades. In recent years, however, large wind farms have emerged as wind power’s primary application in the U.S. On these “farms”, as few as one to as many as hundreds of turbines produce power for a utility to feed the grid. In many
A renewable portfolio standard establishes a requirement that a certain percentage of a utility’s
electricity generation be supplied with renewable resources.
Waste Management, Inc. and BMW Landfill Gas Project
aste Management, Inc. hasnounced plans to supply landfills from its Palmetto Landfill in
partanburg, S.C., to BMWanufacturing Corp.'s nearbyanufacturing facility. The methanes produced at Palmetto Landfillill be transported to BMW'sanufacturing facility through a 9.5-ile pipeline. Once delivered toMW, the gas will be used to fuel up four gas turbines that will co-nerate electricity and hot water fore facility. All told, the landfill gasill fulfill 20 percent of BMW'sergy requirements. This projectill reduce annual carbon dioxideissions equivalent to removing,000 automobiles from U.S.ghways by displacing piped naturals with the landfill gas.
cases, this is done in conjunction with continued use of the land for agricultural purposes. Wind has emerged as one of the most economic forms of renewable energy, and several utilities are building wind farms in order to meet “green power” purchase contracts or renewable portfolio standards. In the U.S., gigawatts of wind power capacity is being installed each year and new applications such as offshore installations and larger turbines are creating ever greater amounts of energy at a lower generation cost. Given the significant expanse of open land required to generate significant amounts of electricity, metropolitan applications of wind power are likely to depend on policy approaches, such as green power requirements, although municipal, industrial, or commercial installations of wind power may be appropriate in certain situations.
Municipal Solid Waste - Landfill Gas to Power The U.S. generates more than 230 million tons of municipal solid waste (MSW) annually. Twenty-eight percent of this waste is now recovered and recycled or composted, 15 percent is burned at combustion facilities, and the remaining 57 percent is disposed of in landfills. These landfills create an anaerobic (oxygen-free) environment where methane is produced by the bacterial decomposition of the organic materials. Unrecovered landfill methane creates an explosion hazard, and it is also a powerful greenhouse gas. Landfill gas also contains volatile organic compounds that contribute to ground-level ozone.
16

The Clean Air Act now requires that many landfills collect and burn their gas. Once collected, landfill owners and operators can flare the gas, sell the gas, or use it to produce energy for sale or use at the landfill. Currently, about 2/3 of operating landfill gas recovery projects generate power by burning the gas, representing approximately 1 GW of power generation capacity. Reciprocating engines or turbines are used in over 90 percent of the landfill gas to power applications.
The Clean Air Act now requires that many landfills collect and burn their gas. Once collected, landfill owners and operators can flare the gas, sell the gas, or use it to produce energy for sale or use at the landfill. Currently, about 2/3 of operating landfill gas recovery projects generate power by burning the gas, representing approximately 1 GW of power generation capacity. Reciprocating engines or turbines are used in over 90 percent of the landfill gas to power applications.
“The American Wind EnergyAssociation (AWEA) reported today(May 8 2003) that the U.S. windenergy industry is on track to install1,100-1,400 MW of new capacitythis year, despite the powergeneration industry's generally pooroutlook. The growth that isunderway across the country isexpected to boost U.S. installed windpower capacity from current levels ofclose to 4,700 MW to approximately6,000 MW (enough to serve 1.5million homes).” www.awea.org
Besides reducing greenhouse gas emissions and the danger of explosion, landfill gas to energy projects reduce the cost of compliance with federal regulations, displace electricity produced by fossil fuels, and produce power that can be sold at a premium as a green product. Where landfills are owned and operated by the city itself, these benefits accrue directly to the city. There are now over 340 landfill-to-energy projects in operation across the U.S., with about 200 additional projects planned or under development. As most of these projects are within cities, municipal energy planners are realizing the recoverable energy opportunity along with the environmental benefit of reducing landfill emissions.
Besides reducing greenhouse gas emissions and the danger of explosion, landfill gas to energy projects reduce the cost of compliance with federal regulations, displace electricity produced by fossil fuels, and produce power that can be sold at a premium as a green product. Where landfills are owned and operated by the city itself, these benefits accrue directly to the city. There are now over 340 landfill-to-energy projects in operation across the U.S., with about 200 additional projects planned or under development. As most of these projects are within cities, municipal energy planners are realizing the recoverable energy opportunity along with the environmental benefit of reducing landfill emissions.
Turning Septic Waste into Clean Power
In 1999, Portland, Oregon installed a 200 kW fuel cell (with a project cost of $1.3 million) producing 1.4 million kWh per year which saved the city $92,000 in electricity purchases while also producing useful heat. The fuel cell is fueled by waste biogas from the anaerobic digestion process at the City’s wastewater treatment plant. Portland is also planning to install four 30 kW biogas-powered microturbines next to the fuel cell and eventually turn all the biogas into power. r.
Landfill gas is now competitive with other
conventional power generation, with the cost to
generate power from landfill gas using engines at
approximately $1000/kW, and approximately
$0.015/kWhr to operate.
Municipal Wastewater Treatment Facilities Biogas to Power Municipal Wastewater Treatment Facilities Biogas to Power There are more than 15,000 municipal wastewater treatment facilities (MWWTF) in the United States. Water pollution control is an energy intensive process. Roughly, 25 percent of a wastewater utility’s operations and maintenance expenses can be attributed to power costs. In recent years, the operating costs of wastewater treatment plants have increased substantially due to the increasing cost of energy. Over the next 15 years, their electricity consumption is expected to increase by 20 percent, as plants expand treatment capacity to serve a growing population, and as the mandates of the U.S. Safe Drinking Water Act and U.S. Clean Water Act require additional treatment technologies. These increased costs emphasize the need for conservation and proper energy management in wastewater treatment plants.
There are more than 15,000 municipal wastewater treatment facilities (MWWTF) in the United States. Water pollution control is an energy intensive process. Roughly, 25 percent of a wastewater utility’s operations and maintenance expenses can be attributed to power costs. In recent years, the operating costs of wastewater treatment plants have increased substantially due to the increasing cost of energy. Over the next 15 years, their electricity consumption is expected to increase by 20 percent, as plants expand treatment capacity to serve a growing population, and as the mandates of the U.S. Safe Drinking Water Act and U.S. Clean Water Act require additional treatment technologies. These increased costs emphasize the need for conservation and proper energy management in wastewater treatment plants.
The production of methane (biogas) from the decomposition of organic compounds at wastewater treatment plants can offer cost advantages for municipalities. For example, a well-placed biogas recovery system can displace 20 percent of plant costs. Additionally, MWWTF biogas power can be sold at a premium as a green power (renewable energy) product. Traditionally, many smaller MWWTF’s have found biogas recovery to be uneconomical. Technological change has produced new, more cost-effective alternatives for these smaller sites. Power generation units like those from Caterpillar and GE Distributed Power have been designed to burn a wide variety of gaseous fuels.
The production of methane (biogas) from the decomposition of organic compounds at wastewater treatment plants can offer cost advantages for municipalities. For example, a well-placed biogas recovery system can displace 20 percent of plant costs. Additionally, MWWTF biogas power can be sold at a premium as a green power (renewable energy) product. Traditionally, many smaller MWWTF’s have found biogas recovery to be uneconomical. Technological change has produced new, more cost-effective alternatives for these smaller sites. Power generation units like those from Caterpillar and GE Distributed Power have been designed to burn a wide variety of gaseous fuels.
17

Microturbines and fuel cells have also emerged as options for biogas usage. Biogas Installations to Watch
Microturbines are being used by theInland Empire Utilities Agency(IEUA), a wastewater treatment andwholesale water agency in SanBernardino County California, to burnexcess methane gas produced from themanure of approximately 3,750 dairycows. Ballard’s fifth 250 kWstationary fuel cell power system wasfield tested at the Nishimachi Sewage Treatment Center in Tomakomai,Japan, where it operated on anaerobicdigester gas. King County, WA, has ademonstration program at the county’sSouth Wastewater Treatment Plantwastewater treatment facility inRenton that uses digester gas to fuel a 1 MW fuel cell power plant.
Biogas usage has both economic and environmental benefits, and with advances in microturbines and fuel cells, is increasingly cost-effective. Most cities own large wastewater facilities and their operation is expensive. The installation of methane recovery systems can save the city substantial money, as well as providing the environmental benefits of reduced methane emissions
Geothermal Geothermal energy is a mature renewable energy available in regions of the world situated over faults and other sources of hot liquids or solids deep in the earth’s crust. Most applications have been as central power plants using the heat to create steam to operate a steam turbine. Distributed generation applications may include district heating and cooling applications using the earth’s heat to warm water. The availability of geothermal energy in a particular metropolitan area is dependent on geology.
18

Sustainable Energy Actions That Cities Can Take Today Clean Up Coal Plants Support requirements for currently exempt, older coal plants to meet
federal Clean Air Act emission standards. Demand-side Management Develop utility programs that reduce customer power demand and
consumption through incentives, including real-time pricing andvoluntary curtailment.
Encourage Cleaner Fuels Replace dirtier fuels in power generation with cleaner fuels such as
natural gas and recovered methane, or new hydrogen-based powergeneration technologies.
Encourage More Efficient Promote long-term purchases of power from higher efficiency central
technologies such as combined cycle combustion Central Generation turbines Encourage Renewables Promote photovoltaic, passive and active thermal solar power, wind, and
other renewable generation for customer use through financial incentives Green Power Programs Support programs that provide utility-generated renewable energy for
sale to customers Green Power Purchases Require that a certain percentage of a city’s electricity needs are met with
clean, renewable energy sources; and/or formulate franchise agreementsto require utilities to sell green power to a municipality’s residents
Maximize Biogas Use Analyze landfill and wastewater facilities for biogas potential that may
be recovered and converted to power or heat. Promote Distributed Promote customer owned small combined heat and power systems toGeneration supply power and heating or cooling for municipal or industrial buildings. Create Power Strategies By creating a municipal energy strategy, the metropolitan area can guide
the future of power generation for the region.
19

Looking Ahead…
The programs and technologies discussed in this chapter are available and effective today, but advances are continually being made. Some of the power generation technologies we may encounter in sustainable cities of the future are: Fuel Cells As distributed generation technologies continue to penetrate the market,
and standards and utility interconnect guidelines are established, thegroundwork for zero-emission fuel cells will be laid. Already in thedemonstration phase – and in place in several cities – many policymakers view fuel cells as the clean energy technology of the future.
Hydrogen The use of hydrogen-based fuel cells is predicated on the establishment
of processes that safely and cheaply create hydrogen. Almost all currentprocesses of hydrogen creation are based on reforming of fossil fuels.Distribution networks must also be developed, and the cost of anothernational pipeline grid would be extremely expensive. However,breakthroughs in hydrogen formation through biological or chemicalreactions could result is abundant, and sustainable, hydrogen supply thatcould be used in fuel cells to provide clean energy. In the short-termhydrogen will likely be mainly an energy storage device – reforminghydrogen during off-peak and storing it onsite until it is needed toproduce power on-peak.
Energy Storage A breakthrough in improved battery or other electricity storage
technologies would allow for better grid maintenance and demandresponse. Large-scale batteries could be recharged at off-peak demandperiods and then feed power to the grid or directly to the customer duringon-peak demand periods.
Integrated photovoltaics Photovoltaic solar panels are already entering the market; however a new
PV technology is likely to further solar power’s role in meeting energydemand. This is the integration of photovoltaic power production intobuilding materials – such as roofing shingles or home siding – as well asthe improvement of thin-film photovoltaic technologies.
Clean Coal To better use the nation’s fossil fuel reserves, new clean coal
technologies would allow central generators a long life of cheap power.Clean coal includes the gathering of methane from the coal as well as thecapture of the carbon emissions via carbon sequestration in biological orchemical processes.
3.0 COMBINED HEAT AND POWER
3.1 Introduction
21
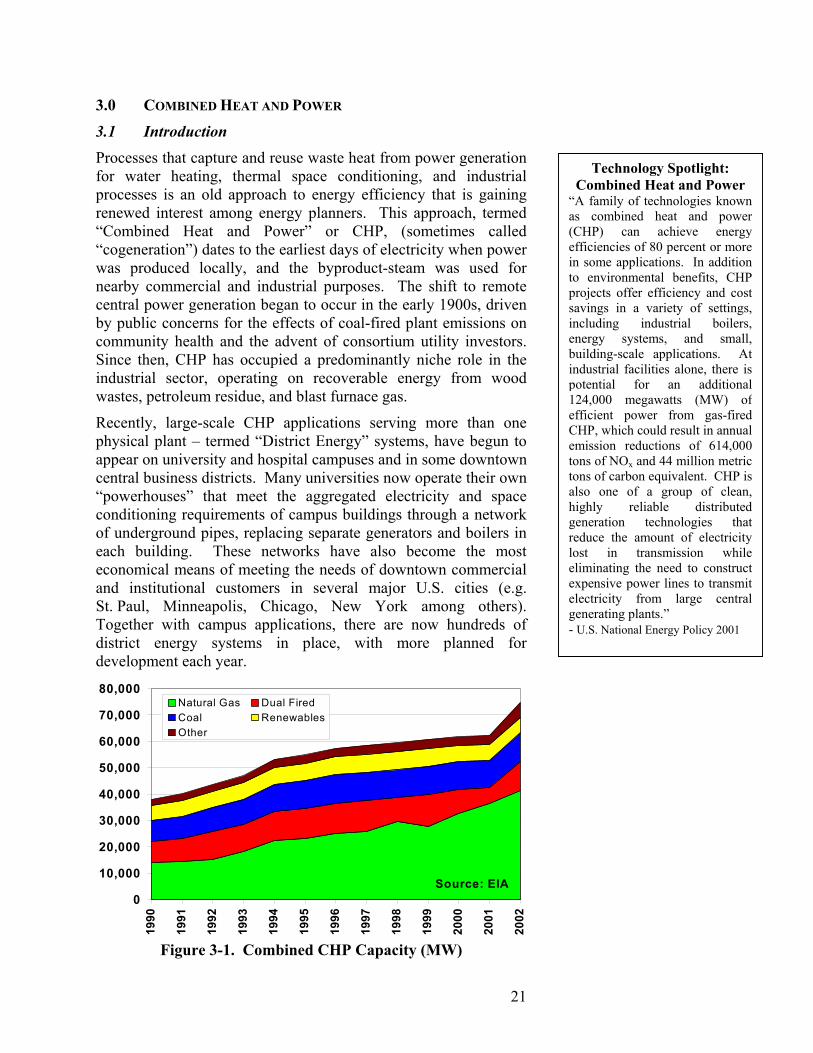
Processes that capture and reuse waste heat from power generation for water heating, thermal space conditioning, and industrial processes is an old approach to energy efficiency that is gaining renewed interest among energy planners. This approach, termed “Combined Heat and Power” or CHP, (sometimes called “cogeneration”) dates to the earliest days of electricity when power was produced locally, and the byproduct-steam was used for nearby commercial and industrial purposes. The shift to remote central power generation began to occur in the early 1900s, driven by public concerns for the effects of coal-fired plant emissions on community health and the advent of consortium utility investors. Since then, CHP has occupied a predominantly niche role in the industrial sector, operating on recoverable energy from wood wastes, petroleum residue, and blast furnace gas.
Technology Spotlight: Combined Heat and Power
“A family of technologies knownas combined heat and power(CHP) can achieve energyefficiencies of 80 percent or morein some applications. In additionto environmental benefits, CHPprojects offer efficiency and costsavings in a variety of settings,including industrial boilers,energy systems, and small,building-scale applications. Atindustrial facilities alone, there ispotential for an additional124,000 megawatts (MW) ofefficient power from gas-firedCHP, which could result in annualemission reductions of 614,000tons of NOx and 44 million metrictons of carbon equivalent. CHP isalso one of a group of clean,highly reliable distributedgeneration technologies thatreduce the amount of electricitylost in transmission whileeliminating the need to constructexpensive power lines to transmitelectricity from large central
- U.S. National Energy Policy 2001 generating plants.”
Recently, large-scale CHP applications serving more than one physical plant – termed “District Energy” systems, have begun to appear on university and hospital campuses and in some downtown central business districts. Many universities now operate their own “powerhouses” that meet the aggregated electricity and space conditioning requirements of campus buildings through a network of underground pipes, replacing separate generators and boilers in each building. These networks have also become the most economical means of meeting the needs of downtown commercial and institutional customers in several major U.S. cities (e.g. St. Paul, Minneapolis, Chicago, New York among others). Together with campus applications, there are now hundreds of district energy systems in place, with more planned for development each year.
80,
70,
60,
50,
40,
0
10,000
20,000
30,000
000
000
000
000
000
1990
1991
1992
1993
1994
1995
1996
1997
1998
1999
2000
2001
2002
Natural Gas Dual FiredCoal RenewablesOther
Source: EIA
Figure 3-1. Combined CHP Capacity (MW)

The resurgence of CHP is due in large measure to clean natural gas-fired cogeneration technologies that significantly reduce energy-related air emissions. Between 1992 and 2002, the installed capacity of CHP in the United States increased by over 30 gigawatts (see Figure 3-1) – roughly equivalent to the electricity demand of the state of Texas (http://currentenergy.lbl.gov/tx/). The expansion in installed capacity has occurred in the commercial, industrial, and electric utility sectors as is shown in Figure 3-2. The large CHP capacity highlighted in the utility category is largely due to user-owned utilities, such as universities and hospitals, as well as gas and electric utility CHP installation programs.
0
10,000
20,000
30,000
40,000
50,000
60,000
70,000
80,000
1990 1992 1994 1996 1998 2000 2002
ElectricalCommercialIndustrial
Source: EIA
Figure 3-2. CHP Capacity by sector (MW) In addition to better air emission performance, CHP technologies operate at much higher energy efficiencies than do most central power stations. (see Figure 3-3)
Figure 3-3 illustrates thecomparative efficienciesand energy requirements ofa CHP system versus aconventional powergeneration system. Toproduce the sameelectricity and heat output(35 and 50 units,respectively) requires fuelinputs of 100 units for aCHP system and 189 unitsfor a conv
entional system.
Figure 3-3. Comparative Fuel Requirements and Losses from Energy Generation Systems
22

3.2 Characteristics of CHP
3.2.1 Efficiency Single cycle central power plants have low overall fuel use efficiency due to the large quantities of heat that are generated but unused. In contrast, CHP systems capture the generating units’ waste heat and apply it to produce additional electricity and to serve heating or cooling purposes. The typical fuel use efficiency of a single cycle power generation plant is only 33 percent, while CHP systems are capable of fuel use efficiencies greater than 85 percent. As a result, fuel consumption, with its attendant emissions of CO2 and other pollutants, decreases.
3.2.2 Emissions Power generation emissions differ significantly from state to state based on the central power plants and fuels in use. In general, the Midwest has many large coal plants that produce relatively inexpensive electricity with significant air emissions. Other regions, including Texas and California, have more natural-gas-fueled electricity generation. Power generation emissions also vary by time of day corresponding to the two periods of power consumption – the on-peak period (usually defined as Monday through Friday, 9 am to 9 pm) and the off-peak period (the evening and early morning hours). The additional generating units needed to meet the high levels of peak period demand are typically less efficient, and higher cost, natural-gas-fueled or oil-fueled generators designed for quick starts and fewer operating hours.
In many states, the use of CHP systems during on-peak periods can reduce the demand on central power plants and significantly reduce air emissions. For example, the average on-peak generator in Illinois emits 4.77 lbs of NOx and 12.32 lbs of SOx per MWh of electricity produced (see Table 3-1 and Table 3-2). If Illinois were to implement the on-peak operation of CHP systems with lower emissions than coal-fired central plants, overall emissions from power generation would be reduced. Furthermore, this approach would also help meet facility heating, cooling, or process requirements that previously were met through other energy sources, thereby further reducing emissions. Many urban areas are in violation of U.S. EPA air quality standards for NOx, in part due to the high levels of emissions during peak power demand hours, and reducing these emissions could benefit these non-attainment areas (e.g. Chicago). As is illustrated in Figure 3-1, most new CHP systems are natural gas fired, which have NOx emission rates below 0.5 lbs/MWh. This asset, combined with energy efficiency gains, can make CHP an effective tool for urban communities striving to meet U.S. EPA air quality requirements.
23
Table 3-1. Average Power Generation NOx Emissions (E-Grid 2002)
Baseload emission
Rate
On-Peak Emission
>40% utilization
<40% utilization
State (Lbs/MWh) (Lbs/MWh) California 0.58 0.52 Connecticut 1.26 1.80 Illinois 2.49 4.77 Massachusetts 2.07 1.55 New York 1.29 2.07 Texas 2.26 2.49
Table 3-2. Average Power Generation SOx Emissions (E-Grid 2002)
Baseload emission
Rate
On-Peak Emission
> 40% utilization
< 40% utilization
State (Lbs/MWh) (Lbs/MWh) California 0.24 0.02 Connecticut 1.94 3.49 Illinois 4.16 12.32 Massachusetts 5.86 3.81 New York 4.37 2.72 Texas 3.76 0.05

3.2.3 CHP Economics Combined heat and power systems – and most distributed generation systems – have high upfront capital costs and typically have payback periods of 5 years or more, before accrued energy cost savings begin to exceed the initial capital cost. Table 3-3 shows typical cost and emission data for natural-gas-fired CHP applications. While these prices have decreased, the initial capital cost is often still a barrier to CHP, as many financers require payback periods of 3 years or less. Furthermore, many utilities have rates and penalties for CHP systems that increase the economic risks of installing the system. As a result, obtaining the many benefits of CHP requires a long-term vision. In the private sector, this often means evaluating the cost of downtime or poor power quality and factoring this into the economic analysis. For municipalities, the challenge can be met through the establishment of sustainable energy planning processes, with longer planning horizons. Also, many federal, state, or even local financing mechanisms can defray the upfront cost of CHP systems, thereby alleviating the pressure on strained city budgets.
Table 3-3. Costs and Emissions of Natural Gas- fired CHP Equipment Gas-fired Reciprocating Engines Gas-fired Turbines Fuel Cell
Current Rich burn
Lean burn
Lean burn
Lean burn
Micro-turbine
Turbine Turbine PAFC
Capacity (kW) 100 300 800 5000 100 1000 5000 200 DG Installed Cost ($/kW) $1350 $810 $765 $744 $1485 $1180 $660 $3850
CHP Installed Cost ($/kW) $1805 $1197 $972 $874 $1765 $1780 $1085 $4500 Efficiency (HHV) 30% 31% 33% 39% 26% 21.9% 27.1% 36%
CHP Efficiency (HHV) 79% 77% 76% 74% 68% 68% 68% 75% NOx Emissions (lb/MWh)
(uncontrolled) 44.3 5.9 2.9 1.5 0.72 2.43 1.16 0.04
NOx Emissions (lb/MWh) (controlled)
0.44 0.5 0.5 0.5 N/A 0.24 0.11 N/A
CO2 Emissions (lb/MWh) 1365 1321 1241 1050 1535 1887 1510 1135 Source: Energy and Environmental Analysis –“ Gas-Fired Distributed Generation Technology
Characterizations” 11/02-6/03
3.2.4 CHP Public Policy A consistent concern in the CHP (and distributed generation) marketplace is the various market and regulatory hurdles that arise for most projects. These barriers to implementation result in additional costs, delays, or difficulties in dealing with the local utility and connecting to the power distribution network (the “grid”). In addition, a lack of universal interconnection laws and requirements make the procedure of installing CHP systems cumbersome and inefficient. In fact, interconnection barriers have been identified as the principal obstacle to widespread commercialization of CHP, especially for commercial and light industrial applications (see Making Connections report
24

www.nrel.gov/docs/fy00osti/28053.pdf). Overcoming these barriers could provide a level playing field for distributed generation and cogeneration. Eliminating these barriers would ensure that project decisions are made on the basis of accurate evaluation of costs and benefits and not influenced by artificial impediments.
3.3 CHP Drivers, Support Efforts, and Applications Combined heat and power systems have been installed across the U.S. where: •
•
•
•
Large thermal loads exist (hot water, steam or direct process loads); Sources of thermal energy are available to produce electricity (for example, using steam turbine Rankine cycles or other technologies to make electricity); Recoverable energy sources exist (methane, biomass, bio-gas, etc.); or Where the economics of CHP projects present opportunities.
Additionally, new concerns about energy security, reliability and quality have also accelerated the number of CHP installations in: emergency operations centers; medical centers; banks and investment firms; information and telecommunications operations; research laboratories; and anywhere else that the disruption of energy services would result in the loss of life or property.
In addition to the economic and functional need for CHP installations, technical and policy experts representing manufacturers, utilities, building operators, research and development organizations, industry associations, energy service companies (ESCOs), universities, and national laboratories have defined a new vision for power generation that includes smaller generation systems applied to buildings, district energy systems and industry. This vision is spurred by the growing congestion of the established power grid, concern about regional and global emissions, and the need for increased efficiency in energy use.
Besides industry initiatives, federal, state, and local governments have begun efforts to deploy CHP. The U.S. DOE’s facilitation of a CHP Roadmap effort and the U.S. EPA’s creation of the Combined Heat and Power Partnership have been instrumental in promoting CHP. Federal support for CHP integration, test verification, and demonstration projects in the industrial sector has increased interest in and use of CHP. Regional CHP Application Centers, CHP working groups, the United States Combined Heat and Power Association (USCHPA), International District Energy Association (IDEA), DOE Integration Test Center, and GTI’s Distributed Energy Research Center have all made significant
25
contributions toward the accelerated deployment of technologies across all economic sectors. These groups focus on economic- and information-driven processes for increasing CHP understanding, installation, and use. These efforts have reduced several barriers to CHP installations and have led to advances in CHP technology, performance, cost, and ease of entry into new markets.
3.3.1 Industrial CHP
26
Combined heat and power has a long history of success in certain industries – primarily petroleum, metals, and pulp and paper. Industrial plants are often well suited to CHP because of their need for process heat as well as electricity. Industries that have fuel available from onsite waste (e.g. pulp and paper) are particularly good candidates. By using on-site wood waste as fuel to provide some or all of the facility’s process, thermal and electricity requirements, efficiencies are maximized and fuel, electricity, and thermal energy costs are minimized. Combined heat and power approaches have also been successfully implemented in the plastics, steel, and chemical manufacturing industries, among others. Cities can encourage industrial CHP in their jurisdictions by providing technical assistance for siting and permitting, identifying potential emissions and electricity reliability benefits, and providing financial incentives. For example, in the Chicago Industrial Plan, the U.S. Department of Energy and the City of Chicago evaluated sites throughout the metropolitan area on the basis of emissions, grid constraints, and economics, in order to identify large industrial facilities that might be suitable for CHP.
CHP Brewing in the Twin Cities
Rahr Malting has received a grantfrom the U.S. DOE to test thefeasibility of a 20-megawatt CHPsystem that will use biogas from thebarley, wheat, and other organics inthe brewing process. The power willmeet the demand of the Maltingfacility and 11,000 surroundinghomes. The waste heat will be usedfor industrial purposes.
3.3.2 CHP for Buildings (BCHP) City of Austin’s Fuel Cell
In Austin, Texas, a $1.2 million fuelcell – which uses natural gas toproduce electricity with hot water asa byproduct – was installed in thesummer of 2002 to generateelectricity at the Rebekah BainesJohnson Dental Clinic, near TownLake. The fuel cell will provideelectricity for the RBJ facility andwaste heat from the generator willwarm water, displacing the energypresently required to operate a boilerfor that purpose. Because it reuseswaste heat for another application,the fuel cell – which is about 18 feetlong and 10 feet wide – operates at85 percent overall energy efficiency.It also has minimal emissions.
Building cooling, heating, and power (BCHP), also referred to as Integrated Energy Systems, is another emerging application of the CHP approach. In a BCHP system, CHP is applied to a commercial building, and the waste heat is used for hot water, space heating, cooling, and humidification and now even illumination, through the use of an integrated gas-fired heat and light system. For example, waste heat from electricity generation can be used as the input energy for thermally activated technologies such as heat-actuated air conditioners and dehumidifiers, to generate steam for space heating, or to provide hot water for laundry, kitchen, or cleaning services. Significant promise exists for BCHP at health-care facilities, data centers, hotels and resorts, schools, restaurants, shopping centers, and other commercial establishments, as well as multifamily residences. Many of these installations are fairly small, and thus more expensive per kilowatt, but packaged and modular systems offering “plug-and-play” installation at significantly lower cost are currently under development. The lower costs and increased

standardization of these modular systems will be especially advantageous for commercial franchise chains.
Metropolitan communities have many opportunities to install BCHP systems. Cities seeking to improve energy efficiency or reduce energy use will often first target municipal buildings, such as offices, civic centers, and public schools. Many commercial buildings are considering CHP to provide energy and cost savings, increased energy reliability and security, and improved power quality. For example, data centers and banks need electricity of higher quality and reliability than is usually available from the grid. A BCHP system can serve these needs and simultaneously provide cooling for computer equipment. In many cases, metropolitan communities will assist these facilities as part of an overall sustainable energy plan.
Source: The Buffalo District Energy Project
Figure 3-4: District Energy Systems (Buffalo, NY)
3.4 District Energy As noted earlier, a CHP system designed to serve a large number of buildings, is called a district energy system. Traditionally, these systems have been installed on educational campuses and within central business districts where the proximity and density of buildings make it economically viable to install the piping networks needed to distribute steam and hot or chilled water (see Figure 3-4). District energy central plants house utility-grade heating and cooling equipment designed for heavy-duty use. The benefits of district energy include a greater economy of-scale, because of the larger equipment and the potential to serve overlapping energy needs. By aggregating demand and connecting
27

energy delivery points, individual boilers and chillers in buildings are supplanted by a larger off-site system that can increase overall system efficiencies and significantly reduce construction costs. In addition to the benefits of more usable floor space, previously occupied by space-conditioning equipment, individual customers can also avoid ancillary system costs for water treatment, chemical and CFC use, and labor and maintenance expenses. Aggregating demand among different buildings, where diverse customers experience demand peaks at different times, allows equipment to be operated more fully loaded (and more efficiently) than single-building chiller plants.
3.4.1 Municipal District Energy
Traditionally, district heating systems were built to capture and distribute steam from downtown electric generating stations to buildings in the general vicinity. Over time, heating networks expanded to serve hundreds of buildings. Consolidated Edison (Con Ed) still operates one of the first district heating systems and the world’s largest steam system in New York City. This system serves more than 1800 buildings, including such landmarks as the Chrysler Building, Rockefeller Center, and Empire State Building and dozens of hospitals. The Con Ed system provides steam in the summer to drive more than 500,000 tons of air conditioning, which significantly reduces peak electric demand on the Manhattan grid. Steam systems operate in many major U.S. cities, including Boston, Philadelphia, Indianapolis, Denver, San Francisco, Minneapolis, and Washington D.C.; and they continue to provide highly reliable heating service to hundreds of buildings. In 1962,
XcSeopsybethcochcogoDeDecocone
Mile High Energy System
el Energy, formerly Publicrvice Company of Colorado,erates a large steam district energystem that dates back to theginning of the City of Denver. Ine mid-1990’s, Xcel added districtoling utility service to provideilled water for air conditioningmmercial office buildings andvernment complexes in downtownnver. The City and County ofnver currently have 15 buildingsvering over 5 million square feetnnected to the district energytworks.
the world’s first combined downtown district heating and cooling began distributing chilled water for air conditioning along with steam for heating to connected customer buildings, in Hartford, Connecticut. Today, the Hartford Steam Company serves nearly 80 percent of the buildings in the city, including local, state and federal government buildings. Following this model, the next eleven downtown district cooling systems were developed by local gas distribution companies in cities such as Pittsburgh, Omaha, Tulsa, Oklahoma City, and Minneapolis to expand summer natural gas loads for steam-driven air conditioning. Some systems, like the Energy Systems Company in Omaha, Nebraska, used mainly natural gas-fired technologies to drive pumps, chillers and condenser pumps.
Since 1990, nearly thirty new downtown district cooling systems have been developed in North American cities, reflecting a combined investment of nearly $2 billion (see Figure 3-5). Many of the newer systems integrate large chilled water or ice storage technologies that capitalize on cool outdoor temperatures and low
28

electric rates to produce chilled water or ice at night. More importantly, this approach reduces electric demand during on-peak hours, yielding a flatter electricity demand profile. This is increasingly valuable as power load factors become more important to electricity pricing. Figure 3-6 shows the impact of district cooling service on the electric demand of a 258,000 square foot commercial office building in downtown Cleveland, Ohio. The red area represents the peak monthly electric demand before district cooling. The blue area, which varies by less than 2 percent between January and July, represents the building’s current electric demand, which has been reduced by 46 percent from the prior year’s monthly peak.
Figure 3-5 United States District Energy Systems Map
29

DOE Support Leads to World Class Success in District Energy
in Twin Cities
About 20 years ago, the U.S. Dept.of Energy and the Minnesota EnergyAgency provided key financial andtechnical support to the feasibilitystudy for modernizing and updatingthe district energy system indowntown St. Paul. In 2003, a 26Megawatt CHP facility began beingfueled by urban waste wood 95percent or more of the time, with upto five percent natural gas used toinitiate combustion. This facilitycombines the benefits of fuelflexibility by using biomass energyto provide the principal source ofheat for the district energy systemand reduces landfill and airemissions. Over 26 million squarefeet of office space (about 75 percentof downtown St. Paul) is served bydistrict heat and over 9 millionsquare feet is served by districtcooling. President George Bush citedDistrict Energy St. Paul(districtenergy.com) as “a model ofenergy efficiency, reliability andaffordability” in his National EnergyPlan Announcement in May, 2001. Across the Mississippi River, theMinneapolis Energy Center servesover 40 million square feet ofbuilding space in downtownMinneapolis with district heating andover 30 million square feet withdistrict cooling. Minneapolis EnergyCenter was originally developed inthe 1970s by Minnegasco, the localgas distribution utility. Today it isone of the nation’s largest and mostsuccessful combined district heatingand cooling systems serving adowntown central business district.The parent company of theMinneapolis Energy Center alsoowns and operates district energysystems in downtown Pittsburgh,Harrisburg, San Diego, and SanFrancisco.
0
200
400
600
800
1000
1200
1400
1600
Jan Feb Mar Apr May Jun Jul Aug Sep Oct Nov Dec
kW D
eman
d
Avoided DemandDistrict Cooling
Source: IDEA
Figure 3-6: Cuyahoga Savings Center Electricity Demand 3.4.2 CHP on Campus District energy and CHP are an effective combination on college campuses as the combined heating and power loads can result in highly efficient and economic applications. In 2002-03, IDEA performed a census for the U.S. DOE that identified 967 MW of CHP currently operating on college and university campuses. Data from 160 U.S. campuses revealed district heating systems totaling 4.2 million lbs/hr of heating capacity and cooling systems with 932,400 tons of cooling capacity. Campus energy managers described near-term plans to increase cooling capacity by over 100,000 tons and heating capacity of 800,000 lbs/hr, as well as projects totaling nearly 475 MW of electric generation capacity expansion in the next five years. A recent example is the University of Texas in Austin that has added a 25 MW steam turbine to its CHP facility to bring the total onsite campus generating capacity to 110 MW.
District energy is the preferred method for heating and cooling hundreds of campuses, and the need for these services is growing due to extensive new building construction on campuses nationwide. Increasingly, this space is air conditioned to provide year-round comfort and to serve other clients than the traditional students, teachers, and staff members. Campuses are implementing CHP to: improve fuel efficiency, reduce operating expenses, ensure more reliable energy service for critical research and laboratory facilities, reduce overall emissions, and achieve more sustainable energy practices.
Increasingly, many district energy systems are also incorporating renewable sources of energy. For example, UCLA installed a
30

43 MW CHP facility that uses 4 million cubic feet of landfill gas daily (approx 1/3 of its natural gas fuel supply) for the 234 MMBtu/hr heating plant and 16,600-ton cooling system for a campus measuring over 13 million square feet. By implementing a renewable district energy system, UCLA has reduced overall campus emissions by 34 percent.
3.5 CHP Outlook - A Bridge Technology to the Future As electricity consumption and the associated environmental and economic costs continue to rise, CHP systems can play an increasingly important role in cities that are seeking to reduce overall energy use and prepare for future, zero-emission electricity technologies. Communities seeking to become more sustainable can install on-site CHP systems to capitalize on local energy sources, such as bio-gas and biomass, or sustainable energy sources, such as renewably produced hydrogen for fuel cells.
As well as increasing energy efficiency, CHP gives communities a way to counter the need for expanded electricity transmission and distribution systems. In addition to customer installation and operation of CHP systems, U.S. DOE is currently researching opportunities for economically viable utility ownership of CHP systems within grid-constrained areas. In such a scenario, the utility would install a CHP system in an industrial or municipal building and contract to sell power, heat, and cooling to the building owner or the tenants. In exchange for providing space and signing a contract, the building owner/tenant receives reliable power and rental income. The utility benefits from the long-term energy services contract as well as avoiding otherwise required power distribution system upgrades. The community benefits from greater energy efficiency; increased local job creation for equipment installation and maintenance; reduced grid congestion, and reduced likelihood of blackouts or power disruptions.
In the coming years, continuing technological improvements will be instrumental in the dissemination of this important approach to energy conversion. As shown in Table 3-4, performance and cost forecasts for CHP systems indicate that they are projected to improve –in some cases, dramatically – by 2020. The expected cost reductions should overcome today’s first cost barrier and increase penetration of CHP applications. Furthermore, addressing the policy concerns discussed in section 3.2 will remove many of the market barriers that CHP currently faces. As a consequence, CHP and district energy applications are poised to be the primary source of electricity, heating, and cooling for buildings of the future.
31

Table 3-4. 2020 Projected Costs and Emissions of Natural-Gas- Fired CHP Equipment Gas-fired Reciprocating Engines Gas-fired Turbines Fuel Cell Advanced Technology Projections
Rich burn
Lean burn
Lean burn
Lean burn
Micro-turbine
Turbine Turbine PAFC
Capacity (kW) 100 300 800 5000 160 1000 5000 200 Installed Cost ($/kW) $1100 $920 $875 $760 $910 $1450 $920 $2450 Efficiency (HHV) 35% 36% 40% 45% 36% 26% 32.1% 38% CHP Efficiency 86% 84% 84% 79% 72.4% 70% 72% 80%
Source: Energy and Environmental Analysis –“ Gas-Fired Distributed Generation Technology Characterizations” 11/02-6/03
Through the efforts of the U.S. DOE and other domestic energy entities, future energy systems will enable a hydrogen-based economy energized by fuel cells, renewable resources, and other zero-emission technologies. With these energy sources fueling automobiles as well as buildings, the U.S. can move toward reliance on a single fuel and begin to eliminate much redundancy in energy transmission systems that currently carry natural gas, petroleum, coal, and electricity. Further, domestic production of hydrogen can reduce or eliminate U.S. dependency on imported energy.
Finally, as communities consider their development plans for the 21st century, the need for more sustainable practices is evident. Due to significant and persistent environmental and economic impacts, energy production, delivery, and use are primary impediments to sustainability. Combined heat and power systems, however, are ideally suited to sustainable community development patterns and projects that favor mixed land uses, higher densities, and increased utilization of existing urban footprints. Thus, CHP systems form a natural connection between traditional energy technologies and a new framework for community planning that integrates sustainable energy approaches. Successful integration of CHP technologies into today’s community energy policies, plans and infrastructure will facilitate the nation’s transition to a more sustainable energy future when more advanced technologies and lower emitting fuels are in place.
32

This Page Left Intentionally Blank
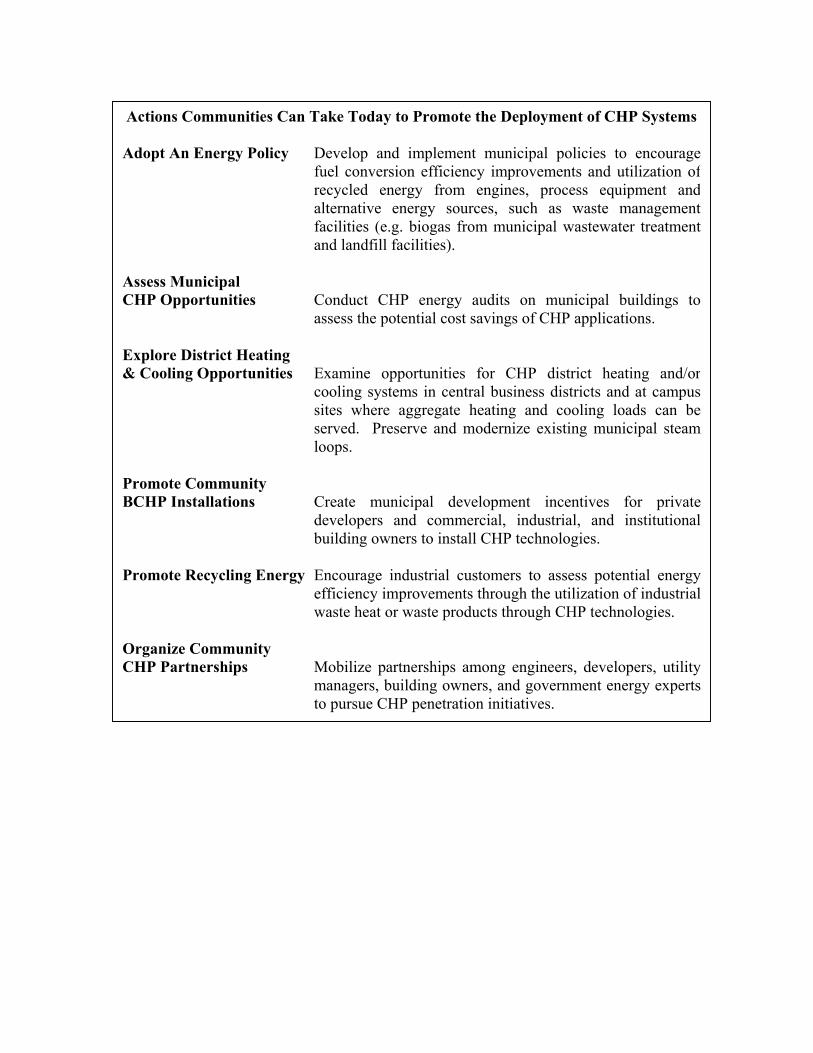
Actions Communities Can Take Today to Promote the Deployment of CHP Systems Adopt An Energy Policy Develop and implement municipal policies to encourage
fuel conversion efficiency improvements and utilization ofrecycled energy from engines, process equipment andalternative energy sources, such as waste managementfacilities (e.g. biogas from municipal wastewater treatmentand landfill facilities).
Assess Municipal CHP Opportunities Conduct CHP energy audits on municipal buildings to
assess the potential cost savings of CHP applications. Explore District Heating & Cooling Opportunities Examine opportunities for CHP district heating and/or
cooling systems in central business districts and at campussites where aggregate heating and cooling loads can beserved. Preserve and modernize existing municipal steamloops.
Promote Community BCHP Installations Create municipal development incentives for private
developers and commercial, industrial, and institutionalbuilding owners to install CHP technologies.
Promote Recycling Energy Encourage industrial customers to assess potential energy
efficiency improvements through the utilization of industrialwaste heat or waste products through CHP technologies.
Organize Community CHP Partnerships Mobilize partnerships among engineers, developers, utility
managers, building owners, and government energy expertsto pursue CHP penetration initiatives.

Future CHP Technology Development
The technologies, systems and management practices discussed in this section are available andeffective today, but advances are continually being made. Some of the CHP technologydevelopments we can expect in the sustainable cities of the future will include: Routine BCHP Design Practices Architects will routinely conduct economic analysis of CHP
technology options as a part of all building design practices. Accurate,inexpensive CHP analysis tools will be widely available.
Routine District Energy Urban Design Practices Urban planners will routinely consider district energy options as part
of the comprehensive and general community plan revision processand during development project reviews. CHP technologies anddistrict energy systems will become widely used as key tools toproduce community economic and environmental quality benefits.
CHP Micro-Grids & Neighborhood Resource Centers Future community development plans will feature interconnected
networks of neighborhood or village micro-grids meeting both theelectric and thermal energy needs of residents. Anchored by village-level cogeneration facilities, these micro-grids will enable the two-wayflow of electric energy between generation facilities and individualbuildings that will also produce energy on-site.
Packaged CHP Systems Today’s custom-designed CHP systems can be very expensive to
design and install. In the future, these systems will be replaced bypackaged CHP systems. Most of these packaged systems will befactory-built, skid-mounted, pre-tested, and easily and inexpensivelyinstalled at practically any site.
Pre-Certified Systems The popularity of CHP systems will result in the pre-certification of
equipment and installers, and this will further reduce investor risks andaccelerate rapid deployment of CHP. Widely available performanceinformation on a variety of packaged systems will significantlysimplify system design and installation practices.
Utility CHP Ownership Utilities will consider locally available renewable energy sources,
energy efficiency improvements, and CHP as desirable alternatives tothe expansion of transmission and distribution systems. Utilityownership of CHP will allow utilities to invest their capital in buildingfacilities in key locations to balance grid utilization and to producenew revenue streams from the sale of both thermal and electric energy.

4.0 EFFICIENT ENERGY CONSUMPTION
4.1 Introduction Increasing the efficiency with which energy is used is one of the most cost-effective approaches to meeting energy needs, as implementing energy efficiency measures is generally the least costly energy resource for a community. By using energy more efficiently, the same energy services are delivered with less energy, or, alternatively, the same amount of energy delivers more service. Conservation measures further encourage cities to use energy only when needed. Demand-side management (DSM) approaches help manage the demand for electricity either by reducing overall demand or by shifting the time period of some demand. All of these approaches result in lower energy bills and decreased need for new generation capacity, thereby reducing the health, environmental, and economic impacts of energy production. For all these reasons, increasing energy efficiency is a critical element of sustainable energy planning.
A recent study by the Union of Concerned Scientists stated that
with universal U.S. energy efficiency improvement, energy savings could exceed 1,700 billion kilowatt-hours and nearly 6.5 quadrillion Btus of energy in 2020 – a 6.5% reduction from current energy consumption.
Walking the Talk
In the late 1990’s, the City of Seattlerealized that its own efforts to be energyefficient were lagging while it promotedand implemented conservationprograms for the city at large. TheMunicipal Conservation Programwas started to address that, and it hasproduced significant energy and costsavings for the city. Under thisprogram, nearly a dozen of the city’smajor buildings have been retrofittedwith high efficiency lights, fans, andpumps, and old gas boilers have beenreplaced with high-efficiency models. In 1993, Saint Paul initiated the firstmunicipal conservation program withthe specific goal of reducing greenhousegas emissions in addition to savingenergy.
A wide array of energy efficiency measures, from the well established to emerging technologies, can be tapped by municipalities. Energy efficiency improvements can be made in building construction, lighting, heating, cooling, industrial processes, and appliances, among others. Many energy efficiency programs are targeted by sector, such as residential, commercial, industrial, or institutional, because of the unique characteristics and needs of each sector. Nonetheless, there is significant common ground among the sectors, as, for example, improvements in lighting efficiency will deliver considerable energy and economic benefits to commercial, residential, and institutional entities alike. In some cases, there is more than one option available for improving energy efficiency. In such cases, choices should be evaluated on the basis of life-cycle analysis of the proposed systems, including capital costs, replacement costs, operating costs, and estimated inflation.
36
Implementation of energy efficiency is best addressed through a combination of technological approaches and policy measures that encourage implementation of the technologies. Too often, the barriers to energy efficiency are policy and practical barriers, rather than technological obstacles. Overcoming these barriers can be accomplished through effective program development, communication, and education. Municipalities are well-positioned to implement policies that will help overcome barriers and foster the deployment of energy-efficient technologies.
Blanket Seattle
To reach inefficient electric hotwater heaters, Blanket Seattle hadcontractors go door to door, givingaway and installing 107,459 R-10water heater wraps and settingthermostats to 120 degrees. It wasone of the city’s most successfulenergy savings programs ever.

4.2 Tools and Technologies
37
4.2.1 Lighting Designing Lighting
In 1991, the Lighting Design Lab opened in Seattle as a collaboration between the City of Seattle, Bonneville Power Administration, and the Natural Resources Defense Council. The nationally acclaimed facility is operated by the city and serves the regional community by providing expert technical assistance in efficient lighting, as well as an opportunity to see what a lighting design will look like. This helps reduce the risk for designers, and thus also helps accelerate acceptance of new technologies in the buildingmarket.
Energy-efficient lighting offers an easy, highly cost-effective way to save energy across all sectors. For example, energy-efficient T-8 tubes with electronic ballasts in well-designed fixtures and compact fluorescent lights (CFLs) provide the same amount of light as conventional incandescent light bulbs, while using only 25 percent as much electricity. Furthermore, these light bulbs have a much longer life than incandescent bulbs (ten to 12 times as long) with the result that installation of CFLs results in building cost savings through decreased maintenance costs (for light bulb replacement) as well as energy savings. These savings can accumulate rapidly in multifamily or commercial buildings with extensive lighting needs. Even in residences where maintenance costs are negligible, payback periods are short and more efficient lighting fixtures are worth the investment.
Municipalities considering lighting improvements have the added advantage of being able to establish certain lighting requirements for their own buildings. Then, they can use their facilities as demonstration or model projects, thereby gaining educational and public relations benefits. In industrial spaces, lighting tends to use more high-intensity discharge (HID) lighting rather than the fluorescent fixtures used in commercial spaces. In either case, replacing incandescent light bulbs with CFLs is one of the easiest ways to save energy and money, while benefiting the environment.
High-intensity discharge (HID) lighting can offer better efficiency and longer life than fluorescent lighting,
with color quality approaching that of incandescent lighting. Originally
intended for outdoor and industrial applications, the use of HID lamps has spread to office and retail applications as their color-rendering characteristics have improved and smaller sizes have
become available. Mercury vapor lamps, metal halide lamps, and high-pressure sodium lamps all fall in the
HID category. www.fpl.com
Reducing the amount of artificial light required also results in energy benefits. Daylighting capabilities can be provided in buildings by means of skylights, light tubes, and clerestory windows with sunlight reflecting shelves. These measures can also have the added effect of improving the working environment. In addition, occupancy sensors and controls can save significant amounts of energy by turning lights off when they are not needed.
A light emitting diode (LED)) is a semiconductor device that emits
visible light when an electric current passes through it. LEDs have low power requirements, long life, and high efficiency.
For cities, the single largest energy end use is often street lighting, including traffic signals. While most streetlights use High Pressure Sodium (HPS) or other efficient light sources, many traffic signals still use incandescent lamps. Converting traffic signals, including pedestrian crossing signals, to light emitting diode (LED) lighting saves energy, thereby reducing pollution, and the lights last much longer, so additional savings accrue thanks to reduced maintenance (materials and labor) costs. White LEDs are currently under
development, and one such product is being tested in Portland.
Depending upon performance, these could constitute a future
street lighting technology.
4.2.2 Heating, Ventilation and Air Conditioning (HVAC) Systems Installing energy-efficient heating and air conditioning systems can yield significant energy savings in homes, commercial, institutional, or governmental buildings. The American Society of

38
Chattanooga Convention Center
The Chattanooga Convention Centerfeatures an energy-saving daylighting system in its 100,000-square-foot exhibit hall. Monitors onthe roof of the building control theamount of sunlight filtered throughopenings in the 30-foot ceilings ofthe exhibit hall, and the systemautomatically adjusts the amount ofartificial lighting needed, if any. Thenatural daylighting system saves 40to 50 percent of electrical lightingcosts for a typical trade showcompared to the existing facility. Theminimization of waste heat fromartificial lighting reduces HVACoperating costs and initial capitalcosts by allowing a smallermechanical system to be used. Thequality of natural light enhancesdisplay of exhibits and ha
Heating, Refrigeration and Air Conditioning Engineers (ASHRAE) regularly sets and updates efficiency standards for such equipment. Equipment changes for large systems (commercial, industrial, institutional or large multifamily residences) that can deliver significant energy savings are:
• Replacement of electric centrifugal chillers with steam or gas-driven absorption chillers or gas-fired internal combustion engine chillers.
• Replacement of old electric centrifugal chillers with new, more efficient ones.
• Installation of variable speed drives for fans and pumps, as this equipment is sized for peak loads, which occur infrequently.
In addition to specific equipment, significant savings are possible with the installation of HVAC controls, such as:
• Energy Management Control Systems turn HVAC systems on and off automatically, depending on indoor and outdoor conditions inside and hours of building occupancy.
• Outside Air Economizers allow the use of more outside air to provide some "free" air conditioning when it's cooler outside than it is inside, e.g. early morning. Note: Outside air economizers can also be used in conjunction with an Energy Management Control System to provide a "nighttime flush," bringing in fresh, cool outside air in the middle of the night when the building is empty.
s a mood-enhancing effect.
• Variable Speed Fans control the air supply system depending on the heating and cooling load. A building is only at maximum heating or cooling load for a few hours a year; the rest of the time the fans can be turned down a bit while still providing fresh air, but saving a significant amount of energy.
• Oxygen Trim Control Systems for boilers keep them operating at their peak combustion efficiency.
• Occupancy Sensors have been used for lighting control and are now being adapted to HVAC control. Chicago Embraces Industry
Chicago’s Rebuild Chicago Program is currently offering targetedassistance to metal casters – an energy intensive industry – in the form of energy audits to identifyenergy saving retrofits and processchanges. Next year, the City willoffer the program to chemicalproducing companies.
• Chiller Staging (for buildings with a multi-stage chiller or multiple chillers) will keep the appropriate chiller(s) operating at peak efficiency. This is similar to the oxygen trim control system for boilers.
While many of the more sophisticated measures do not apply to residential HVAC systems, homeowners can also accrue significant energy savings by selecting the most efficient furnace or air conditioner available, carefully selecting temperature settings, and conducting regular maintenance.

4.2.3 Industrial Processes ENERGY STAR® is a joint program between the U.S. Environmental Protection
Agency and the Department of Energy that offers businesses
and consumers energy efficient solutions -- helping to save money while protecting the
environment for future generations. The ENERGY
STAR® logo on equipment or appliances indicates a product that meets certain standards of
energy performance.
The processes used in the industrial sector can be highly energy intensive, for a variety of reasons that include high heat requirements or round the clock operation. While energy efficiency improvements can be made in these processes, it is harder to generalize because of their site-specific nature. An analysis of individual systems generally needs to be conducted in order to identify potential energy savings. Rather than requiring certain types of process changes or equipment, municipalities could provide financial incentives to carry out such analysis, such as loans or grants. One way to achieve industrial efficiency improvement is through the installation of combined heat and power (CHP) systems, which capture and reuse waste heat. The pulp and paper, petroleum, and primary metals industries have been particularly successful in installing CHP systems. (See chapter 3.0 for a detailed discussion of CHP.)
39
4.2.4 Appliances and Equipment In the residential sector, home appliances such as refrigerators, water heaters, dishwashers, and clothes washers are significant energy users. While appliance efficiency standards have been set on a national level, municipalities can promote use of more efficient appliances by establishing local guidelines for retailers, educating consumers, or providing assistance or incentives to encourage the installation of highly efficient appliances. For water-using appliances, the major energy requirement is for heating the water used, so maximizing the efficiency with which water is used, as well as with which it is heated, is important.
An ENERGY STAR® in San Diego
The City of San Diego hascompleted major energy efficiencyupgrades in 65 existing facilitiessince 1995, resulting in annualenergy savings of over 45 millionkWh. Included in these examples isthe remodeling of the 72,000 squarefoot Environmental ServicesDepartment office building, whichserves as a demonstration project.Historically, this building used 22kWh per square foot, and, afterremodeling, the building uses 7-9kWh per square foot, reducingenergy consumption by over 900,000kWh per year. This building was thefirst in the nation to receive theU.S.EPA-DOE ENERGY S
City practices governing procurement and operation of office equipment, including computers, printers, and photocopiers also offer an opportunity to significantly improve energy efficiency. This can be accomplished both through modifying how equipment is operated (i.e. turning power off when not in use) and by the type of equipment that is purchased (e.g., cities could mandate departmental purchasing of high efficiency ENERGY STAR® equipment.). Such measures would also benefit commercial office buildings.
TAR®Building Designation.
4.2.5 Landscaping Landscaping approaches, such as planting more trees and shrubs, and altering surfaces of roads, roofs, and parking lots, can help minimize energy consumption. These approaches work for individual homes and can also be applied in broader urban design approaches to address neighborhoods and communities. Trees and shrubs can shade buildings from the effects of sun and wind, thereby reducing heating or cooling requirements, depending on the season. Similarly, light-colored road, roof, and parking lot
An urban heat island is an area in an urban setting, with higher temperatures than the suburban
and rural surroundings.

surfaces can reduce the amount of heat absorbed from the sun, thereby decreasing the urban heat island effect and reducing summertime air conditioning loads for all sectors.
Greening Building Professionals
In Austin, the Green BuildingProgram promotes building energyefficient and comfortable facilitiesthrough marketing and technicaltraining of residential andcommercial building professionals.More than 200 architects, builders,designers, and related professionalsparticipate in the program. The Chicago City Council recentlyapproved the city’s first energy code,making energy efficiency practices astandard part of private constructionand major renovations. The city isalso providing training to architects,developers, and constructioncontractors who will be required toimplement the code. In Seattle, the Built Smart programprovides financial and technicalassistance to build new apartmentbuildings to standards that exceedSeattle’s energy code, with the resultthat many apartments andcondominiums in Seattle includehigh-efficiency lighting andappliances. In Portland, the U.S. Green BuildingCouncil just approved a local versionof the Leadership in Energy andEnvironmental Design (LEED)standard. Now Portland architectsand builders can use the local codesand construction standards to buildLEED-certified buildings.
4.2.6 Building Construction Building materials and approaches offer tremendous potential for energy savings. Insulation, windows, and other home weatherization techniques can prevent significant heat loss from individual homes, as well as commercial and institutional buildings, and often will capture significant unrealized energy savings. What’s more, many of these measures are simple and economical. Homes can be effectively weatherized with insulation, caulking, weather-stripping, and other approaches that reduce heat flows in and out of buildings. Windows made from low-emissivity glass (known as low-e windows) reduce radiant heat transfer to the outside in winter, while heat-absorbing and reflective glass windows diminish heat penetration in summer. Capturing the energy of the sun to heat water and to warm interiors can also be accomplished through passive solar design, further decreasing a home or a business’ energy requirements.
4.3 Municipal Programs
4.3.1 Education, Training, and Technical Assistance Education and training are critical components of effective energy efficiency programs and can empower community members to participate in sustainable energy planning efforts. On the residential side, communities can provide residents with energy facts, energy saving tips, energy audits, and information about efficient technologies and their use. In many cases, the most effective approach is to provide residential energy consumers with technical assistance in installing energy efficiency measures, which ensures participation and proper operation of the efficient technologies.
In addition to targeting residents, education, training, and technical assistance for architects, engineers, and builders can be very effective in addressing building energy efficiency. Communities can provide technical training workshops on incorporating efficiency into building design and construction and certification, such as green builder certification. Furthermore, general educational resources and incentives can be influential in increasing the energy efficiency of the building sector. For example, Portland, Oregon has created a publication, the “Green Office Guide” to educate and assist small business owners and managers. This guide describes opportunities to save resources in typical office operations and includes information about some successful case studies. Portland also issues annual BEST (Businesses for an Environmentally Sustainable Tomorrow)
SeatvariesavinincluProfcustohous
Educating Customers
tle’s city website provides aty of information and energyg tips to residential customers,ding the interactive Homeile service, which providesmized information onehold use of energy, water, and
40

Awards for commercial and industrial energy efficiency and other resource-efficiency practices. This gives recognition to sustainability-conscious firms, while highlighting examples for others to follow.
Price signals can be a powerful tool for influencing behavior, and Seattle’s City Light utility has tapped that power
by designing its rate structure to encourage efficient energy use by
customers. For residential customers, the first block of energy
(approximately 400 kWh) is at a low “lifeline” rate, while subsequent
blocks of energy cost nearly twice as much. This rate structure also encourages customers to take
advantage of City Light conservation programs.
4.3.2 Financial Tools and other Incentives Financial tools can provide an effective incentive for participation in efficiency programs. Some examples of commonly used financial incentives are low interest loans, rebates, free energy audits, reduced or eliminated permitting fees, and expedited permitting processes. In addition, certain electricity pricing mechanisms can encourage conservation, such as the approach taken by Seattle (see sidebar example).
Many home weatherization programs offer financial assistance or incentives. States, cities, and the U.S. Department of Energy all offer programs to weatherize the homes of low-income families, either free of charge, or financed through grants, loans, or rebates. The U.S. Department of Health and Human Services also provides fuel assistance funds through its Low Income Home Energy Assistance Program (LIHEAP), of which about $150 million a year is used for weatherization. Weatherization programs typically consist of a range of efforts, including insulation, weather-stripping, and installation of solar screens, and can be implemented for single family as well as multi-family homes.
Weatherizing Portland, Oregon
Portland’s MultifamilyWeatherization Assistance Programpromotes weatherization incentivesand provides free assistance toproperty owners and managers. Theprogram has facilitated theweatherization of 19,000 multifamilyproperty units since 1987, providingongoing savings of 28.5 million kWhper year. The program providesdetailed information aboutincentives, arranges free energyaudits, and assists with contractorselection and paperwork. In addition,Portland’s Block By Block Programhas weatherized 2,600 low-incomesingle-family homes since 1986. Thisprogram also includes outreach on avariety of resource conservationstrategies.
41
Financial incentives can be particularly effective in incorporating energy efficiency into multifamily housing. These developments can pose a significant barrier to energy efficiency, because tenants who pay energy bills wish to minimize energy costs, while owners who construct and maintain the buildings have an incentive to minimize construction costs, which does not necessarily lead to energy-efficient practices. By providing financial incentives and assistance to owners to exceed energy codes and install high efficiency lighting and appliances in new multifamily buildings, cities can help overcome these conflicting interests. Another way to address this issue is to install sub-metering systems for tenants in order to make them sensitive to consumption.
Permitting Green Buildings
In 1997, the County of San Diegoadopted a “Green Building Policy,”which provides a 7.5 percent permitfee reduction and expeditedpermitting for building projects thatexceed California’s strict buildingcodes for energy efficiency. TheCounty was also the first jurisdictionto eliminate permitting fees forphotovoltaics installations.
4.3.3 Building Codes Mandatory building codes are one of the ways in which cities can be most influential. Most states have adopted energy efficiency building codes that incorporate ASHRAE recommendations, and these codes are generally enforced by local building departments. Some communities can also establish commercial building codes that require certain levels of energy efficiency, thereby affecting the design and construction of new or renovated buildings as well as the lighting, appliances, and HVAC systems that are installed. Building energy codes can address insulation, windows, lighting,
heating and cooling systems, and other features related to energy consumption, and they can be regularly updated. For example, the Minnesota Legislature passed a statute in 1991 requiring that Minnesota’s construction building codes “…equal or exceed the most energy-conserving codes adopted by any other state,” resulting in building codes adjustments in 1993 and 1998. This building code addresses the confluence between energy use, sound construction, and indoor air quality.
Commercial Building Incentive: the Floor-Area Ratio (FAR)
Premium
The City of Minneapolis recentlyadopted a FAR premium incentive tocapture the public and societalbenefits of energy efficiency in newcommercial development. InMinneapolis, as in many cities, thedensity of development in its coredowntown district is regulatedthrough FAR thresholds. Forexample, a FAR limit of 16 meansthat a building can have a floor area16 times the area of the site. To builda taller building, a developer requiresFAR premiums. These are offered bymany cities, including Minneapolis,for developments that providespecific public amenities, such asopen space, public art, street levelretail, historic preservation and otherbenefits. Minneapolis has nowadopted the High PerformanceBuilding incentive, which offers aFAR premium for private investmentin energy efficiency or onsiterenewable energy. Exceeding theState Energy Code by 35 percentresults in a FAR premium of 1;exceeding it by 45 percent results in asecond FAR premium. Performanceis measured by modeling theproposed building’s energy use underminimum energy standards comparedto energy use under the proposedimprovements. In addition, thebuilding plan must provide insurancethat the promised efficiencythresholds will be met.
Cities can achieve significant energy efficiency improvements via their building codes, because buildings are complex systems with many different energy requirements. Buildings also provide a unique opportunity to integrate multiple energy efficiency measures in one setting. One of the most important principles of building energy efficiency is that it is easier and more cost-effective to incorporate energy-efficient design when constructing or renovating a building than it is to make costly retrofits after construction or renovation is complete. Because of this, many city energy efficiency programs establish requirements for new buildings or existing buildings that are undergoing renovation. Furthermore, the specific requirements for new or renovated buildings may differ, in recognition of the constraints faced by an existing structure. While new building construction offers an opportunity to address the entire spectrum of energy efficiency opportunities simultaneously, changes to existing buildings may be approached in a piecemeal fashion. Requirements for new buildings may reasonably be fairly comprehensive and rigorous, while requirements for existing building retrofits may be more dependent upon the scale of renovation being undertaken. However, even when a building is not being retrofitted in its entirety, there are opportunities for incremental energy efficiency improvements. These include lighting upgrades, HVAC improvements, and purchases of energy-using equipment.
City Energy Challenge
In 1991, the Portland, Oregon City Council created the City Energy Challengeto meet its goal of improving city energy efficiency by ten percent by 2000. Thesavings target was initially set at $1 million per year by 2000, and this goal wasexceeded in 1997. Since its inception, the program has saved the city over $10million. Savings, currently $2 million per year, have come from more than 70projects that include building lighting upgrades, heating and cooling equipmentand controls, and process improvements at wastewater treatment plants.
42
Chicago Retrofits Government
The City of Chicago is retrofitting 15 million square feet of government facilities to maximize energy efficiency. Chicago estimates a 30 percent reduction in energy use and savings of $6 million in annual operating costs from installing efficient boilers and lighting.
4.3.4 Voluntary Programs In addition to mandatory building code requirements, communities can establish voluntary programs to encourage energy-efficient practices. Participation in these programs can be fostered through training, financial assistance, and other incentives. For example, many communities have integrated the Leadership in Energy and Environmental Design (LEED) system, developed by the U.S. Green Building Council (U.S.GBC), into their building requirements. The LEED Green Building Rating System is a voluntary, consensus-based, market-driven building rating system based on existing, proven technology. It evaluates environmental performance from a whole building perspective over a building's life cycle, providing a definitive standard for what constitutes a “green building.” LEED™ is based on accepted energy and environmental principles and strikes a balance between known effective practices and emerging concepts. Furthermore, the development of the LEED Green Building Rating System™ was initiated by the U.S. Green Building Council membership, representing all segments of the building industry and has been open to public scrutiny. This program can be applied to commercial, multifamily residential, or governmental buildings.
The industrial sector has also taken advantage of voluntary energy efficiency programs. While the industrial sector is often energy-intensive, energy costs may be a relatively small portion of overall costs, and thus motivating change may be more difficult than in other sectors. Furthermore, because industrial customers are typically large energy users, energy providers such as utilities often provide discounted rates to these customers, further discouraging investments in energy efficiency. Despite these obstacles, there are a few areas where a community committed to a sustainable energy plan may influence the implementation of industrial energy efficiency.
In 1994, EPA and the Department of Energy launched Climate Wise, a voluntary program that encouraged industry to adopt flexible, comprehensive approaches to reducing greenhouse gas emissions. Through Climate Wise, participants were able to develop a comprehensive portfolio of emissions reduction actions that protect the environment, save money, and improve productivity. Many cities have worked extensively with the industrial sector through the EPA Climate Wise program, including Austin, Chicago, Portland, San Diego, Saint Paul, and Seattle. Saint Paul’s program has recently added Ford Motor Company, Tilsner Carton, Honeywell, and District Energy St. Paul to its previous partners, 3M and Northstar Steel. Northstar was the first steel mill in the country to sign on to the program. In fall of 2000, Climate Wise was rolled into EPA’s Energy Star program.
Green Building Programs
In 2000, the City of Portland, Oregon established G/Rated. This green building program encourages the adoption of new technologies in local construction practices by assisting localdesigners, builders, and building owners with testing and installing new design practices and technologies. In addition to technical information and resources, the city provided financial incentives to developers of 1.3 million square feet of commercial projects and 600 residential units. In addition, the Portland Development Commission now requires green building features in all affordable housing that receives municipal funding.
In Seattle, the Energy Smart Designprogram provides funding for analysis and installation of electrical savings projects that exceed the code (financial incentives of up to 70 percent of the installed cost are available). In order to reach architects and engineers as early in the process as possible, the program is promoted through radio and print advertising, free training sessions are offered, and a set of web-based building commissioning guidelines were developed.
In Denver, the Built Green Communities Program passed by the Metro Home Builders Association promotes voluntary land use and community design guidelines that minimize environmental impact. A major component of this program is the promotion of energy efficient buildings and reduction of transportation-related fuel costs through smart design. The program is promoted through a partnership of planners, developers, builders, lenders, and government agencies.
43

Industry Partnerships in Seattle
Climate Wise was begun in Seattle in1997 to encourage cooperation betweenpublic, private, and government sectorsto make energy efficiency andenvironmental performance a businessasset. In April 2001, the City of Seattleassumed lead support for this voluntarypartnership program in the Seattle area,as part of its efforts to bring together theexperience of all sectors of society –government, nonprofit and private – toaddress climate change in a proactive,collaborative way. Adapting marketingstrategies that were successful inPortland, the list of Climate WisePartners in Seattle is long andimpressive. Partners include Boeing,Capital One, Pike Place Market, SeattlePublic Schools, Starbucks, and theUniversity of Washington, to name justa few. These companies havedeveloped action plans, installed moreefficient equipment, and retrofittedfacilities, while improving their energyperformance and their bottom line in theprocess.
4.3.5 Efficiency at the Municipal Level Leading by example is one of the most powerful tools cities have at their disposal to increase community awareness of energy efficiency and its benefits. Government buildings and facilities offer numerous opportunities to implement the approaches discussed in this chapter, showcase their operation, quantify their benefits, and educate the public. In this way, cities can obtain considerable benefits – in the form of positive public relations, environmental improvements, and economic gain - by applying energy efficiency principles to their own facilities and installations. Furthermore, the costs savings offered by deploying energy-efficient technologies and approaches can be applied to other community needs.
44

This Page Left Intentionally Blank
45

46
Sustainable Energy Actions Cities Can Take Today Building Codes/Standards Establish energy efficiency standards (voluntary or
compulsory) for construction of new buildings and renovationof existing buildings; provide incentives for commercial andresidential construction to meet high energy efficiencystandards [e.g., Leadership in Energy and EnvironmentalDesign (LEED) standards]; and improved building energycodes that address insulation, windows, lighting, and otherfeatures related to energy consumption.
Education and Training Provide energy audits for home and businesses, training and
workshops for builders, architects, and developers onimproving building efficiency and developing “green”buildings.
Financial Tools Provide low interest loans, rebates, tax incentives for energy
efficiency improvements; price electricity services toencourage conservation; work with banks to establish “energyefficiency mortgages,” which reward buyers for energyefficient home design components with lower interest rates(because monthly maintenance costs are lower).
HVAC Upgrades Replace existing heating and cooling systems in municipal
buildings with energy-efficient equipment; install digitalelectronic HVAC controls.
Efficient Lighting Replace existing municipal office and building light fixtures
with energy-efficient lighting; install occupancy sensors, usedaylighting; replace traffic lights and exit signs with lightemitting diode (LED) technology.
Procurement Practices Establish energy efficiency specifications for city facilities for
purchasing Energy Star labeled office equipment andappliances.
Sustainable Design Encourage sustainable land use and design through zoning. Urban Heat Islands Mitigate urban heat island effects by planting trees for shade
and using (for municipal property) and promoting (for privateproperty) light-colored materials for roofs and pavement.
Weatherization Programs Establish residential weatherization programs to increase
energy efficiency and decrease costs.

47
Looking Ahead…
The programs and technologies discussed in this chapter are available and effective today, but advances are continually being made. Some of the energy efficiency technologies we may encounter in sustainable cities of the future are: Computerized Buildings The potential for optimized facility management for energy
use and operating conditions exist today. Lights, heating andcooling, window opacity and conductivity, daylighting,shading, weatherization, and other environmental systems willbe integrated into the fabric and design of the building.
Net Energy Producing Buildings will be designed so that they become net energy Buildings. producing instead of load building. Appliances and machines inside will be super-efficient. Optical Computing Optical computers that compute with light rather than
electricity are close to becoming a reality. Optical computingincreases speed and decreases energy requirements becauseunlike electrons, photons have no mass. Optical computerswould create less waste heat.
Nanotechnology Building at the molecular level will represent a major
departure from present industrial processes. Nanotechnologyis already finding a place in carbon-based photovoltaicsdevelopment, making solar power paints and radiation toelectron-conducting surfaces of every possible configuration anear term reality. Nanotechnology will revolutionize industry,the building sector, the manufacturing sector, and humandevelopment in profound unpredictable ways.

This Page Left Intentionally Blank
48

5.0 TRANSPORTATION
5.1 Introduction The U.S. transportation system provides almost 300 million residents with one of the highest levels of personal mobility in the world. It is quite literally an engine of the economy, comprising about 11 percent of the nation’s GDP, supporting one in eight jobs, and accounting for almost 20 percent of all U.S. household expenditures.
Over one-third of the world’s fuel use is for transportation,
and half of the world’s gasoline for transportation is
used in North America.
However, this extensive transportation network and its benefits come with a significant environmental price tag. The largest transportation-related problems are associated with its energy consumption and the pollutants that result. The U.S. transportation sector is 95 percent dependent on fossil fuels, consuming all domestic oil production and 40 percent of oil imports. This heavy fossil fuel ingestion results in large emissions of air pollutants, with significant health and environmental impacts (see Chapter 1.0). Other transportation environmental problems include lead-acid battery and tire wastes, traffic congestion, loss of green space, and noise pollution.
Transportation’s Share of U.S. Emissions
CO2: 30 % NOx: 53 % SO2: 67 % CO: 79 %
VOC: 70 %
U.S. Department of Transporatation, Bureau of Transportation Statistics, 1999
Metropolitan regions across the nation are developing solutions to these concerns. Communities are implementing new approaches, such as integrated land use and transportation planning; increased availability of high-quality mass transit; improved connectivity between pedestrian, bike, transit, and road facilities; incentives for transportation alternatives; and leading by example with municipal investments in clean fleets.
From 1969 to 1995, the number of household vehicles
in the U.S. increased by 143%, while the population
increased by only 23%.
Because transportation, by its very nature, often extends beyond the borders of individual communities, it is managed at multiple levels of government. Federal funding and requirements play a significant role, as do state and regional initiatives. This chapter of the Blueprint explores different programs, solutions, and tools that can be undertaken by municipal entities as part of their community sustainable energy plans.
63% of transportation energy is used for cars and
light duty trucks 18% is for heavy-duty trucks
and buses 1% is for transit.
5.2 Integrated Planning Patterns of land use and development arguably have the single largest impact on transportation. Effective land-use planning creates a structure within which transportation can function at maximum efficiency. Indeed, it is essential that land-use planning be integrated with transportation planning. By creating communities or neighborhoods where the locations of homes, businesses, industrial facilities, commercial centers, and recreational areas are integrated instead of isolated, transportation systems can be made far more efficient. Without such integration,
49
Sustainable Design A 100-year sustainable urban design developed for the San Diego-Tijuana region views the land-use plan and the transportation system as the key to the region’s success in achieving
sustainable development. The design concentrates growth into targeted
urbanized areas of mixed-use development at transit nodes and
along corridors. This development pattern reduces and, in many cases,
eliminates the spatial separation among residential, employment,
shopping, social, and recreational centers, thereby reducing or
eliminating energy consumption and air emissions associated with travel
among them.
efforts to develop sustainable mobility will be piecemeal and ultimately, ineffective. So, more than any other sector of energy use, transportation illustrates the importance of incorporating sustainable energy plans into communities’ Comprehensive Plans.
This Blueprint is not intended to comprehensively address land-use planning and its connection to sustainable transportation. However, some approaches to land-use planning that facilitate sustainable use of energy in transportation are discussed below.
Smart Growth The U.S. Environmental Protection Agency defines smart growth as development that serves the environment, the community, public health, and the economy. Smart growth is often characterized by a common set of development principles:
1. Mix land uses 2. Take advantage of compact building design 3. Create a range of housing opportunities and choices 4. Create walkable neighborhoods 5. Foster distinctive, attractive communities with a strong sense
of place 6. Preserve open space, farmland, natural beauty, and critical
environmental areas 7. Strengthen and direct development towards existing
communities The Metropolis Plan: Choices
for the Chicago Region Metropolis 2020, a Chicago civicorganization, has developed avisionary plan that would enable theChicago region to grow in a way thatwill increase economic vitality,environmental quality, and theregion’s quality of life. The centralelements of this plan revolve aroundeffective land-use planning andtransportation. Some of therecommendations highlighted in thereport are to: • Coordinate land use and
transportation policy • Create a broader range of
housing options • Ensure adequate housing near
jobs and transit • Design communities that are
friendly to walking, biking, and public transit use
8. Provide a variety of transportation choices 9. Make development decisions predictable, fair and cost-
effective 10. Encourage community and stakeholder collaboration in
development decisions
Smart growth planning also fosters transportation efficiency and, therefore, sustainability, because it reduces the need for extensive driving. This is addressed explicitly in principle number 8, but is also implicit in many of the other principles. Many communities today are embracing a Smart Growth approach to planning, seeing it as a means to improve their community’s quality of life, while addressing local development challenges.
Transit-oriented development (TOD) is a new (or renewed) form of urban development that designs residential and commercial areas to maximize access to transit or non-motorized transportation and to increase transit ridership. Transit-oriented development is one possible manifestation of Smart Growth principles. TOD has typical features that include:
• Neighborhoods designed for cycling and walking • Traffic-calming measures in place
50

• Parking management (less land dedicated to parking) • Mixed-use development Transit-oriented development can provide residents with improved quality of life and reduced household transportation expenses while providing the region with stable mixed income neighborhoods that reduce environmental impacts and provide real alternatives to traffic congestion. New research clearly shows that this kind of development can reduce household transportation costs, thereby making housing more affordable. Clearly, linking transportation and land-use planning as part of a community sustainable energy plan can yield many environmental and economic benefits.
Per passenger mile, public transit produces 5% as much CO, less than 10% as much VOC, and a little more than 50% as much CO2 and NOX, while consuming only about
half the fuel and energy of cars, SUVs, and light trucks.
Funding Transportation Planning The 1991 passage of the Inter-modal Surface Transportation and Efficiency Act (ISTEA) (and subsequent reauthorizations of this Act) recognized the connection between air quality and transportation, and placed responsibility for these issues at the local level, with metropolitan planning organizations. These Acts have allocated billions of dollars for projects designed to help regions meet the Clean Air Act standards for smog and carbon monoxide (the CMAQ or Congestion Mitigation and Air Quality program).
An important aspect of this legislation and its evolution is the incremental change in how transportation projects are planned and completed. These changes are manifest in a more comprehensive transportation planning approach called “Context-Sensitive Transportation Design.” This is a collaborative, interdisciplinary approach, involving all stakeholders to ensure that transportation projects are in harmony with communities and preserve environmental, scenic, aesthetic, and historic resources while maintaining safety and mobility. Linking this means of transportation planning to community land-use planning is key to successful sustainable energy planning.
Portland Light Rail
Portland built the first leg of its lightrail system instead of expanding afreeway. The second leg was builtinto a booming suburban areapromoting transit-orienteddevelopment. The third leg wascompleted in 2001 and connected theairport to the rest of the light railnetwork. A fourth leg is now underconstruction. Now thousands ofpeople in Portland are transported byelectric-powered light rail instead ofgasoline or diesel powered vehicles.
5.3 Alternatives to Driving
5.3.1 Mass Transit Public transportation systems offer tremendous opportunity for increasing transportation efficiency, reducing traffic congestion, reducing energy consumption, and improving environmental quality. Cities, in particular, with their dense development patterns, limited open space, and high populations, are well suited to extensive public transit systems. Mass transit includes bus, light rail, commuter rail, and subway systems. Most cities, especially the larger metropolitan areas, have one or more mass transit
51

systems in place. These systems are continuously being modified and upgraded, and these changes provide opportunities to identify ways to better meet public needs and to promote use of mass transit as a means of achieving energy sustainability. A
eua1abp2
However, while mass transit ridership in the U.S. is on the rise, only two percent of America’s one billion annual household trips are made by mass transit. In contrast, ninety percent of these trips are made by car. Thus, a major focus of cities’ efforts to improve mass transit revolves around programs to increase ridership.
Approaches to increase transit ridership include:
T(cCFoaDCCoaeac
Td`bptotrafP
Denver Employees Take the Bus
1998 survey of Denver City
mployees showed that 65 percentse alternative transportation orlternative work schedules. Now,700 City employees (12 percent)nnually purchase 15,000 subsidizedus passes. The programarticipation rate will be increased to0 percent by 2010.
52
• Improve mass transit infrastructure, accessibility, connectivity • Provide subsidized transit passes • Remove subsidized parking • Provide cash instead of a workplace parking spot Chicago’s Bike & Ride
Program
he Chicago Transit AuthorityCTA) Bike & Ride program is aollaborative effort between theTA, the Chicagoland Bicycleederation, the Chicago Departmentf Transportation Bicycle Program,nd the CTA’s Americans withisabilities Act Advisoryommittee, which allows bikes onTA trains and buses. This programffers flexible, convenientlternatives for bicyclists. Itncourages intermodal transportationnd reduces the need for cars inongested areas.
Foot and Pedal Power
Travel data for the U.S. indicate that walking could be used more widely than it is now. Walking can replace the auto for many short trips. The 1995 Nationwide Personal Transportation Survey (NPTS) reveals that the average U.S. walking trip is 0.6 miles. The NPTS also found that 50 percent of all trips are less than three miles, 40 percent are less than two miles, and over 25 percent are one mile or less. All trips, whether by auto, bus, bike, or train, include a walking segment. Walking and bicycling are two of the oldest, most basic, affordable, and accessible of human transportation modes, and they epitomize sustainable mobility. Both modes are efficient methods of travel for short trips from home or work as well as trips connecting to transit for longer journeys.
All across the U.S., cities are revitalizing and creating new walkways, greenways, and bikeways. Bicycle and pedestrian modes of travel are once again being recognized as cost-efficient ways to address mobility and air quality concerns. Many cities are now creating and implementing pedestrian and bicycle plans. In fact, Portland’s leading alternative transportation fuel is pedal power. Named "the most bicycle-friendly city in America" by Bicycling magazine in 1999, Portland offers one of the nation's most progressive bicycle transportation programs. Cyclists enjoy wide, clearly marked bike lanes on most major commuter routes, municipal bike racks, access to bridges, and bike safety programs. Adding to the bike-friendly atmosphere, Tri-Met buses are equipped with bike racks, while bikes are also welcome aboard all MAX light rail trains. The Bicycle Transportation Alliance (BTA), the City of Portland Bicycle Advisory Committee, and a
Bike-Friendly Philadelphia
he City of Philadelphia iseveloping a citywide network of`bike friendly" streets to serveicyclists as part of a comprehensiverogram which gives full recognition the bicycle as a viable mode ofansportation. One way this is beingchieved is through the $3.7 million,ederally funded, Bicycle Networklan for the City.

53
local government bicycle coordinator are on hand to keep things running smoothly. The City has added 150 miles of bikeways, and the number of bicycle commuters has almost tripled since 1990. Chattanooga also recently completed a $100,000 study and guide for the development of bicycle facilities in the Chattanooga urban area, and many other cities are taking similar steps.
Austin’s Pedestrian Plan
To promote walking as a viabletransportation alternative, the City ofAustin has a Pedestrian Plan withfour integrated elements: 1. Engineering of safe sidewalks
and comfortable pedestrianenvironments
2. Enforcement of traffic laws forall roadway users and crimeprevention to increase personalsafety for people who choose towalk. Includes enforcement ofjaywalking laws
3. Encouragement for people towalk instead of, or in additionto, driving
4. Education of all roadway userson safe and proper behaviors intraffic. Education of school-agechildren on safe pedestrianbehavior
Cities are providing funding, legislation, and education to encourage the use of bicycles walking as intermodal transportation tools. They are implementing networks of safe routes and facilities for biking and walking that connect destinations and activity centers and are integrated with other modes of transportation and regional greenways. These programs form a cornerstone of sustainable mobility efforts and may simultaneously deliver many ancillary quality-of-life benefits, such as increased sense of community, improved community health, and improved city esthetics. These efforts will not be successful without land use planning that accommodates and promotes alternatives to driving.
5.4 Traffic Management The Texas Transportation Institute reports that congestion over the last several years has worsened in nearly every major metropolitan area in the United States (TTI, 2002). Between 1980 and 1999, urban vehicle miles traveled rose 90 percent, meaning that the average urban throughput, an indicator of congestion, has risen significantly. Conventional transportation planning responds to traffic congestion by building more roads. However, recent studies indicate that opportunistic motorists previously kept at home by traffic conditions immediately fill up to 50 percent of the new road capacity, in a phenomenon known as “induced demand.”
In 1982, 65 percent of travel occurred in un-congested
conditions, compared to only 36 percent in 2002.
5.4.1 Congestion Management Congestion pricing is one possible approach to traffic congestion. Most roads have free or inexpensive access, and hence there are no price incentives that would control the number of cars using these roads. As a result, some transportation planners have encouraged expanded and improved pricing for road use, at least when congestion is bad enough to slow the flow of traffic.
The standard remedy of building more traffic lanes to
relieve congestion is said to be like loosening one’s belt to cure
being overweight.
High-Occupancy Toll (HOT) lanes are another road pricing strategy to relieve congestion. HOTs are a variant on high-occupancy vehicle (HOV) lanes (commonly known as carpool lanes). While HOV lanes restrict use during certain hours to cars with multiple travelers, HOT lanes also allow solo drivers to pay for riding in the lane. This system retains the incentive to carpool, but better ensures against underutilization of lane capacity, a common criticism of HOV lanes.

San Jose's Traffic Signal Management Program (TSMP)
San Jose's TSMP synchronizes trafficsignals to minimize delay formotorists traveling through the city,and monitors the operation of trafficsignal equipment to improvemaintenance and repair responsetimes. The focal point of the TSMP isthe traffic operation center, SignalCentral, located in the downtownoffices of the City's Department ofTransportation. Currently, over 500 ofthe city's 800 traffic signals areconnected to Signal Central. Thetraffic signal controllers are connectedto the system through a combinationof City-owned cable, leased telephonelines, microwave communication, andspread spectrum technology. Whenfully implemented, San Jose's TSMPwill save 3.2 million gallons of fueland $10.7 million in vehicle operatingcosts each year. Traffic stops anddelays will be reduced by 16 percent.The reduction in fuel use will alsoreduce carbon monoxide emissions by723 tons, hydrocarbon emissions by49 tons, and nitrogen oxide emissionsby 57 tons.
5.4.2 Intelligent Transportation Systems
Projections show that the volume of vehicles on the nation's roads may rise 50 percent in the next 10 years. This intense stress on existing transportation infrastructure now drives the development of enhanced intelligent transportation systems (ITS) for metropolitan areas.
The purpose of Metropolitan ITS is to optimize the transportation system through the use of advanced technologies and new institutional arrangements. The model is similar to what the aviation industry implemented several years ago. Closer management of airspace, pricing strategies, real-time operation, and information sharing enabled the industry to grow substantially, despite a fixed amount of airspace.
Many metropolitan areas have created traffic management centers with closed-circuit television cameras, traffic and weather sensors, electronic variable message signs, traffic signals, and ramp meters to monitor and manage traffic flow on streets and freeways. As information is received at the traffic management center, travelers are informed of problems via radio, television, the Internet, and signs along the roadways.
Total nationwide funding for intelligent transportation systems is expected to amount to almost $1.6 billion over the next six years. By 2010, experts project that 10 percent of new light vehicles and 25 percent of new commercial vehicles will be equipped with one or more intelligent vehicle systems. Several examples of Metropolitan ITS are:
Traffic Signal Control Systems, which automatically adjust to optimize traffic flow.
Chattoperapassea mautomtwo fis a rfuel (gaso(comsoybetechnBeneChattemissenergcostscreat
Freeway Management Systems, which provide information to motorists, detect problems for increased capacity and flow, and minimize congestion from crashes.
Electronic Toll and Fare Payment Systems, which offer drivers, passengers, and transportation agencies convenient and reliable automated transactions.
Metropolitan ITS offers many benefits. Advanced traffic surveillance and signal control systems have resulted in travel time improvements ranging from 8 to 25 percent. Freeway management systems, primarily through ramp metering, have reduced crashes by up to 50 percent while handling 20 percent more traffic at speeds up to 50 percent faster than pre-existing congested conditions. Electronic toll collection increases capacity by 200 to 300 percent compared to attended lanes. Electronic fare
Hybrid Buses Benefit Chattanooga
anooga has 17 hybrid buses intion, which carry one millionngers a year. A hybrid vehicle isotor vehicle, such as anobile, truck, or bus, which uses
uels for propulsion, of which oneechargeable battery. The secondcan include conventional fuelsline or diesel), alternative fuelspressed natural gas, propane,an diesel) or advancedologies (flywheels, fuel cells).fits of Hybrid Buses inanooga include reducedions, no fuel smell, a quiet ride,y efficiency, lower operating, increased tourism, and theion of more than 100 jobs.
54

payment technologies for transit systems have resulted in increased revenues up to 30 percent, due to fewer fare evasions. These systems also provide a means for peak hour road pricing.
5.5 Clean Municipal Fleets
One of the best ways for a city to integrate sustainability into its transportation system is to lead by example and incorporate cleaner (than gasoline) fueled vehicles into its municipal structure. One way to do this is through the U.S. Department of Energy’s (DOE’s) Clean Cities Program, a voluntary, locally based government/industry partnership to mobilize local stakeholders in the effort to expand the use of alternatives to gasoline and diesel fuel, accelerate the deployment of alternative fuel vehicles (AFVs), and build a local AFV refueling infrastructure.
Chicago Invests in Clean Fuel Infrastructure
The City of Chicago has built nineAFV fuel stations with CMAQfunds, and is building 10 to 12 in2003. The City of Chicago currentlyhas 2500 AFVs, which includes 500baggage tugs at O’Hare InternationalAirport.
The Federal Energy Policy Act of 1992 defines an alternative fuel as any fuel that is substantially non-petroleum and yields energy security and environmental benefits. Qualifying fuels include hydrogen, electricity, ethanol, and compressed natural gas, among others. There are currently almost 500,000 AFVs in the U.S. AFVs are projected to make up two percent of light-duty vehicle fuel use in 2020 and are expected to displace about 184,000 barrels of oil per day by 2020.
Denver’s Fuel of the Future In 1991, Denver tested a new typeof fuel called Hythane that is 15
percent hydrogen, and 85 percent compressed natural gas. The fuel
is now the subject of research and development efforts in the
U.S. and overseas.
The Clean Cities Program has created more than 75 partnerships in communities throughout the country, and it is still gaining momentum. These “pioneer” Clean Cities feature more than 160,000 operational AFVs. More than 3,500 stakeholder organizations are committed to significant increases in vehicle acquisitions and infrastructure investment over the next five years.
The Clean Cities program is well suited to integration with sustainable energy planning, and it provides an existing structure within which planners can tailor the specifics to their city’s circumstances. Most industry analysts now conclude that the remaining challenges in establishing the widespread use and availability of AFV technologies are not technical, but rather are economic in nature. Federal, state, and local governments can play a large role in overcoming this economic barrier by encouraging wide-scale adoption of alternative fuels and advanced vehicle technologies in government fleets.
Portland, Oregon’s transit system, Tri-Met, tested some early versions of liquefied-
natural-gas-powered buses, and more recently, they have
purchased some hybrid electric buses that are currently being
tested in Portland.
5.6 Other Clean Vehicle Initiatives Some research programs and funding initiatives are not under the control of cities, but can benefit the transportation components of city sustainable energy plans, nonetheless. Such programs include initiatives to increase the stringency of vehicle emission standards and fuel economy requirements, as well as efforts that target clean
55

transportation technologies, such as fuel cell vehicles. While cities may not be sponsoring such research initiatives, they can play a role in deployment of clean vehicle technologies.
Fuel Economy For example, increasing vehicle fuel economy, which reached a 21-year low in 2001, can be accomplished by increasing the federal corporate average fuel economy (CAFÉ) standard that mandates a fleet fuel efficiency level. This measure results in less fuel use, and therefore lower emissions, but it is controversial. Furthermore, with the number of drivers and miles driven increasing annually, it has a small impact on transportation sustainability.
It is estimated that improving fuel economy standards to 40 mpg
would save car owners $3,000 to more than $5,000 at the gas
pump over the life of a vehicle, in addition to the environmental
benefits that would accrue.
Hybrid Vehicles The recent emergence of efficient hybrid vehicles demonstrates another route to cleaner transportation. Hybrid vehicles – with nearly twice the fuel efficiency of standard automobiles and significantly reduced emissions – are a new technology entering the marketplace, and while current prices for hybrids are higher than standard automobiles, government assistance and promotion could increase sales. Toyota Motor Corporation, the world's third-largest automaker, plans to use gasoline-electric hybrid engines in all vehicles by 2012 to increase fuel efficiency and reduce tailpipe emissions.
In 2001, the City of Portland purchased 30 hybrid electric
vehicles as a start toward making their fleet 100 percent hybrid.
Fuel Cell Vehicles Fuel cells have captured worldwide attention as a clean power source for electric vehicles (EV). Fuel cell vehicles are widely seen as the future of the current hybrid-electric vehicles, which currently use an internal combustion engine and an electric motor. In a hydrogen-fueled EV, hydrogen gas combines with oxygen in fuel cells, where the chemical reaction forms water and generates electricity that powers a motor. The result is a clean, quiet vehicle, with virtually no emissions. All the major automakers have fuel cell vehicles in development.
U.S.A. FreedomCar The FreedomCar program aims toachieve considerable cuts in CO2emissions, and substantially reduceoverall emissions in urban areas,while relieving dependence of lightduty transportation on petroleum.Under this initiative, the governmentand the private sector will fundresearch into advanced, efficient fuelcell technology, ultimately resultingin cars and trucks that are moreefficient, cheaper to operate,pollution-free, and competitive in theshowroom.
Estimates of annual private sector investment in fuel cell technology range from $1 billion to $3 billion. The current U.S. Department of Energy annual fuel cell budget of $150 million is expected to increase considerably. One initiative is the development of the U.S.A FreedomCar, a new class of vehicle for personal mobility, supported by a public-private research effort.
Toyota and Honda have put their first market-ready, zero-emission, hydrogen-powered fuel-cell vehicles in the hands of consumers. In late 2002, the University of California got the first two Toyotas, which have a range of 180 miles and a top speed of 96 mph. The university will lead an alliance helping Toyota refine and improve
56

its nonpolluting car — a midsize sport utility vehicle that is based on its Highlander model.
In Los Angeles, Honda delivered its car to mayor James Hahn. The City is leasing five of them for “real-world” driving by city staffers. Honda plans to lease about 30 fuel cell cars in California and Japan during the next two to three years. The company currently has no plans, however, for mass-market sales of fuel cell vehicles or sales to individuals.
57

58
Sustainable Energy Actions Cities Can Take Today Alternative Transportation Encourage and promote the use of alternative transportation fuels Fuels that result in less air pollution. Bikes for Munis Governments, businesses, and institutions can provide bicycles
instead of motor vehicles for certain jobs. Facilitate Driving Improve/establish safe bike/hike paths on commuting routes; Alternatives provide bike racks on buses and trains. Fees for Sprawl Discourage sprawl and encourage transit-oriented development
through assessment of fees relating to infrastructure costs.
Green Municipal Fleets Improve the energy performance of municipal vehicles by reducingfleet size, eliminating old vehicles, maximizing fuel efficiency,promoting alternative transportation fuels, and minimizingemissions.
On-Site Facilities Encourage developers to build cafes, drug stores, banks, and other
services onsite so workers do not have to drive off site. Preferential Parking Encourage developments to reserve free parking for drivers
participating in ride-share and car-pooling programs. Promote Mass Transit Upgrade mass transit facilities’ infrastructure and convenience;
encourage employer transit subsidies; cashout for parking spot. Promote Ridesharing Establish HOV lanes, preferred parking for carpools; establish car
share programs. Reduce City Worker Give city employees incentives to reduce driving, i.e. transit passes,Driving priority parking for carpools; promote and facilitate non-driving
alternatives, including telecommuting and biking. Slow Traffic Implement traffic calming measures to encourage walking. Timed Traffic Signals Time traffic signals to keep cars and trucks moving, increasing fuel
economy and decreasing emissions. Zoning Modify zoning codes to promote high density and infill
development (thereby increasing the convenience of walking and biking and reducing need for driving).

59
Looking Ahead… Most of the programs and technologies discussed in this chapter are available today, with advances continually being made. Some of the transportation technologies we may encounter in sustainablecities of the future are: Personal Rapid Transit The PRT is a small, automated vehicle that is operated on elevated
guide-ways. Stations would be provided so that riders could get tothe system with a short walk and then have a non-stop, “stress-less and view-rich” ride to the station closest to their destination.Examples of emerging PRTs are the TAXI 2000, which is under development near Minneapolis. MicroRail, and the smallerNanoRail, are being developed in Texas.
Group Rapid Transit GRT is a transit system very much like PRT, but its vehicles, guide-
ways, and stations are larger. Some GRTs have off-line stations, which make non-stop service possible, but others do not, requiring a stop at each station. One example of GRT is the CyberTran, whichis still in the conceptual stage.
Dualmode Dualmode transportation is a transportation system where the
vehicles can be operated on both the conventional street system andon an automated guide-way under computer control. Dual-mode systems can provide door-to-door service, which neither PRT nor GRT systems can do. The Danish Dualmode system is called RUF(Rapid, Urban, Flexible), and the MegaRail is being developed inTexas.
Telecommuting Economy Advanced communication and computer systems can facilitate work
from the home or from neighborhood activity centers.Telecommuting is now experiencing an annual 20 percent growth rate. Some analysts predict that as many as 40 million Americanscould be working from home by 2030, which would “considerablyreduce mayhem and congestion on the roads.”

6.0 FINANCING SUSTAINABLE ENERGY DEVELOPMENT
Because many sustainable energy measures require higher up-front capital expenditures than conventional energy approaches, one hurdle to overcome in implementing sustainable energy plans is financing these energy efficiency or renewable energy measures. Allocating funds from city operating budgets can be particularly daunting during difficult economic periods, when many local and state governments have significant budget deficits. However, some cities and states have developed innovative ways to handle this challenge to sustainable energy projects, capitalizing on the fact that improving energy sustainability can have short- and long-term economic benefits. Approaches and resources to help finance sustainable energy plans and methods are discussed below. They range from local bond efforts, to state or federal co-funding, to leveraging private investment.
6.1 Local Financing Approaches
60
6.1.1 Grants Grants from federal and state government agencies are a major source of financing for city energy planning and implementation. These agencies, such as U.S. EPA, DOE, and HUD, provide funding to municipal entities to carry out sustainable energy projects that fulfill agency program objectives. Many millions of dollars are distributed each year in this manner, enabling communities to meet their sustainable energy planning needs, while furthering the overall missions of the funding agencies. The City and County of Denver, for example, have been awarded over $2.5 million in grants and contracts from the U.S. DOE and EPA. However, state and federal budgets can change dramatically, especially during challenging economic times, and this can lead to drastic reductions in available federal funding. Instead of relying exclusively on these sources of funding for their sustainable energy plans, municipalities will benefit by developing alternative financing mechanisms. Some examples of innovative financing approaches that are under development or in use by cities are described below.
Community Development Grants
The U.S. Department of Housing andUrban Development (HUD)administers the CommunityDevelopment Block Grant Program($4.5 billion/year) for larger citiesand metropolitan areas, and throughthe states for smaller cities. Eligibleactivities include preparation of“energy use strategies related to arecipient’s development goals, toassure that those goals are achievedwith maximum energy efficiency.”In the 1980’s, Portland, Oregonreceived substantial assistance fromHUD in developing its energy plan,which has since served as a modelfor other cities.
6.1.2 Budgets, Bonds and Buying in Bulk Most metropolitan projects are financed through city budgets and reflect a deliberate choice to pursue a given project for reasons that may not include economics. However, in many cases, these projects do have economic advantages, and city plans have reported payback periods in the 1.5 to 3 year timeframe for projects such as switching to LED lights. In Portland, the LED signal system retrofit was done with a lease option that required no initial capital outlay. In Seattle, the City owns and operates the electric, water, solid waste and stormwater utilities. Thus, any

energy savings reduce the city’s expenses. It is clear that many energy efficiency projects are cost-effective in the short term. Cities may develop innovative approaches of their own, relying on this cost effectiveness, as well as popular support for sustainable energy. One example of this is San Francisco’s renewable energy and energy efficiency bond initiative.
On November 6, 2001, San Francisco voters overwhelmingly approved a landmark $100 million bond initiative that pays for solar panels, energy efficiency, and wind turbines for public facilities. The measure pays for itself entirely from energy savings at no cost to taxpayers. With this model, San Francisco pioneered a path for funding the nation's transition to renewable energy. The mechanics are simple: the bond pays for solar panels, wind turbines, and energy efficiency measures for public buildings. The money that would have gone to buy electricity from power plants instead goes to pay down the bond. The measure passed by 73 percent. Implementation of the bond will be handled by the city's Public Utilities Commission and will be phased in over four years.
In issuing its landmark bond initiative, San Francisco
demonstrated how revenue bonds, bundling and bulk purchasing
could be used to achieve economic and environmental success. The
bond will be used to finance energy efficiency, wind, and solar power. Bundling these projects together
effectively lowers the costs of solar power, and the city-wide project
approach also allows solar panels to be purchased in bulk, yielding
additional cost savings.
San Francisco’s model shows how to make sustainable energy planning work, despite its high costs. For example, when San Francisco issued the original plan for the $100 million solar bond, $50 million was for solar projects, $30 million for wind projects, and $3 million for energy efficiency technologies (the remaining funds go for debt service and other costs). The energy efficiency projects have extremely short payback periods, and wind energy is already commercially viable. When these projects are bundled together, the costs for solar are effectively lowered. The San Francisco model has already attracted the attention of cities around the country because of its enormous popularity with voters and its obvious fiscal advantages.
The economics of many renewable or energy-efficient technologies suffer from large up-front capital costs. But these technologies do not have a fuel cost and thus produce power for free (except for operation and maintenance costs). Thus, while solar, wind, and energy efficiency products may be capital-intensive, their operating costs are often extremely low and thus the energy saved becomes the long-term means of repaying the project costs – making many sustainable energy projects cost-competitive with other energy sources. By bundling projects together, the overall cost becomes reasonable as the increased scale of production and installation reduces unit costs. Furthermore, buying in bulk reduces costs. In San Francisco's case, lowering costs through economies of scale and the promise of developing a local solar manufacturing base were practical arguments for thinking big. One option then for the financing of sustainable
61
On Cape Cod, Massachusetts, theCape Light Compact aggregated
electricity demand for the Barnstable County government and the entire community. This allowed Barnstable County to
purchase its power at a “bulk” rate, saving the county $750,000
over two years.
energy technologies is for local governments to coordinate with each other and pool their purchases, pushing costs down even further. In some parts of the country, small municipal governments have aggregated their energy demand when negotiating with utilities for their energy supply. Aggregating has given small communities additional influence as part of a larger entity, resulting in a better bargaining position for negotiating rates and additional services.
6.1.3 Utility Programs Utility demand-side management (DSM) programs encourage investment in energy efficiency by providing technical assistance and financial incentives to commercial buildings. Examples of the types of assistance offered include free or low-cost energy audits, program design, training programs, and educational materials. Financial incentives include equipment rebates, low cost equipment financing, real-time and time-of-use electricity rates. Historically, utilities have been the home of most energy efficiency programs. With the advent of electricity deregulation, many of these programs have been abandoned, but utilities still provide opportunities for effective financing of public energy projects. For example, in 2002, Portland, Oregon received more than $700,000 in utility rebates for LED traffic signal retrofits. This comes in addition to prior energy efficiency projects that received utility or state incentives. The Minnesota legislature requires all public utilities operating in Minnesota to invest a portion of their in-state revenues in programs to promote improved energy efficiency. Each utility designs a conservation plan and the Minnesota energy officials approve it.
Another mechanism cities may use to fund sustainable energy measures is the assessment of impact fees (often assessed on new construction) for improving transportation-related
infrastructure. These fees are assessed on new construction or development to
help mitigate the costs of the additional traffic and transportation demand created by new businesses,
and the funds can be directed toward public transit.
6.1.4 Contractual Mechanisms Cities can also avail themselves of contractual arrangements that mitigate the high initial capital outlay required for some energy efficiency improvements (for example, HVAC upgrades). In these contracts, municipalities generally pay for the equipment in installments from the energy savings that result with the new equipment.
The International Performance Measurement and Verification
Protocol (MVP) provides an overview of current best practice techniques
available for verifying results of energy efficiency, water efficiency, and
renewable energy projects in commercial and industrial facilities.
The MVP is maintained with the sponsorship of the U.S. Department of
Energy by a broad international coalition of facility owners/operators,
financiers, Energy Services Companies (ESCOs) and other stakeholders.
www.ipmvp.org
For example, under an energy service performance contract, many energy service companies (ESCOs) pay for and carry out energy efficiency measures in return for a share of the energy cost savings. The contract can cover specific measures, such as a lighting retrofit or HVAC system upgrade or a package of measures. The ESCO may retrofit existing equipment or purchase new equipment and provide operation and maintenance services. An energy service performance contract sets forth the process for establishing costs and cost savings, and for distributing the savings among the parties. The International Performance Measurement and
62
Verification Protocol is a useful guide for developing an energy services contract. Some ESCOs do not finance the energy equipment investment themselves but use "third party" (banks, private investors, or corporations) financing. These ESCOs only provide installation, maintenance, and other engineering services.
Equipment leasing is another way to reduce or avoid the high initial cost of new energy-efficient equipment. Energy savings and/or productivity increases from new equipment are often greater than the financing charges of the lease, and, from these savings, the lease costs are paid back. There are two basic types of leases: operating and financing. Operating leases are usually short-term, often month-to-month. At the end of the lease, the lessee either renews the lease, buys the equipment for its value, or acquires other equipment. The lessor accrues the tax benefits, but may pass some of them on to the lessee. A financing lease pays for equipment in installments. Although payments on a financing lease are usually higher than an operating lease, at the end of the lease the lessee may purchase the equipment for a nominal amount. In this type of lease, the lessee owns the equipment, and can take advantage of applicable tax credits and other benefits.
Chattanooga’s “TECH 2020” The mission of Technology 2020 isto leverage the unique technologyresources in East Tennessee toincubate new businesses, createprivate sector jobs, and improve theprospects for future economicgrowth. Members include –BellSouth, DOE, ARC, LockheedMartin, State of Tennessee, SAIC,Oracle, University of Tennessee,Motorola, U.S. Internet, Brooks,MCI WorldCom, Bechtel Jacobs,CROET, and UT-Battelle. TECH 2020’s major activities are – • Technology Business Alliance • Business Incubation Programs • Venture Capital and Loan Funds• Technology Commercialization
with ORNL • Digital Crossing
telecommunications infrastructure
6.1.5 Promoting Private Investment Tax incentives and government support are good means to fund projects, but a critical part of future metropolitan energy planning will be to obtain private investment. Such private-public partnerships can fund many projects. In these cases, private organizations will partner with public bodies to jointly develop a project. In many cases, the private organization will represent a specific technology and will seek to gain public attention or leverage public benefits (such as tax breaks or incentives) in return for private investment or discounted projects.
In Portland, Oregon, the City is in final contract negotiations with Climate Trust, a non-profit organization that helps fund global warming mitigation activities. When complete, the contract will pay Portland for the carbon emissions avoided by optimizing the traffic signal timing on major arterials.
63

6.2 Government Financing Opportunities – State and Federal
Many financing tools have been developed to encourage energy efficiency and renewable energy development, ranging from tax incentives, such as tax credits for renewable power generation, to low interest revolving loan funds (loans that can be repaid with savings from efficiency measures) to revenue bond measures. Often these tax incentives are enacted to make the sustainable energy product more attractive to potential consumers or more economic to developers. Most of these tax credits and financial incentives are available to business owners rather than municipalities, and, as such, do not offer cities a direct way to finance their sustainable energy plans. Cities can, however, include them in their body of information regarding available opportunities to encourage private sector development of clean energy, which ultimately benefit municipalities. In addition, these available grants and incentives may provide the necessary motivation for municipal governments to leverage private-public investments with local businesses.
The Chicago Museum of Science and Industry &
Building Cooling Heating and Power (BCHP): A Multi-Level
Public/Private Partnership
Gas Technology Institute’sDistributed Energy ResourcesCenter, in partnership with theChicago Museum of Science andIndustry (MSI), the U.S. Departmentof Energy, the City of Chicago, theState of Illinois Department ofCommerce and Community Affairs,and leading corporations, Cummins,Inc. and Munters, have developedand are demonstrating an advancedhybrid BCHP system for the MSI.The system incorporatescogeneration and desiccantsubsystems. It uses advancedcontrols that integrate BCHPtechnologies and demand-sidemanagement with building energyrequirements and the electrical gridto significantly decrease peak powerdemand.
This BCHP system will prevent theannual release of over 3,000 tons ofemissions, (including CO2, NOx,particulate matter (PM-10), and SO2)by offsetting use of peak coal-firedpower plant generation. Furtherenvironmental benefits includeimproved indoor air quality andbuilding comfort for the Museum. Inaddition, thermal recovery from thesystem will reduce annual MSI boileremissions. The MSI BCHP Systemwill cleanly and efficiently generate7.1 Million kWh per year, andrecover 14.5 Billion Btus of thermalenergy.
6.2.1 State Incentives Many states offer one or more financial incentives for investment in commercial and industrial applications of renewable energy technologies. These incentives include income tax credits, property tax exemptions, state sales tax exemptions, loan programs, special grant programs, industry recruitment incentives, accelerated depreciation allowances, as well as project development grants. Many states have project support funds that are the result of revenues from “system benefits charges” assessed on electric utilities. Many of these funds are being used to support state renewable portfolio standards.
A number of U.S. states have recently established clean energy funds to accelerate the commercialization of renewable energy and energy efficiency. The 15 states that have established these funds to date expect to collect $3.5 billion between 1998 and 2012 for renewable energy investments. The funds emphasize practical, local solutions to clean energy market barriers. Some successes from these funds include a wind power financing program that has made Pennsylvania a wind power center in the East. Massachusetts has embarked on an aggressive green buildings program. Wisconsin has undertaken tough evaluation standards for its renewable energy programs. The Minnesota legislature has exempted energy-efficient residential products from sales tax. Discussions are currently underway to expand the Minnesota sales tax exemption to Energy Star products. A number of states also have photovoltaic programs that are steadily expanding the market for solar generation. In Oregon, the City of Portland takes
64

65
advantage of two financial programs offered by the State – the State Energy Loan Program and the Business Energy Tax Credit. In addition to using these programs for city projects, Portland has helped others take advantage of them, too.
6.2.2 Federal Incentives As mentioned above, federal financial incentives for renewable energy or energy efficiency development primarily target business owners or individuals, rather than communities. However, these incentives can offer an advantage to cities when they undertake public-private partnerships. The federal incentives might help businesses decide to participate in the public sustainable energy effort.
Federal Solar/Geothermal Investment Tax Credit: Up to 10 percent of the investment or purchase and installation amount of qualifying energy property can be claimed by a business when filing annual tax returns. Qualifying energy property includes equipment that uses solar or geothermal energy to generate electricity, to heat or cool (or provide hot water for use in) a structure, or to provide process heat.
Federal Modified Accelerated Cost Recovery System: The Modified Accelerated Cost Recovery System (MACRS) allows businesses to recover investments in solar, wind, and geothermal property through accelerated depreciation deductions. The MACRS establishes a set of class lives for depreciating various types of property, ranging from three to 50 years.
Federal Tax Exemption for Nontaxable Energy Grants or Subsidized Energy Financing: Energy grants and subsidized energy financing received by a business from federal, state, or local government entities may be exempt from federal taxation. Such grants and financing must be for the principal purpose of conserving or producing energy.
Renewable Electricity Production Credit (REPC) and the Renewable Energy Production Incentive (REPI): Private entities subject to taxation (corporations, small businesses, and individuals) that generate electricity from wind and "closed-loop" biomass facilities and sell this electricity to an unrelated party, are eligible to receive a production credit (REPC). Non-taxpaying entities can apply for an incentive payment (REPI) from the U.S. DOE, for electricity produced and sold by new qualifying renewable energy generation facilities.
While communities face many financing challenges as they implement their sustainable energy plans, especially during difficult economic periods, implementing these plans can bring significant economic benefits to the community. Integrating
The Database of State Incentives for Renewable Energy (DSIRE)
Since 1995, the Database of StateIncentives for Renewable Energy(DSIRE) has served as the nation's mostcomprehensive source of informationon the status of programs and incentivesfor renewable energy. It is available onthe Web at www.dsireusa.org.Consumers, government leaders,business entrepreneurs, and others relyon DSIRE to educate themselves on thearray of renewable energy programsavailable locally and across the UniStates.
The Interstate Renewable EnergyCouncil and North Carolina SolarCenter developed and administerDSIRE, which lists all incentives forrenewable energy by state and type, andcontains the source of applicable s
ted
tatestatutes and forms when available.
Oregon’s Energy Loan ProgramOregon’s State Energy Loan Programoffers low-interest loans to individuals,businesses, schools, cities, counties,special districts, state and federalagencies, public corporations,cooperatives, tribes, and non-profits forprojects that: • Save energy • Produce energy from renewable
resources such as water, wind, geothermal, solar, biomass, waste materials, or waste heat
• Use recycled materials to create products
• Use alternative fuels
•
•
• •
•
Additional Federal Incentives Deductions for clean-fuel vehicles and refueling property The Job Creation and Worker Assistance Act of 2002 allows businesses to take an additional 30 percent depreciation on solar, wind, and geothermal property in the first year. Alcohol fuel credit Wind Energy Production Tax Credit (PTC) Energy-Efficient and Energy Star financing and mortgages

As part of the rationale for financing sustainable energy measures,
communities that implement such measures should quantify the economic
development impacts of their sustainable energy plans, in addition to the environmental and social impacts.
community economic development with sustainable energy planning can ensure that plans are developed with both economic and environmental concerns in mind. This, after all, is what sustainability is all about. In the long run, sustainable energy will confer economic benefits in addition to the more obvious environmental and public health advantages.
66

This Page Left Intentionally Blank
67

7.0 COMMUNITY IMPLEMENTATION
7.1 Introduction A community sustainable energy plan provides a structure within which a municipality can define its goals for energy sustainability - such as efficiency, economy, and emissions reduction - and the programmatic means of achieving them. This guide has described the rationale for and rudiments of the sustainable energy planning process, and it has provided detailed descriptions of tested tools and programs that have produced results in cities across the nation. Taking the next step, implementing a sustainable energy plan, requires the translation of plan goals and strategies into actionable programs and projects within the community. As is true with the development of a sustainable energy plan, implementation will benefit from the cooperation and participation of many stakeholders and resource entities both within and outside of the community. This section identifies important municipal stakeholders and their possible roles in taking the Blueprint off the shelf for community implementation.
Institutionalizing the Sustainable Energy Plan
The sustainable energy planningeffort may be housed in any of anumber of functional departmentswithin a municipality. Some of thedepartments that are well-suited totaking ownership of this functioninclude: economic development,sustainability, energy, environment,planning, buildings, and naturalresources. Furthermore,responsibility may be jointly held byseveral offices or departments withsynergistic or complementaryrelationships.
7.2 Community Organizations
7.2.1 Governmental/Municipal We begin our discussion of key community stakeholders with the organization that will coordinate and champion the sustainable energy planning effort. In most cases, this will be a municipal department or agency. Assigning the planning effort to an official, municipal organizational will lend credence and substance to the plan and promote its success.
Military Installations Military installations occupy theirown special status in a community.While part of a federal governmentorganization, these facilities areintimately connected to their localcommunity, even as they retain muchindependence from municipaljurisdiction. As large employers andenergy users, however, militarybases and other installations can playa major role in ensuring the successof a community sustainable energyplan. Recruiting the involvement ofkey military officials will contributeto the success and visibility of theplan, while providing manyopportunities for energy efficiencyimprovements and deployment ofnew energy technologies.
In addition to the department(s) leading the planning effort, the involvement of the Chief Executive Office, the legislative body or council, and, where applicable, the municipally owned utilities is fundamentally necessary for success. The involvement of the Mayor or City Manager should be framed in a leadership role that results in the engagement and commitment of departments across the municipal government. The City Council or other governing bodies should also function as leaders in this process by establishing budget priorities and allocating funds that will support the sustainable energy plan. The role of the municipal utilities is discussed separately below.
7.2.2 Private and Corporate Interests The private sector is important in implementing and assuring the success of a community sustainable energy plan. Major corporations and industries are both employers and energy users, and they can adopt sustainable energy practices on a voluntary basis in their own operations. This can have significant energy and economic impacts, as well as enabling the companies to play a
community leadership role through example. Banks and private investors are critical community institutions who will play an important role in financing sustainable energy measures. Their approach to innovative ventures will be instrumental in the success of sustainable energy plans. For example, financial institutions can promote (or, conversely, discourage) energy-efficient building development and home improvements through their lending practices. Their willingness to support renewable energy developments, which often have high initial capital costs but low long-term operation and maintenance costs, can also be instrumental in implementing a sustainable energy plan. Private developers also are significant because of the tremendous impact they can have on the community landscape and the energy profiles of their new developments. Private developers who are engaged in the implementation of a community energy plan will be more likely to incorporate the elements of energy sustainability into their designs from the beginning.
7.2.3 Nongovernmental Organizations and Institutions Finally, the involvement of nongovernmental organizations (NGOs) is also important to the success of sustainable energy planning efforts. Some examples of community NGOs include business associations (chambers of commerce), civic organizations (i.e.: the Rotary Club), consumer groups, environmental organizations, and educational institutions. The role of community NGOs is to represent a particular viewpoint in the planning process, in order to ensure that their interests (for example, consumer, environmental, or business perspectives) are adequately considered. They may also provide subject-specific expertise based on their vantage point, such as an evaluation of the consumer impacts of a given energy planning measure. Area universities and colleges can provide subject area expertise as well as develop public education programs to create awareness and understanding of the sustainable energy plan. As research institutions, universities could also be important to the development of innovative policies and technologies to support the community sustainable energy plan. Even elementary and secondary schools can play a role in developing and disseminating public awareness and education programs.
7.2.4 Citizens In addition to their role in corporate, nongovernmental, and governmental organizations, residents have an important function in supporting the development and implementation of sustainable energy plans for their communities. Individual actions in favor of sustainability can have a significant impact on awareness, and can help build public support for renewable energy and energy efficiency. For example, in rural areas of the Upper Midwest,
69

farmers’ support for wind power has been a key factor in the development of this renewable resource.
7.2.5 Utilities Energy utilities are important participants in the development and implementation of a sustainable energy plan. Utilities may be gas, electric, or a combination of the two. They may also be municipally owned utilities (which also often supply water services) or investor owned utilities (IOUs). The possible implementation roles for these utilities depend on their type and the services they provide.
Investor owned utilities An investor owned utility (IOU) is most typically the provider of a single service – be it water, power, or natural gas – to a relatively large geographical area that may encompass more than one municipality. Close collaboration with the IOU can yield benefits as the community develops energy efficiency and clean energy programs. As providers of energy services, utilities may offer rebates or incentives for energy efficiency improvements. They may also offer considerable expertise in the effective design of energy efficiency or demand-side management programs. Additionally, municipalities seeking to alter the sources from which their electricity is generated will need to cooperate with their power provider to develop programs that will promote renewable sources of electricity.
Municipally owned utilities Municipally owned utilities (also known as “munis”) can offer the same assistance discussed above for IOUs, but they also have additional roles to play, because of their status within the community. Municipally owned utilities include distribution companies that purchase natural gas and electricity for resale to the community. Rather than operating as independent corporations responsible primarily to their stockholders, munis are part of the structure of city government and usually report directly to the Mayor, City Council, or a governing board comprised of local elected officials and citizens. The municipal utility is in business to provide value to the local ratepayers. This can result in overall goals that consider community benefits more broadly than a simple evaluation of the bottom line economics. Representatives of the publicly owned utility may also be prominent in the community, especially in small communities, because of their critical role as provider of an essential service. This high visibility gives the muni an opportunity to step beyond its primary function of energy provider to play a critical part in community planning. As an agency of the city, they can be integrally linked to other departments in the development and implementation of a
70

sustainable energy plan. It is important to note that this integration does not always happen as a matter of course, regardless of how logical integration may seem. Instead, individual municipal departments often work independently of one other, rather than collaborating. However, as a member of the community, munis are invested in the overall well-being and sustainability of that community, and integrating their expertise into municipal planning functions can benefit the whole community.
7.3 State, Regional, and Federal Entities
While local organizations and governmental entities are the most important stakeholders in a community sustainable energy planning and implementation process, there are a host of other organizations that may play a role in the development and implementation of the plan. These agencies may be found at the regional, state, national, or even international level, and while their direct involvement in the community sustainable energy plan may be less than that of local organizations, they still may make significant contributions. In the governmental sector, state energy offices, environmental protection agencies, and departments of natural resources offices can serve an important function, as could county or state permitting agencies. Federal agencies, such as the U.S. Department of Energy, Environmental Protection Agency, Department of Housing and Urban Development, Department of Transportation, and their state or regional offices may also be involved. These organizations may offer technical or program development assistance, networking capabilities, grants, or other financial incentives for various elements of a community sustainable energy plan. National Laboratories (e.g. Argonne National Laboratory, the National Renewable Energy Laboratory and Oak Ridge National Laboratory, among many others) are affiliated with federal agencies and offer extensive research capabilities on a wide array of issues.
Regional or national nongovernmental organizations may also help communities develop and implement their sustainable energy plans. Organizations such as the Smart Growth Network, or the International Council on Local Environmental Initiatives (ICLEI) offer technical expertise and resources on a host of issues that communities tackle in sustainable energy planning. In addition, the California Energy Commission, New York State Energy Research and Development Authority and the Tennessee Valley Authority are regional energy research and development organizations with extensive technical expertise and experience in energy technologies.
71

This Page Left Intentionally Blank
72

8.0 SUSTAINABLE ENERGY PLANNING FOR SMALLER COMMUNITIES
8.1 Introduction This guide has focused primarily on the nation’s large metropolitan areas where the bulk of energy is consumed, resulting in a host of energy-related challenges. Traffic congestion, pollution, electricity system failures, urban sprawl, and deterioration of community quality of life are some of the issues prompting these metropolitan communities to invest in sustainability. While these issues are particularly pressing for the nation’s largest cities, where large concentrations of population exacerbate these concerns, small and medium sized cities also have reasons to promote sustainability. The myriad examples from large metropolitan areas illustrate relevant clean energy programs and policies that can be transferred to small or medium-sized cities, given visionary leadership, local information, and an effective approach. In essence, the same principles that motivate and define effective sustainable energy planning in large metropolitan areas apply equally well in small to medium sized communities (communities with populations under 100,000). The differences between implementing sustainable energy plans in different sizes of communities are largely a matter of scale, rather than substance. Nonetheless, a few critical differences affect smaller communities and their ability to develop and implement sustainable energy plans. This chapter explores these differences, their implications, and resources available to smaller communities to assist them in sustainable energy planning.
Think Globally, Act Locally Sustainable energy deployed at thelocal level has benefits that reachbeyond local economic gains. Infact, small communities deployingsustainable energy plans can beleaders in the global effort to combatenergy-related pollution andunsustainable consumption.Furthermore, this opportunity forleadership is enhanced by the factthat, for many small and mediumsized communities, the problems areon the horizon, but are not yetoverwhelming. Such communitiescan be proactive, rather than reactive,in their efforts to attainsustainability.
8.2 Small Community Issues
8.2.1 The Common Ground Small, medium, and large villages, towns, and cities alike must address questions of land use and design, energy transmission and distribution, and efficient transportation. Similarly, no matter what size the community, municipal officials have the same basic mandate to provide public services, protect public health and welfare, and promote economic development. Sustainable energy planning directly addresses questions of land use, energy use, and transportation, and it can also help communities effectively meet their municipal obligations.
Thus, all sizes of communities stand to benefit from energy planning that improves community economic, environmental, and social sustainability. While large metropolitan areas concentrate and exacerbate the problems of unsustainable energy practices, small communities also face significant challenges. In large cities, it is difficult to ignore the heavy toll exacted by polluting energy production and inefficient transportation systems. Smaller
73

communities may not yet be experiencing these problems to the same degree as large metropolitan areas, but unsustainable energy practices and planning have a negative impact in smaller communities, too. These negative impacts may result ultimately in the development of big-city problems in small and medium sized cities. Because these smaller communities generally do not yet experience the same scale of energy-related problems as large metropolitan areas, smaller communities have an opportunity now to take a leadership role in the pursuit of sustainability and act proactively to prevent such problems from developing.
8.2.2 Financial, Technical and Personnel Constraints While resource limitations are a concern for most cities and towns, small- and medium-sized communities are particularly challenged by these constraints. Budgets may be small, with little leeway for developing new projects or areas of focus. Furthermore, with significant financial constraints, most municipal efforts are focused on the day-to-day management of the community, with little left over for new initiatives. These resource limitations concern not only dollars, but also include staff members and technical expertise. In many communities under 100,000, a single staff member may have responsibility for a wide array of issues that larger cities might divide among multiple departments. Consistent with these constraints, technical expertise on the varied subject matter that is included in sustainable energy planning – buildings, transportation, waste management, to name a few – is unlikely to be available in every small community. Undertaking a task as complex and integrative as sustainable energy planning in a resource-limited environment requires creativity and cooperation.
Even communities that have no significant energy-related detriment to the local economy, public welfare, or environment, can realize economic gains by implementing simple energy efficiency measures. Reduced energy costs for local government make more money available for other municipal services. Reduced energy costs for businesses make more capital available for other investments. Reduced energy costs for a school can mean more money for textbooks or teachers. Reduced energy costs in a single residential home make more money available to spend on other items. All of these savings can lead to more funds circulating in the local economy. Thus, many sustainable energy planning measures may pay for themselves, and even return money to the community.
Saving Energy, Saving Money It is estimated that 70 to 80 centsout of every dollar spent on energyleaves a community. It stands toreason, then, that reducing energyuse frees up more dollars to spendon other community priorities.
The awareness and use of the wide array of regional and federal resources available for communities is important for successful community planning. These resources can compensate significantly for shortages of staffing and technical expertise, by
74

supplying guidance and information on a wide range of policies, programs, and issues pertaining to sustainable energy planning. Examples of agencies that can be of significant assistance to communities have been referenced throughout this document, and they include federal and state governmental agencies, non-profit associations, universities, and research and development organizations. A few of these are: the U.S. Department of Energy, U.S. Environmental Protection Agency, the U.S. Department of Housing and Urban Development, the International Council for Local Environmental Initiatives, and individual state energy offices.
8.2.3 Politics, Accountability, and the Public In small and medium sized communities, public officials are very visible and may hear frequently and directly from their constituents. This visibility can be both an asset and a challenge to sustainable land use planning and decision-making. With most decisions under scrutiny and many of them controversial or divisive, the process of making appropriate land use decisions can be challenging. Many such land use decisions will elicit complaints from someone, leaving elected officials with the task of responding to their constituents’ concerns, sometimes at the expense of disregarding or discounting their own planning staff’s recommendations. On the positive side, the visibility of local leaders in their community provides an opportunity for direct communication on issues of substance. A community leader who is committed to sustainability practices can, therefore, be an effective champion for this effort.
Joint Action Agencies In order to overcome some of thestaffing and resource limitations thatface communities with populationsless than 100,000, some municipalgas utilities join forces as membersof joint action agencies. Byaggregating their members, theseagencies can obtain additionalexpertise as well as economies ofscale in the marketplace. Theseagencies may include from three upto 100 members. There are 14 jointaction agencies in the U.S.
ManmeeestaEnvundnonreguimpsmanot samare andchaof tby con WhthesgridcertgensimThecitieconexpconatteplanmeereacprobarea
One approach offered for making and defending energy efficient land use decisions in small towns is committed lands analysis (Ford, 1990). In this approach, growth is directed toward vacant lands within government service areas, where water, sewer, road, and other services have already been extended, rather than permitting new growth at the periphery. Committed lands analysis essentially argues that future development should increase the efficiency of existing public works, and it considers this efficiency both in terms of the production of public services and the distribution of these services. While this analytical approach focuses on economics, it can be beneficial in a sustainable energy planning framework also, because its goal of efficiency will contribute to energy sustainability. Furthermore, the rationale for this approach may build public support for other related energy planning efforts.
Awareness of environmental issues and the impacts of energy production and consumption may be less in small communities, where these negative impacts have not reached the proportions
75
Not for Big Cities Only
y large metropolitan areas do nott ambient air quality standardsblished by the U.S.ironmental Protection Agencyer the Clean Air Act. Thisattainment status exertslatory pressure on these cities torove their air quality. In contrast,ll and medium cities generally dohave air quality problems of thee magnitude. Consequently, theynot under the same regulatory
economic pressures to undertakenge, and some may be less awarehe environmental concerns raised
energy production andsumption.
ile national headlines recorde problems and others, such aslock and power outages inain large metropolitan areas, theyerally ignore the development ofilar problems on a smaller scale. nation’s small and medium sizeds, once a haven from big city
gestion and sprawl, areeriencing some of the samecerns, without the mediantion. Sustainable energyning can help small communitiest these challenges before theyh the scale of energy-relatedlems seen in large metropolitans.
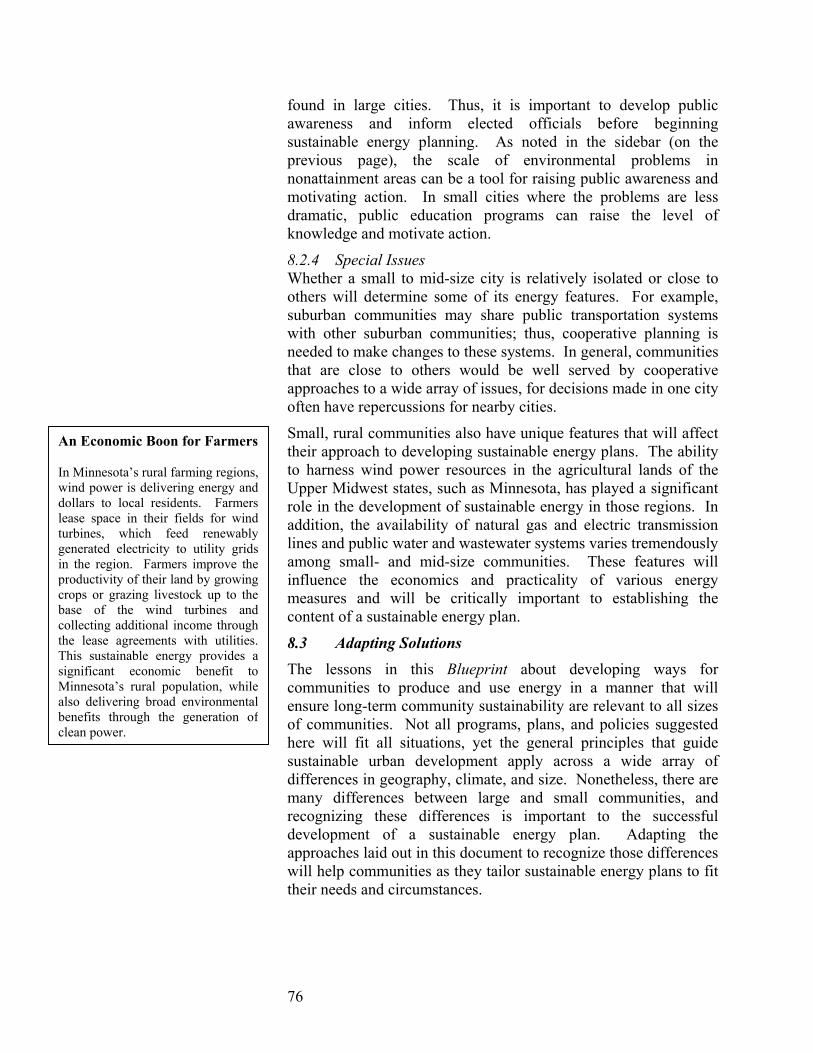
found in large cities. Thus, it is important to develop public awareness and inform elected officials before beginning sustainable energy planning. As noted in the sidebar (on the previous page), the scale of environmental problems in nonattainment areas can be a tool for raising public awareness and motivating action. In small cities where the problems are less dramatic, public education programs can raise the level of knowledge and motivate action.
8.2.4 Special Issues Whether a small to mid-size city is relatively isolated or close to others will determine some of its energy features. For example, suburban communities may share public transportation systems with other suburban communities; thus, cooperative planning is needed to make changes to these systems. In general, communities that are close to others would be well served by cooperative approaches to a wide array of issues, for decisions made in one city often have repercussions for nearby cities.
Small, rural communities also have unique features that will affect their approach to developing sustainable energy plans. The ability to harness wind power resources in the agricultural lands of the Upper Midwest states, such as Minnesota, has played a significant role in the development of sustainable energy in those regions. In addition, the availability of natural gas and electric transmission lines and public water and wastewater systems varies tremendously among small- and mid-size communities. These features will influence the economics and practicality of various energy measures and will be critically important to establishing the content of a sustainable energy plan.
8.3 Adapting Solutions The lessons in this Blueprint about developing ways for communities to produce and use energy in a manner that will ensure long-term community sustainability are relevant to all sizes of communities. Not all programs, plans, and policies suggested here will fit all situations, yet the general principles that guide
An Economic Boon for Farmers In Minnesota’s rural farming regions,wind power is delivering energy and dollars to local residents. Farmerslease space in their fields for windturbines, which feed renewablygenerated electricity to utility gridsin the region. Farmers improve theproductivity of their land by growingcrops or grazing livestock up to the base of the wind turbines andcollecting additional income throughthe lease agreements with utilities.This sustainable energy provides asignificant economic benefit toMinnesota’s rural population, whilealso delivering broad environmentalbenefits through the generation ofclean power.
sustainable urban development apply across a wide array of differences in geography, climate, and size. Nonetheless, there are many differences between large and small communities, and recognizing these differences is important to the successful development of a sustainable energy plan. Adapting the approaches laid out in this document to recognize those differences will help communities as they tailor sustainable energy plans to fit their needs and circumstances.
76
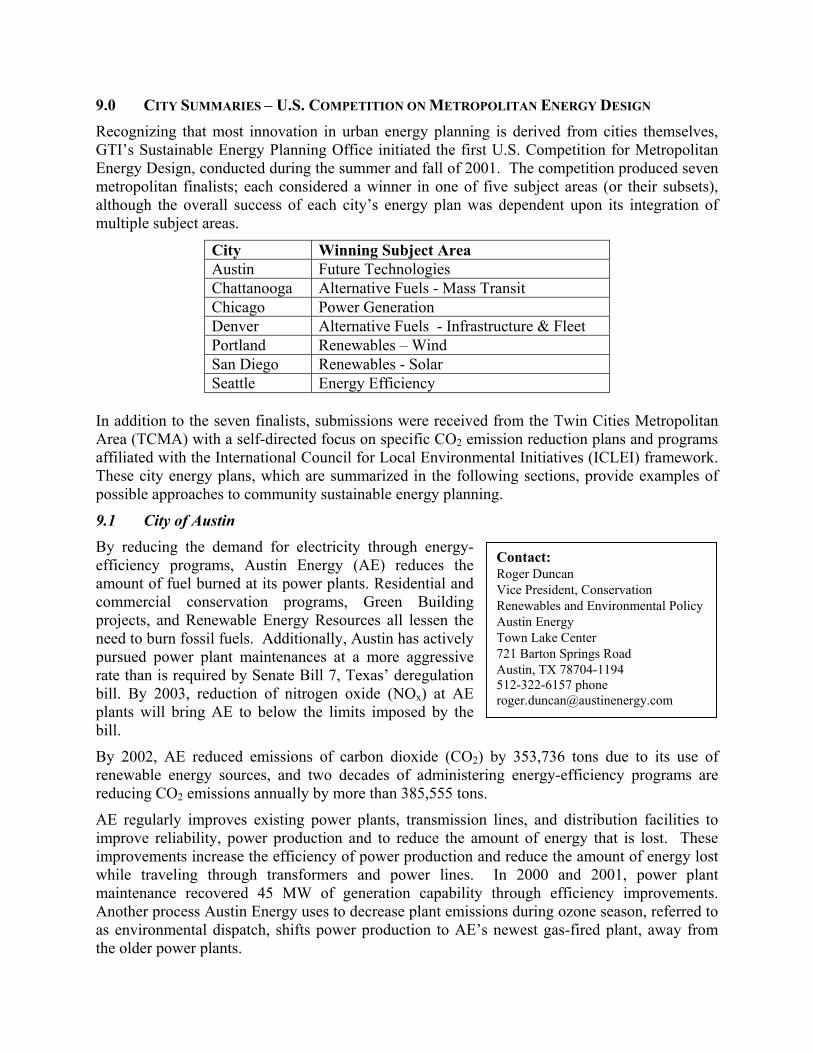
9.0 CITY SUMMARIES – U.S. COMPETITION ON METROPOLITAN ENERGY DESIGN
Recognizing that most innovation in urban energy planning is derived from cities themselves, GTI’s Sustainable Energy Planning Office initiated the first U.S. Competition for Metropolitan Energy Design, conducted during the summer and fall of 2001. The competition produced seven metropolitan finalists; each considered a winner in one of five subject areas (or their subsets), although the overall success of each city’s energy plan was dependent upon its integration of multiple subject areas.
City Winning Subject Area Austin Future Technologies Chattanooga Alternative Fuels - Mass Transit Chicago Power Generation Denver Alternative Fuels - Infrastructure & Fleet Portland Renewables – Wind San Diego Renewables - Solar Seattle Energy Efficiency
In addition to the seven finalists, submissions were received from the Twin Cities Metropolitan Area (TCMA) with a self-directed focus on specific CO2 emission reduction plans and programs affiliated with the International Council for Local Environmental Initiatives (ICLEI) framework. These city energy plans, which are summarized in the following sections, provide examples of possible approaches to community sustainable energy planning.
9.1 City of Austin By reducing the demand for electricity through energy-efficiency programs, Austin Energy (AE) reduces the amount of fuel burned at its power plants. Residential and commercial conservation programs, Green Building projects, and Renewable Energy Resources all lessen the need to burn fossil fuels. Additionally, Austin has actively pursued power plant maintenances at a more aggressive rate than is required by Senate Bill 7, Texas’ deregulation bill. By 2003, reduction of nitrogen oxide (NOx) at AE plants will bring AE to below the limits imposed by the bill.
Contact: Roger Duncan Vice President, Conservation Renewables and Environmental PolicyAustin Energy Town Lake Center 721 Barton Springs Road Austin, TX 78704-1194 512-322-6157 phone [email protected]
By 2002, AE reduced emissions of carbon dioxide (CO2) by 353,736 tons due to its use of renewable energy sources, and two decades of administering energy-efficiency programs are reducing CO2 emissions annually by more than 385,555 tons.
AE regularly improves existing power plants, transmission lines, and distribution facilities to improve reliability, power production and to reduce the amount of energy that is lost. These improvements increase the efficiency of power production and reduce the amount of energy lost while traveling through transformers and power lines. In 2000 and 2001, power plant maintenance recovered 45 MW of generation capability through efficiency improvements. Another process Austin Energy uses to decrease plant emissions during ozone season, referred to as environmental dispatch, shifts power production to AE’s newest gas-fired plant, away from the older power plants.

Future capital improvement plans include the installation of combined-cycle generation technology at AE’s newest gas-fired plant and a two-year maintenance program to reduce NOx emissions by 40 percent on all gas-fired units at two older power plants by May 2003. In addition, 180 MW of new peaking capacity, brought online in June 2001, was outfitted with pollution control equipment that superseded requirements, making these units some of the cleanest in the nation.
In addition to improvements of the central power generation, Austin is developing a centralized heating and cooling district and increasing renewable energy use in the total energy supply. Three percent of Austin’s energy supply is now renewable. With the addition of 25 MW of wind and 10 MW of landfill methane energy, Austin’s energy supply will soon become 5 percent renewable.
The ‘Domain’ is Austin’s location of a 16,000-ton chiller and a future co-generation power plant site. This chiller currently sends 8,000 tons of chilled water to downtown consumers with capacity to double it.
Finally, Austin is looking towards future technologies and has approved the purchase of a 200 kW fuel cell.
9.2 City of Chattanooga In 1969, Chattanooga was cited as having the worst air pollution of any city in the nation. Today, Chattanooga enjoys international recognition as one of the most livable cities in the world.
Contact: James Frierson Board Member, Director for Strategic Projects Advanced Transportation Technology Institute 515 East Brow Road Lookout Mtn., TN 37350 423-505-6888 phone [email protected]
This extraordinary transformation was made possible by the combined commitment, resources and efforts of public and private entities across a 3-state region and 10 counties. A forward-thinking air pollution control ordinance was enacted in 1969, and, by 1972, all major point sources within Hamilton County were in compliance. In 1984, an open invitation to the entire metropolitan community was issued to engage public involvement in a visionary, goal-setting process for a sustainable urban future. Extensive civic participation in this goal-setting process was the driving force behind the pioneering adoption of clean transportation approaches that have helped transform Chattanooga. Process and vision, not technology, were the critical elements.
This highly participatory planning process led to integrated energy and environmental initiatives that include: energy efficiency programs and clean power generation, innovative low-level streetscape lighting, and the Chattanooga Electric Power Board’s Energy Audit and Energy Right programs - designed to identify opportunities for energy efficiency improvements and to ensure energy reliability. In the area of renewable resources/energy diversity, the Tennessee Valley Authority (TVA), which has its operations headquarters in Chattanooga, has installed 11 solar photovoltaic sites, including a site at Chattanooga’s Finley Stadium, which is the largest thin film photovoltaic installation in the Southeastern U.S. Additionally, the TVA now offers a Green Power program providing consumer choice to support other forms of renewable resources such as wind, landfill gas, wood waste, and digester gas co-firing power generation facilities.
78

In power generation, TVA’s and Chattanooga’s efforts to improve environmental quality have led to a reduction in SO2 by 65 percent and a reduction in NOx by 33 percent through the addition of low NOx burners on 40 of the 59 TVA power generation units throughout the Tennessee Valley. TVA plans to and adds 18 selective catalytic reduction units by 2004. Chattanooga’s efforts have led to Chattanooga being cited by the National Association of Local Government Environmental Professionals as becoming “…a model of sustainable economic development and clean transportation…”
Today, Chattanooga is also a world leader in the development and use of alternative transportation technologies with its all-electric and hybrid buses. These transportation innovations have reduced emissions, stimulated tourism and retail sales and generated more than 100 jobs. The Chattanooga metropolitan region is building a sustainable future upon a solid foundation of diversified energy sources and environmentally conscious consumption practices.
9.3 City of Chicago Chicago’s Energy Plan is a practical strategy to ensure clean, affordable, and reliable energy for the city’s future. The Plan recognizes the central role energy plays in providing for public health and safety, encouraging equity and prosperity, and maintaining a high quality of life.
Contact: Steven Walter Dept. of Environment City of Chicago 30 N. LaSalle, 25th Floor Chicago, IL 60602 312-744-8901 312-744-6451 fax [email protected]
Chicago’s Energy Plan meets the demands of rapidly changing energy markets with clear principles and specific targets for action. Consumer protection, economic growth, and environmental protection are the underlying, mutually reinforcing principles of this plan.
The Plan’s action items, programs, and policies support these principles. Chicago’s Energy Plan addresses all aspects of the energy system, from production to delivery to consumption. It focuses both on fixing under-performing or outmoded parts of our energy systems and employing new, smart infrastructure and processes.
The Energy Plan lays out smart energy plans to meet growing demand for power. Energy demand in Chicago is expected to increase 20 percent from 2000 levels by 2010 to 27 billion kilowatt-hours. In response, Chicago created an Energy Plan that targets all of this new demand to be met by a combination of 28 percent energy management, 25 percent cogeneration, 22 percent distributed generation, and 25 percent renewables. This strategy expects to reduce air pollutants by 5,340,000 tons of CO2, 112,000 tons of NOx, and 215,000 tons of SO2 and to reduce energy losses due to inefficiency. Retrofits of 15 million square feet of government facilities are expected to reduce energy use by 30 percent. In addition, changes to building codes and education for architects are expected to add energy efficiency to the everyday operation of buildings. Traffic signals are also being changed to energy-efficient lighting that is expected to save the city $4.4 million and 10,640 tons of pollution a year. The city has also added 10 MW of natural-gas-fired distributed generation and extensive cogeneration capacity – including University Illinois at Chicago, McCormick Place, and Goose Island Brewery. Together, distributed generation and cogeneration are expected to provide 2.8 billion kWh a year by 2010. Renewables are expected to produce 1.5 billion kWh a year by 2010. The city is already looking at collecting waste gases from landfill and septic systems as well as installing solar panels and
79

contracting for wind power. The city has entered into contract with its utility, ComEd, to supply 20 percent (or 40 MW) of the city’s power with green power within 5 years.
The Energy Plan also calls for better transmission efficiency by Commonwealth Edison as well as upgrades of existing coal-fired power plants to further reduce pollution and inefficiency while retaining low-cost coal-fired power. Cleaning up the grandfathered coal plants in Illinois would reduce regional emissions by 215,000 tons of SO2 and 112,000 tons of NOx annually.
Chicago has also addressed transportation-based issues in its Energy Plan by calling for cleaner gasoline and more streamlined federal clean gasoline policies. In terms of alternative fuel vehicles, the City of Chicago remains the lead in the Chicago Area Clean Cities Coalition to promote AFV. Already, 2500 alternative fuel vehicles are operating in the Chicago region. This AFV push is supported by the expansion of the natural gas refueling stations in the Chicago region.
9.4 City of Denver
Contact: Steven J. Foute. PhD. Deputy Manager, Department of Environmental Health City and County of Denver 201 W. Colfax Avenue, Level 10 Denver, CO 80202 720-865-5365 phone 720-865-5531 fax [email protected]
The City and County of Denver was the second city to join the U.S. Department of Energy Clean Cities program, which promotes use of alternative fueled vehicles. Denver was also one of twelve cities to participate in the International Council for Local Environmental Initiatives’ (ICLEI) Urban CO2 Reduction Project. Denver’s energy plans are far-reaching and have included planning in energy efficiency, renewables, transportation, and global warming prevention and have led to awards from the U.S. Department of Energy, EPA’s Green Lights Government, LEED building achievement, Rebuild America, and others.
Denver is addressing the need for a more sustainable energy future through the following:
• A district energy system that will produce chilled water and steam heat for 15 city facilities of over 5 million square feet.
• Energy efficiency policies set for city facilities – switching off machines/lights, reduction of personal plug appliances, etc.
• Replace incandescent traffic signals with LED lights – 55,000 signals have been swapped. In addition, lighting is being upgraded in over 14 million square feet of city buildings.
• Two of the first Energy Star Building Labels were awarded to Denver buildings. • Green power offering where power users can pay a premium of 2.5c per kWh for wind-based
green power. Denver already has over 60 MW of wind power available, enough for about 18,000 homes.
• Alternative fuels for transportation became a focus of Denver with the introduction of Hythane – a blend of hydrogen and natural gas. In addition, the city is augmenting its fleet with hybrid vehicles.
As noted above, Denver has long been an active participant in many of the federal and state initiatives focused on developing cleaner cities and better energy planning. Other actions taken by the city of Denver include a light rail system, adding solar PV to buildings, and reducing resident commuting times.
80
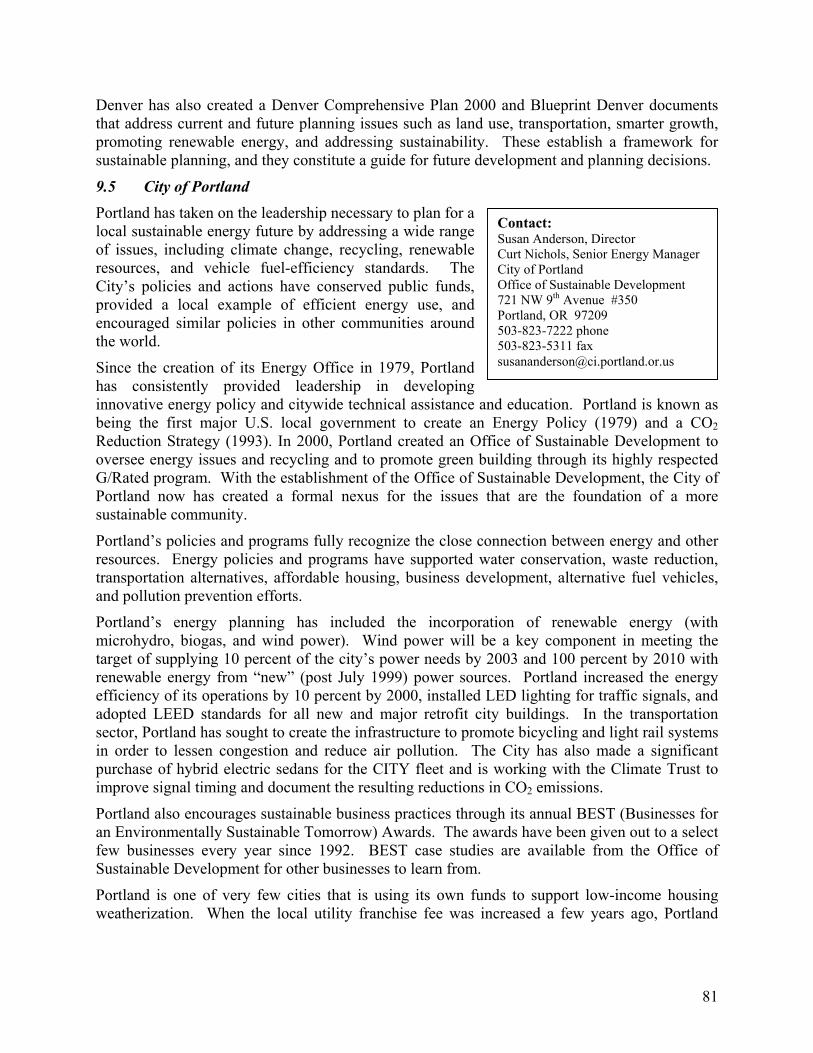
Denver has also created a Denver Comprehensive Plan 2000 and Blueprint Denver documents that address current and future planning issues such as land use, transportation, smarter growth, promoting renewable energy, and addressing sustainability. These establish a framework for sustainable planning, and they constitute a guide for future development and planning decisions.
9.5 City of Portland Portland has taken on the leadership necessary to plan for a local sustainable energy future by addressing a wide range of issues, including climate change, recycling, renewable resources, and vehicle fuel-efficiency standards. The City’s policies and actions have conserved public funds, provided a local example of efficient energy use, and encouraged similar policies in other communities around the world.
Contact: Susan Anderson, Director Curt Nichols, Senior Energy Manager City of Portland Office of Sustainable Development 721 NW 9th Avenue #350 Portland, OR 97209 503-823-7222 phone 503-823-5311 fax [email protected] Since the creation of its Energy Office in 1979, Portland
has consistently provided leadership in developing innovative energy policy and citywide technical assistance and education. Portland is known as being the first major U.S. local government to create an Energy Policy (1979) and a CO2 Reduction Strategy (1993). In 2000, Portland created an Office of Sustainable Development to oversee energy issues and recycling and to promote green building through its highly respected G/Rated program. With the establishment of the Office of Sustainable Development, the City of Portland now has created a formal nexus for the issues that are the foundation of a more sustainable community.
Portland’s policies and programs fully recognize the close connection between energy and other resources. Energy policies and programs have supported water conservation, waste reduction, transportation alternatives, affordable housing, business development, alternative fuel vehicles, and pollution prevention efforts.
Portland’s energy planning has included the incorporation of renewable energy (with microhydro, biogas, and wind power). Wind power will be a key component in meeting the target of supplying 10 percent of the city’s power needs by 2003 and 100 percent by 2010 with renewable energy from “new” (post July 1999) power sources. Portland increased the energy efficiency of its operations by 10 percent by 2000, installed LED lighting for traffic signals, and adopted LEED standards for all new and major retrofit city buildings. In the transportation sector, Portland has sought to create the infrastructure to promote bicycling and light rail systems in order to lessen congestion and reduce air pollution. The City has also made a significant purchase of hybrid electric sedans for the CITY fleet and is working with the Climate Trust to improve signal timing and document the resulting reductions in CO2 emissions.
Portland also encourages sustainable business practices through its annual BEST (Businesses for an Environmentally Sustainable Tomorrow) Awards. The awards have been given out to a select few businesses every year since 1992. BEST case studies are available from the Office of Sustainable Development for other businesses to learn from.
Portland is one of very few cities that is using its own funds to support low-income housing weatherization. When the local utility franchise fee was increased a few years ago, Portland
81
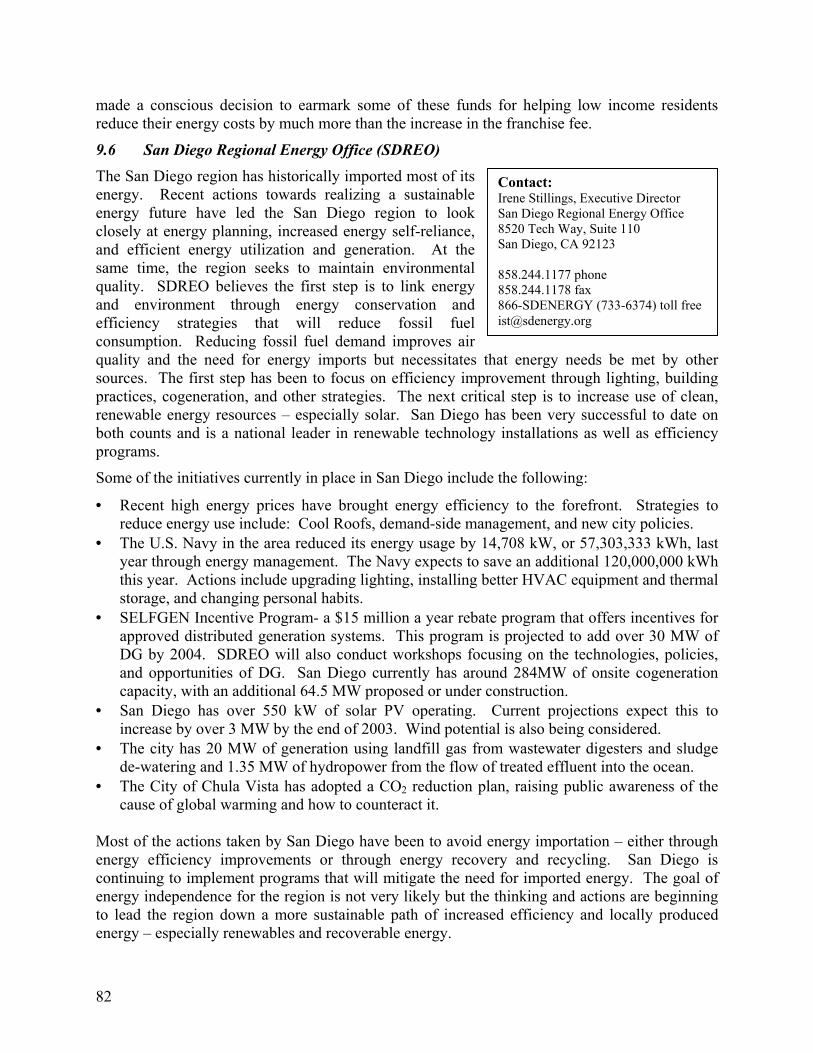
made a conscious decision to earmark some of these funds for helping low income residents reduce their energy costs by much more than the increase in the franchise fee.
9.6 San Diego Regional Energy Office (SDREO)
Contact: Irene Stillings, Executive Director San Diego Regional Energy Office 8520 Tech Way, Suite 110 San Diego, CA 92123 858.244.1177 phone 858.244.1178 fax 866-SDENERGY (733-6374) toll free [email protected]
The San Diego region has historically imported most of its energy. Recent actions towards realizing a sustainable energy future have led the San Diego region to look closely at energy planning, increased energy self-reliance, and efficient energy utilization and generation. At the same time, the region seeks to maintain environmental quality. SDREO believes the first step is to link energy and environment through energy conservation and efficiency strategies that will reduce fossil fuel consumption. Reducing fossil fuel demand improves air quality and the need for energy imports but necessitates that energy needs be met by other sources. The first step has been to focus on efficiency improvement through lighting, building practices, cogeneration, and other strategies. The next critical step is to increase use of clean, renewable energy resources – especially solar. San Diego has been very successful to date on both counts and is a national leader in renewable technology installations as well as efficiency programs.
Some of the initiatives currently in place in San Diego include the following:
• Recent high energy prices have brought energy efficiency to the forefront. Strategies to reduce energy use include: Cool Roofs, demand-side management, and new city policies.
• The U.S. Navy in the area reduced its energy usage by 14,708 kW, or 57,303,333 kWh, last year through energy management. The Navy expects to save an additional 120,000,000 kWh this year. Actions include upgrading lighting, installing better HVAC equipment and thermal storage, and changing personal habits.
• SELFGEN Incentive Program- a $15 million a year rebate program that offers incentives for approved distributed generation systems. This program is projected to add over 30 MW of DG by 2004. SDREO will also conduct workshops focusing on the technologies, policies, and opportunities of DG. San Diego currently has around 284MW of onsite cogeneration capacity, with an additional 64.5 MW proposed or under construction.
• San Diego has over 550 kW of solar PV operating. Current projections expect this to increase by over 3 MW by the end of 2003. Wind potential is also being considered.
• The city has 20 MW of generation using landfill gas from wastewater digesters and sludge de-watering and 1.35 MW of hydropower from the flow of treated effluent into the ocean.
• The City of Chula Vista has adopted a CO2 reduction plan, raising public awareness of the cause of global warming and how to counteract it.
Most of the actions taken by San Diego have been to avoid energy importation – either through energy efficiency improvements or through energy recovery and recycling. San Diego is continuing to implement programs that will mitigate the need for imported energy. The goal of energy independence for the region is not very likely but the thinking and actions are beginning to lead the region down a more sustainable path of increased efficiency and locally produced energy – especially renewables and recoverable energy.
82

9.7 City of Seattle
Seattle has a long and rich history of environmentally responsible and sustainable approaches to energy production and use. The city’s success is due primarily to its elected leaders providing the policy direction and financial support for programs and services that value not only economic considerations but also social and environmental benefits. In addition, the city owns and operates its own electric, water, solid waste, and storm water utilities. It is a community that has, time and again, demonstrated its preference for environmentally sustainable plans and decisions.
Contact: Kim Drury City of Seattle Office of Sustainability and Environment700 5th Ave. Suite 2748 Seattle, WA 98104 206-684-3214 phone 206-684-3013 fax [email protected]
By providing models of sustainable energy programs that can be replicated in other communities, the benefits of Seattle’s approach extend well beyond those that the city and its citizens realize.
Seattle’s ownership of the power utility, Seattle City Light, has led to seeking the least-cost options in meeting energy needs, and this has resulted in a continued push for increased energy efficiency. In essence, Seattle meets much of its new power needs through energy conservation measures that decrease demand for electricity. Energy conservation is realized by a combination of proven strategies including rate structures that encourage end-users to conserve, a strict energy code for new construction, financial assistance to help pay for cost-effective conservation measures, technical and design assistance on new technologies, and public education and outreach on how and why to conserve energy, both at home and at work. Much of the conservation has been done by end-users, often in the residential sector.
Specific actions include creating price signals whereby the first 400 kWh a customer uses is very inexpensive, but the cost of additional usage drastically increases. To keep energy demand low, public outreach and conservation strategies have included reducing heat loss from water heaters, using water more efficiently, working with building codes, home energy inspection kits, and financial assistance for energy efficiency upgrades. In 1999, the City adopted a citywide Environmental Management Program that establishes the framework for constantly improving the City’s environmental performance and ensures that the City incorporates the concepts of sustainability into its plans and actions.
In 2000, the city established the Office of Environment and Sustainability to help ensure the viability of the city’s goals. Thus, while much remains to be done, and, without a doubt, unexpected challenges will arise, the critical elements are in place to continue Seattle’s record as a national leader in urban sustainability. One of the actions taken towards a more sustainable Seattle includes contracting for 50 MW (expected to increase to 175 by August 2004) of installed wind power from the State Line Wind Generating Plant. Additional actions include adding natural gas vehicles to the city fleet as well as using bio-diesel.
83

9.8 Twin Cities Metropolitan Area (Minneapolis & St. Paul)
Twin Cities Energy Conservation & CO2 Reduction Strategies: CO2 is the principal constituent gas contributing to global warming and the focus of the international effort to address the problem through the Kyoto Protocol. In 1993, the city of Saint Paul established one of the nation’s first metropolitan initiatives specifically designed to reduce the city’s contribution to greenhouse gas production and global warming. The ongoing initiative is the Environmental-Economic Partnership Project (E-EPP). The E-EEP has developed an overall energy conservation and CO2 reduction strategy and an implementation plan with six areas of focus:
Contact: Rick Person City of St. Paul Department of Public Works 25 W. 4th Street. 800 City Hall Annex St. Paul, MN 55102 651-266-6122 phone 651-298-4559 fax [email protected]
• Municipal Action Plan – energy efficiency initiatives targeted at all public facilities, operations, and services.
• Diversification of the Cities Transportation Sector - initiatives designed to promote energy-efficient use of the existing transportation infrastructure, promotion of public transit and bicycle usage, and light rail transit planning.
• Urban Reforestation – citywide tree planting and landscaping to increase green shade cover, reduce building cooling costs, and absorb CO2 emissions.
• Energy Efficiency – cost-effective efficiency measures such as lighting, air handling, and insulation in residential, commercial, and industrial sectors.
• Energy Supply – promoting the use of alternative energy sources such as solar, wind, biomass, and hydrogen.
• Recycling and Waste Prevention –programs focused on reducing the use of resources through material reuse and recycling and the reduction of material purchases.
Together, these initiatives reduced CO2 emissions in the metropolitan area by more than 460,000 tons in 2001 and reduced costs by $41,000,000.
84

9.9 City Participation in Sustainable Energy Programs
This table summarizes the programs underway in each finalist city. Participation ranges from having a well-established programs to exploring the area in question. Austin Chattanooga Chicago Denver Mpls/St Paul Portland San Diego Seattle Combined cycle power Plants
X
Distributed generation
X X X X X
Combined heat and power (CHP)
X X X X X
District Heating and Cooling
X X X X
Conversion of coal and oil power plants to natural gas
X X X X
Green building programs
X X X X X X X
Building standards/ codes
X X X X X X X
EE city lighting programs
X X X X X X X
Demand-side management programs
X X X X X
Energy audits X X X X X X X X CO2 reduction programs
X X X X
Weatherization/ EE programs for homeowners
X X X X X
Financial incentives for EE
X X X X
Wind X X X X X X Solar X X X X X X Hydro X X X X X X Landfill gas X X X X X X X Biopower X X X X X Financial incentives for renewable energy
X State
Light rail X X X Alternative fuel vehicles
X X X X X X X X
AFV fleets X X X X X AFV fueling stations
X X X X
Alternative fuel programs
X X X X X
Financial incentives for AFVs
X State
85
10.0 APPENDICES
10.1 Sustainable Energy Planning Framework and Methodology
Overview Sustainable Energy Planning is designed to incorporate a community’s strategically aligned energy and environmental goals and objectives into a comprehensive metropolitan planning process. It is fully intended to influence all aspects of future community development decision-making, public and private, and must be considered a necessary prerequisite to community sustainability. The sustainable energy plans and programs developed through this process must, in order to be effective in the long run, be incorporated into communities’ overall comprehensive or general plans, which guide all decision-making at the community level.
This appendix provides an overview of one possible sustainable energy planning process. First, we discuss the necessary preconditions for sustainable planning, or any planning for that matter, to be successful. Next, we describe the overall process and the outputs from the seven planning phases. We conclude with a more detailed description of the work involved in each of the seven phases and some important considerations to be aware of while pursuing them. The process described below is all-encompassing and “ideal,” and it is intended as a guide for communities considering comprehensive, rational planning initiatives. However, single components of the planning framework can be used or reconfigured with other components to customize the overall approach to address any community’s planning needs.
Preconditions for Planning In order for any strategic planning initiative to garner the commitment and resources necessary to move a community towards sustainability, certain fundamental preconditions must exist. Each of these preconditions is highlighted below.
Leadership – Perhaps the single most important factor in a successful planning initiative is a fully committed “Champion” or leader. Ideally, this should be one of the community’s top elected government officials or a prominent civic leader. This individual must enjoy the respect of her/his narrower community (i.e. their own business or social circle) and possess the skills and abilities necessary to communicate the essential relevance of sustainability to the larger community. Additionally, this person must possess the capability to build bridges between communities and to persuade them to understand that they all share a common future. The energy champion may be a staff person in facilities, public works, or maintenance who has "hands on" experience for building upgrades and has identified the need to provide energy retrofits. Strong leadership is vital to the planning process to overcome inertia in the system that maintains the status quo and concerns about loss of control by some department heads, which can have a significant detrimental impact on the sustainable energy planning process.
Participation –There must be broad-based community participation. All-inclusive community participation is not required during every phase or at every step in the strategic planning process. Rather, participation is necessary at pivotal points where an expression of a community’s full range of interest is necessary to define the boundaries within which consensus is possible.
All members of a community are energy users, and, therefore, all must ultimately play a role in the success of the community’s effort to achieve sustainability. From a practical perspective, however, this will entail the targeted participation of discrete community interest and advocacy groups; commercial business and industry organizations; and academic, institutional, and
86

87
Interdepartmental Cooperation – An Example from Dayton
terdepartmental cooperation is a key element for success intainable energy planning. The City of Dayton, Ohio had already
made considerable progress in energy efficiency and conservationprograms within individual departments when it developedecommendations to facilitate more inter-departmental cooperation n energy issues. The city proposed that a unified city program of
energy conservation and alternative energy sources woulddemonstrate the viability of these programs to the public,ncouraging private sector conservation and support for alternative
energy sources.
hieve the necessary cooperation, a centralized Office of ency (OEE), was recommended as a means to
improve communication and coordination. The OEE, as theprincipal point of contact, will set budget objectives and provideincentives to the departments for energy reduction and costs. Departments to be included ranged from Economic Development,Aviation, and Building Services to Finance, Planning, and PublicWorks, as well as many others. The recommendations also
ecified the inclusion of two private citizens and the Assistant ity Manager. Ultimately, it was envisioned that this group would
be represented in the regional energy policy planning processes,ressing aggregation opportunities, climate change, greenlding, alternative vehicle fuels, and various other environmental
issues, such as carbon trading. In addition, a regional approach foran energy emergency support function in case of power
terruption by foreseen and unforeseen occurrences was
ficiencies that can be gained through cooperation and coordination.
anticipated.
his approach illustrates the ef
Insus
ro
e
governmental entities. Obtaining information from these specific groups can be done through surveys, focus groups, and interviews. Additionally, community hearings for the general public should be incorporated at strategic points during the consensus building process, and ultimately referenda should be held to adopt the community’s sustainability agenda.
To acEnergy Effici
spC
addbui
in
T
Consensus – The ultimate objective of broad community participation in any planning process is the generation of consensus. Arriving at consensus is an art form in a diverse community, particularly for objectives that have been historically viewed as mutually exclusive (e.g.: economic development versus environmental quality). Fortunately, the concept and localized practice of sustainable development proves that these two community objectives can and should be mutually supportive.
The generation of consensus at the beginning of a strategic planning process should focus on what a community wants to achieve, not on how it is to be accomplished. Premature focus on methods (means before ends) is the single greatest error made in consensus building. Once general agreement is reached on where a community wants to be in the future, getting there is a matter of collective and creative choice. There are a variety of structured group processes that can help communities define areas of maximum agreement, isolate disagreements, and use creative problem-solving techniques to overcome the disagreements. These processes and techniques are readily available and should be identified and used at the outset of the planning process.
Investments – Consensus is particularly important for this requirement, as both public and private investments are essential for a sustainable metropolitan energy plan to be implemented. Large capital expenditures for clean energy generation technologies, transmission and distribution system modifications, emission control systems, etc. will all entail significant public investments and therefore public support. In addition, private entities will also be required to make similar investments in technology to contribute to the community’s sustainability goals and objectives. One approach to investments in sustainable energy projects is to start small. Pilot
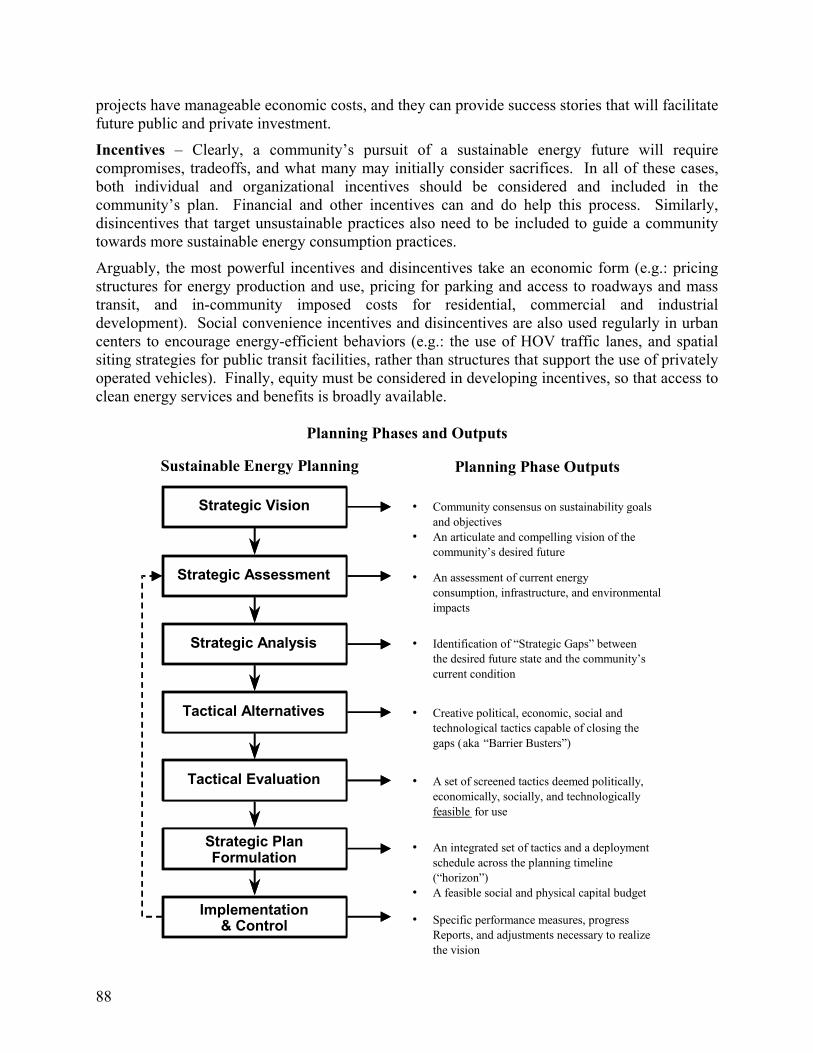
projects have manageable economic costs, and they can provide success stories that will facilitate future public and private investment.
Incentives – Clearly, a community’s pursuit of a sustainable energy future will require compromises, tradeoffs, and what many may initially consider sacrifices. In all of these cases, both individual and organizational incentives should be considered and included in the community’s plan. Financial and other incentives can and do help this process. Similarly, disincentives that target unsustainable practices also need to be included to guide a community towards more sustainable energy consumption practices.
Arguably, the most powerful incentives and disincentives take an economic form (e.g.: pricing structures for energy production and use, pricing for parking and access to roadways and mass transit, and in-community imposed costs for residential, commercial and industrial development). Social convenience incentives and disincentives are also used regularly in urban centers to encourage energy-efficient behaviors (e.g.: the use of HOV traffic lanes, and spatial siting strategies for public transit facilities, rather than structures that support the use of privately operated vehicles). Finally, equity must be considered in developing incentives, so that access to clean energy services and benefits is broadly available.
Planning Phases and Outputs
Strategic Vision
Strategic Assessment
Strategic Analysis
Tactical Alternatives
Tactical Evaluation
Strategic Plan Formulation
Implementation & Control
Planning Phase Outputs
• Community consensus on sustainability goals & objectives
• An articulate & compelling vision of the Community’s desired future
• An assessment of current energy consumption, infrastructure & environmental impacts
• Identification of “Strategic Gaps” between the desired future state & the Community’s current condition
• Creative set of political, economic, social and technological tactics capable of closing the gaps (aka “Barrier Busters”)
• A set of screened tactics deemed politically, economically, socially & technologically feasible for use
• An integrated set of tactics and a deployment schedule across the planning timeline (“horizon”)
• A feasible social and physical capital budget
• Specific performance measures, progress reports and adjustments necessary to realize the vision
Sustainable Energy Planning
Strategic Vision
Strategic Assessment
Strategic Analysis
Tactical Alternatives
Tactical Evaluation
Strategic Plan Formulation
Implementation & Control
Planning Phase Outputs
• Community consensus on sustainability goals and objectives
• An articulate and compelling vision of the community’s desired future
• An assessment of current energy consumption, infrastructure, and environmental impacts
• Identification of “Strategic Gaps” between the desired future state and the community’s current condition
• Creative political, economic, social and technological tactics capable of closing the gaps (aka “Barrier Busters”)
• A set of screened tactics deemed politically, economically, socially, and technologically feasible for use
• An integrated set of tactics and a deployment schedule across the planning timeline (“horizon”)
• A feasible social and physical capital budget
• Specific performance measures, progress Reports, and adjustments necessary to realize the vision
Sustainable Energy Planning
88
Description of the Seven Planning Phases Strategic Vision – The principal outputs of this first phase include community consensus on sustainability goals and objectives and a compelling vision of the desired future. The first step in creating a strategic vision is the identification of stakeholders who must conceptualize it. As noted above, this will entail an inventory of all organizational and individual energy consumers across all sectors of energy use markets – agricultural, commercial, industrial, residential, institutional, and transportation. Each of these user groups should then be further defined by distinct subgroups or “segments” that share characteristics that are largely exclusive of those held by any other subgroup. The inventory should then identify all relevant representative organizations for major segments within each segment of energy users and additional special interest groups that represent cross-segment and market concerns.
The second step of this phase involves the creation of a “straw sustainability statement” or definition of the concept as it relates to the community. This statement should be derived from a paragraph that describes how the community would appear and operate if a balance existed between its means of economic development and its environmental quality goals and objectives. This straw statement and “picture” is then used for review and comment by each stakeholder group prior to a series of face-to-face meetings featuring a structured group process to develop a consensus statement.
The process should result in the definition of a set of discrete goals that relate to each element of the vision described. Each of these goals/ends should, in turn, be further defined by a set of supporting objectives, or conditions necessary for the goal to be achieved. Note: the means of reaching these ends are not part of this vision statement, but are addressed in subsequent planning phases.
The vision statement must also feature a temporal dimension that identifies the timeframe within which this sustainable future is meant to be achieved. This period of time then constitutes the “planning horizon” for the sustainable energy plan. In regard to energy infrastructure, a planning horizon of 30 years is typical, given the serviceable life of capital equipment, although 10 to 20 years may be more appropriate for some types of equipment. Once established, the community’s sustainability statement should be circulated for broader public comment, input, revision, and adoption as a municipal policy statement to guide not only the rest of the planning process, but the future operations of the community’s public services and general governance.
Strategic Assessment – The second phase of the planning process produces an assessment of the current energy consumption rates, the technological infrastructure that accommodates it and the resultant impact on the natural environment. It begins with a baseline assessment of the community’s current energy consumption (diesel, electricity, gasoline, heating oil, natural gas, propane, and renewables) by market sector (as discussed above) and the technologies currently employed to meet the demand [power generation facilities and the transmission and distribution (T&D) infrastructure].
Strategic assessment entails a quantitative and qualitative inventory of all related waste streams produced by the energy production, transmission, and distribution processes within the community. These waste streams should include all air emissions, water effluents, underground well injections, and solid waste disposal activities. Additionally, known or suspected impacts on sensitive environmental resources and habitats (e.g. wetlands, estuaries, forest lands, flyways,
89

green space, and farmland) should also be assessed. An impact of significant concern in urban areas is the development of urban heat islands. Together, the energy and environmental assessments constitute a profile of the community’s current level of sustainability.
Strategic Analysis – The third phase in the planning process identifies strategic gaps between the community’s desired future state and its current condition, as defined in the previous phase. This analysis begins with the development of future population and economic development projections across the community’s planning horizon/period (typically carried out by metropolitan planning organizations). Projections are usually run for 2-3 scenarios of growth, each based on differing assumptions drawn from the specific composition and character of the community’s economic base and regional and national growth trends. These projections are then used to predict the additional energy demand required to accommodate the growth and the related waste streams and environmental impacts that would result.
Next, the analysis involves a systematic look at the political, economic, social, and technological conditions that have resulted in the community’s current sustainability profile. In the political arena, this entails an analysis of all existing metropolitan policies, comprehensive plans, utility infrastructure and transportation plans, and zoning and building codes and ordinances that manage growth and development. In the economic arena, this entails a look at the pricing structure for energy and its use across all sectors, as well as the relative costs of its externalities. Additionally, an analysis of the current market structure and drivers is necessary to complete the economic picture.
In the social arena, all intended or unintended public policies that provide incentives or disincentives for citizens that result in sub-optimal sustainability should be analyzed. Additionally, an analysis of the current state of public awareness and concern about sustainability should be conducted through some type of survey. In the technology arena, the analysis should consider the efficiency of currently deployed energy generation and use technologies relative to available state-of-the-art technologies. Efficiencies of currently deployed transportation infrastructure and technologies must also be considered, along with associated management practices. A similar capacity and performance analysis must be conducted on all deployed environmental quality control technologies and management practices.
The strategic analysis concludes with a summary report that identifies specific political, economic, social and technological problems, issues, and barriers (or so-called PESTs) that have resulted in the community’s current condition. This report should also attempt to depict, in both quantitative and qualitative terms, the size of the strategic gap that exists between the community’s vision of a sustainable future and its present condition. Clearly, this analysis in its most comprehensive form is a large, time-consuming task. Tackling smaller increments of the analysis may be a more realistic start for some communities and can also yield useful information.
Tactical Alternatives – The fourth phase of the process produces a creative set of potential solutions to the specific PESTs identified in the strategic analysis. A wide variety of structured and unstructured group processes are available (at least 200) to produce creative solutions and specific tactics, from simple nominal group techniques and surveys to more sophisticated consensus-building methods.
90

With respect to energy and environmental systems technologies, expert advice should be sought to ensure that the community fully understands and avails itself of the latest thinking on the subject, particularly as these fields are rapidly changing due to the deregulation of energy and increased regulation of new pollutants and sources. The U.S. Department of Energy’s Office of Energy Efficiency and Renewable Energy, and the U.S. Environmental Protection Agency’s Office of Environmental Information can provide assistance to those interested in learning more about current and emerging technologies.
Tactical Evaluation – The fifth phase produces a set of screened tactics deemed politically, economically, socially, and technologically feasible for potential use. Essentially, this phase entails evaluating each solution and the associated set of tactics by pre-established parameters for community acceptance and, in terms of the energy and environmental technologies, minimum performance standards necessary to accommodate projected growth and waste streams. This phase is a critical time for solidifying understanding and possibly consensus, among members of the core planning team.
Additionally, budgetary and temporal considerations are introduced during this evaluation to group the alternatives and tactics according to the potential cost and time necessary to develop and deploy them. The evaluation is conducted in stages of progressively more stringent parameters and standards for each projected growth scenario. The result is a robust set of feasible solutions and tactics rated for use under alternative future conditions and community size.
Strategic Plan Formulation – The sixth phase produces integrated policies, programs, budgets, and deployment schedules needed to move the community towards its sustainability goals and objectives over the established planning horizon. This is an important phase in which to reintroduce structured public participation, in order to consider necessary tradeoffs between, and priorities for, the content and timing of program elements. A particularly useful tool for community decision making in this regard, can be multi-attribute utility modeling and analysis. Although a complicated label, the technique enables the community to establish preferences across a diverse set of program alternatives with varying outputs, and to develop a final set of priorities that accurately represents the collective public interest.
IMPORTANT NOTE: An essential aspect of any new formulation initiative must be the integration or "linkage" of new planning elements to other relevant existing or emergent planning elements and plans within the community, particularly those that entail human and capital resources necessary for implementation. This imperative is all the more important in sustainable energy planning, as energy resources cross-cut and impact most elements of a community's general and capital improvement plans, including: transportation, land use, housing, economic development, public infrastructure projects, etc. Additionally, plans that focus on emergency preparedness, natural hazards reduction/mitigation, and public facilities security, must also be linked to a community's sustainable energy planning initiative, especially because of heightened concerns about security.
Possible Metrics Metrics provide a means for assessingprogress and for prioritizing and selectingstrategies and tactics. Metrics could include: • Emissions per capita per year • Energy consumption per capita per year • Btus consumed per Btu energy output • Program $ per annual Btu conserved • Program $ per renewable Btu
91
Effective linkages forged between plans that share interdependent elements not only maximize resources but also strengthen the integrity of each plan.
The Chicago Implementation Plan: An Example In 2001, Chicago Mayor Richard M. Daley released a visionaryEnergy Plan outlining a strategy to use distributed generation,cogeneration (or CHP), renewables, and energy management tomeet future growth in electricity demand.
In 2002, Chicago’s Department of the Environment took the nextlogical step and initiated an implementation plan. The processundertaken illustrates many of the principles discussed in thisframework for planning, and it demonstrates the efficacy of thisapproach. A group of experts and stakeholders was convened todiscuss opportunities, strategies and programs for implementing thedistributed generation and CHP goals of the Chicago Energy Plan.First, the group identified opportunities for installing distributedgeneration and CHP systems in Chicago, and then it selected themost promising, which included city hospitals, schools, office andresidential buildings, and industrial parks. Next, group participantsdiscussed strategies and programs that would facilitate theimplementation of distributed generation and CHP systems. Again,an extensive list was developed, followed by prioritization of themost promising strategies. These included improved financingmechanisms, regulatory changes, and educational outreach
Finally, the experts developed “mini work plans” for strategies andtargets of particular value. These work plans are the basis for thenext steps that Chicago will undertake to implement its visionaryEnergy Plan. One step already underway is an educationalworkshop geared to hospital administrators. The activities inChicago help illustrate how a structured framework for planningand consensus building can form the basis for meeting visionarygoals for sustainability.
Implementation and Control – The seventh phase of the process produces specific performance measures, methodologies, and reporting systems to manage resources as programs are deployed, and to monitor their effectiveness in moving the community towards its goals and objectives. This is a critically important phase in the overall process, as it ensures that the community’s plan for sustainability is a relevant, “living” document. More specifically, it enables the ongoing evaluation of the tactical approaches to sustainability, and allows for both major mid-course corrections and minor program element adjustments. This is also the phase where ancillary components of the sustainability initiative, which help ensure its ultimate success, can be developed. The single most important component is an inspiring community education campaign to compel ongoing support, good will, and participation in the long-term effort.
92

10.2 Summary of State Net Metering Programs This Table was last updated on 6/3/03
State Allowable Technology
and Size
Allowable Customer
Statewide Limit
Treatment of Net Excess
Generation (NEG)
Authority Enacted Scope of Program Citation/Reference
Arizona Renewables and cogeneration ≤100 kW
All customer classes
None NEG purchased at avoided cost
Arizona Corporation Commission
1981 All IOUs and RECs PUC Order Decision 52345, Docket 81-045
Arkansas Renewables, fuel cells and microturbines ≤25 kW residential ≤100 kW commercial
All customer classes
None Monthly NEG granted to utilities
Legislature 2001 All utilities HB 2325, effective Oct. 2001; PSC Order No. 3 July 3, 2002
California Solar and wind ≤1000 kW
All customer classes
0.5% of utilities peak demand
Annual NEG granted to utilities
Legislature 2002; 2001; 1995
All utilities Public Utilities Codes Sec. 2827 (amended 09/02; 04/01; effective 9/98)
Colorado Wind and PV 3 kW, 10 kW
Varies NA Varies Utility tariffs 1997 Four Colorado utilities PSCO Advice Letter 1265; PUC Decision C96-901 [1]
Connecticut Renewables and fuel cells ≤100 kW
Residential None Not specified Legislature 1990,updated 1998
All IOUs, No REC in state.
CGS 16-243H; Public Act 98-28
Delaware Renewables ≤25 kW
All customer classes
None Not specified Legislature 1999 All utilities Senate Amendment No. 1 to HB 10
Georgia Solar, wind, fuel cells ≤10 kW residential ≤100 kW commercial
Residential and commercial
0.2% of annual peak demand
Monthly NEG or total generation purchased at avoided cost or higher rate if green priced
Legislature 2001 All utilities SB93
Hawaii Solar, wind, biomass, hydro ≤10 kW
Residential and small commercial
0.5% of annual peak demand
Monthly NEG granted to utilities
Legislature 2001 All utilities HB 173
Idaho All technologies ≤100 kW
Residential and small commercial (Idaho Power only)
None Monthly NEG purchased at avoided cost
Public Utility Commission
1980 IOUs only, RECs are not rate-regulated
Idaho PUC Order #16025 and #26750 (1997) Tariff sheets 86-1 thru 86-7
Illinois Solar and wind ≤40 kW
All customer classes; ComEd only
0.1% of annual peak demand
NEG purchased at avoided cost
ComEd tariff 2000 Commonwealth Edison Special billing experiment [1]
Indiana Renewables and All customer None Monthly NEG granted to Public Utility 1985 IOUs only, Indiana Administrative
93

State Allowable Technology
Allowable Customer
Statewide Limit
Treatment of Net Excess
Authority Enacted Scope of Program Citation/Reference
and Size Generation (NEG) cogeneration ≤1,000 kWh/month
classes utilities Commission RECs are not rate-regulated
Code 4-4.1-7
Iowa Renewables and cogeneration (No limit per system)
All customer classes
105 MW Monthly NEG purchased at avoided cost
Iowa Utility Board
1993 IOUs only, RECs are not rate-regulated[2]
Iowa Administrative Code [199] Chapter 15.11(5)
Maine Renewables and fuel cells ≤100 kW
All customer classes
None Annual NEG granted to utilities
Public Utility Commission
1998 All utilities Order # 98-621 RC of ME Chapter 36
Maryland Solar only ≤80 kW
Residential and schools only
0.2% of 1998 peak
Monthly NEG granted to utilities
Legislature 1997 All utilities Article 78, Section 54M
Massachusetts Qualifying facilities ≤60 kW
All customer classes
None Monthly NEG purchased at avoided cost
Legislature 1997 All utilities Mass. Gen. L. ch. 164, §1G(g); Dept. of Tel. and Energy 97-111
Minnesota Qualifying facilities ≤40 kW
All customer classes
None NEG purchased at utility average retail energy rate
Legislature 1983 All utilities Minn. Stat. §216B.164
Montana Solar, wind and hydro ≤50 kW
All customer classes
None Annual NEG granted to utilities at the end of each calendar year.
Legislature 1999 IOUs only SB 409
Nevada Solar and Wind ≤10 kW
All customer classes
None Monthly or annual NEG granted to utilities
Legislature 2001; 1997
All utilities Nevada Revised Statute Ch. 704; amended AB661 (2001)
New Hampshire
Solar, wind and hydro ≤25 kW
All customers classes
0.05% of utility's annual peak
NEG credited to next month
Legislature 1998 All utilities RSA 362-A:2 (HB 485)
New Jersey PV and wind ≤100 kW
Residential and small commercial
0.1% of peak or $2M annual financial impact
Annualized NEG purchased at avoided cost
Legislature 1999 All utilities AB 16. Electric Discount and Energy Competition Act
New Mexico Renewables and cogeneration
All customer classes
None NEG credited to next month, or monthly NEG purchased at avoided cost (utility choice)
Public Utility Commission
1999 All utilities NMPUC Rule 571,
New York Solar only residential ≤10 kW; Farm biogas systems <400 kW
Residential; farm systems
0.1% 1996 peak demand
Annualized NEG purchased at avoided cost
Legislature 2002; 1997
All utilities Laws of New York, 1997, Chapter 399; amended SB 6592 (2002)
North Dakota Renewables and cogeneration ≤100 kW
All customer classes
None Monthly NEG purchased at avoided cost
Public Utility Commission
1991 IOUs only, RECs are not rate-regulated
North Dakota Admin. Code §69-09-07-09
94
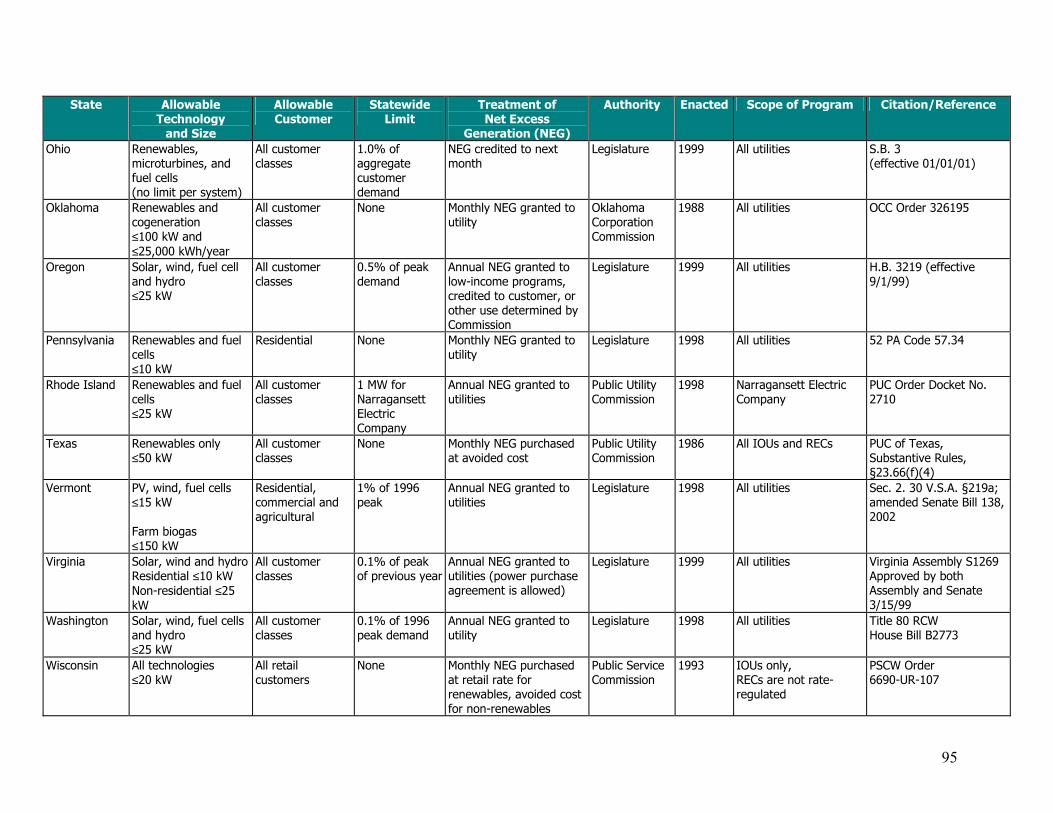
State Allowable Technology
Allowable Customer
Statewide Limit
Treatment of Net Excess
Authority Enacted Scope of Program Citation/Reference
and Size Generation (NEG) Ohio Renewables,
microturbines, and fuel cells (no limit per system)
All customer classes
1.0% of aggregate customer demand
NEG credited to next month
Legislature 1999 All utilities S.B. 3 (effective 01/01/01)
Oklahoma Renewables and cogeneration ≤100 kW and ≤25,000 kWh/year
All customer classes
None Monthly NEG granted to utility
Oklahoma Corporation Commission
1988 All utilities OCC Order 326195
Oregon Solar, wind, fuel cell and hydro ≤25 kW
All customer classes
0.5% of peak demand
Annual NEG granted to low-income programs, credited to customer, or other use determined by Commission
Legislature 1999 All utilities H.B. 3219 (effective 9/1/99)
Pennsylvania Renewables and fuel cells ≤10 kW
Residential None Monthly NEG granted to utility
Legislature 1998 All utilities 52 PA Code 57.34
Rhode Island Renewables and fuel cells ≤25 kW
All customer classes
1 MW for Narragansett Electric Company
Annual NEG granted to utilities
Public Utility Commission
1998 Narragansett Electric Company
PUC Order Docket No. 2710
Texas Renewables only ≤50 kW
All customer classes
None Monthly NEG purchased at avoided cost
Public Utility Commission
1986 All IOUs and RECs PUC of Texas, Substantive Rules, §23.66(f)(4)
Vermont PV, wind, fuel cells ≤15 kW Farm biogas ≤150 kW
Residential, commercial and agricultural
1% of 1996 peak
Annual NEG granted to utilities
Legislature 1998 All utilities Sec. 2. 30 V.S.A. §219a; amended Senate Bill 138, 2002
Virginia Solar, wind and hydro Residential ≤10 kW Non-residential ≤25 kW
All customer classes
0.1% of peak of previous year
Annual NEG granted to utilities (power purchase agreement is allowed)
Legislature 1999 All utilities Virginia Assembly S1269 Approved by both Assembly and Senate 3/15/99
Washington Solar, wind, fuel cells and hydro ≤25 kW
All customer classes
0.1% of 1996 peak demand
Annual NEG granted to utility
Legislature 1998 All utilities Title 80 RCW House Bill B2773
Wisconsin All technologies ≤20 kW
All retail customers
None Monthly NEG purchased at retail rate for renewables, avoided cost for non-renewables
Public Service Commission
1993 IOUs only, RECs are not rate-regulated
PSCW Order 6690-UR-107
95

State Allowable Technology
Allowable Customer
Statewide Limit
Treatment of Net Excess
Authority Enacted Scope of Program Citation/Reference
and Size Generation (NEG) Wyoming Solar, wind and hydro
≤ 25 kW All customer classes
None Annual NEG purchased at avoided cost
Legislature 2001 All IOUs and RECs
HB 195, Feb. 2001
Notes:
IOU — Investor-owned utility GandT — Generation and transmission cooperatives REC — Rural electric cooperative [1] For information, see the Database of State Incentives for Renewable Energy (http://www.dcs.ncsu.edu/solar/dsire/dsire.cfm). [2] Except for the Linn County Electric Cooperative, which is rate-regulated by Iowa PUC. The original format for this table is taken from: Thomas J. Starrs (September 1996). Net Metering: New Opportunities for Home Power. Renewable Energy Policy Project, Issue Brief, No. 2. College Park, MD: University of Maryland
Table downloaded from the U.S. Department of Energy, Office of Energy Efficiency and Renewable Energy’s Green Power Network
96

11.0 REFERENCES
“1996 Cost of Downtime Study” by Contingency Planning Research. “A Planner’s Guide to Sustainable Development,” American Planning Association, Planning Advisory Service Report Number 467, December 1996. “AFV Table”, U.S. Department of Energy, Office of Energy Efficiency and Renewable Energy, Energy Information Administration, Office of Coal, Nuclear, Electric, and Alternate Fuels. “American Public Transit Association” Website, www.apta.com, September 2002 America’s Global Warming Solutions, Bernow, Stephen, Karlynn Cory, William Dougherty, Max Duckworth, Sivan Kathra, and Michael Ruth, 1999. Tellus Institute, Boston, MA. “An International Framework for Local Action,” Cities for Climate Protection Campaign, ICLEI Case Study # 84, May 2002. “Annual Energy Outlook – 2002”, Energy Information Administration, December 2001 “Attorneys General from 11 states urge President Bush to Act on Global Warming”, Washington Update, July 15-19, 2002. “Best Practices for Climate Protection – A Local Government Guide,” ICLEI “Beyond Gas Taxes: Linking Driving Fees to Externalities”, by Mark M. Glickman, Ph.D., Redefining Progress, March 2001 “Bio-gas Utilization” PowerPoint presentation at Energizing Americas Cities, Jerry Leone, J&L Consulting, Chicago, September 2002 “Building a 21st Century Transportation System”, National Governors Association Center for Best Practices, Natural Resources Policy Studies Division, Backgrounder, July 2002 “Case Studies of State Support for Renewable Energy” Berkeley Lab and the Clean Energy Group, Lew Milford, Clean Energy Group Ryan Wiser and Mark Bolinger, Berkeley Lab, September 2002 “Chicago Energy Plan” by City of Chicago Department of Environment, 2001. Cities for Climate Protection Campaign Website, www.iclei.org/co2/index.htm, December 2002 Clean Air Markets. US Environmental Protection Agency. http://cfpub.epa.gov/gdm/ Clean Energy Blueprint. Union of Concerned Scientists. October 2001. “Clearing the Air With Transit Spending: Sierra Club Grades America’s Fifty Largest Cities”, Sierra Club, November 2002. Climate Change Science; National Research Council; May, 2001. “Commercializing Alternative Fuels and Advanced Vehicle Technologies: The Government’s Role”, Environmental and Energy Study Institute, May 2002 Community Energy Workbook: A Guide to Building a Sustainable Economy, Hubbard, Alice, and Clay Fong, 1995. Rocky Mountain Institute, Snowmass, CO. Cooling, Heating, and Power for Buildings. http://www.bchp.org “Database of State Incentives for Renewable Energy,” DSIRE website, www.dsireusa.org DG Monitor, Resource Dynamics Corporation, DG Application Series: DG Fueled with Waste Gases, August/September 2001 “Distributed Energy: The Power Paradigm for the New Millennium” by Ann-Marie Borbely and Jan Kreider, 2001 “Drilling in Detroit: Tapping Automaker Ingenuity to Build Safe and Efficient Automobiles”, Union of Concerned Scientists, June 2001
97

"Emerging Auto-Competitive Transit Technologies: A Brief Review", Jerry Schneider, transportation presentation from "CE World", a virtual conference on civil engineering from The American Society of Civil Engineers - http://www.ceworld.org/ceworld/index.cfm “Employment and Other Macroeconomic Benefits of an Innovation-Led Climate Strategy for the United States,” Laitner, Skip, Stephen Bernow, and John DeCicco, 1998. Energy Policy, Volume 26, No. 5, pp 425-433. “Energizing America’s Cities: Developing a Sustainable Energy Solution” submissions received from Austin Texas; Chattanooga, Tennessee; Chicago, Illinois; Denver, Colorado; Minneapolis and St. Paul, Minnesota; Portland, Oregon; San Diego, California; and Seattle, Washington. Energy Efficiency and Renewable Energy Network, Distributed Energy Resources. http://www.eren.doe.gov/der/ “Energy Security - Solutions to Protect America’s Power Supply and Reduce Oil Dependence,” Union of Concerned Scientists, January 2002 Environmental Benefits of Distributed Generation; Joel Bluestein, Energy and Environmental Analysis, Inc., December 18, 2000. EPA Global Warming Website, http://yosemite.epa.gov/oar/globalwarming.nsf/content/index.html EyeforEnergy, EyeforFuelCells, 5/15/2002. Federal Energy Policy Act of 1992 “Fuel Cell Energy, MWH Energy Team to Distribute Direct Fuel Cell Power Plants” “Getting Out of Gridlock,” Jim Motavalli, E Magazine March 15, 2002. Global Climate Change Policy Book; White House, February 2002. Green-e renewable electricity certification program. http://www.green-e.org/ “Guide to Municipal Energy Planning,” Vermont Department of Public Service, April 1993. “How Transportation and Community Partnerships Are Shaping America”, Part II: Streets and Roads, Project for Public Spaces, Inc., http://www.pps.org/, September 2002. “Implementing Chicago’s Energy Plan: Barriers and Opportunities for Distributed Generation and Cogeneration”, Distributed Energy Resources Center, Gas Technology Institute, July 2002. “Job Jolt – The Economic Impacts of Repowering the Midwest: the Clean Energy Development Plan for the Heartland”, Environmental Law & Policy Center of the Midwest, 2003. “Landfill Methane Recovery” Climate Change Technologies Brochure, US EPA, State and Local Climate Change Program, January 2000 “Local Government Sustainable Development Strategies and the Climate –Friendly City: United States and Europe”, Steven J. Foute, 1995. Lincoln Institute of Land Policy. “Local Governments’ Response to Agenda 21: Summary Report of Local Agenda 21 Survey with Regional Focus”, ICLEI, May 2002. “Local Tools for Smart Growth” Practical Strategies and Techniques to Improve our Communities, National Association of Counties, No Publication Date. “Making Connections: Case Studies of Interconnection Barriers and their Impact on Distributed Power Projects” by United States Department Of Energy Distributed Power Program, Revised July 2000. “Mobility 2001,” MIT and World Business Council for Sustainable Development “Municipal Solid Waste in The United States: 2000 Facts and Figures” US EPA, Office of Solid Waste and Emergency Response (5305W), EPA530-R-02-001, June 2002 “National CHP Roadmap” by United States Combined Heat and Power Association, March 2001. http://www.nemw.org/uschpa
98

“National Energy Policy” by National Energy Policy Development Group, May 2001 “National Transportation Statistics”, 2000, Bureau of Transportation Statistics, U.S. Department of Transportation, April 2001, Table 1-31, p. 48. “Our Built and Natural Environments” A Technical Review of the Interactions between land Use, Transportation, and Environmental Quality, US EPA 231-R-01-002, January 2001 “Petition for rulemaking to amend testing and calculation procedures and/or correction factors for fuel economy information purposes to Governor Whitman and Secretary Mineta,” Letter dated June 11, 2002, from Russell Long, Ph.D., Executive Director, Bluewater Network, www.bluewaternetwork.org Planning for Success: An Economic Development Guide for Small Public Power Communities Laitner, Skip, and Marshall Goldberg, 1996. American Public Power Association, Washington, DC. Planning Small Town America, Kristina Ford, 1990. American Planning Association, Chicago, IL. “Power Scorecard Methodology” by Pace Law School Energy Project, September 22, 2000. “Power to Choose” Distributed Energy Series by the Gas Technology Institute, February 2002. “Public Transportation Fact Book,” American Public Transportation Association, March 2001, Table 30, p. 70. “Questions Arise As More Older Americans Outlive Driving Privilege,” National Institutes of Health, National Institute on Aging, Press Release, July 29, 2002 “Repowering the Midwest: the Clean Energy Development Plan for the Heartland”, Environmental Law & Policy Center of the Midwest, February 2001. “Scientists Lower Estimate of Risk from PM on Bad Air Days,” Washington Update, June 3-7, 2002. “Selected Best Practices for Successful City Energy Initiatives,” prepared for the U.S. Conference of Mayors, May 2001. “Sorry, wrong number: The use and misuse of numerical “facts in analysis and media reporting of energy issues”, Koomey, Jonathan G., Chris Calwell, Skip Laitner, Jane Thornton, Richard E. Brown, Joseph H. Eto, Carrie Webber, and Cathy Cullicott, 2002. Annual Review of Energy and the Environment. “A Sustainable Urban System Design for the Greater San Diego-Tijuana Binational Metropolitan Region,” Sustainable Energy Planning Office, Gas Technology Institute, June 2003. “Sustainable Transportation Options for Protecting the Environment” A Guide for Local Governments, ICLEI, 2001 “The 2002 Urban Mobility Report” David Schrank and Tim Lomax, Texas Transportation Institute, The Texas A&M University System, http://mobility.tamu.edu, June 2002 “The Cost of Power Disturbances to Industrial & Digital Economy Companies,” report by Primen, sponsored by EPRI, June 2001. “The Energy Yardstick: Using PLACE3S to Create More Sustainable Communities”, produced for Center of Excellence for Sustainable Development, Office of Energy Efficiency and Renewable Energy, U.S. Department of Energy, June 1996. “The Role of Natural Gas Fired Reciprocating Engines in the Distributed Energy Market – Opportunities and Market Forces” prepared by Gas Technology Institute, Gas Research Institute, December 2002. “Toyota Motor Plans All Gas-Electric Vehicles by 2012”, Detroit, Oct. 24 2002, Bloomberg News
99

“Transit Orientated Development: Moving From Rhetoric to Reality”, by Dena Belzer and Gerald Autler, Strategic Economics, A Discussion Paper Prepared for The Brookings Institution Center on Urban and Metropolitan Policy and The Great American Station Foundation, June 2002 “Transportation Emissions” National Air Pollutant Emission Trends, 1900 – 1998, United States Office of Air Quality EPA-454/R-00-002, Environmental Protection Planning and Standards March 2000 “US Commute Profile,” NPTS “World Bicycle and Automobile Production 1950 –2000”, Worldwatch Institute 1997 Kyoto Protocol President’s Climate Change Policy Options; June 11, 2001 US Department of Transportation, Bureau of Transportation Statistics, Based on US EPA Indicators of the Environmental Impacts of Transportation (Wash. DC, 10/99), figure1-1. U.S. Department of Commerce, Bureau of Economic Analysis, 2001. U.S. Energy Information Agency, State Electricity Profiles. U.S. Environmental Protection Agency Landfill Methane Outreach Program, http://www.epa.gov/lmop/index.htm.
100