a brief update of last three days ndp surge … · 10 20 30 40 50 60 mar-24 mar-28 apr-01 apr-05...
TRANSCRIPT
Copyright 2011. No reproduction without permission. Page 1
www.ekospolitics.ca
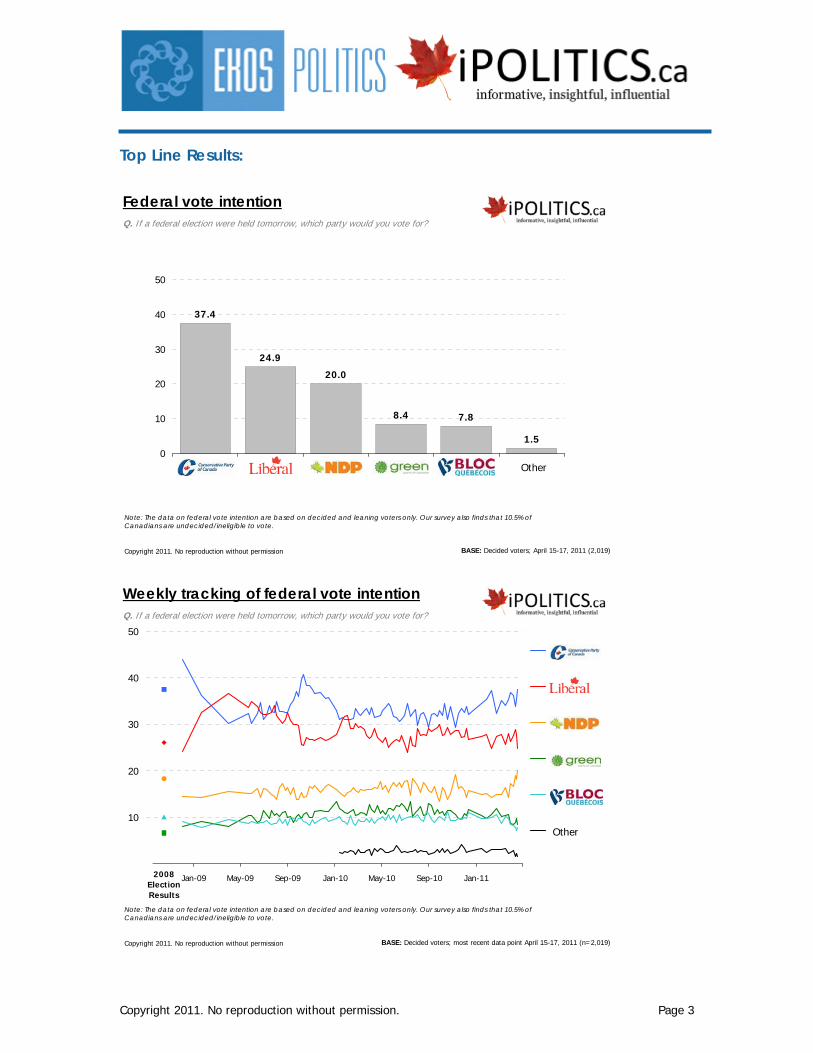
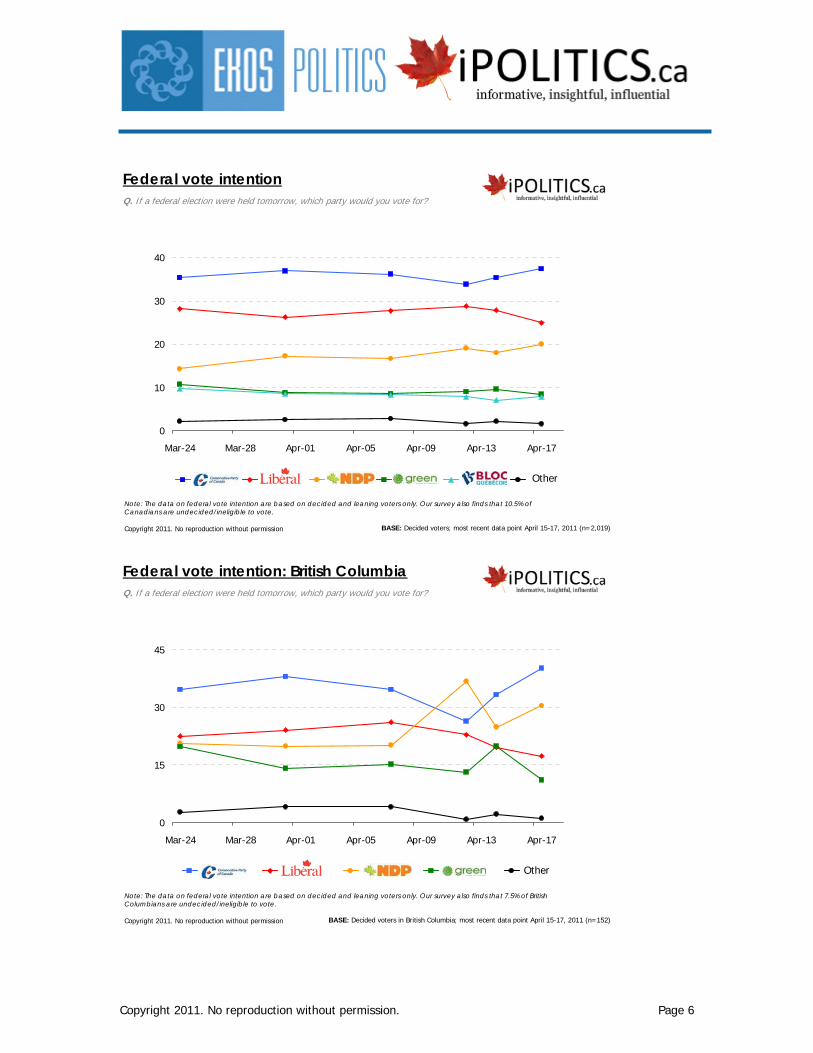
A BRIEF UPDATE OF LAST THREE DAYS: NDP SURGE CONTINUES AS WE APPROACH A CLONED PARLIAMENT CONSERVATIVE LEAD WIDENS TO 12.5 POINTS [Ottawa – April 18, 2011] – The weekends are always difficult times to poll on vote intention but as we are in the final two weeks of the campaign, we have decided to do so. Based on some 2,350 cases from Friday to Sunday, the top line results show the Conservatives at 37.4 – ahead of their end of last week position – and now showing a clear advantage over the Liberals who, at 24.9 points, have fallen back to their position coming out of the 2008 election. The NDP, meanwhile, continues to follow an upward trend line and, at 20.0 points, they are the only party to have clearly demonstrated upward momentum throughout the campaign (which they began around 6 points below their current standing). The NDP are also ahead of their position in 2008 and they seem to be benefitting from growth with younger and women voters and these gains have been partly drawn from the Green Party and the Bloc, who appear to have stopped the bleeding and are now holding steady at 31.9 points in Quebec. There is some instability apparent in the numbers, which suggests that things can still change. While support for national direction has improved, support for the current government in Canada has reached a low point for the
HIGHLIGHTS • National federal vote intention*:
¤ 37.4% CPC ¤ 24.9% LPC ¤ 20.0% NDP ¤ 8.4% Green ¤ 7.8% BQ ¤ 1.5% other
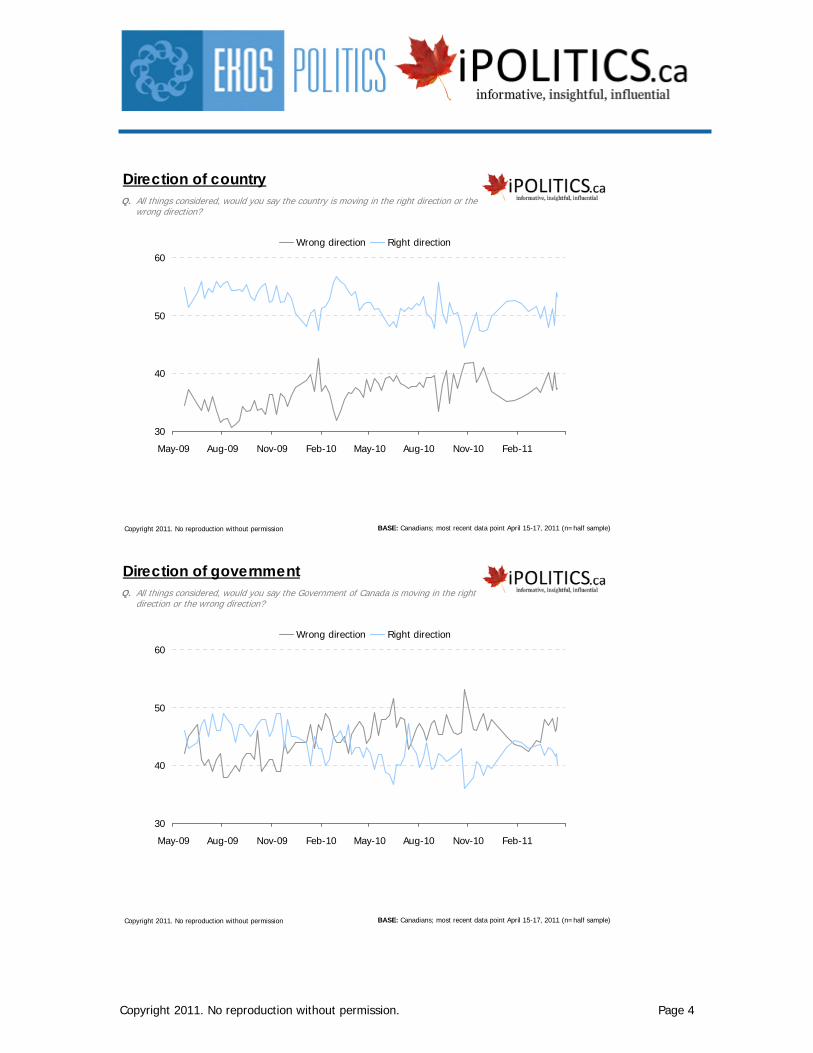
• Direction of country: ¤ 53.2% right direction ¤ 37.3% wrong direction ¤ 9.6% DK/NR
• : Direction of government¤ 40.1% right direction ¤ 48.3% wrong direction ¤ 11.5% DK/NR
• Second choice: ¤ 7.1% CPC ¤ 18.1% LPC ¤ 26.7% NDP ¤ 12.3% Green ¤ 3.6% BQ ¤ 2.1% other ¤ 30.1% no second choice
*Decided voters only: 7.6% of respondents are undecided and 2.9% are ineligible to vote. Please note that the methodology is provided at the end of this document.
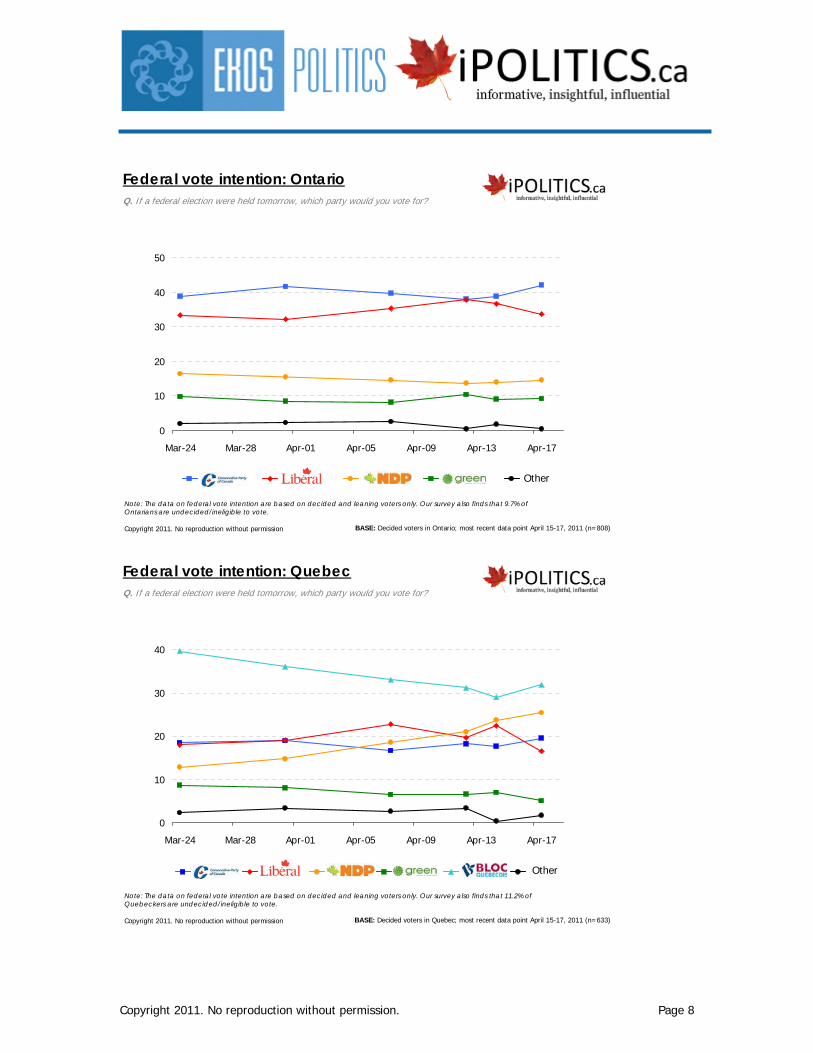
campaign. So far, it is the NDP who have tapped into this growing disaffection for the incumbent government, but it could be a force in the final stages of the campaign. The regional patterns show the Conservatives ahead in a volatile race in British Columbia with the NDP performing well. The Conservatives dominate Alberta and the Prairies and they have moved eight points up on the Liberals in the crucial Ontario race. The Quebec race is quite unsettled with the NDP reaching new heights at 25.4 points. Atlantic Canada remains a tight two-way race with the Liberals enjoying a slim advantage over the Conservatives. When we focus on those who “absolutely certain to vote”, we end up with a result which is eerily
Copyright 2011. No reproduction without permission. Page 2
similar to the 2008 election. All parties are very close and the Conservatives and Liberals are both at almost exactly their last election performance. This would generate almost near-clone Parliament with the Liberals and the Conservatives having almost precisely the same seats. Despite this appearance of remarkable stability, there is ample evidence that there is still room for significant twists and turns in the final two weeks. At the beginning of week four, this is a poll which is very favourable for the NDP and the Conservatives, but not very encouraging for the Liberals. Weekend polls can be funny creatures though, and we will be watching things closely as the week unfolds.
Copyright 2011. No reproduction without permission. Page 3
Top Line Results:
Copyright 2011. No reproduction without permission
Federal vote intention
BASE: Decided voters; April 15-17, 2011 (2,019)
Q. If a federal election were held tomorrow, which party would you vote for?
37.4
24.9
20.0
8.4 7.8
1.50
10
20
30
40
50
CPC LPC NDP GP BQ OtherOther
Note: The data on federal vote intention are based on decided and leaning voters only. Our survey also finds that 10.5% of Canadians are undecided/ineligible to vote.
Copyright 2011. No reproduction without permission
0
10
20
30
40
50
Sep-08 Jan-09 May-09 Sep-09 Jan-10 May-10 Sep-10 Jan-11
Line6
2008ElectionResults
Note: The data on federal vote intention are based on decided and leaning voters only. Our survey also finds that 10.5% of Canadians are undecided/ineligible to vote.
Other
BASE: Decided voters; most recent data point April 15-17, 2011 (n=2,019)
Weekly tracking of federal vote intention Q. If a federal election were held tomorrow, which party would you vote for?
Copyright 2011. No reproduction without permission. Page 4
Copyright 2011. No reproduction without permission
30
40
50
60
May-09 Aug-09 Nov-09 Feb-10 May-10 Aug-10 Nov-10 Feb-11
Wrong direction Right direction
BASE: Canadians; most recent data point April 15-17, 2011 (n=half sample)
Direction of countryQ. All things considered, would you say the country is moving in the right direction or the
wrong direction?
Copyright 2011. No reproduction without permission
30
40
50
60
May-09 Aug-09 Nov-09 Feb-10 May-10 Aug-10 Nov-10 Feb-11
Wrong direction Right direction
Direction of governmentQ. All things considered, would you say the Government of Canada is moving in the right
direction or the wrong direction?
BASE: Canadians; most recent data point April 15-17, 2011 (n=half sample)

Copyright 2011. No reproduction without permission. Page 5
Copyright 2011. No reproduction without permission
Federal vote intention by likelihood of voting
BASE: Eligible voters who say they are absolutely certain to vote; April 15-17, 2011 (1,803)
Q. If a federal election were held tomorrow, which party would you vote for?
37.6
26.2
18.2
6.810.0
1.2
38.2
25.8
19.7
6.9 8.1
1.30
10
20
30
40
50
CPC LPC NDP GP BQ Other
2008 Election results Those who are absolutely certain to vote
Other
Note: The data on federal vote intention are based on decided and leaning voters only. Our survey also finds that 4.1% of eligible voters who are absolutely certain to vote are undecided.
Those who say they are absolutely certain to vote
Copyright 2011. No reproduction without permission
--1.02.81.11.02.72.1Other
16.422.523.015.417.443.130.1No second choice
1.9
9.9
20.8
21.5
--
CPC
5.8--7.19.51.53.6
22.09.1--21.115.712.3
27.444.340.0--51.826.7
7.414.018.141.3--18.1
21.09.19.011.612.57.1
OtherBQGPNDPLPCSecond Choice
(overall)SECOND CHOICE
FIRST CHOICE
Second choice Q. Which party would be your second choice?
BASE: Eligible voters; April 15-17, 2011 (n=2,200)
Copyright 2011. No reproduction without permission. Page 6
Copyright 2011. No reproduction without permission
0
10
20
30
40
Mar-24 Mar-28 Apr-01 Apr-05 Apr-09 Apr-13 Apr-17
Line 6
Note: The data on federal vote intention are based on decided and leaning voters only. Our survey also finds that 10.5% of Canadians are undecided/ineligible to vote.
Other
Federal vote intentionQ. If a federal election were held tomorrow, which party would you vote for?
BASE: Decided voters; most recent data point April 15-17, 2011 (n=2,019)
Copyright 2011. No reproduction without permission
0
15
30
45
Mar-24 Mar-28 Apr-01 Apr-05 Apr-09 Apr-13 Apr-17
Line 5
Note: The data on federal vote intention are based on decided and leaning voters only. Our survey also finds that 7.5% of British Columbians are undecided/ineligible to vote.
Other
Federal vote intention: British ColumbiaQ. If a federal election were held tomorrow, which party would you vote for?
BASE: Decided voters in British Columbia; most recent data point April 15-17, 2011 (n=152)

Copyright 2011. No reproduction without permission. Page 7
Copyright 2011. No reproduction without permission
0
20
40
60
80
Mar-24 Mar-28 Apr-01 Apr-05 Apr-09 Apr-13 Apr-17
Line 5
Note: The data on federal vote intention are based on decided and leaning voters only. Our survey also finds that 11.2% of Albertans are undecided/ineligible to vote.
Other
Federal vote intention: AlbertaQ. If a federal election were held tomorrow, which party would you vote for?
BASE: Decided voters in Alberta; most recent data point April 15-17, 2011 (n=159)
Copyright 2011. No reproduction without permission
0
10
20
30
40
50
60
Mar-24 Mar-28 Apr-01 Apr-05 Apr-09 Apr-13 Apr-17
Line 5
Note: The data on federal vote intention are based on decided and leaning voters only. Our survey also finds that 11.3% of Saskatchewanians and Manitobans are undecided/ineligible to vote.
Other
Federal vote intention: Saskatchewan/ManitobaQ. If a federal election were held tomorrow, which party would you vote for?
BASE: Decided voters in Saskatchewan/Manitoba; most recent data point April 15-17, 2011 (n=143)
Copyright 2011. No reproduction without permission. Page 8
Copyright 2011. No reproduction without permission
0
10
20
30
40
50
Mar-24 Mar-28 Apr-01 Apr-05 Apr-09 Apr-13 Apr-17
Line 5
Note: The data on federal vote intention are based on decided and leaning voters only. Our survey also finds that 9.7% of Ontarians are undecided/ineligible to vote.
Other
Federal vote intention: OntarioQ. If a federal election were held tomorrow, which party would you vote for?
BASE: Decided voters in Ontario; most recent data point April 15-17, 2011 (n=808)
Copyright 2011. No reproduction without permission
0
10
20
30
40
Mar-24 Mar-28 Apr-01 Apr-05 Apr-09 Apr-13 Apr-17
Line 6
Note: The data on federal vote intention are based on decided and leaning voters only. Our survey also finds that 11.2% of Quebeckers are undecided/ineligible to vote.
Other
Federal vote intention: QuebecQ. If a federal election were held tomorrow, which party would you vote for?
BASE: Decided voters in Quebec; most recent data point April 15-17, 2011 (n=633)

Copyright 2011. No reproduction without permission. Page 9
Copyright 2011. No reproduction without permission
0
10
20
30
40
50
Mar-24 Mar-28 Apr-01 Apr-05 Apr-09 Apr-13 Apr-17
Line 5
Note: The data on federal vote intention are based on decided and leaning voters only. Our survey also finds that 14.9% of Atlantic Canadians are undecided/ineligible to vote.
Other
Q. If a federal election were held tomorrow, which party would you vote for?
BASE: Decided voters in Atlantic Canada; most recent data point April 15-17, 2011 (n=124)
Federal vote intention: Atlantic Canada
Copyright 2011. No reproduction without permission. Page 10
Detailed Tables:
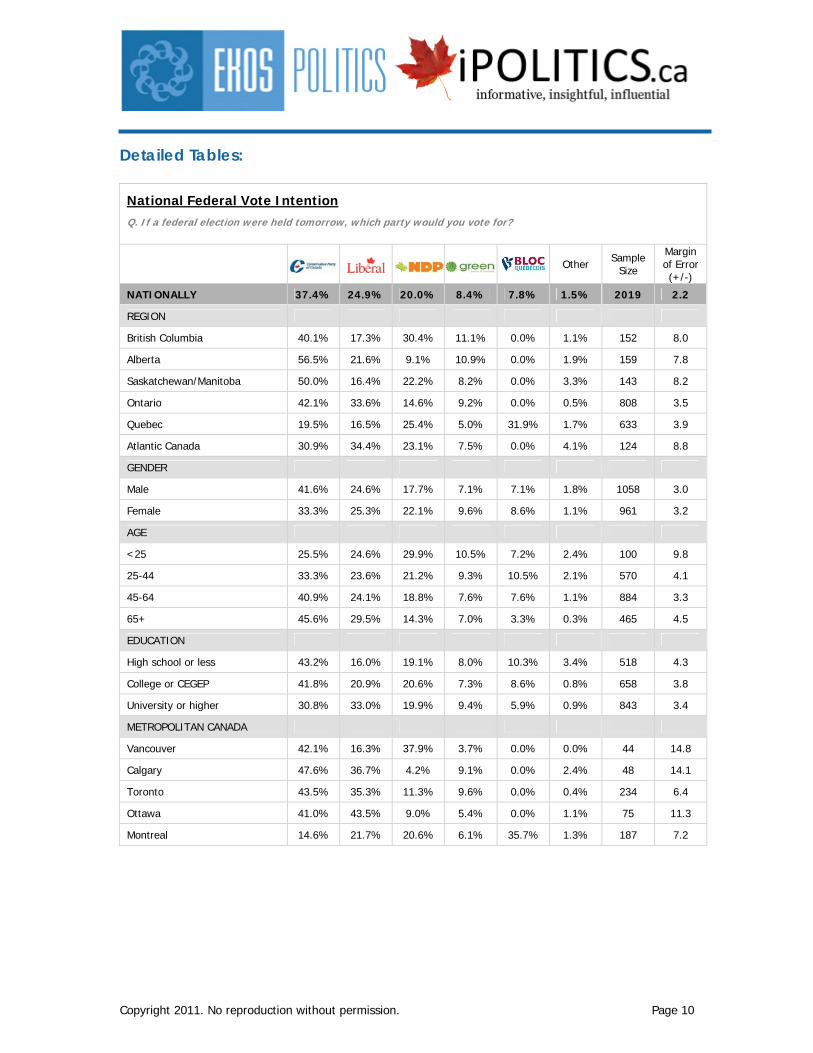
National Federal Vote Intention Q. If a federal election were held tomorrow, which party would you vote for?
Other Sample Size
Margin of Error (+/-)
NATIONALLY 37.4% 24.9% 20.0% 8.4% 7.8% 1.5% 2019 2.2
REGION
British Columbia 40.1% 17.3% 30.4% 11.1% 0.0% 1.1% 152 8.0
Alberta 56.5% 21.6% 9.1% 10.9% 0.0% 1.9% 159 7.8
Saskatchewan/Manitoba 50.0% 16.4% 22.2% 8.2% 0.0% 3.3% 143 8.2
Ontario 42.1% 33.6% 14.6% 9.2% 0.0% 0.5% 808 3.5
Quebec 19.5% 16.5% 25.4% 5.0% 31.9% 1.7% 633 3.9
Atlantic Canada 30.9% 34.4% 23.1% 7.5% 0.0% 4.1% 124 8.8
GENDER
Male 41.6% 24.6% 17.7% 7.1% 7.1% 1.8% 1058 3.0
Female 33.3% 25.3% 22.1% 9.6% 8.6% 1.1% 961 3.2
AGE
<25 25.5% 24.6% 29.9% 10.5% 7.2% 2.4% 100 9.8
25-44 33.3% 23.6% 21.2% 9.3% 10.5% 2.1% 570 4.1
45-64 40.9% 24.1% 18.8% 7.6% 7.6% 1.1% 884 3.3
65+ 45.6% 29.5% 14.3% 7.0% 3.3% 0.3% 465 4.5
EDUCATION
High school or less 43.2% 16.0% 19.1% 8.0% 10.3% 3.4% 518 4.3
College or CEGEP 41.8% 20.9% 20.6% 7.3% 8.6% 0.8% 658 3.8
University or higher 30.8% 33.0% 19.9% 9.4% 5.9% 0.9% 843 3.4
METROPOLITAN CANADA
Vancouver 42.1% 16.3% 37.9% 3.7% 0.0% 0.0% 44 14.8
Calgary 47.6% 36.7% 4.2% 9.1% 0.0% 2.4% 48 14.1
Toronto 43.5% 35.3% 11.3% 9.6% 0.0% 0.4% 234 6.4
Ottawa 41.0% 43.5% 9.0% 5.4% 0.0% 1.1% 75 11.3
Montreal 14.6% 21.7% 20.6% 6.1% 35.7% 1.3% 187 7.2
Copyright 2011. No reproduction without permission. Page 11
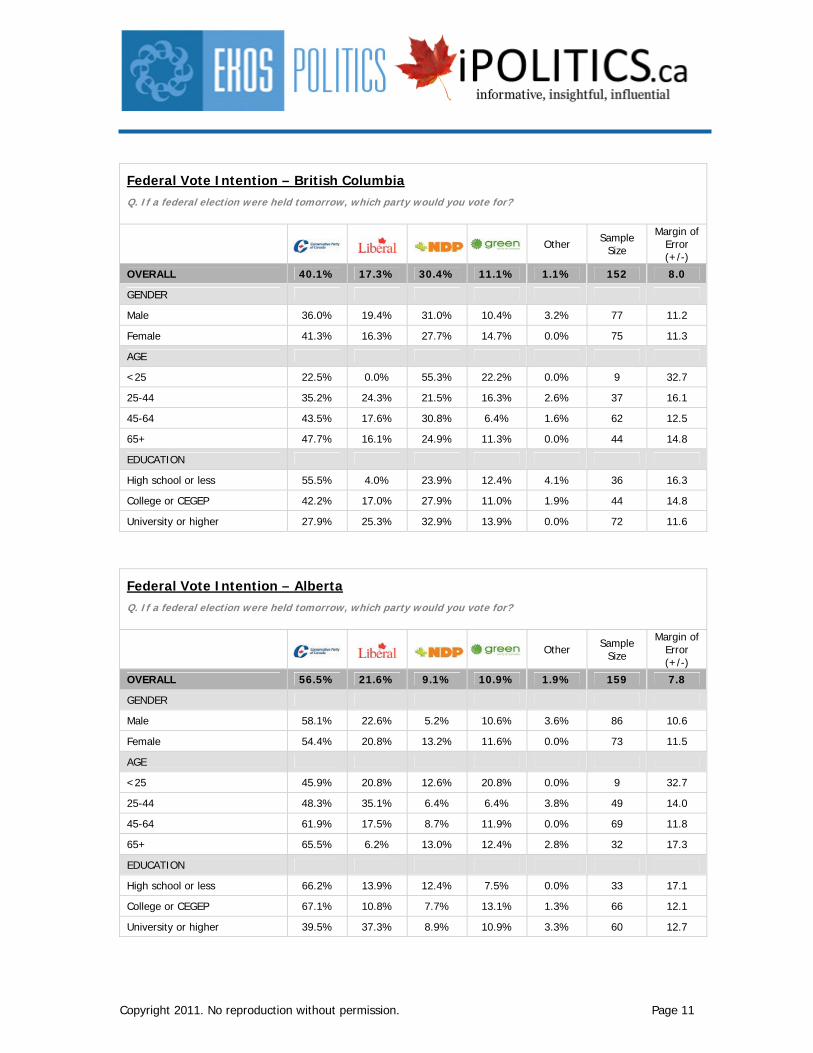
Federal Vote Intention – British Columbia Q. If a federal election were held tomorrow, which party would you vote for?
Other Sample Size
Margin of Error (+/-)
OVERALL 40.1% 17.3% 30.4% 11.1% 1.1% 152 8.0
GENDER
Male 36.0% 19.4% 31.0% 10.4% 3.2% 77 11.2
Female 41.3% 16.3% 27.7% 14.7% 0.0% 75 11.3
AGE
<25 22.5% 0.0% 55.3% 22.2% 0.0% 9 32.7
25-44 35.2% 24.3% 21.5% 16.3% 2.6% 37 16.1
45-64 43.5% 17.6% 30.8% 6.4% 1.6% 62 12.5
65+ 47.7% 16.1% 24.9% 11.3% 0.0% 44 14.8
EDUCATION
High school or less 55.5% 4.0% 23.9% 12.4% 4.1% 36 16.3
College or CEGEP 42.2% 17.0% 27.9% 11.0% 1.9% 44 14.8
University or higher 27.9% 25.3% 32.9% 13.9% 0.0% 72 11.6
Federal Vote Intention – Alberta Q. If a federal election were held tomorrow, which party would you vote for?
Other Sample Size
Margin of Error (+/-)
OVERALL 56.5% 21.6% 9.1% 10.9% 1.9% 159 7.8
GENDER
Male 58.1% 22.6% 5.2% 10.6% 3.6% 86 10.6
Female 54.4% 20.8% 13.2% 11.6% 0.0% 73 11.5
AGE
<25 45.9% 20.8% 12.6% 20.8% 0.0% 9 32.7
25-44 48.3% 35.1% 6.4% 6.4% 3.8% 49 14.0
45-64 61.9% 17.5% 8.7% 11.9% 0.0% 69 11.8
65+ 65.5% 6.2% 13.0% 12.4% 2.8% 32 17.3
EDUCATION
High school or less 66.2% 13.9% 12.4% 7.5% 0.0% 33 17.1
College or CEGEP 67.1% 10.8% 7.7% 13.1% 1.3% 66 12.1
University or higher 39.5% 37.3% 8.9% 10.9% 3.3% 60 12.7
Copyright 2011. No reproduction without permission. Page 12
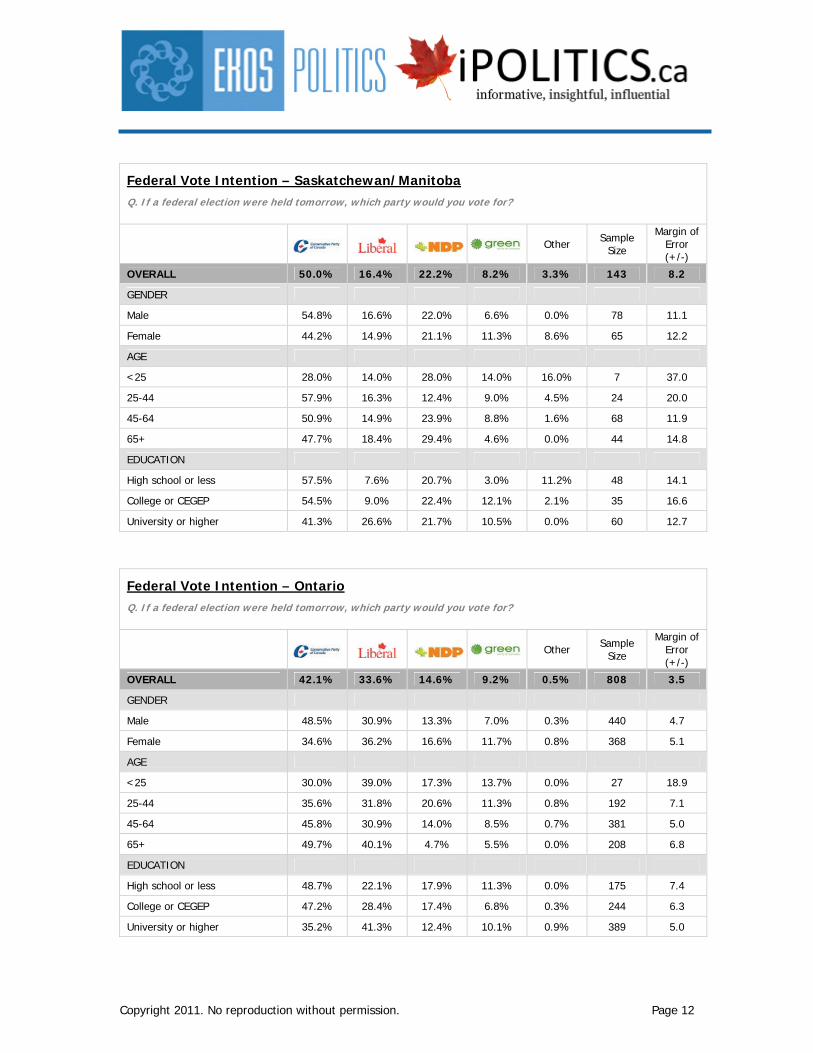
Federal Vote Intention – Saskatchewan/Manitoba Q. If a federal election were held tomorrow, which party would you vote for?
Other Sample Size
Margin of Error (+/-)
OVERALL 50.0% 16.4% 22.2% 8.2% 3.3% 143 8.2
GENDER
Male 54.8% 16.6% 22.0% 6.6% 0.0% 78 11.1
Female 44.2% 14.9% 21.1% 11.3% 8.6% 65 12.2
AGE
<25 28.0% 14.0% 28.0% 14.0% 16.0% 7 37.0
25-44 57.9% 16.3% 12.4% 9.0% 4.5% 24 20.0
45-64 50.9% 14.9% 23.9% 8.8% 1.6% 68 11.9
65+ 47.7% 18.4% 29.4% 4.6% 0.0% 44 14.8
EDUCATION
High school or less 57.5% 7.6% 20.7% 3.0% 11.2% 48 14.1
College or CEGEP 54.5% 9.0% 22.4% 12.1% 2.1% 35 16.6
University or higher 41.3% 26.6% 21.7% 10.5% 0.0% 60 12.7
Federal Vote Intention – Ontario Q. If a federal election were held tomorrow, which party would you vote for?
Other Sample Size
Margin of Error (+/-)
OVERALL 42.1% 33.6% 14.6% 9.2% 0.5% 808 3.5
GENDER
Male 48.5% 30.9% 13.3% 7.0% 0.3% 440 4.7
Female 34.6% 36.2% 16.6% 11.7% 0.8% 368 5.1
AGE
<25 30.0% 39.0% 17.3% 13.7% 0.0% 27 18.9
25-44 35.6% 31.8% 20.6% 11.3% 0.8% 192 7.1
45-64 45.8% 30.9% 14.0% 8.5% 0.7% 381 5.0
65+ 49.7% 40.1% 4.7% 5.5% 0.0% 208 6.8
EDUCATION
High school or less 48.7% 22.1% 17.9% 11.3% 0.0% 175 7.4
College or CEGEP 47.2% 28.4% 17.4% 6.8% 0.3% 244 6.3
University or higher 35.2% 41.3% 12.4% 10.1% 0.9% 389 5.0
Copyright 2011. No reproduction without permission. Page 13
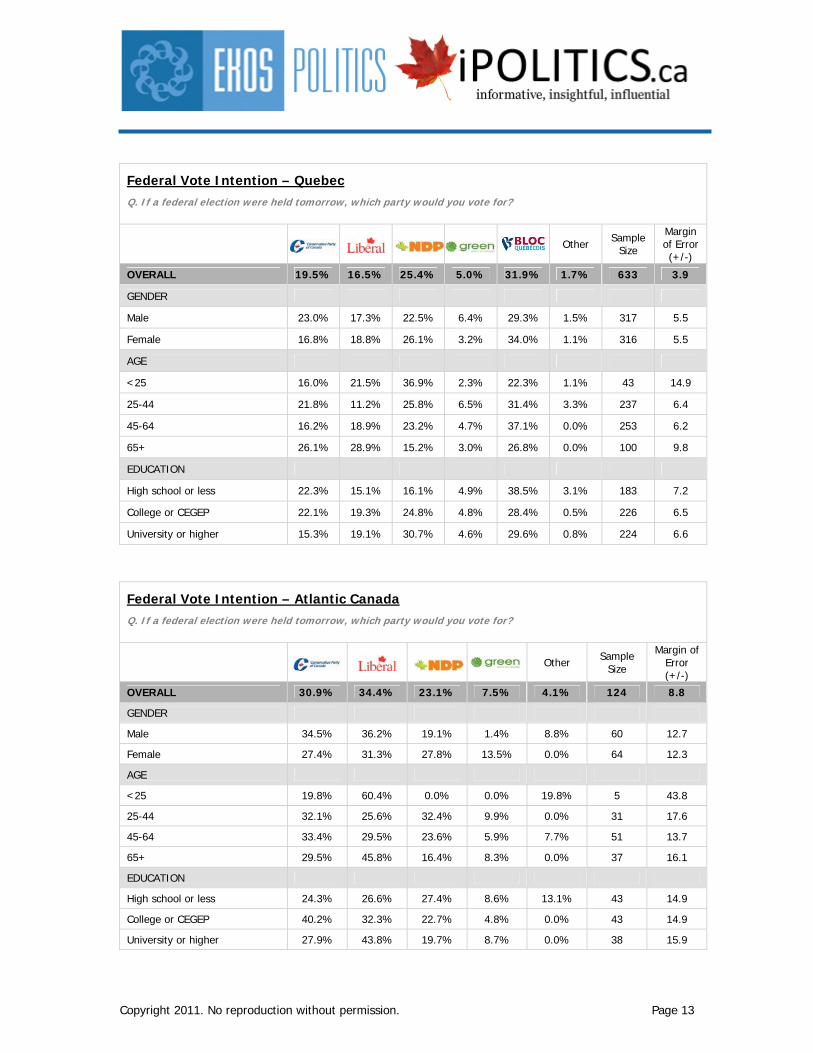
Federal Vote Intention – Quebec Q. If a federal election were held tomorrow, which party would you vote for?
Other Sample Size
Margin of Error (+/-)
OVERALL 19.5% 16.5% 25.4% 5.0% 31.9% 1.7% 633 3.9
GENDER
Male 23.0% 17.3% 22.5% 6.4% 29.3% 1.5% 317 5.5
Female 16.8% 18.8% 26.1% 3.2% 34.0% 1.1% 316 5.5
AGE
<25 16.0% 21.5% 36.9% 2.3% 22.3% 1.1% 43 14.9
25-44 21.8% 11.2% 25.8% 6.5% 31.4% 3.3% 237 6.4
45-64 16.2% 18.9% 23.2% 4.7% 37.1% 0.0% 253 6.2
65+ 26.1% 28.9% 15.2% 3.0% 26.8% 0.0% 100 9.8
EDUCATION
High school or less 22.3% 15.1% 16.1% 4.9% 38.5% 3.1% 183 7.2
College or CEGEP 22.1% 19.3% 24.8% 4.8% 28.4% 0.5% 226 6.5
University or higher 15.3% 19.1% 30.7% 4.6% 29.6% 0.8% 224 6.6
Federal Vote Intention – Atlantic Canada Q. If a federal election were held tomorrow, which party would you vote for?
Other Sample Size
Margin of Error (+/-)
OVERALL 30.9% 34.4% 23.1% 7.5% 4.1% 124 8.8
GENDER
Male 34.5% 36.2% 19.1% 1.4% 8.8% 60 12.7
Female 27.4% 31.3% 27.8% 13.5% 0.0% 64 12.3
AGE
<25 19.8% 60.4% 0.0% 0.0% 19.8% 5 43.8
25-44 32.1% 25.6% 32.4% 9.9% 0.0% 31 17.6
45-64 33.4% 29.5% 23.6% 5.9% 7.7% 51 13.7
65+ 29.5% 45.8% 16.4% 8.3% 0.0% 37 16.1
EDUCATION
High school or less 24.3% 26.6% 27.4% 8.6% 13.1% 43 14.9
College or CEGEP 40.2% 32.3% 22.7% 4.8% 0.0% 43 14.9
University or higher 27.9% 43.8% 19.7% 8.7% 0.0% 38 15.9
Copyright 2011. No reproduction without permission. Page 14
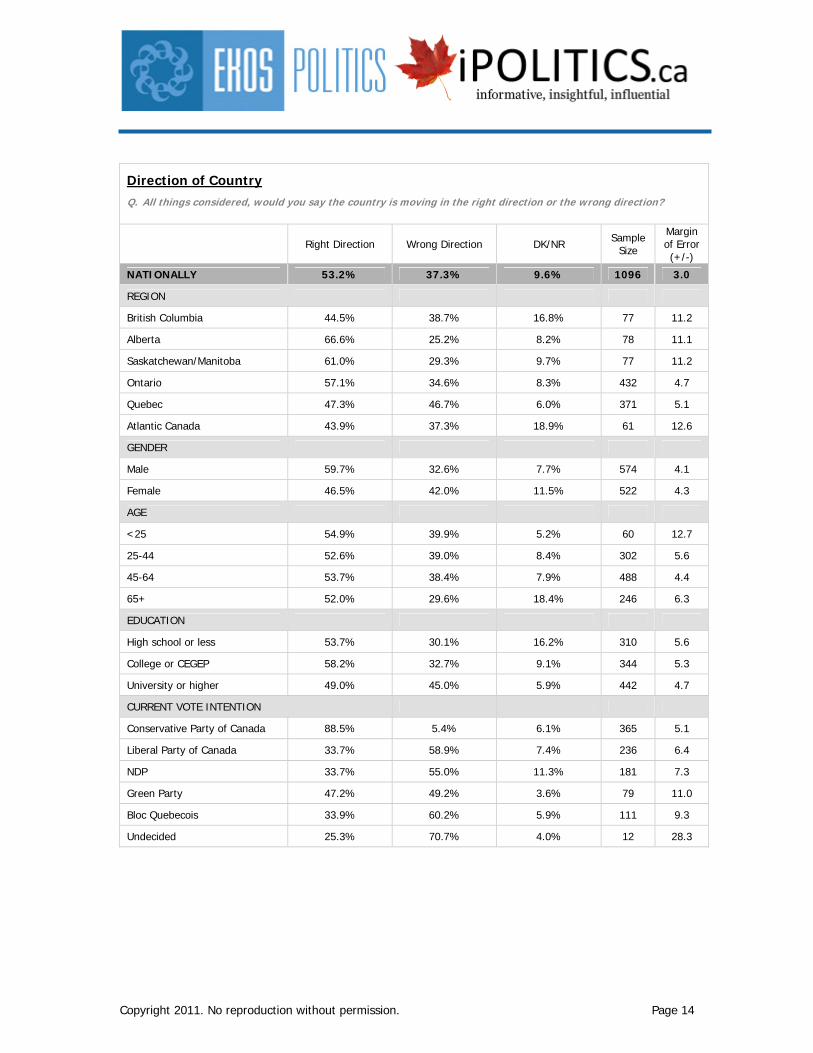
Direction of Country Q. All things considered, would you say the country is moving in the right direction or the wrong direction?
Right Direction Wrong Direction DK/NR Sample Size
Margin of Error (+/-)
NATIONALLY 53.2% 37.3% 9.6% 1096 3.0
REGION
British Columbia 44.5% 38.7% 16.8% 77 11.2
Alberta 66.6% 25.2% 8.2% 78 11.1
Saskatchewan/Manitoba 61.0% 29.3% 9.7% 77 11.2
Ontario 57.1% 34.6% 8.3% 432 4.7
Quebec 47.3% 46.7% 6.0% 371 5.1
Atlantic Canada 43.9% 37.3% 18.9% 61 12.6
GENDER
Male 59.7% 32.6% 7.7% 574 4.1
Female 46.5% 42.0% 11.5% 522 4.3
AGE
<25 54.9% 39.9% 5.2% 60 12.7
25-44 52.6% 39.0% 8.4% 302 5.6
45-64 53.7% 38.4% 7.9% 488 4.4
65+ 52.0% 29.6% 18.4% 246 6.3
EDUCATION
High school or less 53.7% 30.1% 16.2% 310 5.6
College or CEGEP 58.2% 32.7% 9.1% 344 5.3
University or higher 49.0% 45.0% 5.9% 442 4.7
CURRENT VOTE INTENTION
Conservative Party of Canada 88.5% 5.4% 6.1% 365 5.1
Liberal Party of Canada 33.7% 58.9% 7.4% 236 6.4
NDP 33.7% 55.0% 11.3% 181 7.3
Green Party 47.2% 49.2% 3.6% 79 11.0
Bloc Quebecois 33.9% 60.2% 5.9% 111 9.3
Undecided 25.3% 70.7% 4.0% 12 28.3

Copyright 2011. No reproduction without permission. Page 15
Direction of Government Q. All things considered, would you say the Government of Canada is moving in the right direction or the wrong
direction?
Right Direction Wrong Direction DK/NR Sample Size
Margin of Error (+/-)
NATIONALLY 40.1% 48.3% 11.5% 1150 2.9
REGION
British Columbia 40.0% 48.1% 11.8% 89 10.4
Alberta 52.7% 35.3% 12.0% 98 9.9
Saskatchewan/Manitoba 50.7% 38.8% 10.5% 82 10.8
Ontario 47.5% 41.4% 11.1% 445 4.7
Quebec 21.1% 68.0% 10.9% 354 5.2
Atlantic Canada 35.9% 49.1% 15.0% 82 10.8
GENDER
Male 43.3% 49.3% 7.3% 566 4.1
Female 37.4% 47.5% 15.2% 584 4.1
AGE
<25 33.1% 48.9% 18.0% 68 11.9
25-44 34.7% 54.3% 11.0% 336 5.4
45-64 42.6% 49.1% 8.3% 478 4.5
65+ 51.3% 34.6% 14.1% 268 6.0
EDUCATION
High school or less 44.4% 40.5% 15.1% 306 5.6
College or CEGEP 37.4% 48.7% 13.9% 389 5.0
University or higher 39.6% 53.2% 7.1% 455 4.6
CURRENT VOTE INTENTION
Conservative Party of Canada 83.8% 9.1% 7.1% 391 5.0
Liberal Party of Canada 20.6% 71.2% 8.2% 259 6.1
NDP 20.1% 68.6% 11.3% 195 7.0
Green Party 21.6% 66.7% 11.7% 73 11.5
Bloc Quebecois 3.7% 85.4% 10.9% 104 9.6
Undecided 9.7% 68.1% 22.2% 13 27.2

Copyright 2011. No reproduction without permission. Page 16
Second Choice Q. Talking again in terms of a federal election, which party would be your second choice?
Other No 2nd choice
Sample Size
Margin of Error (+/-)
NATIONALLY 7% 18% 27% 12% 4% 2% 30% 2200 2.1
REGION
British Columbia 6% 20% 21% 19% 0% 1% 32% 162 7.7
Alberta 6% 12% 20% 14% 0% 4% 43% 173 7.5
Saskatchewan/Manitoba 5% 15% 24% 14% 0% 3% 37% 156 7.9
Ontario 6% 20% 28% 12% 0% 3% 32% 860 3.3
Quebec 8% 19% 29% 9% 15% 1% 20% 710 3.7
Atlantic Canada 10% 14% 36% 10% 0% 1% 29% 139 8.3
GENDER
Male 5% 17% 27% 13% 4% 3% 30% 1124 2.9
Female 9% 19% 26% 11% 3% 2% 30% 1076 3.0
AGE
<25 4% 26% 23% 11% 3% 1% 32% 112 9.3
25-44 8% 19% 24% 15% 6% 3% 26% 628 3.9
45-64 7% 18% 29% 10% 3% 2% 30% 960 3.2
65+ 6% 12% 29% 11% 2% 1% 38% 500 4.4
EDUCATION
High school or less 7% 14% 24% 9% 5% 3% 39% 593 4.0
College or CEGEP 8% 18% 24% 12% 4% 3% 30% 723 3.6
University or higher 6% 21% 30% 15% 3% 1% 24% 884 3.3
VOTE INTENTION
Conservative Party of Canada 0% 22% 21% 10% 2% 3% 43% 756 3.6
Liberal Party of Canada 12% 0% 52% 16% 2% 1% 17% 495 4.4
NDP 12% 41% 0% 21% 9% 1% 15% 376 5.1
Green Party 9% 18% 40% 0% 7% 3% 23% 152 8.0
Bloc Quebecois 9% 14% 44% 9% 0% 1% 22% 215 6.7
Undecided 21% 7% 27% 22% 6% 0% 16% 25 19.6
Copyright 2011. No reproduction without permission. Page 17
Methodology: EKOS’ weekly tracking polls are conducted using Interactive Voice Response (IVR) technology, which allows respondents to enter their preferences by punching the keypad on their phone, rather than telling them to an operator. In an effort to reduce the coverage bias of landline only RDD, we created a dual landline/cell phone RDD sampling frame for this research. As a result, we are able to reach those with a landline and cell phone, as well as cell phone only households and landline only households. This dual frame yields a near perfect unweighted distribution on age group and gender, something almost never seen with traditional landline RDD sample or interviewer-administered surveys. The field dates for this survey are April 15-17, 2011. In total, a random sample of 2,246 Canadians aged 18 and over responded to the survey (including a sub-sample of 2,019 decided voters). The margin of error associated with the total sample is +/-2.1 percentage points, 19 times out of 20. Please note that the margin of error increases when the results are sub-divided (i.e., error margins for sub-groups such as region, sex, age, education). All the data have been statistically weighted to ensure the samples composition reflects that of the actual population of Canada according to Census data.